Article

Advanced Assessment of Biomass Materials Degradation in Pneumatic Conveying Systems: Challenges and Applications

1
The Wolfson Centre for Bulk Solids Handling Technology, Faculty of Engineering and Science, University of Greenwich, Central Avenue, Chatham ME4 4TB, UK
2
Schenck Process UK Limited, Shaw Lane Industrial Estate, Ogden Road, Doncaster DN2 4SQ, UK
*
Author to whom correspondence should be addressed.
Appl. Sci. 2023, 13(3), 1960; https://doi.org/10.3390/app13031960
Submission received: 11 January 2023 / Revised: 27 January 2023 / Accepted: 30 January 2023 / Published: 2 February 2023
(This article belongs to the Special Issue Sustainable Biomass Energy: Recent Technologies and Applications)

Abstract

:

Featured Application

Particle degradation of biomass materials can be a severe issue in transportation and material handling because of dust generated. Especially for pneumatic conveying systems, assessment of material degradation in such a large process can be challenging.

Abstract

In this study, the degradation of wood pellets and dry roasted coffee beans in a pneumatic conveyor was evaluated for high-speed impacts. The change in particle size and generation of fine particles were used as an indicating parameter for the degradation. A four-bends industrial scale conveying system was used for the degradation study in lean phase pneumatic conveying. The effects of operating parameters on the degradation were investigated, including the conveying velocity of particles and particle concentration. The experimental results showed that the degradation and the fines generation increased with an increase in particle velocity. An opposite trend was observed with an increased solid concentration in the pipeline. It was found that the two types of wood pellets traveled at different particle velocities with the same operating conditions, which resulted in significant differences in the degradation. Compared to the wood pellets, roasted coffee beans were found to travel at air velocity. In conclusion, the degradation in a pneumatic conveying system is complex and challenging to evaluate because there are many influential factors, such as the type of materials, equipment, and operation conditions. Early assessments in a laboratory will be beneficial to evaluate the degradation at all controlled operative conditions.

1. Introduction

Wood pellets are solid biofuels made up of compacted waste wood or virgin wood and are an alternative fuel to fossil fuels for heat and power generation. The densified wood pellets often degrade during various handling processes in industrial practice along the whole supply chain of the pellet fuel from manufacturers to end users. Pellet degradation is a function of impact force due to drop height, the elasticity of the impact surface, and the number of impacts during different handling processes [1,2]. More handling steps results in more unwanted fines and dusts that can affect operations and cause health issues [3]. Frequent exposure to pellet dust emissions due to incomplete combustion when burning fines can cause severe lung infections and cardiovascular disease [4].
Pneumatic conveying is a method for transporting bulk materials through an enclosed pipeline in the processing industry by using air as the transport medium. Pneumatic conveying is popular because of its attractive benefits. The main advantage is material protection from environmental effects because of an enclosed pipeline, such as keeping product hygienic and moisture-free, avoiding dust emissions, dust cleaning, and dust explosions, and flexibility in routing the pipeline along walls in horizontal and vertical directions by introducing bends. The main disadvantages of this method are particle degradation, high power consumption, and possibly erosive wear of the bends [5,6].
Most product deterioration that occurs during pneumatic conveying is undesired. Hence precautions must be taken to minimize particle degradation. The dust generation and degradation depend on material properties, and to avoid industrial explosions, many materials are listed in the dangerous list regulated by the health and safety executive UK under DSEAR (Dangerous substances and explosive atmospheres regulations) [7,8,9,10], and care should be taken while handling such materials. The degradation of particles due to high-speed impacts in pipe bends changes the particle size distribution of the material, which alters the material flow behavior. In addition to the degradation due to impact on the bending surface, the particles also degrade due to abrasion as a result of particle-wall or particle-particle interactions during conveying, feeding mechanisms, and high-speed impact during the transfer of material from the pipeline to the receiving hopper.
The impact velocity, impact angle, solids concentration, and material properties of particles, such as hardness, roughness, moisture contents, and impact surface materials, are the main factors affecting the degradation [11]. Previously published research indicated that product degradation or attrition increases with an increase in impact velocity, impact angle, and surface roughness of the material, whereas it decreases with increased solids loading ratio (ratio of solids mass flow rate to air mass flow rate) and hardness of the material [12,13]. The increased solid loading ratio provides particle shielding, which reduces the impact possibility when particles move in a bed [14,15,16,17]. No researcher has directly measured the particle velocity of bulk pellets before impacts in pipeline bends, although some researchers have measured the particle velocity of an individual or few particles with high-speed cameras [14,15,18,19,20,21,22], and those who have tested pellets used only a small section of straight pipe where full acceleration was not achieved. It shows at least 8 m pipe length is required for full particle acceleration [23,24].
Some researchers studied the strength of individual wood pellets and found that different types of pellets revealed varying strengths and that the pellets from the same type or source also revealed different outcomes [25,26,27]. Some researchers studied the degradation of pellets during storage under different environmental conditions and found that pellet surface and structure were damaged during storage by picking up moisture [25,28,29]. It can be anticipated that the self-degradation of pellets happens because of environmental factors during pellet storage across different time periods and exposure to the relative humidity level. It has been observed that no assessment has been performed for the degradation of stored pellets and fresh pellets during pneumatic conveying.
An assessment of biomass material” degradation in pneumatic conveying systems is necessary for dust control and system design. However, degradation in a pneumatic conveying system is complex and challenging to evaluate because of factors such as the type of biomass materials, equipment design, and operation conditions. This study demonstrates the complexity of the degradation of biomass materials in pneumatic conveyors by conducting a study of the degradation behavior of wood pellets and roasted coffee beans against impacts in pipeline bends at the same operating conditions in a designed pneumatic conveyor. The finding of this study shows that particle velocity during impact at bends is the most influential factor in the degradation during pneumatic conveying, and it depends on various factors, i.e., air velocity, bulk and suspension density of solids, the shape of the materials, etc. Early degradation assessments in a laboratory will benefit from simulating all different impact conditions and evaluating the degradation under controlled conditions.

2. Materials and Methods

2.1. Test Materials

Two types of biomass materials were used for the evaluation study of degradation: wood pellets and coffee beans (see Figure 1). The wood pellets were virgin pine wood pellets (aged and fresh wood pellets). The aged wood pellets were received in a woven polypropylene bulk bag and stored inside for five years at room condition before tests. The fresh wood pellets were packed in bags (received in 15 kg plastic sealed bags from European Pellet Council (EPC) certified pellet supplier in the UK). The wood pellets were cylindrical in shape with a diameter of 6 mm and a length between 3.15–40 mm. Both pellets were ENPlus A1 grade [21]. Dry roasted coffee beans from Caffe Roma, which have an elliptical shape and about 12 × 8 × 5 mm3. The moisture contents of the wood pellets and the dry roasted coffee beans were measured using an Ohaus moisture analyzer MB120 on a wet base. The bulk density was measured using a standard 5-liter measuring container. The mechanical durability was measured using ISO standard tumbling box tester. The properties of the wood pellets and the coffee beans can be found in Table 1.

2.2. Methods

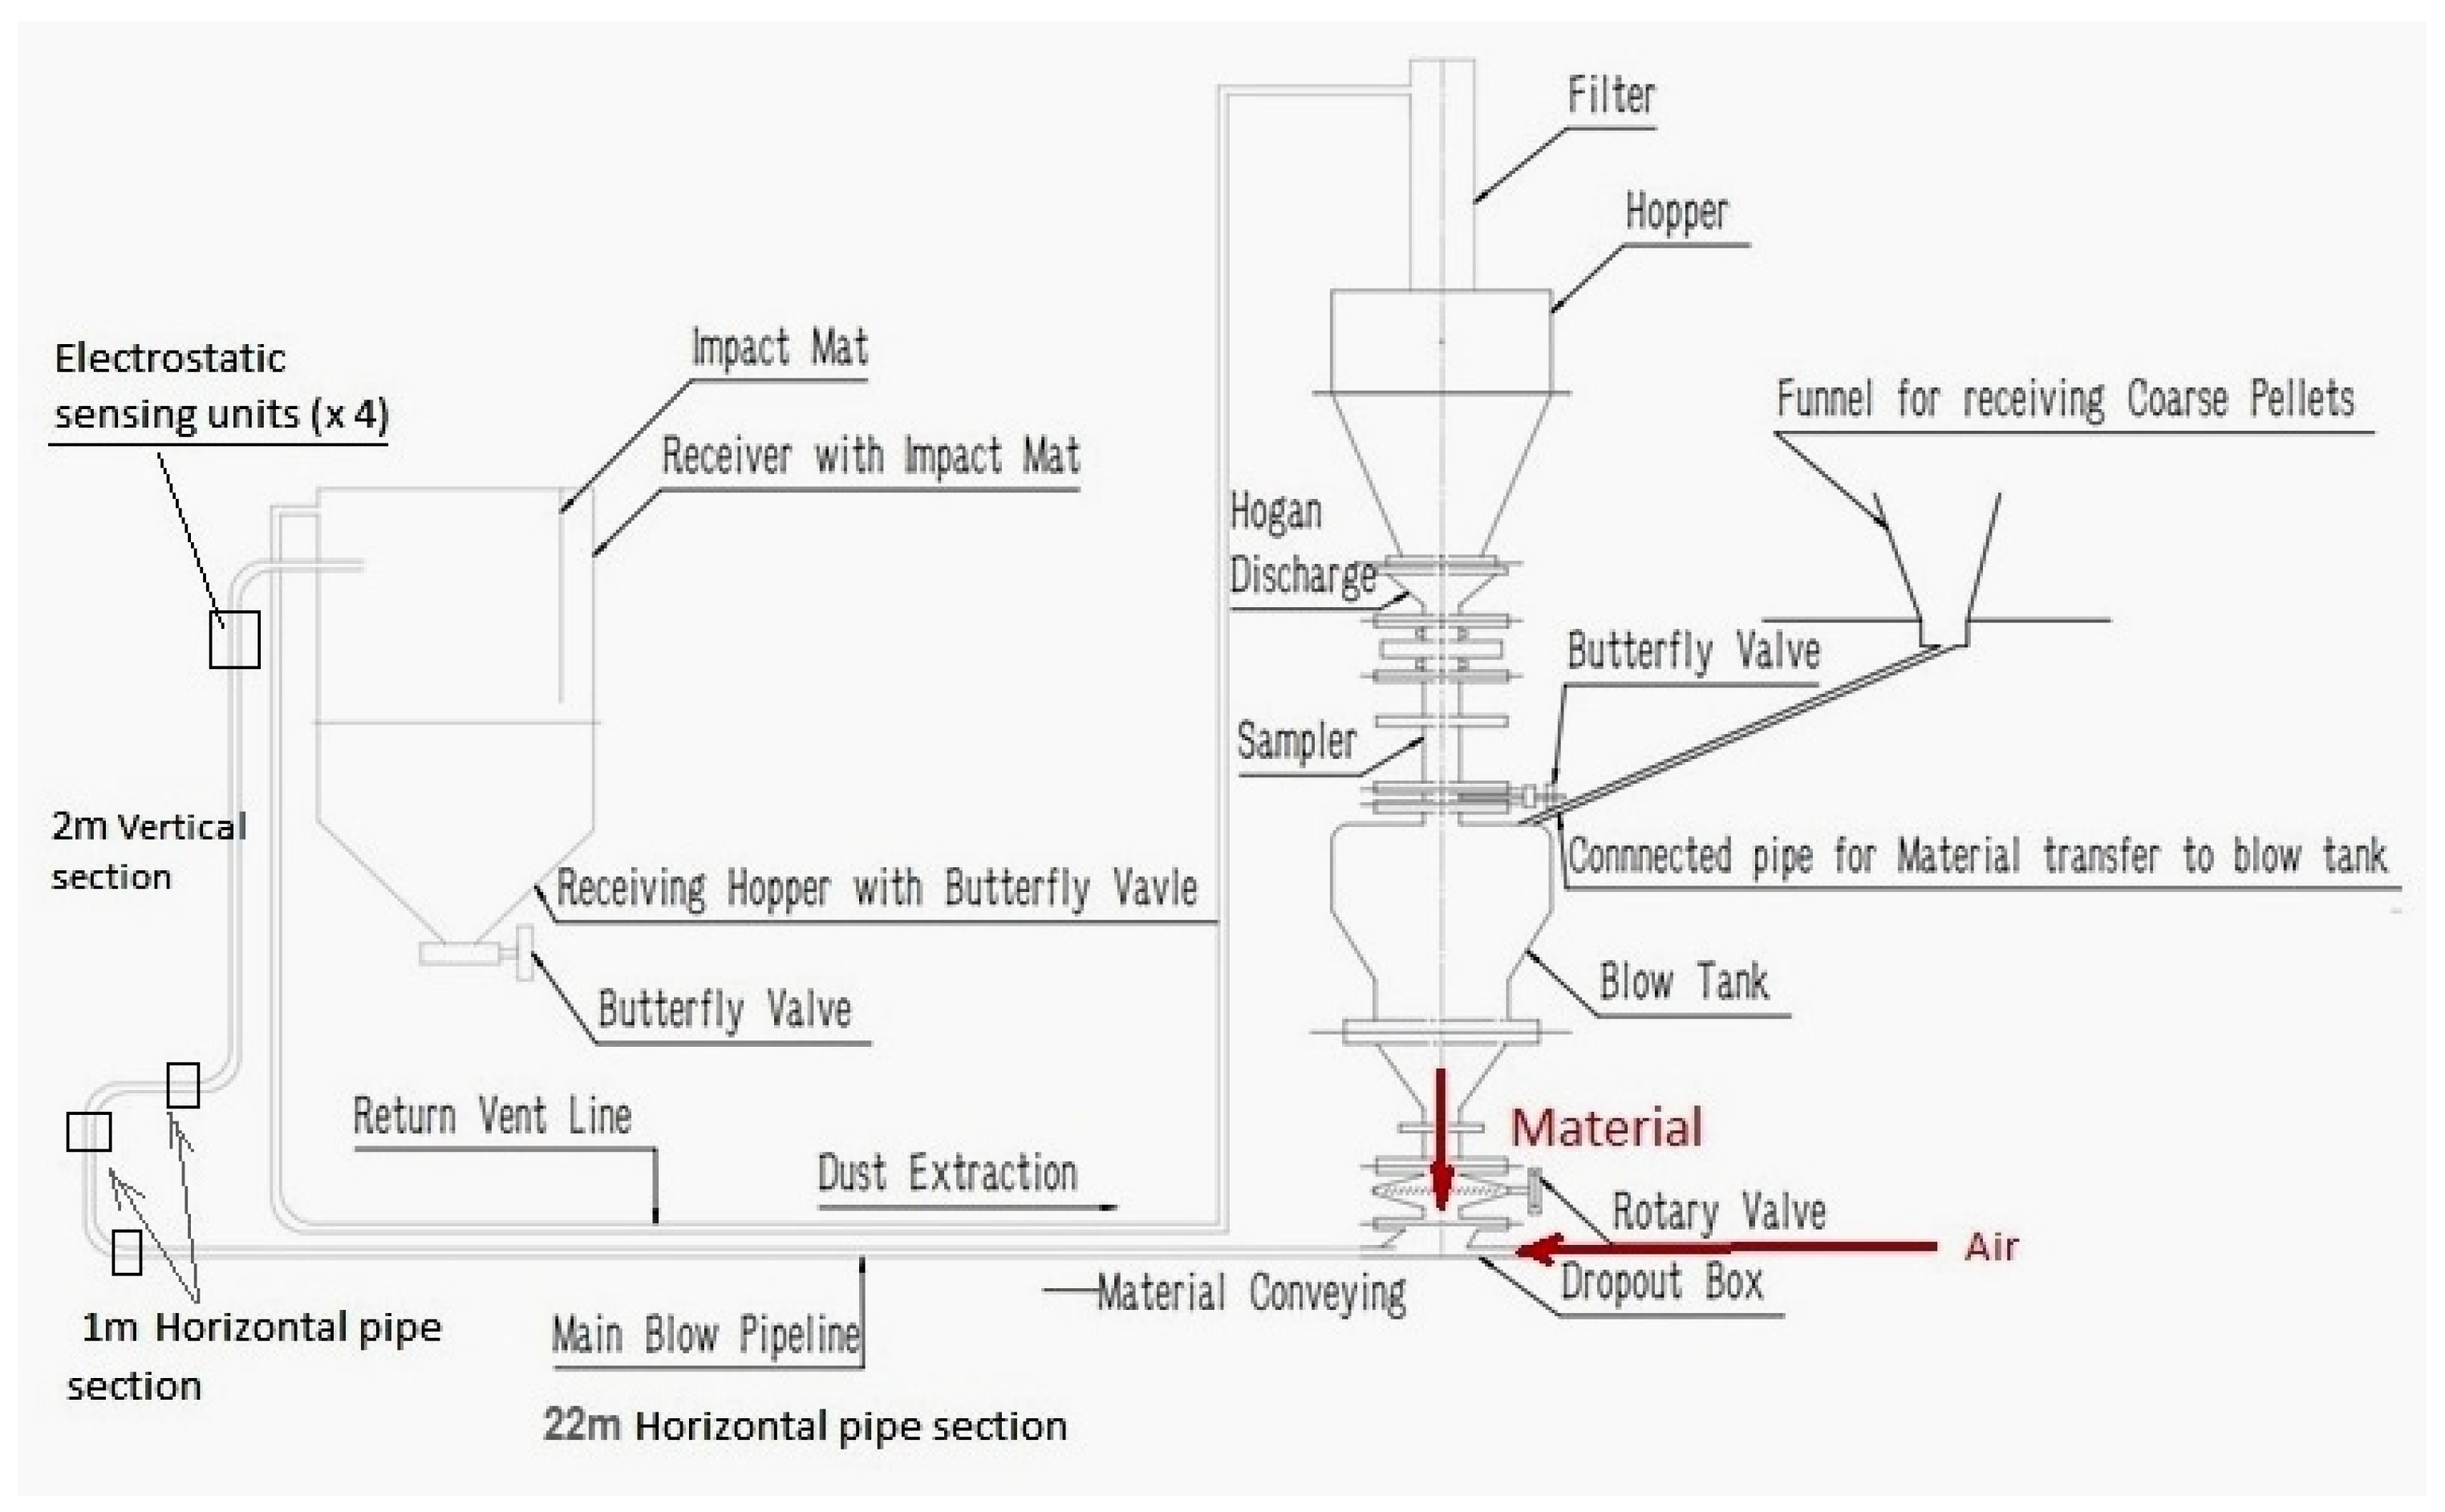
2.2.1. Pneumatic Conveying System

An industrial-scale pneumatic conveying test rig has been used for the experimental study, as shown in Figure 2. A pipeline route for conveying material has been designed as per the EPC guidelines [22]. The pipe route was designed with four short radius bends (R/D = 3), and the maximum length of the pipeline was kept under 30 m for simulating the pellet transfer mechanism for domestic applications where pellet transfer takes place from pressurized delivery vehicles to household pellet stores. The first bend was introduced at 22 m from the feeding section. The second and third bends were used to connect only a small straight pipe section of one meter with the embedded electrostatic sensing unit. The fourth bend was installed at a two-meter vertical distance after the 3rd bend.
The first two bends connected horizontal to horizontal pipe sections, the third bend joined horizontally to vertical pipe sections, whereas the fourth bend was used to connect the vertical section to a little horizontal section at the end of the pipeline. The pipeline route is illustrated in Figure 2.
The bends were installed at the end of the pipeline in proximity to simulate the domestic pellet delivery system. The pellet receiver was designed as per EPC storage guidelines [30], and the impact mat was installed inside it to cushion the impact of pellets at the end transfer point.

2.2.2. Particle Velocity Measurement

The particle velocity was measured using arc-shaped electrostatic sensors developed at the Wolfson Centre [31]. The sensors work on the principle of detecting electrostatic charge signals from the charged moving particles passing through two sensors with a fixed distance (125 mm) and then calculate the particle velocity by the time delay using cross-correlation of the signals. The particle velocity of the bulk material was detected by taking 1000 times to cross-correlations in one second at a sample rate of 10,000/s. The average particle velocity was measured every second at the entrance of each bend.

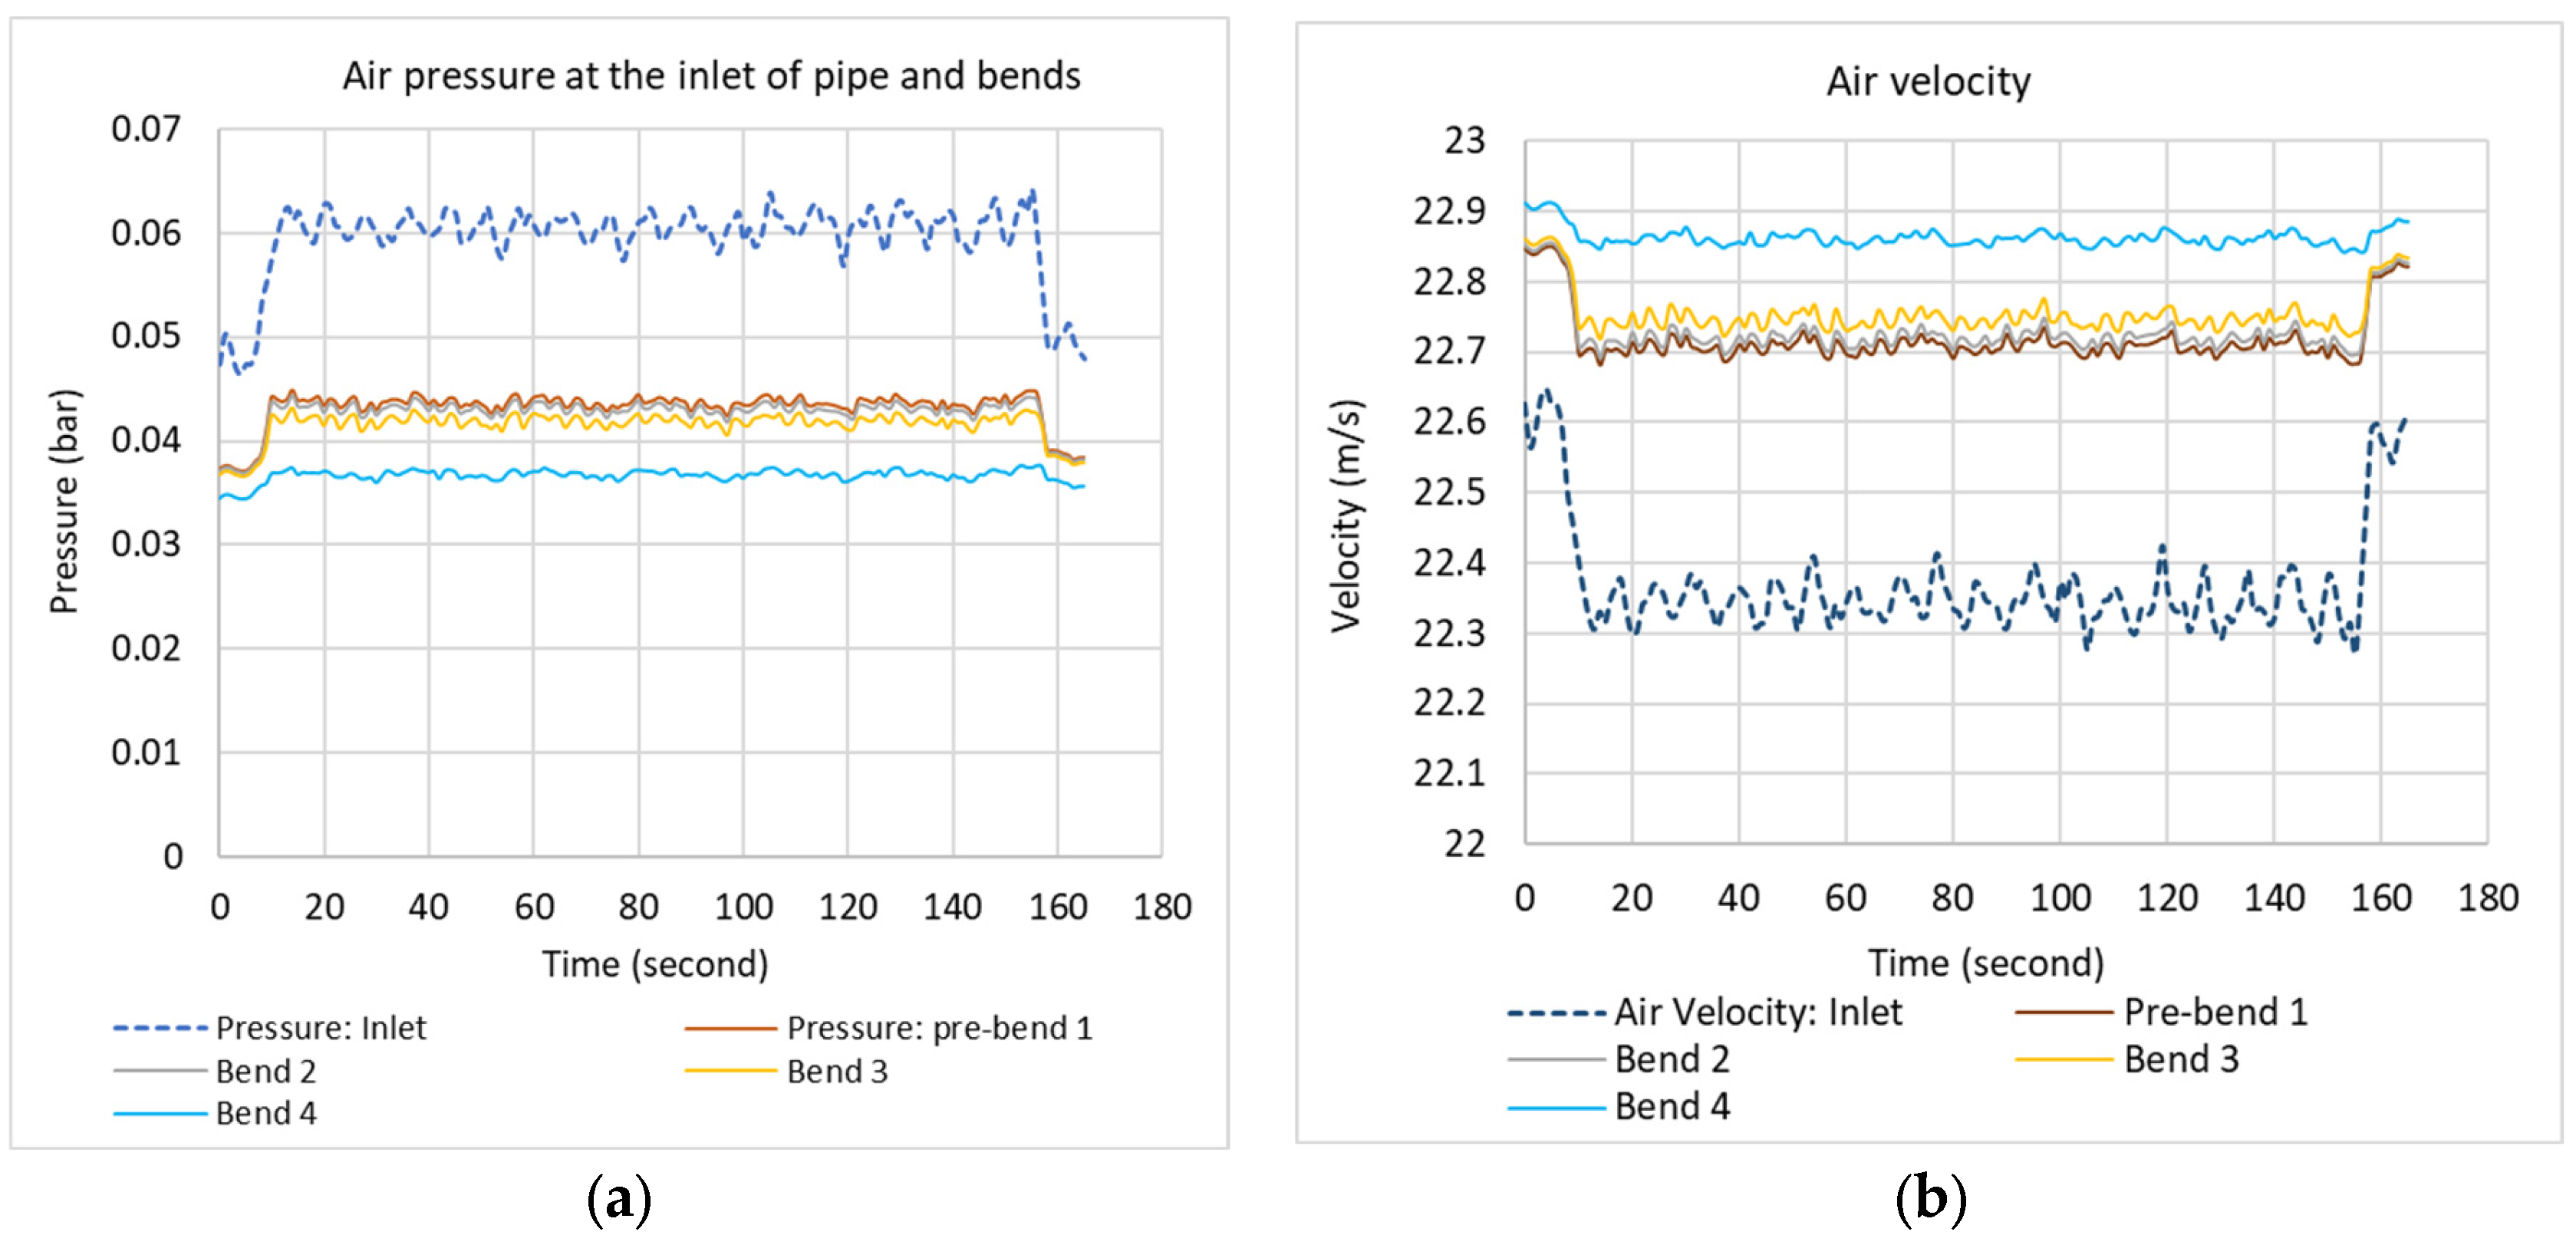
2.2.3. Air Pressure Sensors and Load Cells

The localized air velocity at the sensing points, which helps to monitor the difference between air velocity and particle velocity (slip velocity). Druck differential pressure sensors ‘UNIK 5000’ (Leicester, UK) with a maximum reading capacity of 5 bar were used for the pressure measurements. The load sensors were calibrated by interfacing sensors with the National Instruments DAQ system. The load was added to the loading bar and on the side supports of the hopper carrying stand. The S-type Tension/compression load cells with the following specifications shown in Table 2 were procured for the purposes of weighing the receiving hopper.

2.3. Sample Preparation and Operating Conditions

Samples were prepared with Rotex industrial screener having 4.75 mm and 3.15 mm square hole sieves. Prepared and cleaned pellets retained by a 4.75 mm sieve of approximately 40 kg of sample size were poured directly into the feeding hopper. The pellets were then fed through the rotary valve to the pipeline and delivered to the receiving hopper by positive pressure lean phase pneumatic conveying method. The solid feed rate was altered with rotary valve speed, and the air mass flow rate was altered with the combinations of nozzles interfacing compressor for the supply of prime motive air. Three solid flow rates of approximately 0.2, 0.4, and 0.8 kg/s were tested under the effect of three air mass flow rates of 0.24, 0.27, and 0.3 kg/s, respectively. Two experiments were conducted for both pellets at each operating condition.
The pellets were collected after experiments from the receiving hopper, and the entire batch was analyzed using the Rotex screener. The pellets retained by the 4.75 mm were considered clean pellets and sent back to the feeding hopper for a second consecutive run prior to the pellets being disposed of. The fines that passed through the 3.15 mm round hole sieve and the average particle size distribution after two consecutive runs were noted.
Degradation of wood pellets is generally measured as Mechanical durability (DU) as per ISO 17831-1 at bench scale [32,33]. It is the percentage weight of the pre-sieved pellet that survived or was retained by a 3.15 mm round hole after impact testing in a durability tester. Durability can be found by the equation given below:
DU   =   M M o   ×   100 ( % ) ,
where DU is durability, M is the mass of pellets retained by the 3.15 mm round hole sieve after impact, and Mo is the mass of pre-sieved clean pellets before testing.
Mechanical durability depends upon various mechanical, physical, and chemical properties of pellets, such as surface cracks, moisture content, pellet length, raw material properties, pipeline features, particle velocity, impact load, and receiver type. There are two durability testers recognized by European Pellet Council as:
  • ISO standard Tumbling box durability tester
  • Ligno durability Tester
The durability of the pellets and the coffee beans in this study was tested by the ISO standard tumbling box tester, as shown in Table 1. In the test, 500 g of clean, prepared sample was tumbled for 10 min at a constant speed of 50 rpm. The retained mass above 3.15 mm was measured, and the durability was calculated as per Equation (1).

3. Results

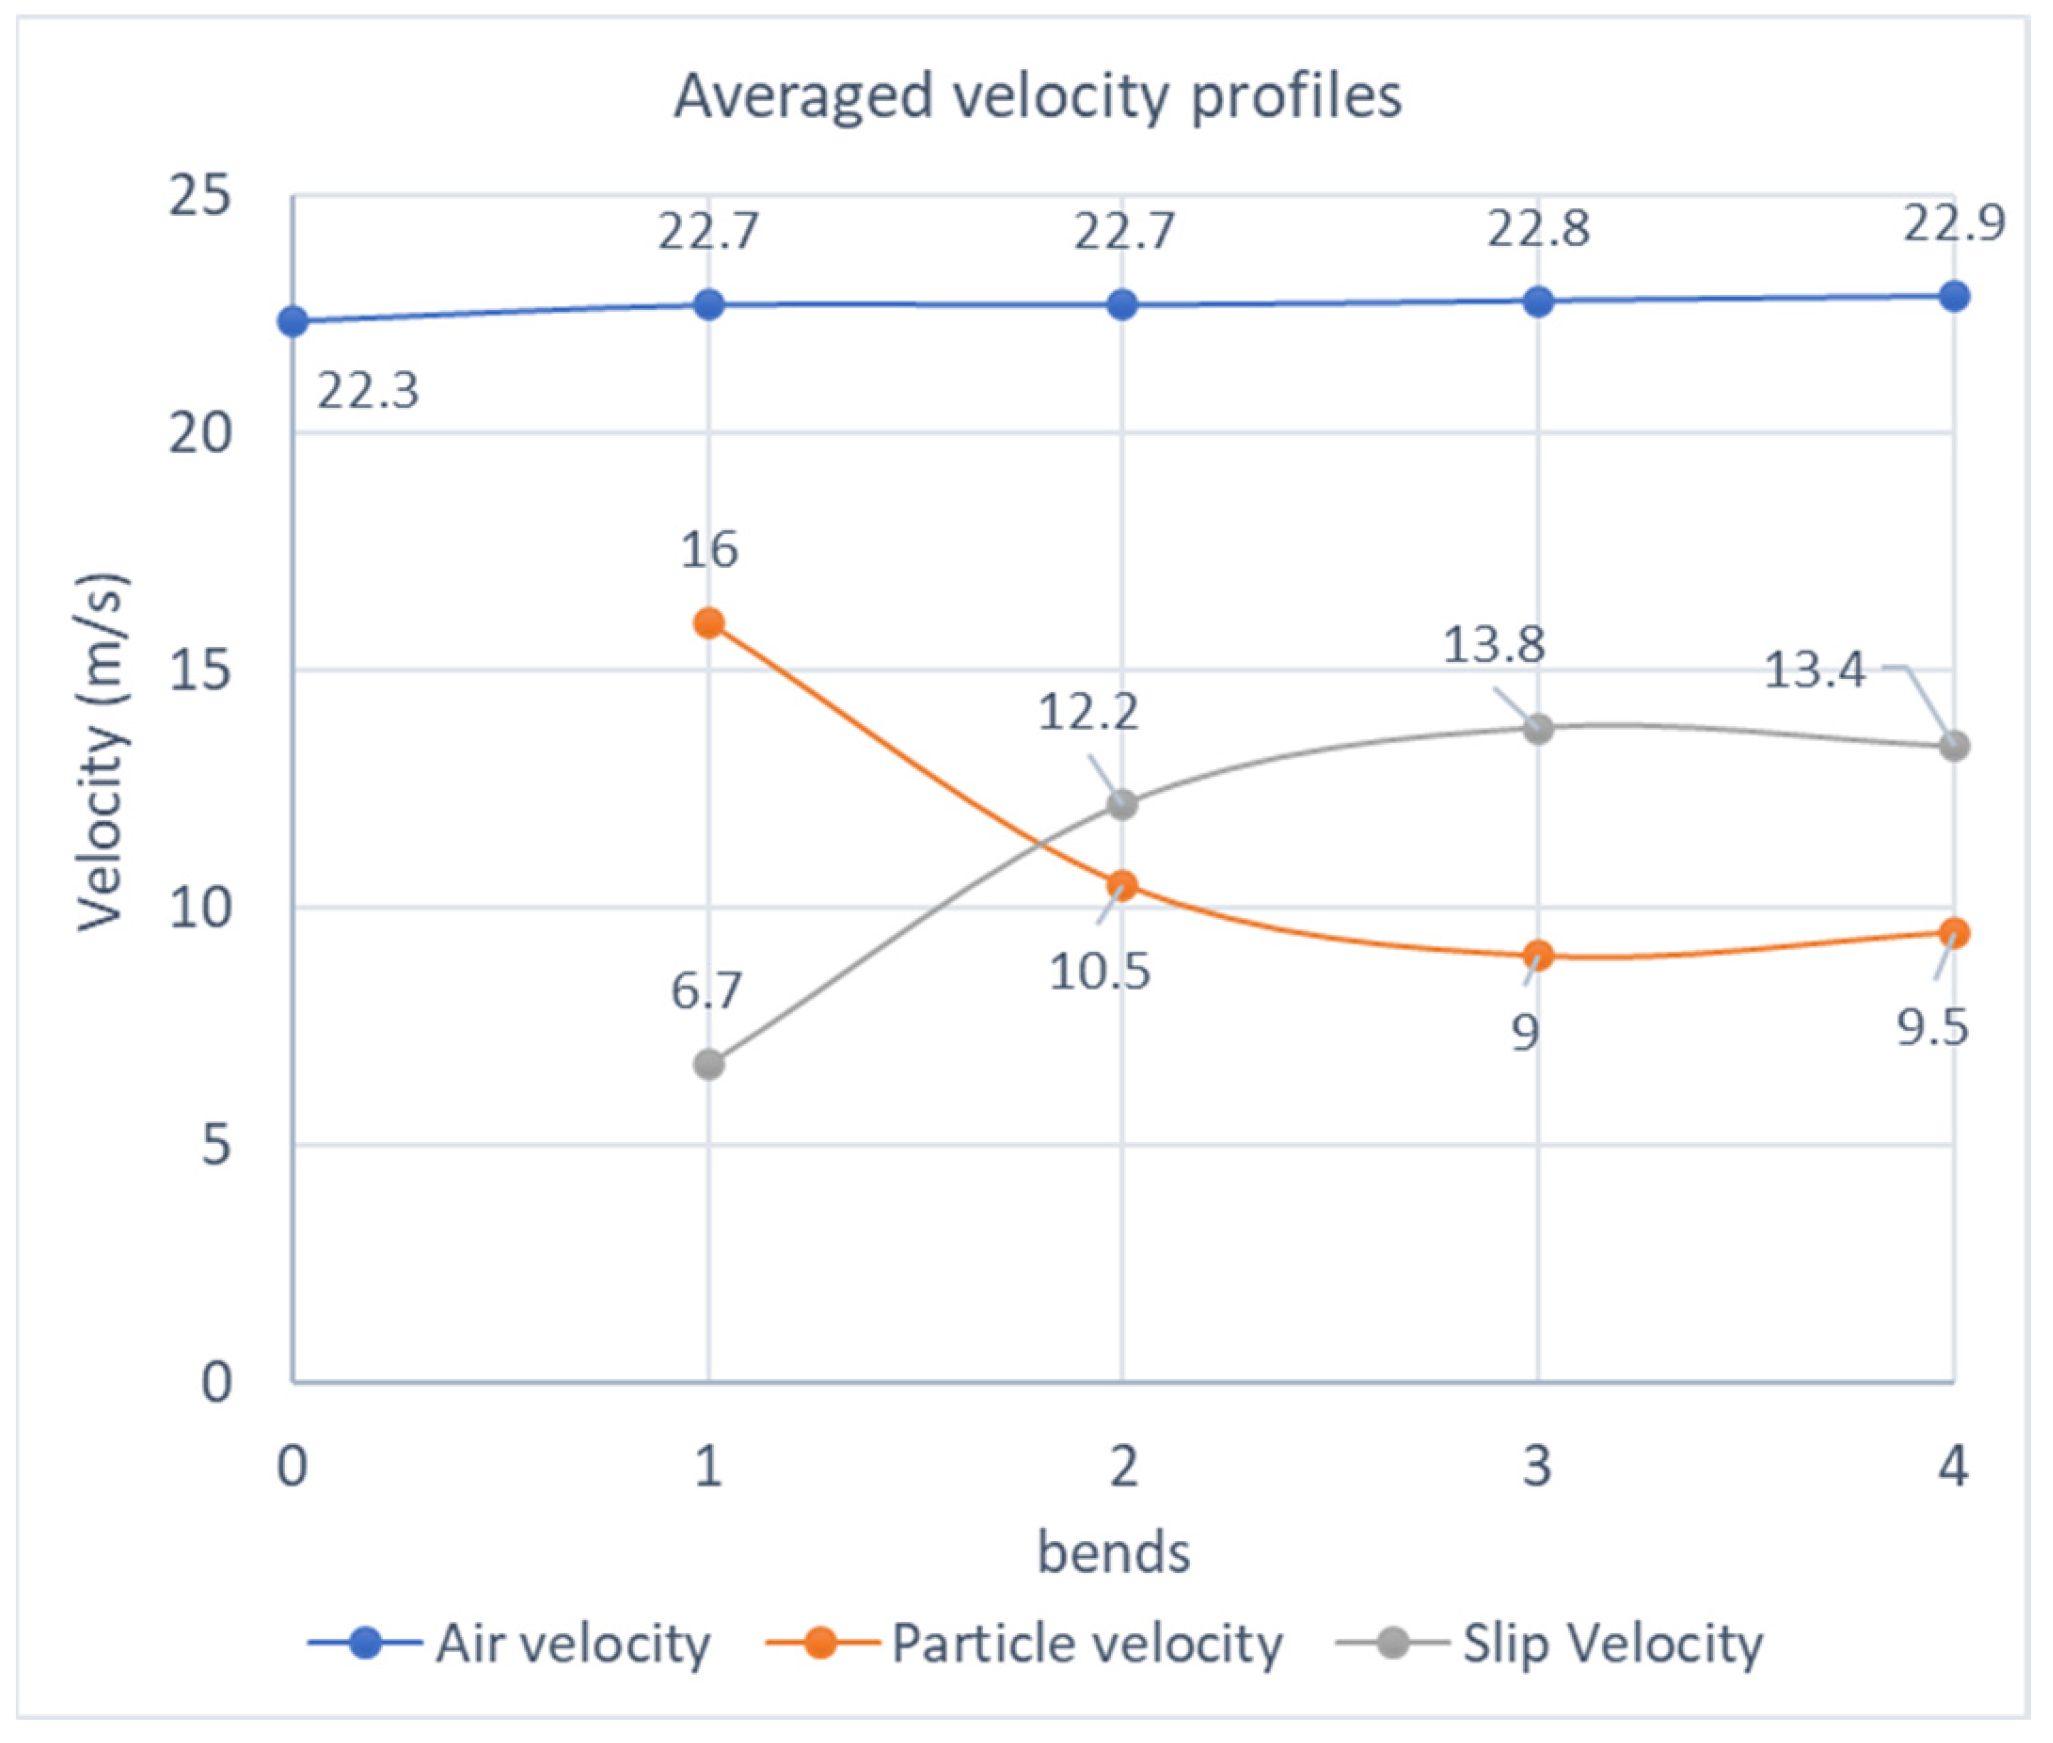
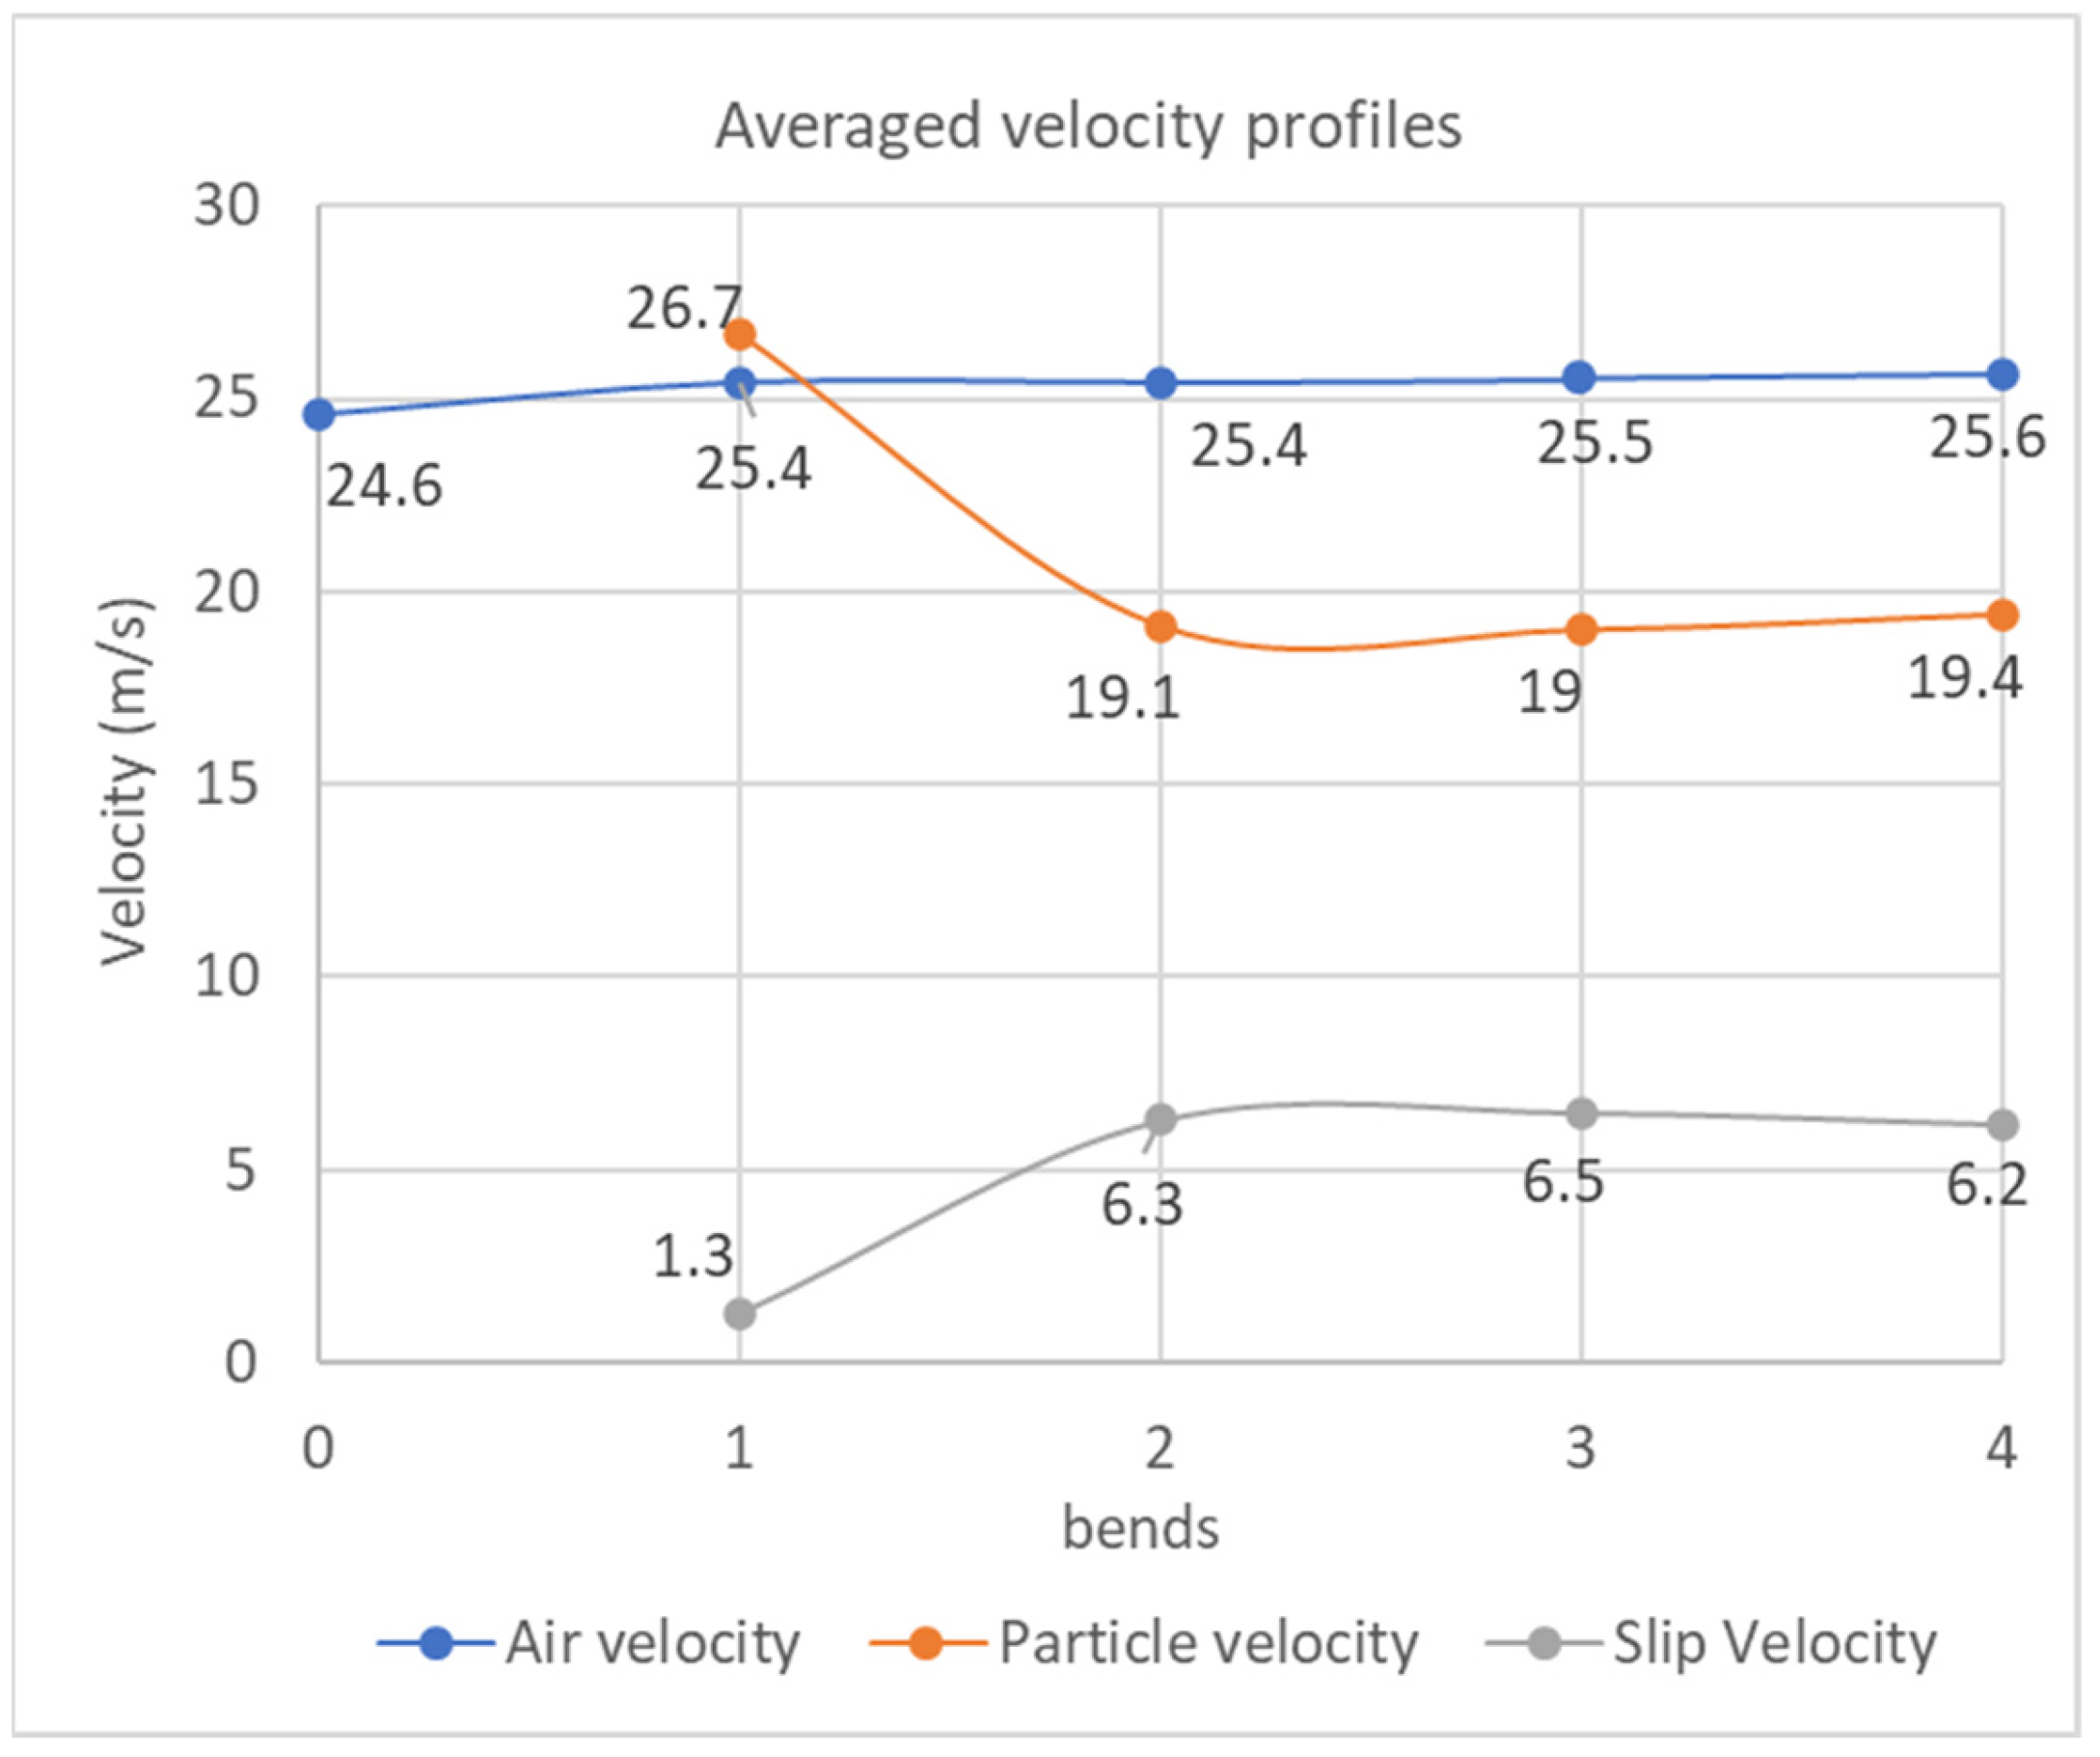
3.1. Measurements of Particle Velocity, Feed Rate, and Air Velocity

The measurements of particle velocity and solid feed rate are shown in Figure 3, and the air pressure and the air velocity are shown in Figure 4 for fresh wood pellets at the operating condition of air mass flow rate of 0.24 kg/s and solid flow rate of 0.20 kg/s.
The averaged air velocity, particle velocity, and corresponding slip velocity (difference between particle velocity and air velocity at sensing locations) are shown in Figure 5 as an example for one test condition. The velocity at the ‘zero’ on the x-axis indicates the air velocity at the inlet of the pipeline. The air and the particle velocities are the velocities before each bend.

3.2. Degradation of Fresh Bagged Wood Pellets

For the fresh wood pellets, the particle velocities just before each bend for three air flow rates and solid flow rates are presented in Table 3. These velocities are the impact velocity of the particles.
For the fresh wood pellets, change in particle size distribution and generation of fines by the impact were studied for the conditions as shown in Table 3. In this study, a continuous change in particle size distribution and fines generation (<3.15 mm) at the end of conveying was observed, and the results are shown in Table 4, Table 5 and Table 6.
The results show that the degradation decreases with an increase in solid feed rate or particle concentration in the pipe. About 10–15% of fines were reduced by increasing the solid flow rate from 0.2 to 0.4 kg/s for all air flow rates, whereas the fines level lowered by 30% when the solid flow rate increased from 0.2 to 0.8 kg/s for an air flow rate of 0.24 and 0.27 kg/s as shown in Table 4 and Table 5. The fines content was reduced by 22% (Table 6) with a 0.3 kg/s air flow rate.

3.3. Degradation of Aged Bulk Bag Wood Pellets

The particle velocities at each bend for aged wood pellets were measured and are shown in Table 7. It is observed that the aged pellets were found to travel at a slightly lower velocity (around 10%) as compared to the fresh bagged pellets for the same operating conditions. The acceleration length during the layout of the current study is 22 m which means both types of pellets should have the same particle velocity at low solids feeding rate. However, the velocity profiles for aged pellets in Table 7 show that there is a decrease in pellet velocity even at a low feed rate compared to fresh pellets shown in Table 3.
These results illustrate that the resistance offered by pellet-wall interaction at the bottom section due to higher frictional forces in aged pellets as compared to fresh pellets because most of the pellets travel at the bottom section of the pipe, which was observed visually through a transparent section of pipe in the pipeline. So, wood pellets or any other high-density particulate material, when it travels in a lean phase along the bottom of the pipe section, will experience this resistance based on surface properties. The effect of frictional forces was not studied in this project.
For the aged wood pellets, the degradation results are shown in Table 8, Table 9 and Table 10. The results show that the fines generation is approximately 3.5 times higher than the fresh pellets when compared to the results at 0.8 kg/s solid flow rate for all air flow rates and 3.8 times higher at the other two mass flow rates during all operating set operating conditions. The degradation was the highest among the low feed rate and high air flow combinations and was found to be lowest for the high solid feed rate and low air mass flow rate.
It was observed that the highest fines generation was 3.74% by weight for aged pellets and 0.96% by weight for fresh pellets, whereas the lowest fines were observed as 1.32%-w and 0.38%-w for the aged and fresh pellets, respectively, among all feed rates and flow rates tested.
The aged pellets were found to travel at a slightly lower velocity (around 10%) when compared to the fresh pellets, whereas degradation of the aged pellets was noticed higher, and it gets reduced in a similar manner, 10–12% during changing feed rate from 0.2–0.4 kg/s and approximately 30% during a change from 0.2 to 0.8 kg/s at all operating conditions.

3.4. Degradation of Roasted Coffee Beans

The roasted coffee beans have a low bulk density and are found to travel approximately at air velocity (see Figure 6). The experiment was conducted at 0.27 kg/s air mass flow rate and 0.2 kg/s solid flow rate only. The coffee beans approach the air velocity just before the first bend, which shows that there is a substantial difference in flow behavior. It can be anticipated that the drag force on light weighted coffee beans is lower than on wood pellets, and coffee beans can be easily suspended or could be fully suspended in the pipeline rather than traveling at the bottom of the pipe. The degradation of the coffee bean was measured and shown in Table 11. The particle size distribution after the impact of coffee beans shows a severe breakage of particles in the top two sizes as compared to wood pellets at the same operating condition. The fines generation (<3.15 mm) was considered very high for coffee beans as compared to the fresh and the aged pellets; 11.64% of the total weight degraded for coffee beans as compared to 0.74%-w and 2.73%-w for the fresh and the aged pellets, respectively.

4. Discussion

4.1. Particle Velocity and Impact Degradation

It has been recognized that particle impact velocity, impact angle, and particle concentrations are key factors in particle impact degradation [10]. Particle impact velocities at the conveying bends in a pneumatic conveyor can be significantly different in terms of the type of materials conveyed and the operating conditions used. In this study, two case studies show that the same materials (wood pellets) can have different degradation at the same operation conditions because of different moisture contents and surface properties. For different materials (wood pellets and coffee beans), the same operating conditions give a significantly different particle acceleration in the pipeline and, alternatively, different particle impact velocities.
Previously in most cases, air velocities at the bends were used for the estimated impact velocity of the particles. This study shows that a slip velocity (difference between the particle velocity and the air velocity) can be as big as the particle velocity if the bends are not evenly distributed or if the particles are not allowed to fully accelerate (wood pellets). Even for a lighter material (coffee beans), the slip velocity was found to be significant in such pipe settings, whereas coffee beans traveled at air velocity when fully accelerated. Using the air velocities (either measured or calculated) for evaluation of the degradation results in a significant overestimate of impact velocity. It reveals that measurements of particle velocities in pneumatic conveyors can be important if it is feasible, and we can predict how it changes with changing solid flow rate and pipe layout.
In pneumatic conveying, particle concentration has little effect on the degradation of the solid particles. The study shows that a higher concentration of solids expects a lower level of degradation. The trend in wood pellets degradation was clear. However, compared to particle impact velocity, the effect of particle concentration is not significant.

4.2. Challenges in Assessing the Degradation

The main challenge in assessing particle degradation for pneumatic conveyors is the measurement of particle velocity of the bulk material in transit, such as inside of the bends, and the effects of changing operative parameters on the particle velocity, which is the main influential factor on material degradation due to high-speed impacts. This study has identified the assessment technique to measure the particle velocities and the degradation by altering operating conditions and pipeline features, which simulate the pellet delivery mechanisms adopted in industrial practice. It has been observed that there are discrepancies in the same two types of biomass materials (wood pellets) used for sustainable energy generation and therefore handling characteristics of such biomass materials in the same pneumatic conveying system. The difference in the handling characteristics results in a different level of particle degradation. The same challenge is coming to the types of biomass materials. Under the same operation, the degradation levels of the materials are not comparable. For such a large process, degradation of the material is not easily evaluated unless there is a fast approach to measuring the degradation at a controlled concentration for all scenarios. Furthermore, degradation assessment for a pneumatic conveying system must be modeled in a way that integrates the factorial tests for individual test conditions into a prediction for the system, as multiple bends are involved in the system.
Therefore, assessment of biomass materials degradation in pneumatic conveying systems is only feasible in conducting a series of advanced assessments at a laboratory scale with a small number of test samples for all operative conditions. The test conditions must be representable to the impact conditions in the pneumatic conveying system at every single bend for the proposed or existing pneumatic conveying system. The laboratory assessment can become a dedicated tool and be used for industrial applications. Taking the challenges of the degradation assessment for a pneumatic conveyor, an accurate evaluation using a laboratory measurement will be subject to accurate impact conditions in the process, which need to be measured in advance.

5. Conclusions

For the study, some conclusions have been summarized as follows:
  • Assessing the degradation of bulk biomass materials in pneumatic conveyors can be challenging because the particle velocity in pipe bends can be significantly different, subject to the type of the materials.
  • The degradation level of solid particles increases with an increased particle velocity in pneumatic conveyors because of an increased air mass flow rate. Degradation of the materials can decrease with an increased solid feed rate or particle concentration in the pipeline.
  • Degradation of wood pellets shows that the degradation can be different at the same operation conditions because different moisture contents and surface properties of the material lead to different particle accelerations. The degradation in a pneumatic conveying pipeline is sensitive to particle impact velocity, although particle concentration has little influence.
  • Degradation of dry roasted coffee beans shows a significantly different level at an identical operation condition. It is believed that the conveying characteristics of coffee beans must be different from the wood pellets, which may be due to a low bulk density.
  • The study shows the degradation of biomass materials in a pneumatic conveyor strongly depends upon the particle velocities, which can be subject to the conveying characteristics of the material.
  • If an assessment is required to evaluate the degradation in pneumatic conveyors, it is hard to take the assessment on an industrial scale equipment. A laboratory scale test can be a solution for advanced degradation assessments in pneumatic conveying systems. However, impact conditions such as particle velocities can be critical for an accurate evaluation, which needs to be determined in advance.

Author Contributions

Conceptualization, T.D., M.S.A.B. and R.E.; methodology, T.D. and G.S.; validation, M.S.A.B. and R.E.; formal analysis, G.S.; investigation, G.S., M.S.A.B. and R.E.; data curation, G.S.; writing—original draft preparation, G.S. and T.D.; writing—review and editing, T.D., M.S.A.B. and R.E.; supervision, T.D., M.S.A.B. and R.E.; funding acquisition, M.S.A.B. and R.E. All authors have read and agreed to the published version of the manuscript.

Funding

This research was funded by Schenck Process UK and the Wolfson Centre for Bulk Solids Handling Technology, University of Greenwich, UK, for a Ph.D. study.

Data Availability Statement

Data was collected during PhD study and will be available in the form of PhD thesis.

Conflicts of Interest

The authors declare that they have no known competing financial interests or personal relationships that could have appeared to influence the work reported in this paper. Richard Ellis is an employee of Schenck Process UK, who provided funding and technical support for the work. The funder had no role in the design of the study, in the collection, analysis, or interpretation of data, in the writing of the manuscript, or in the decision to publish the results.

References

  1. Oveisi, E.; Lau, A.; Sokhansanj, S.; Lim, C.J.; Bi, X.; Larsson, S.; Melin, S. Breakage behavior of wood pellets due to free fall. Powder Technol. 2013, 235, 493–499. [Google Scholar] [CrossRef]
  2. Stelte, W. Guideline: Storage and Handling of Wood Pellets; Energy & Climate Centre for Renewable Energy and Transport Section for Biomass; Danish Technological Institute: Taastrup, Denmark, 2012. [Google Scholar]
  3. Moya, R.; Rodríguez-Zúñiga, A.; Tenorio, C.; Valdez, J.; Valaert, J. Pellets evaluation made from tropical-climate agricul-tural and forestry crops of Costa Rica with a domestic stove. Waste Biomass Valorization 2015, 6, 1037–1046. [Google Scholar] [CrossRef]
  4. Thomson, H.; Liddell, C. The suitability of wood pellet heating for domestic households: A review of literature. Renew. Sustain. Energy Rev. 2015, 42, 1362–1369. [Google Scholar] [CrossRef]
  5. Kraus, M.N. Pneumatic Conveying of Bulk Materials: Handbook; McGraw Hill: London, UK, 2017. [Google Scholar]
  6. Marcus, R.D.; Leung, L.S.; Klinzing, G.E.; Rizk, F. Pneumatic Conveying of Solids: A Theoretical and Practical Approach; Springer: Cham, Switzerland, 2010; Volume 8. [Google Scholar]
  7. Kalman, H. Attrition control by pneumatic conveying. Powder Technol. 1999, 104, 214–220. [Google Scholar] [CrossRef]
  8. DSEAR. The Dangerous Substances and Explosive Atmospheres Regulations 2002; Health and Safety Executive: Liverpool, UK, 2002. [Google Scholar]
  9. Bradley, M.S.A. Understanding and Controlling Attrition and Wear in Pneumatic Conveying; Technical Paper 5; SHAPA: York, UK, 2004. [Google Scholar]
  10. Mills, D. Pneumatic Conveying Design Guide, 2nd ed.; Butterworth-Heinemann: Oxford, UK, 2004. [Google Scholar]
  11. Kalman, H. Attrition of powders and granules at various bends during pneumatic conveying. Powder Technol. 2000, 112, 244–250. [Google Scholar] [CrossRef]
  12. Salman, A.; Hounslow, M.; Verba, A. Particle fragmentation in dilute phase pneumatic conveying. Powder Technol. 2002, 126, 109–115. [Google Scholar] [CrossRef]
  13. Deng, T.; Farnish, R.J.; Bradley, M.S.A. Evaluation of Particle Degradation Due to High-Speed Impacts in a Pneumatic Handling System. Part. Sci. Technol. 2008, 26, 438–450. [Google Scholar] [CrossRef]
  14. Abdulmumini, M.M. The Effect of Pellets Physical Properties on Handling Pelleted Biomass Material in Practical Use. Ph.D. Thesis, University of Greenwich, London, UK, 2017. [Google Scholar]
  15. Jägers, J.; Wirtz, S.; Scherer, V.; Behr, M. Experimental analysis of wood pellet degradation during pneumatic conveying processes. Powder Technol. 2020, 359, 282–291. [Google Scholar] [CrossRef]
  16. Alkassar, Y.; Agarwal, V.K.; Pandey, R.; Behera, N. Influence of particle attrition on erosive wear of bends in dilute phase pneumatic conveying. Wear 2020, 476, 203594. [Google Scholar] [CrossRef]
  17. Aarseth, K. Attrition of Feed Pellets during Pneumatic Conveying: The Influence of Velocity and Bend Radius. Biosyst. Eng. 2004, 89, 197–213. [Google Scholar] [CrossRef]
  18. Tripathi, N.M.; Santo, N.; Kalman, H.; Levy, A. Experimental analysis of particle velocity and acceleration in vertical dilute phase pneumatic conveying. Powder Technol. 2018, 330, 239–251. [Google Scholar] [CrossRef]
  19. Santo, N.; Portnikov, D.; Eshel, I.; Taranto, R.; Kalman, H. Experimental study on particle steady state velocity distribution in horizontal dilute phase pneumatic conveying. Chem. Eng. Sci. 2018, 187, 354–366. [Google Scholar] [CrossRef]
  20. Santo, N.; Portnikov, D.; Tripathi, N.M.; Kalman, H. Experimental study on the particle velocity development profile and acceleration length in horizontal dilute phase pneumatic conveying systems. Powder Technol. 2018, 339, 368–376. [Google Scholar] [CrossRef]
  21. Kalman, H.; Santo, N.; Tripathi, N.M. Particle velocity reduction in horizontal-horizontal bends of dilute phase pneumatic conveying. Powder Technol. 2019, 356, 808–817. [Google Scholar] [CrossRef]
  22. Santo, N.; Portnikov, D.; Kalman, H. Experimental study on particle velocity and acceleration length in pneumatic and hydraulic conveying systems. Powder Technol. 2020, 383, 1–10. [Google Scholar] [CrossRef]
  23. Bradley, M.S.A. Prediction of Pressure Losses in Pneumatic Conveying Pipelines. Ph.D. Thesis, Thames Polytechnic, London, UK, 1990. [Google Scholar]
  24. Bradley, M.S.A.; Farnish, R.J.; Hyder, L.M.; Reed, A.R. A Novel analytical model for the acceleration of particles following bends in pneumatic conveying systems. In Handbook of Conveying and Handling of Particulate Solids; Elsevier: Amsterdam, The Netherlands, 2001; pp. 411–423. [Google Scholar]
  25. Deng, T.; Alzahrani, A.M.; Bradley, M.S. Influences of environmental humidity on physical properties and attrition of wood pellets. Fuel Process. Technol. 2018, 185, 126–138. [Google Scholar] [CrossRef]
  26. Russell, A.; Larsson, S.; Shekhar, S.; Solomon, I.; Salehi, H.; Subirana, J.; Samuelsson, R. Deformation and breakage of biofuel wood pellets. Chem. Eng. Res. Des. 2020, 153, 419–426. [Google Scholar] [CrossRef]
  27. Gilvari, H.; de Jong, W.; Schott, D.L. Breakage behavior of biomass pellets: An experimental and numerical study. Comput. Part. Mech. 2020, 8, 1047–1060. [Google Scholar] [CrossRef]
  28. Graham, S.; Ogunfayo, I.; Hall, M.R.; Snape, C.; Quick, W.; Weatherstone, S.; Eastwick, C. Changes in mechanical properties of wood pellets during artificial degradation in a laboratory environment. Fuel Process. Technol. 2016, 148, 395–402. [Google Scholar] [CrossRef]
  29. Cutz, L.; Tiringer, U.; Gilvari, H.; Schott, D.; Mol, A.; de Jong, W. Microstructural degradation during the storage of biomass pellets. Commun. Mater. 2021, 2, 2. [Google Scholar] [CrossRef]
  30. European Pellet Council. EPC Storage Guidelines: ENplus Scheme; European Pellet Council: Brussels, Belgium, 2015. [Google Scholar]
  31. Kumar, A.; Deng, T.; Bradley, M.S. Application of arc-shaped electrostatic sensors for monitoring the flow behaviour at top and bottom section of a pneumatic conveying pipeline. Meas. Sens. 2020, 10–12, 100026. [Google Scholar] [CrossRef]
  32. European Pellet Council. ENplus Handbook. Quality Certification Scheme for Wood Pellets; European Pellet Council: Brussels, Belgium, 2015. [Google Scholar]
  33. ISO 17831–1:2015; Solid Biofuels—Determination of Mechanical Durability of Pellets and Briquettes—Part 1: Pellets. ISO: Geneva, Switzerland, 2015.
Figure 1. (a) Fresh wood pellets, (b) Aged wood pellets, (c) Degraded aged wood pellets, (d) Roasted coffee beans, and (e) Degraded coffee beans.
Applsci 13 01960 g001
Figure 2. Full-scale industrial pneumatic conveying the test rig at The Wolfson Centre with a Line diagram showing bends in proximity at the end of the pipe with the full-scale test rig (pipe dimensions in the line diagram are not scaled).
Applsci 13 01960 g002
Figure 3. Measurement of localized particle velocity and average feed rate with 0.2 kg/s air flow rate and feeder speed of 5 RPM during conveying with bends in proximity; (a) Particle velocity at each bend, solid feed rate, (b) standard deviation in particle velocity measurement each second.
Applsci 13 01960 g003
Figure 4. Measurement of localized pressure and air velocity with 0.2 kg/s air flow rate and feeder speed of 5 RPM during conveying with bends in proximity, (a) Pressure measurement at each bend (Bend 1–4) and inlet of pipe, (b) Air velocity measurement at each bend (Bend 1–4).
Applsci 13 01960 g004
Figure 5. Velocity profiles at the inlet of the pipe and before bends with 0.24 kg/s air flow rate and 0.2 kg/s solid flow rate.
Applsci 13 01960 g005
Figure 6. Velocity profiles for coffee beans at 0.27 kg/s air mass flow rate and 0.2 kg/s solid flow rate.
Applsci 13 01960 g006
Table 1. Physical properties of wood pellets and dry roasted coffee beans tested in this study.
Biomass MaterialMoisture
Content, %-w
Settled Bulk Density, kg/m3No. of Particles to Weight RatioMechanical
Durability, %
Aged wood pellets9.8 ± 0.2650 ± 103.498.2
Fresh wood pellets5.6 ± 0.2650 ± 102.698.9
Coffee beans1.5 ± 0.1330 ± 107.899.9
Table 2. Specifications of load sensors.
Type of Load CellS-Type Tension/Compression
Rated load1500 kg
Output2 mV/V at rated load ±0.1%
Combined error<±0.017% of rated load
Output resistance350 Ω ± 3 Ω
Resolution0.1 kg
Table 3. Particle velocity measurements for fresh pellets.
Air mass Flow Rate, kg/sSolid Feed Rate
kg/s
Average Air Velocity @ Inlet of Pipe, m/sAverage Particle Velocity (m/s)
Bend 1
22 m from the Inlet
Bend 2
0.5 m from Bend 1
Bend 3
0.5 m from Bend 2
Bend 4
2 m from Bend 3
0.240.222.316.010.59.09.5
0.240.422.115.79.97.99.6
0.240.821.814.08.96.69.7
0.270.224.820.613.010.911.6
0.270.424.619.412.110.011.7
0.270.824.217.711.18.511.8
0.300.227.323.815.313.314.6
0.300.426.923.014.212.014.1
0.300.826.421.613.310.813.6
Table 4. Degradation of fresh pellets at 0.24 kg/s air flow rate with bends in proximity.
Particle Size (mm)Input PSD
(%-w Retained)
Output PSDs (%-w Retained)
Solid Mass Flow Rate @ 0.2 kg/sSolid Mass Flow Rate @ 0.4 kg/sSolid Mass Flow Rate @ 0.8 kg/s
Fines < 3.1500.530.470.38
3.15~4.7500.830.650.50
>4.7510098.6498.8899.12
Table 5. Degradation of fresh pellets at an air flow rate of 0.27 kg/s with bends in proximity.
Particle Size (mm)Input PSD
%-w Retained
Output PSDs (%-w Retained)
Solid Mass Flow Rate @ 0.2 kg/sSolid Mass Flow Rate @ 0.4 kg/sSolid Mass Flow Rate @ 0.8 kg/s
Fines < 3.1500.740.630.52
3.15~4.7500.980.830.66
>4.7510098.2898.5498.82
Table 6. Degradation of fresh pellets at an air flow rate of 0.30 kg/s with bends in proximity.
Particle Size (mm)Input PSD
%-w Retained
Output PSDs (%-w Retained)
Solid Mass Flow Rate @ 0.2 kg/sSolid Mass Flow Rate @ 0.4 kg/sSolid Mass Flow Rate @ 0.8 kg/s
Fines < 3.1500.530.470.38
3.15~4.7500.830.650.50
>4.7510098.6498.8899.12
Table 7. Particle velocity measurements for aged pellets with bends in proximity.
Air Mass Flow Rate, kg/sSolid Feed Rate
kg/s
Average Air Velocity @ Inlet of Pipe, m/sAverage Particle Velocity (m/s)
Bend 1
22 m from the Inlet
Bend 2
0.5 m from Bend 1
Bend 3
0.5 m from Bend 2
Bend 4
2 m from Bend 3
0.240.222.315.39.58.710.7
0.240.422.114.78.37.19.0
0.240.821.812.78.15.68.0
0.270.224.819.010.99.611.0
0.270.424.617.710.18.810.5
0.270.824.215.89.47.310.8
0.300.227.321.013.011.213.4
0.300.426.920.411.310.714.2
0.300.826.418.811.49.411.4
Table 8. Degradation of aged pellets at an air flow rate of 0.24 kg/s with bends in proximity.
Particle Size (mm)Input PSD
(%-w Retained)
Output PSDs (%-w Retained)
Solid Mass Flow Rate @ 0.2 kg/sSolid Mass Flow Rate @ 0.4 kg/sSolid Mass Flow Rate @ 0.8 kg/s
Fines < 3.1501.981.761.32
3.15~4.7502.191.951.45
>4.7510095.8396.2997.23
Table 9. Degradation of aged pellets at an air flow rate of 0.27 kg/s with bends in proximity.
Particle Size (mm)Input PSD
%-w Retained
Output PSDs (%-w Retained)
Solid Mass Flow Rate @ 0.2 kg/sSolid Mass Flow Rate @ 0.4 kg/sSolid Mass Flow Rate @ 0.8 kg/s
Fines < 3.1502.732.391.86
3.15~4.7503.202.732.08
>4.7510094.0794.8896.06
Table 10. Degradation of aged pellets at an air flow rate of 0.30 kg/s with bends in proximity.
Particle Size (mm)Input PSD
%-w Retained
Output PSDs (%-w Retained)
Solid Mass Flow Rate @ 0.2 kg/sSolid Mass Flow Rate @ 0.4 kg/sSolid Mass Flow Rate @ 0.8 kg/s
Fines < 3.1503.743.402.70
3.15~4.7504.123.902.96
>4.7510092.1492.7094.34
Table 11. Degradation of coffee beans with an air flow rate of 0.27 kg/s and feeder speed of 10 RPM while conveying through a pipeline having bends in proximity.
Particle Size (mm)Input PSD
%-w Retained
Output PSDs (%-w)
Solid Mass Flow Rate @ 0.2 kg/s
Fines < 3.15011.64
3.15~4.75042.52
>4.7510045.84
Disclaimer/Publisher’s Note: The statements, opinions and data contained in all publications are solely those of the individual author(s) and contributor(s) and not of MDPI and/or the editor(s). MDPI and/or the editor(s) disclaim responsibility for any injury to people or property resulting from any ideas, methods, instructions or products referred to in the content.

