Article

The Duration Effect of Pulse-Type Near-Field Earthquakes on Nonlinear Dynamic Analysis and Damage Evaluation of Hydraulic Tunnels

1
School of Water Conservancy Engineering, Zhengzhou University, Zhengzhou 450001, China
2
State Key Laboratory of Hydraulic Engineering Simulation and Safety, Tianjin University, Tianjin 300350, China
3
Key Laboratory of Earthquake Engineering Simulation and Seismic Resilience of China Earthquake Administration, Tianjin 300350, China
*
Author to whom correspondence should be addressed.
Appl. Sci. 2023, 13(4), 2041; https://doi.org/10.3390/app13042041
Submission received: 15 October 2022 / Revised: 30 January 2023 / Accepted: 1 February 2023 / Published: 4 February 2023

Abstract

:
Current research trends in significant hydraulic engineering projects focus on investigating the seismological properties of intensity and frequency content of pulse-type near-field earthquakes on the structural response. Conversely, the duration impact is not expressly addressed in the seismic design code for underground buildings. Currently, various duration indicators of as-recorded strong ground motions mainly consider the effective duration of the initial acceleration component record. In contrast, the duration indicators for the effective velocity duration (EVD) of the original velocity time-history component record have rarely been addressed. Specifically, there is a gap between the effective velocity duration and the structural response. To illustrate the impact on the structural response, an EVD of pulse-type NFGM duration was used. This EVD can be calculated for seismic excitations with set threshold values that enable a quantitative examination of the duration effects. A fluid-hydraulic tunnel-rock interaction system was built and used to estimate the seismic response characteristics induced by different duration NFGMs. The investigation’s findings highlight that the inelastic dynamic response and damage degree are strongly affected by the EVD. Additionally, the fixed threshold value of 5–95% showed an excellent correlation coefficient with the structural response. The significant duration was also found to be the most suitable alternative indicator to replace the EVD index. In addition, the reduced time-history methodology of near-fault earthquake records is presented and validated, with this method being used to improve the efficiency of the dynamic time-history analysis of hydraulic arched tunnels.

1. Introduction

It is commonly accepted that underground structures, such as hydraulic tunnels, have greater stability and safety than aboveground structures during seismic excitations. The main reason for this phenomenon is that the inertial loads of the underground structures induced by seismic excitations below the constraining effect that stems from the surrounding soil or rock prevail. However, several recent reports based on evidence uncovered from natural disaster investigations of historical seismic events confirm that the underground structures are prone to extensive damage induced by strong seismic excitations. For example, the seismic events in Wenchuan, China (Mw 8.0, 12 May 2008), demonstrated that the underground structures, including the mountain tunnels, the hydraulic tunnels, the underground powerhouses, the underground cavities, the underground pipes, etc., have a substantial potential to experience severe damage and lose their capacities to function, due to strong seismic excitation [1]. In particular, the Yingxiuwan hydraulic tunnel experienced a severe collapse, demonstrating that structural safety is still an unavoidable problem [2]. This incident has spurred engineers and seismologists to try and further understand the structural response of underground structures in the face of seismological events.
During the last few decades, seismologists and civil engineers have studied the characteristics of seismological events more precisely and have developed methods to identify several features [3]. Among the seismological features studied, the pulse-type near-fault ground motions (NFGMs) were extensively employed to examine the structural responses of high dams [4], bridges [5], and liquefaction events [6]. In particular, after several as-recorded extreme earthquake events, contemporary studies have revealed that the pulse-type NFGMs at short site-to-source distances were more destructive than those GMs at long distances [7,8,9,10,11]. Moreover, a wavelet analysis is conventionally used to illustrate the frequency content of the pulse-type NFGMs [12,13,14,15,16]. Additionally, the seismological characteristics of amplitude are one of the practical engineering parameters of structural response. This can be expressed by the peak value of the time-history curve of the GMs, such as the peak ground displacement (PGD), the velocity (PGV), and the acceleration (PGA). However, the current seismic design code does not take the duration of the pulse-type NFGMs into account, which may result in an underestimation of the structural response. Generally, observations from strong seismic events indicate that the length of duration of the pulse-type NFGMs may also be a critical factor in causing severe damage to underground structures.
The structural response induced by the ground motion duration (GMD) effects has been extensively researched over the past few years. Currently, the applicability of dynamic response indicators of different types of structures to the GMD effects is inconsistent, since over 30 definitions of the GMD effects have been presented [17]. This phenomenon has led to a debate in the scientific community regarding the impact of the GMD effects on structural responses [18]. Among the GMD definitions reported in the literature, the bracketed duration (BD, T B ), the uniform duration (UD, T U ), the significant duration (SD, T S ), and the effective duration (ED, T E ) have been demonstrated to be the most appropriate indicators of the inelastic dynamic analysis of structures [19]. Recently, Wang et al. [4] suggested that the integrated duration of the multi-directional duration characteristics may be assessed using the SD index; they also analyzed the effects of diverse direction duration on dam failure modes. Kitayama et al. [3] studied the impact of the GMs with a longer and a shorter SD on the total cumulative energy wasted in seismic isolation systems. Barbosa et al. [17] evaluated the effect of the GMD on the structural deterioration observed in a variety of frame structures. Wang et al. [20] discovered that a longer SD significantly increases the failure probabilities of the earth slopes. Sun et al. [21] employed the SD index to express the cumulative damage characteristics of deeply-buried hydraulic tunnels. It is important to note that most of the research cited above employs the acceleration-type duration index to determine the influence of the seismic duration on the structural reaction, while ignoring the velocity pulse effect. As such, the acceleration-type GMD indicators may not be suitable for illustrating the impact of the pulse-type NFGM duration on the structural response [22]. Therefore, it is necessary to employ an efficient velocity-type GMD index that can consider the essential characteristics of the significant velocity pulse duration of the NFGMs.
During the dynamic analysis of underground structures, the dynamic time-domain response analysis methodology is frequently used in the finite element (FE) numerical computation of underground structures [23,24,25,26,27,28,29,30], since this methodology has the adaptability to capture complex structural responses. The methodology generally starts with selecting the as-recorded GMs appropriately and treating them as seismic excitations acting on the complex structural system. Subsequently, the FE model with a multi-degree system is addressed using a step-by-step integration method at each moment in the time domain [31]. In this analysis process, the time consumed by the underground structures far exceeds the total duration of the as-recorded GMs, as do the many human and material resources consumed. However, the effective duration of the pulse-type NFGMs may be mainly concentrated in the time-history curve of the large velocity pulse of the low-frequency components, which has a much shorter duration than the total duration of the NFGMs. The question of how to propose a simple, reliable, and convenient methodology to reduce the total time of the as-recorded NFGMs, is a frontier challenge essential for civil designers, in order to enhance the calculation efficiency and reduce computational costs.
Based on the above considerations, the purpose of this paper is to gain an understanding of the influence of the duration of the pulse-type NFGMs on the seismic performance of hydraulic tunnels built deep underground. A velocity-type duration index is presented in Section 2. Subsequently, the selection criteria for the NFGMs with the velocity pulse and the corresponding duration are briefly illustrated in Section 3. In Section 4, the geometry of the hydraulic tunnel and the FE numerical model are illustrated. The effect of the velocity-type NFGM duration on the inelastic dynamic response and the damage pattern are discussed in Section 5. The applicability of a strong duration index and reduced time-history methodology are evaluated in Section 6. The summaries and conclusions follow in Section 7.

2. Ground Motion Duration Index

Generally, the acceleration-type indicator is closely related to the acceleration time-history of the as-recorded GMs without the pulse effect [32]. Inversely, if the velocity time-history of the as-recorded NFGMs contains a velocity impulse, the acceleration-type duration indicator may not be applicable. The main reason for this is that the seismology characteristic of the NFGMs with a velocity impulse exhibits high-energy and high-amplitude seismological characteristics, which can induce an intensely dynamic response of hydraulic tunnels. Therefore, it is necessary to explore an effective velocity duration (EVD) index that can simultaneously consider the duration of a low-frequency velocity impulse and the energy released of the velocity time-history. Recently, derived from the work of Repapis et al. [22], the specific energy density (SED) was proposed as the foundation for EVD and used to determine the efficient duration of the pulse-like GMs. The SED is described as integral to the velocity time-history of the GMs, which can be directly related to the energy released by the GMs and is a better parameter considering the damage potential [33]. The specific expression is as follows:
S E D v = 0 T [ v ( t ) ] 2 d t
where v ( t ) is the velocity component of the as-recorded GM; T is the total time of the as-recorded GM.
Similar to the SD, the Husid mathematical function is employed to describe the percentage of the SED change over time, and is calculated as [34]
H ( t ) = S E D v ( t ) max ( S E D v ( t ) ) = 0 t v 2 ( t ) d t 0 T v 2 ( t ) d t
where H ( t ) represents the Husid mathematical function of time t. Subsequently, E V D can be given by
E V D = H ( T 2 ) H ( T 1 )
where T 1 and T 2 , respectively, represent the upper limit and the lower limit of the fixed threshold value, which can be expressed as
{ H ( T 1 ) = 5 % H ( T 2 ) = 75 % or { H ( T 1 ) = 15 % H ( T 2 ) = 85 % or { H ( T 1 ) = 5 % H ( T 2 ) = 95 %
The above formula initially selects three fixed threshold values to identify the significant part of the SED and the effective pulse excitation period of the as-recorded GMs. The EVD is illustrated in Figure 1 for three fixed threshold values. As seen in Figure 1, the three fixed threshold values of the EVD may adequately depict the primary velocity pulse’s period.

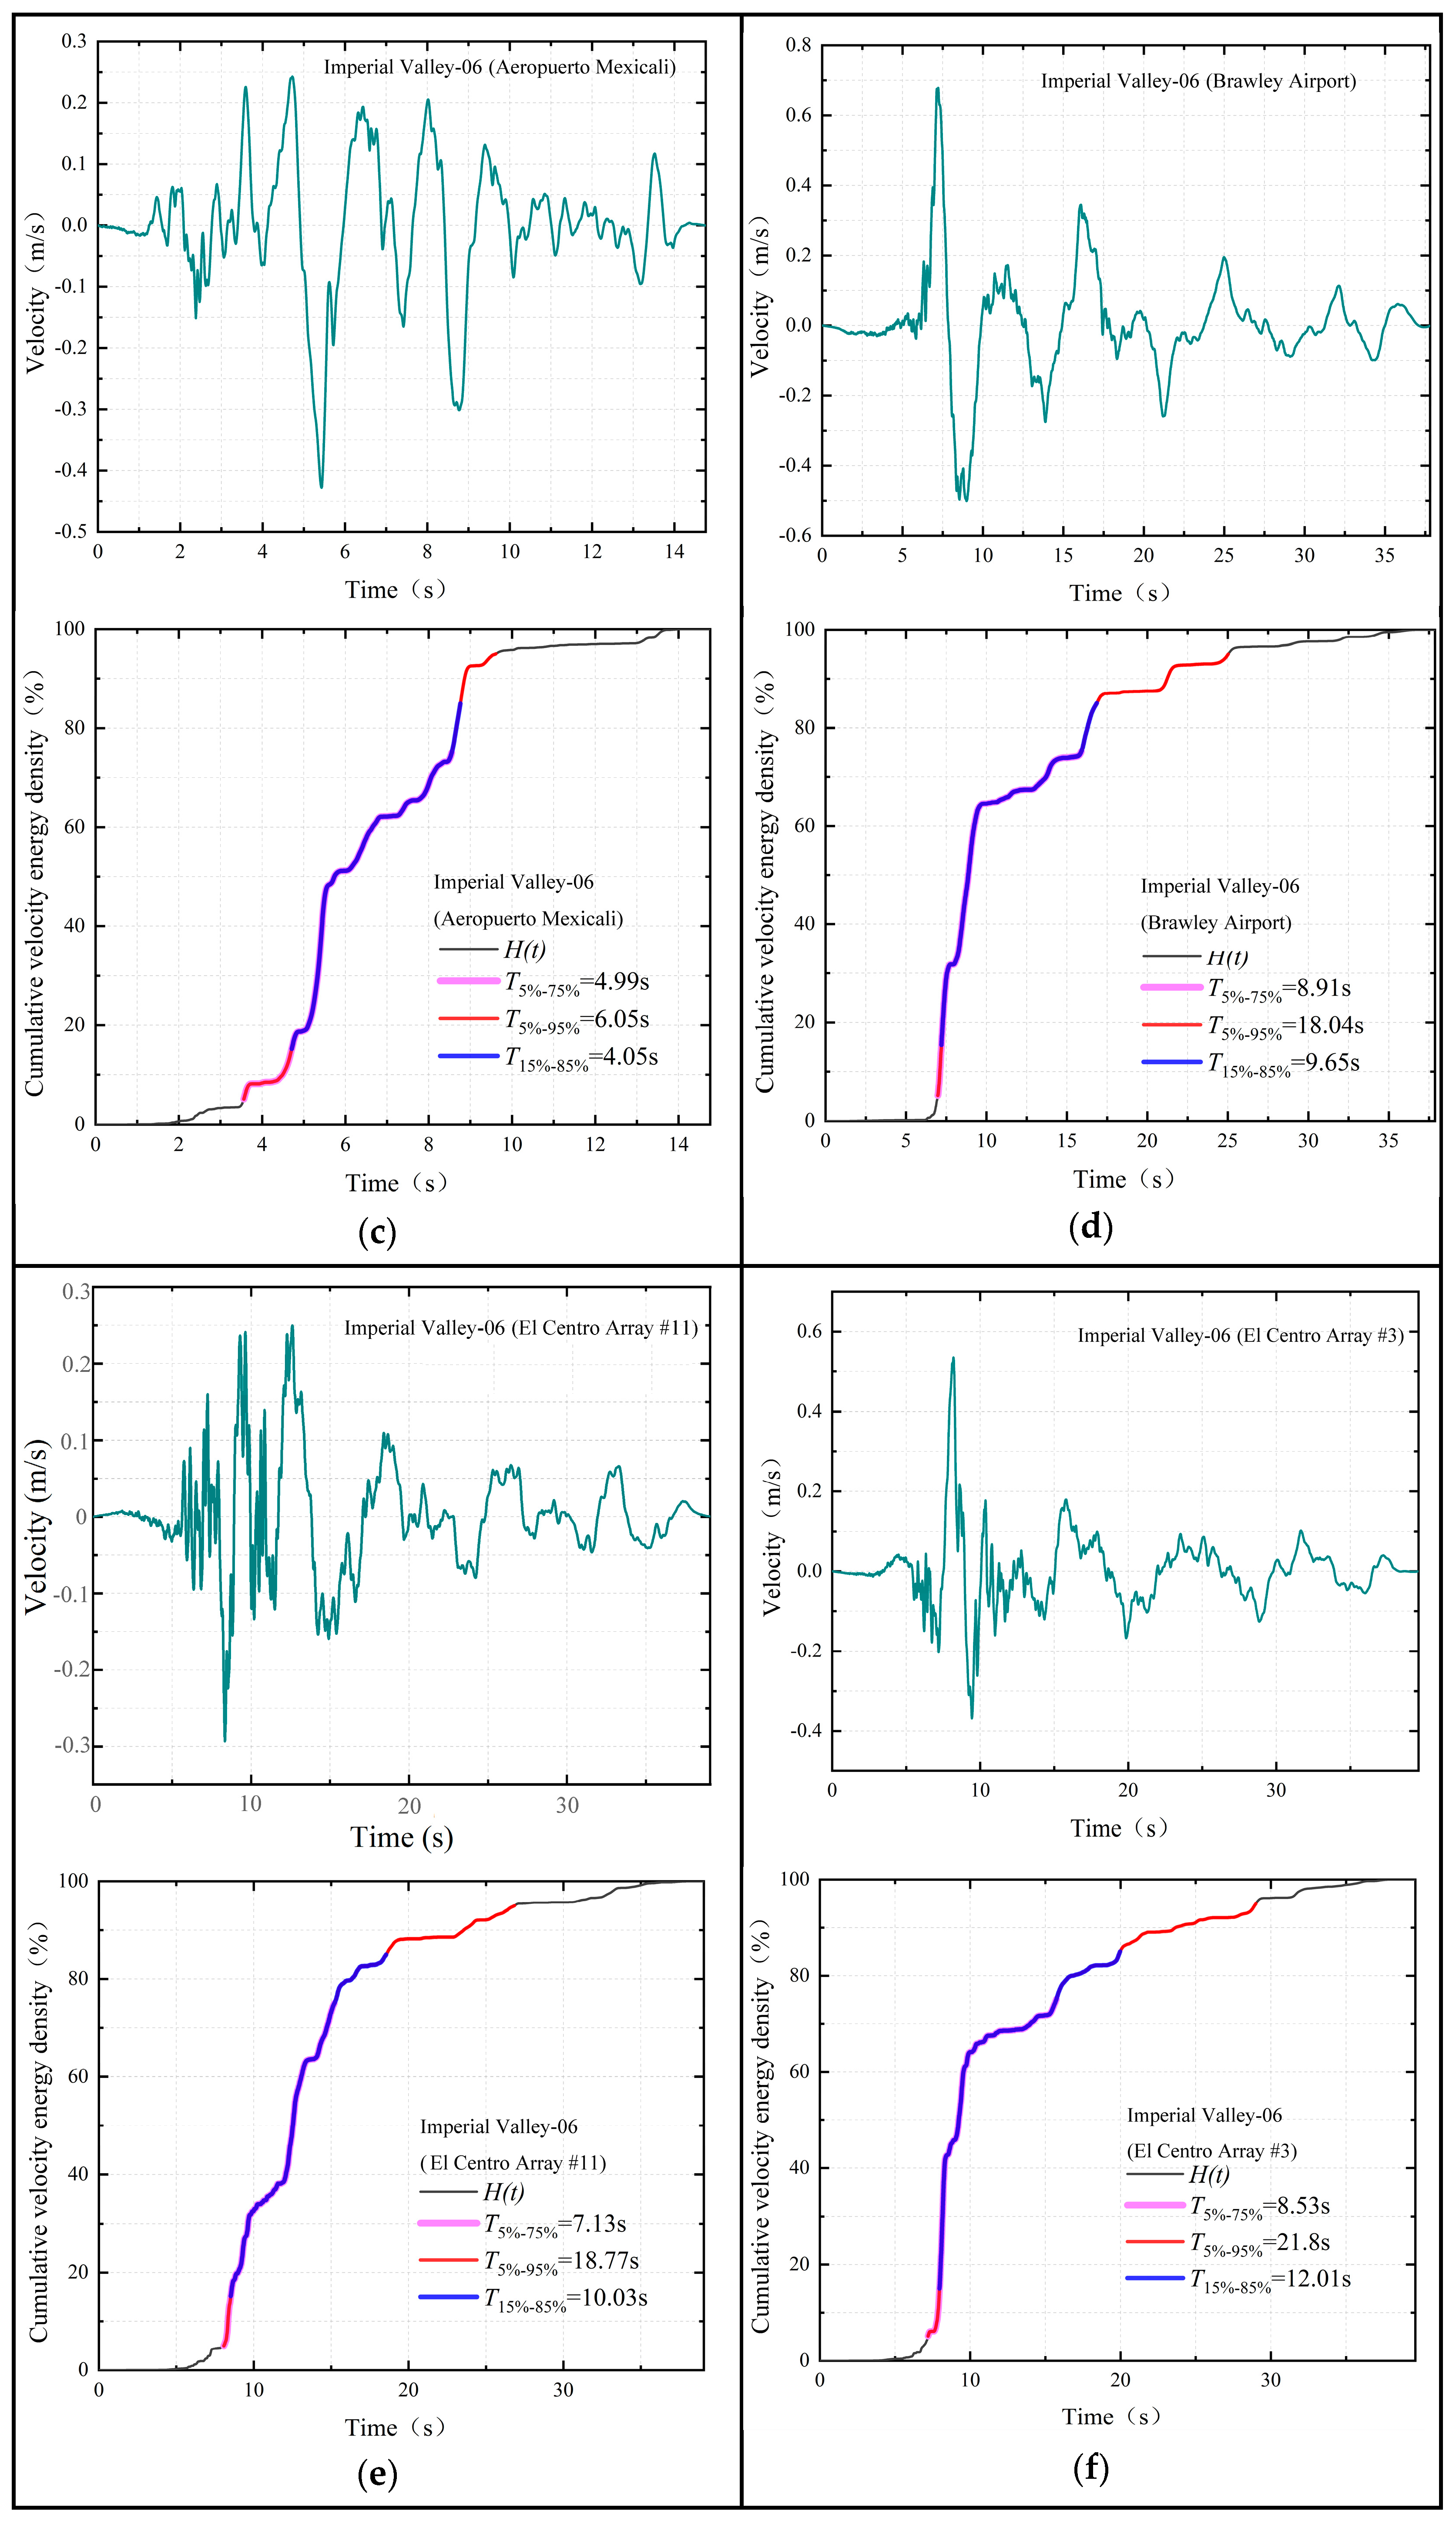
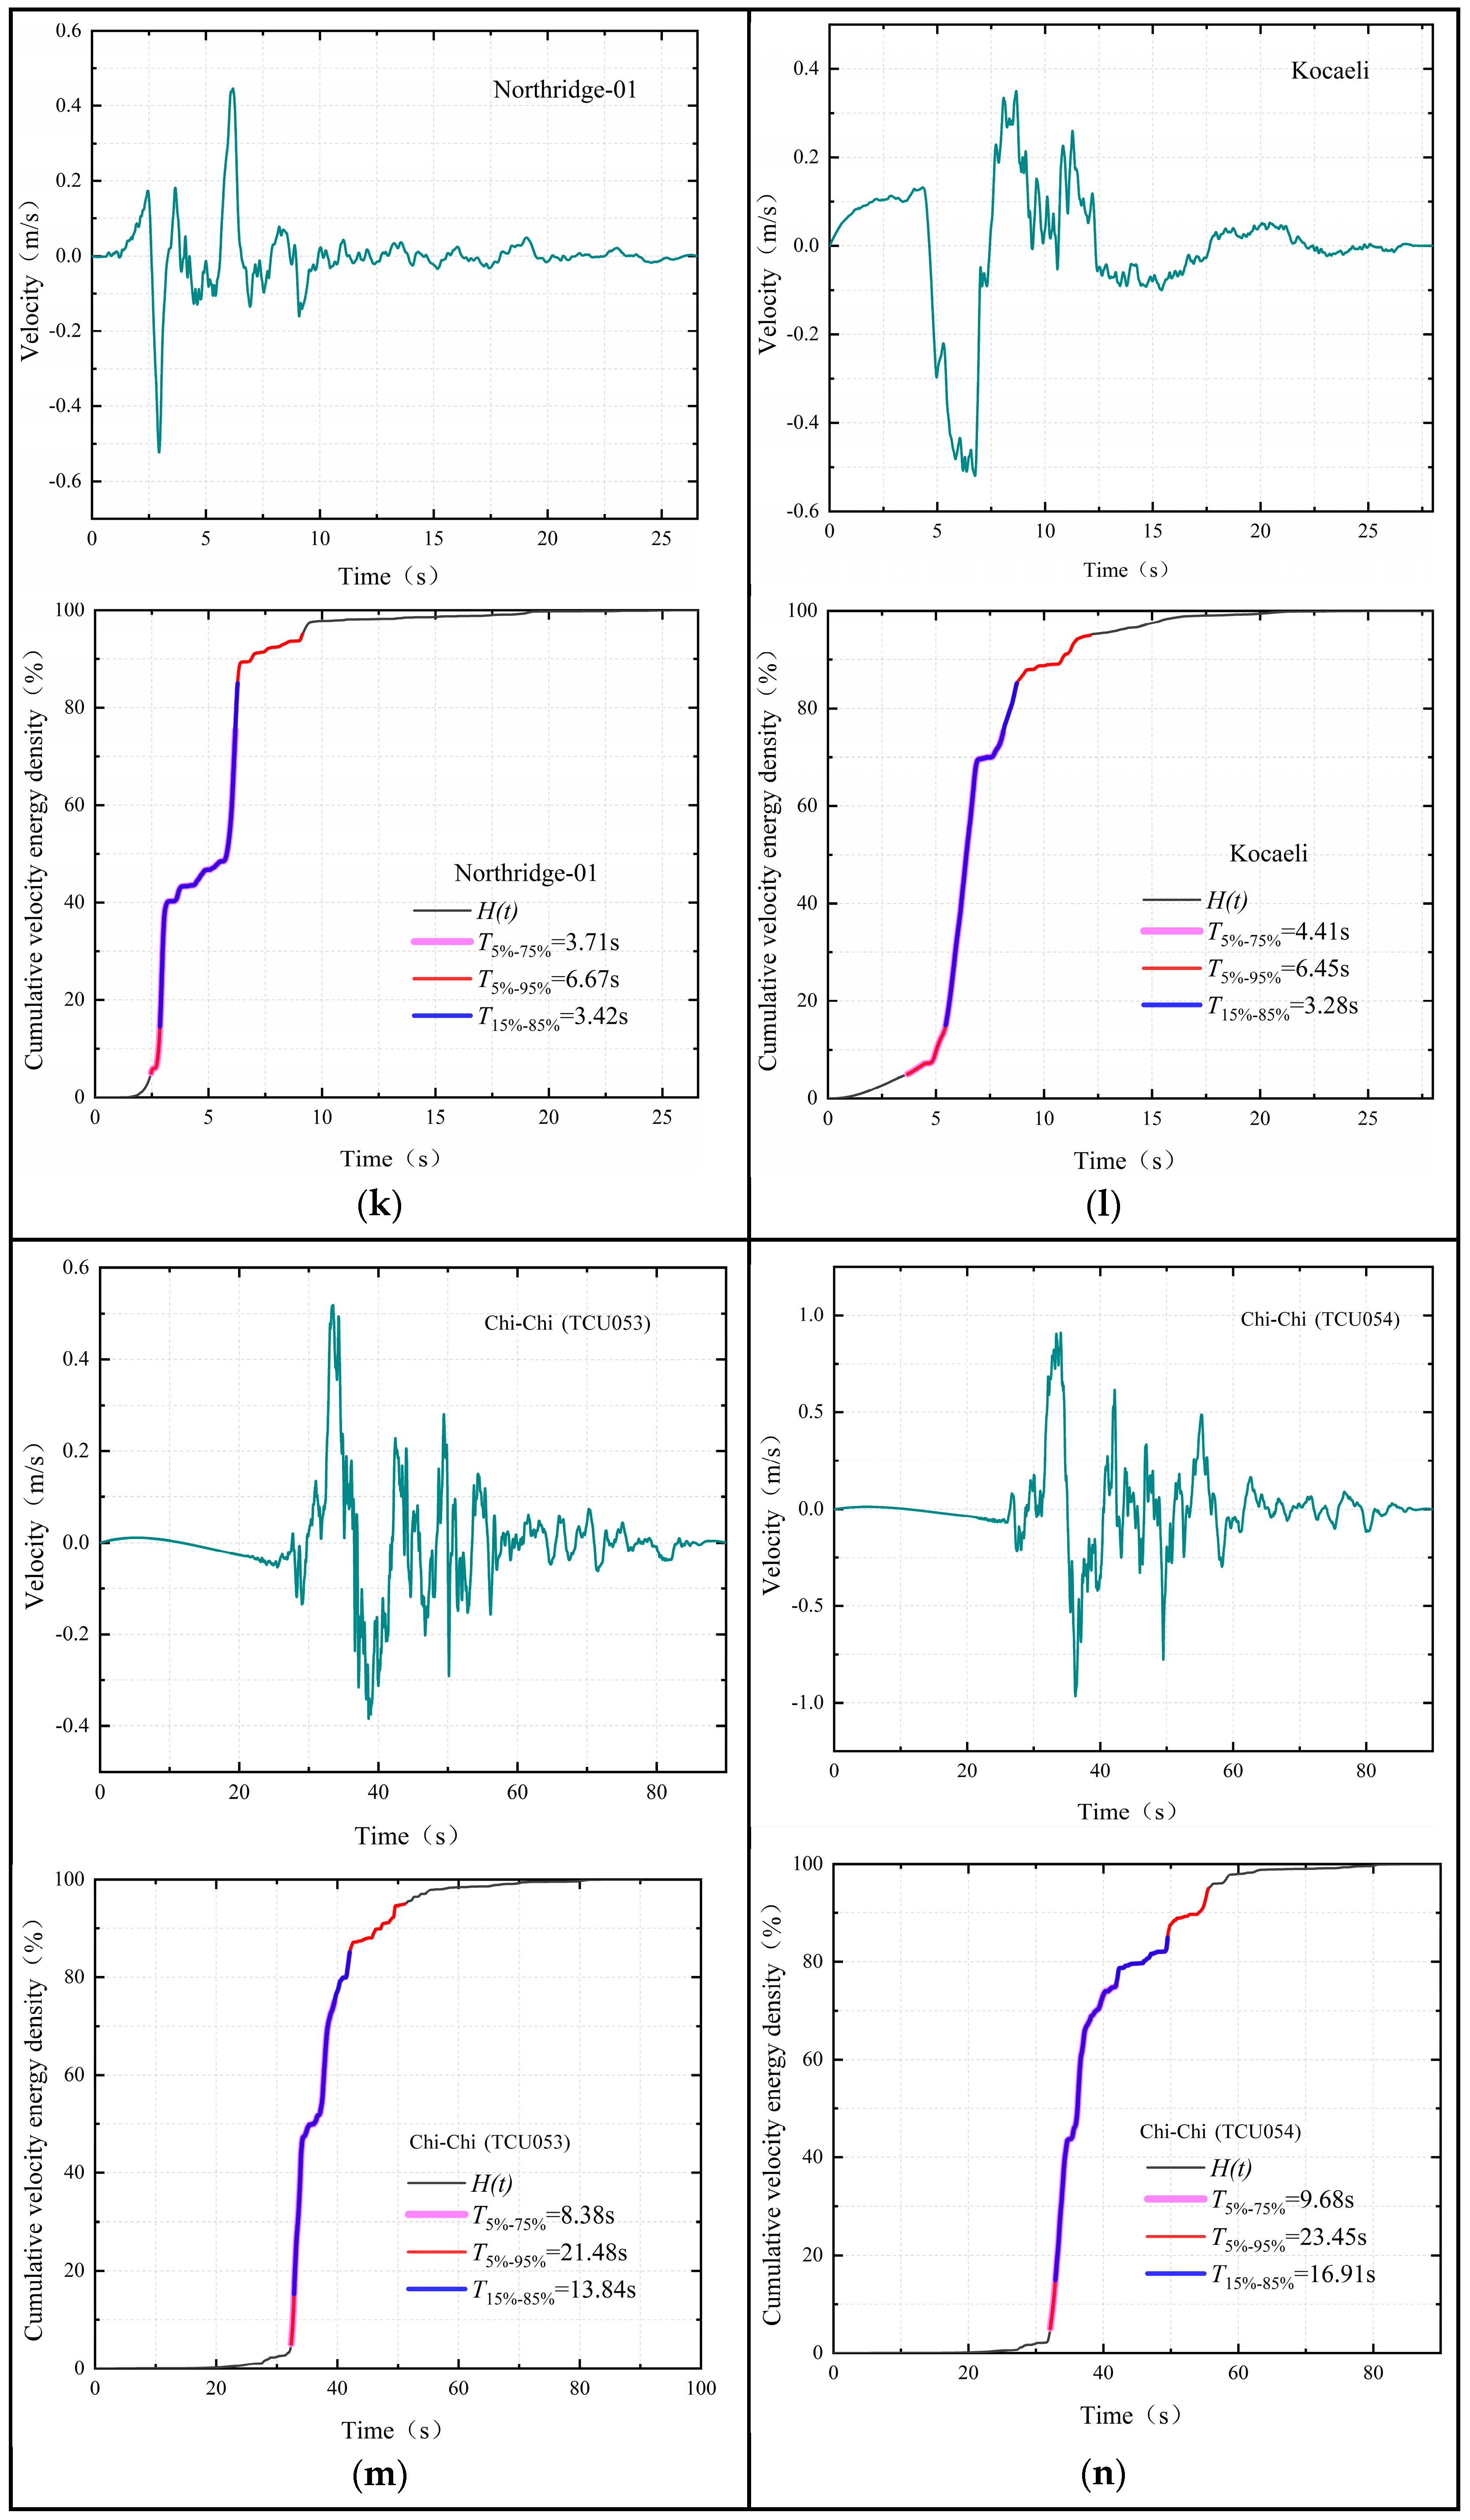
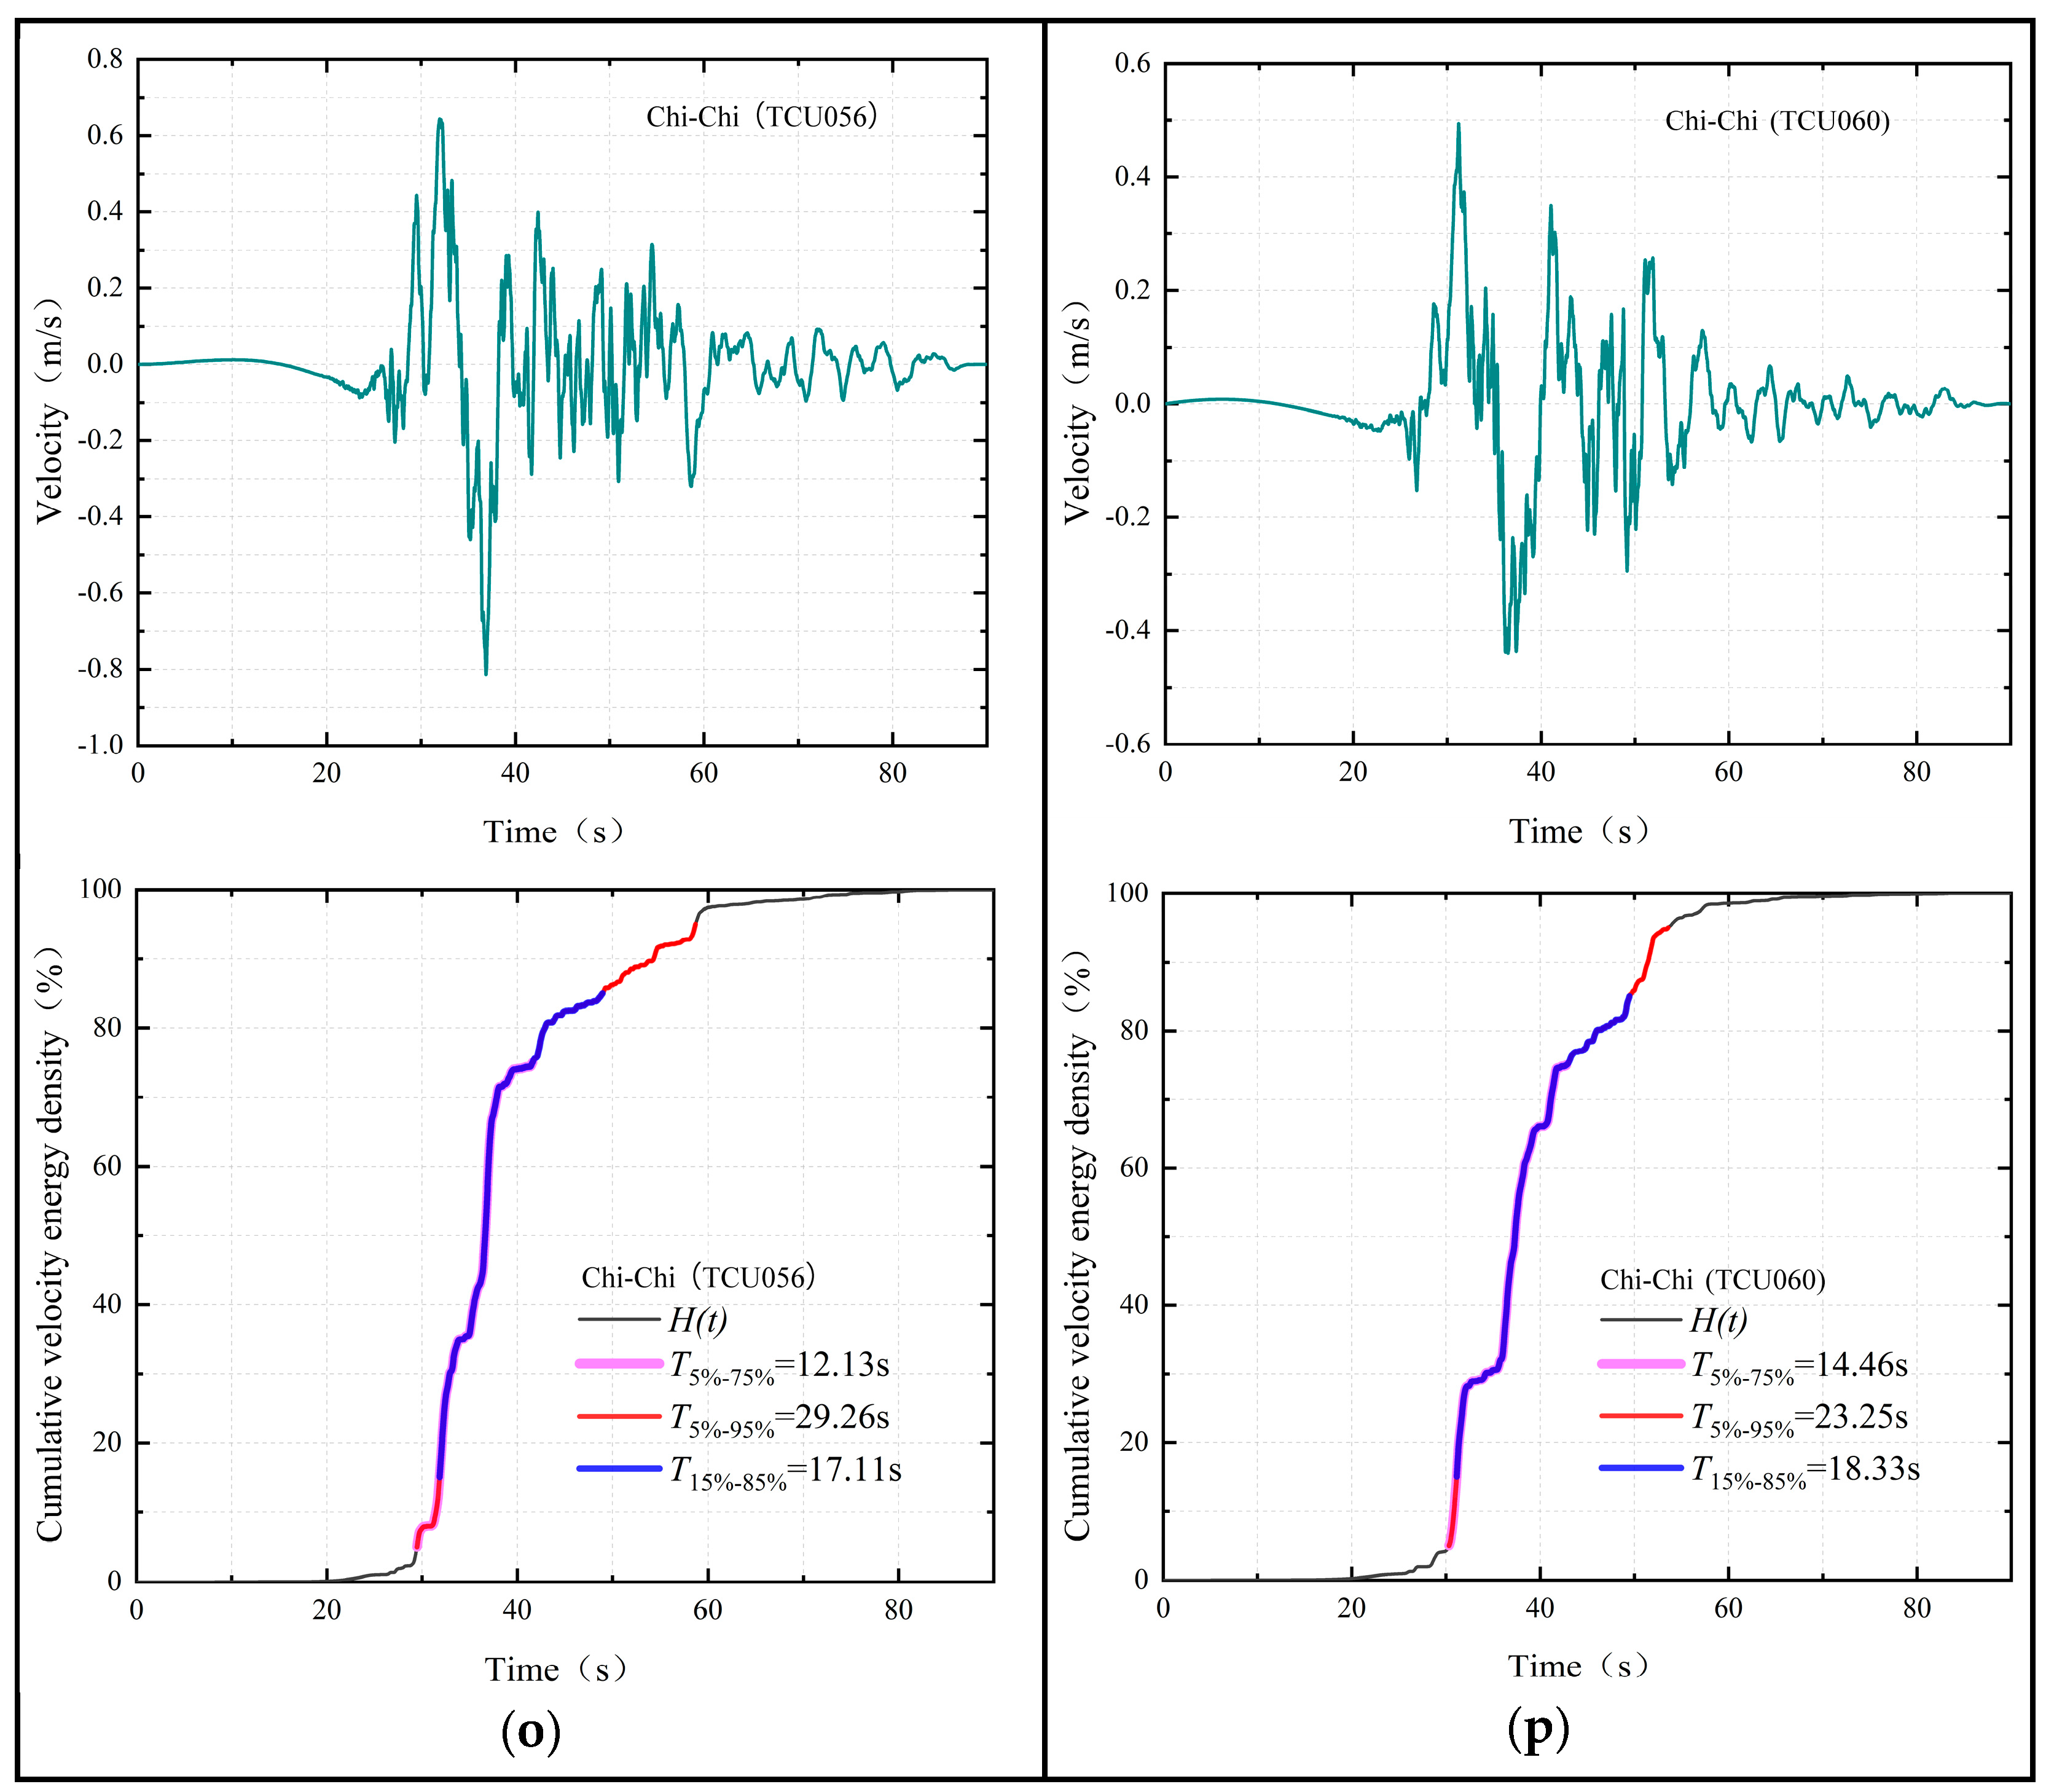
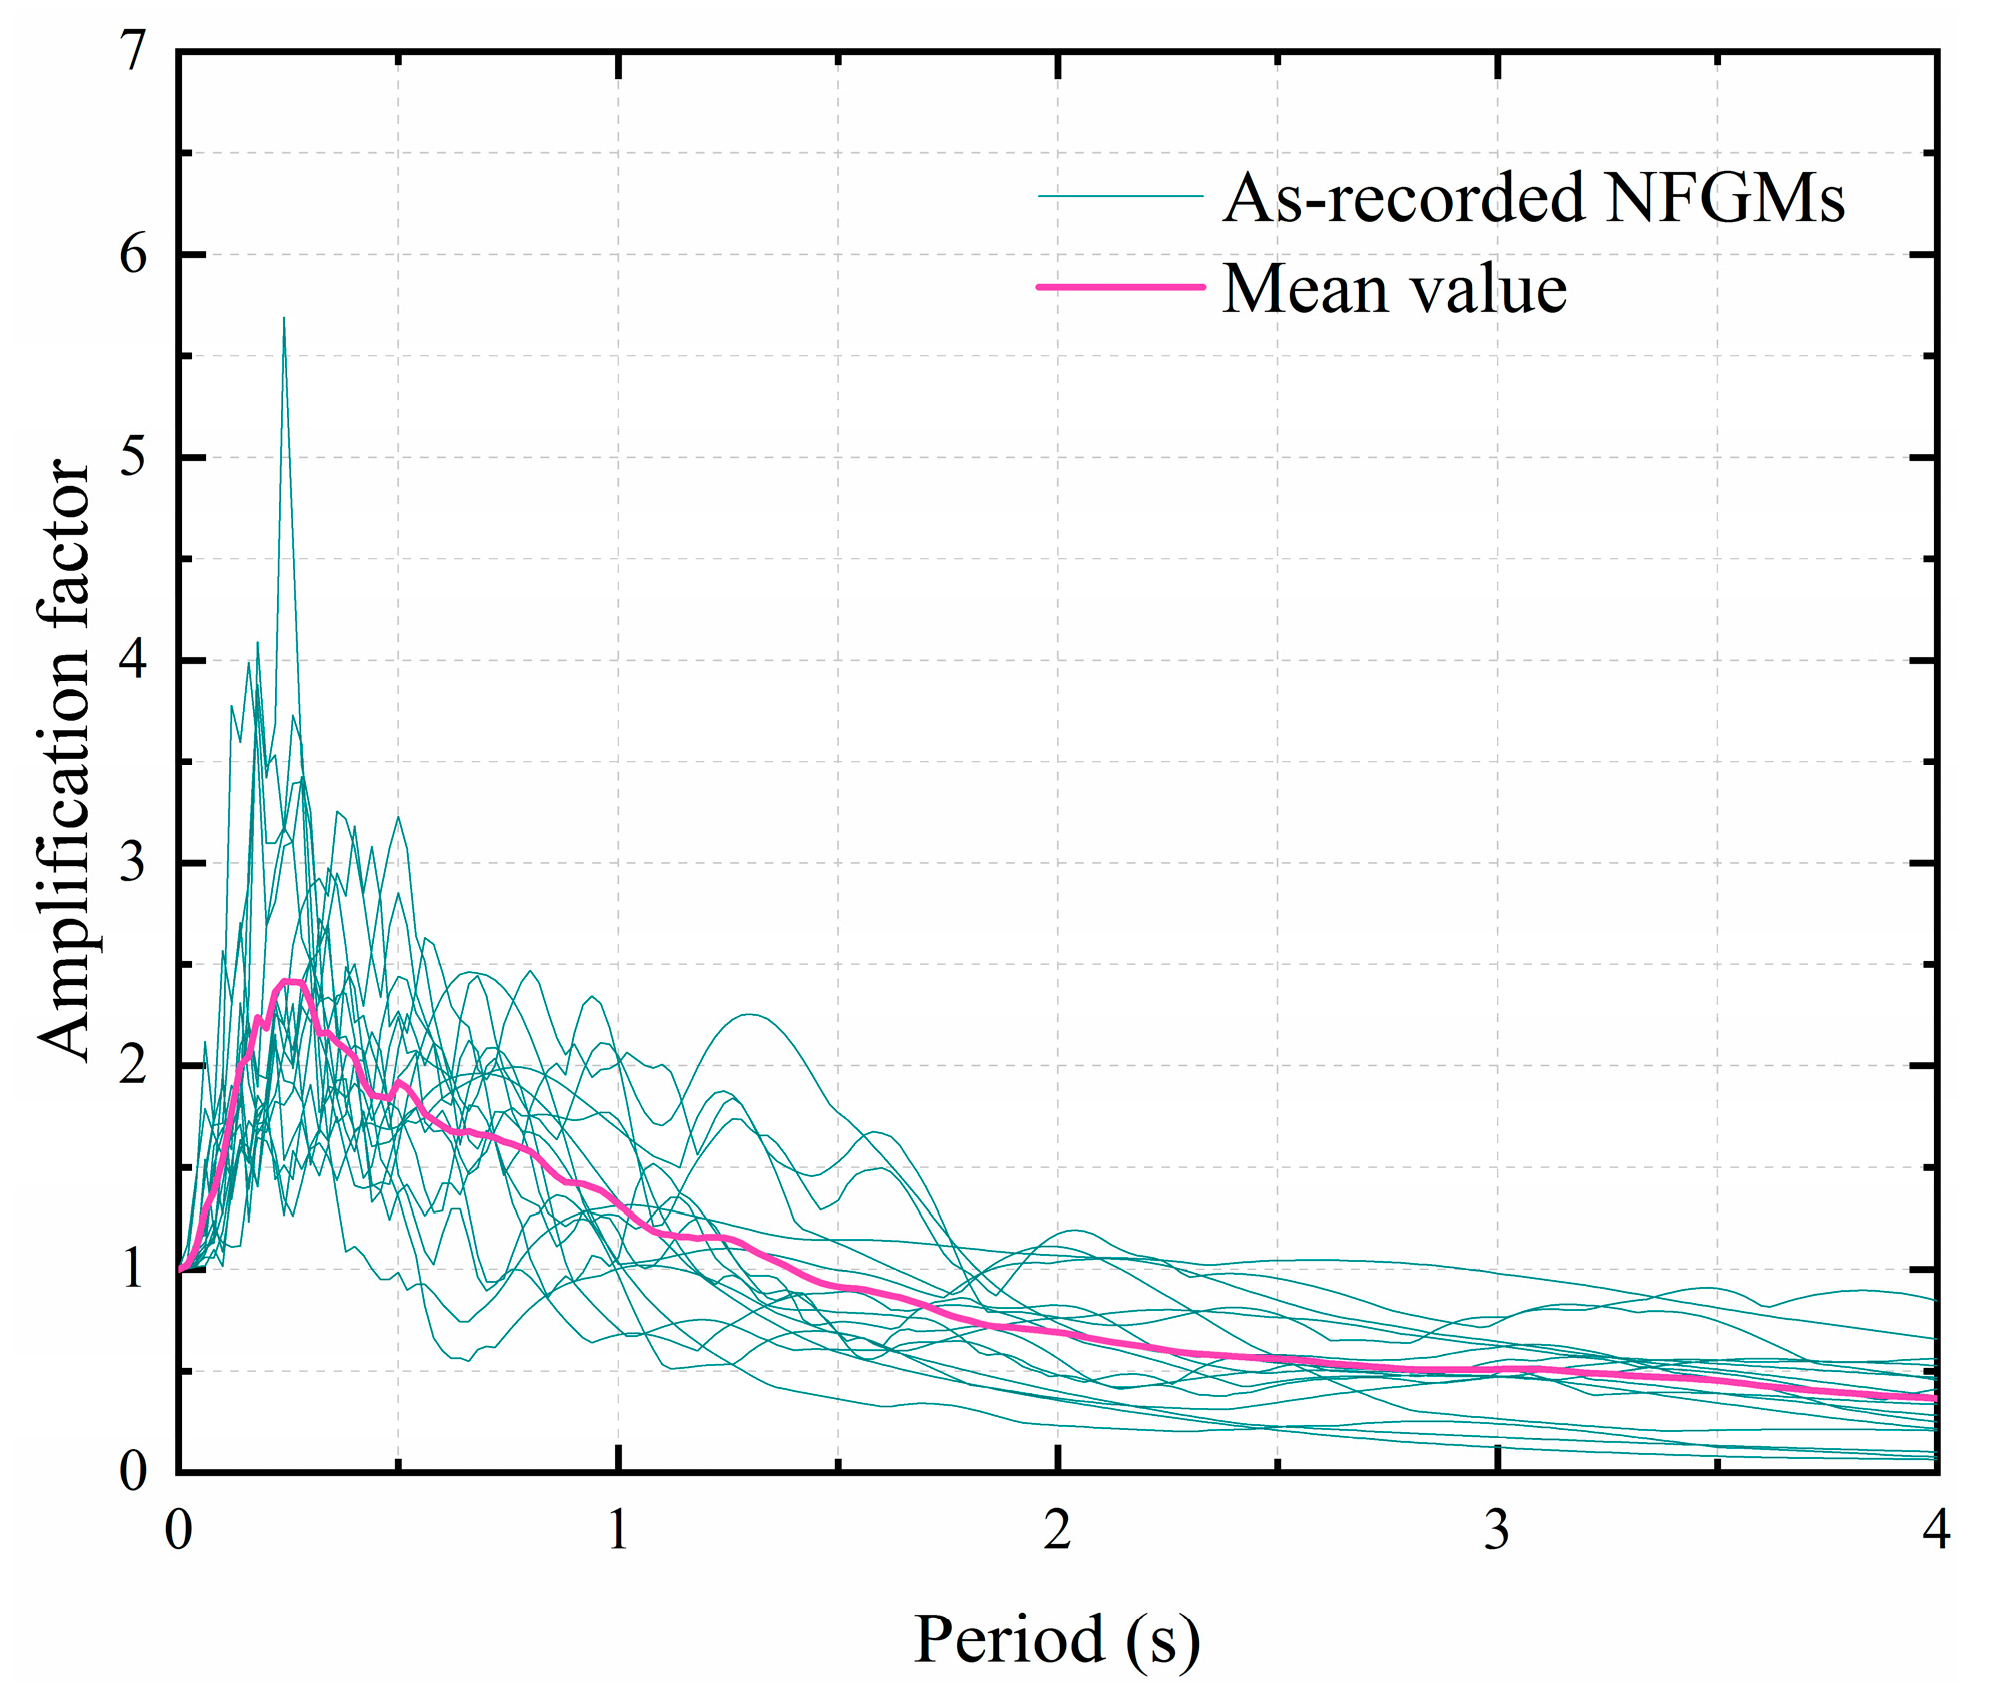
3. Near-Fault Ground Motion Database and Its Strong Duration

The strong Pacific Earthquake Engineering Research (PEER) database of the United States offers researchers strong ground motion records containing information on seismic stations, intensity parameters, and maps; includes a search function for screening; and is employed by us to select a broad range of as-recorded NFGMs [32]. As shown in Table A1, the as-recorded NFGMs were chosen if they fulfilled the following criteria: (a) they contained the velocity pulse; (b) the fault-normal direction component of the as-recorded GMs’ exhibited the velocity pulse; (c) the earthquake records from stations placed in open areas where the soil-structure interaction effects were insignificant or low-rise structures; (d) the Joyner-Boore distance was less than 15 km. Under these criteria, there were 16 as-recorded velocity-type NFGMs which are shown in Table A1.
In accordance with the concept of EVD, Figure 2 depicts the 16 as-recorded velocity-type NFGMs with varying fixed threshold values and durations. Additionally, the response spectrum of the 16 as-recorded velocity-type NFGMs are also illustrated in Figure 3. The spectrum matching method is defined as fitting the shape to match the pre-design response spectrum. If the spectrum matching is carried out in accordance with the standard response spectrum specified in the seismic design code for underground structures, the spectral features of the pulse-type NFGM recordings with the velocity-pulse may be altered. Meanwhile, the velocity time-history of the pulse-type NFGM after spectrum matching may not reflect the pulse characteristics. Therefore, the response spectrum of the pulse-type NFGM records with the velocity-pulse employed in this paper has been left unchanged.

4. Model Establishment

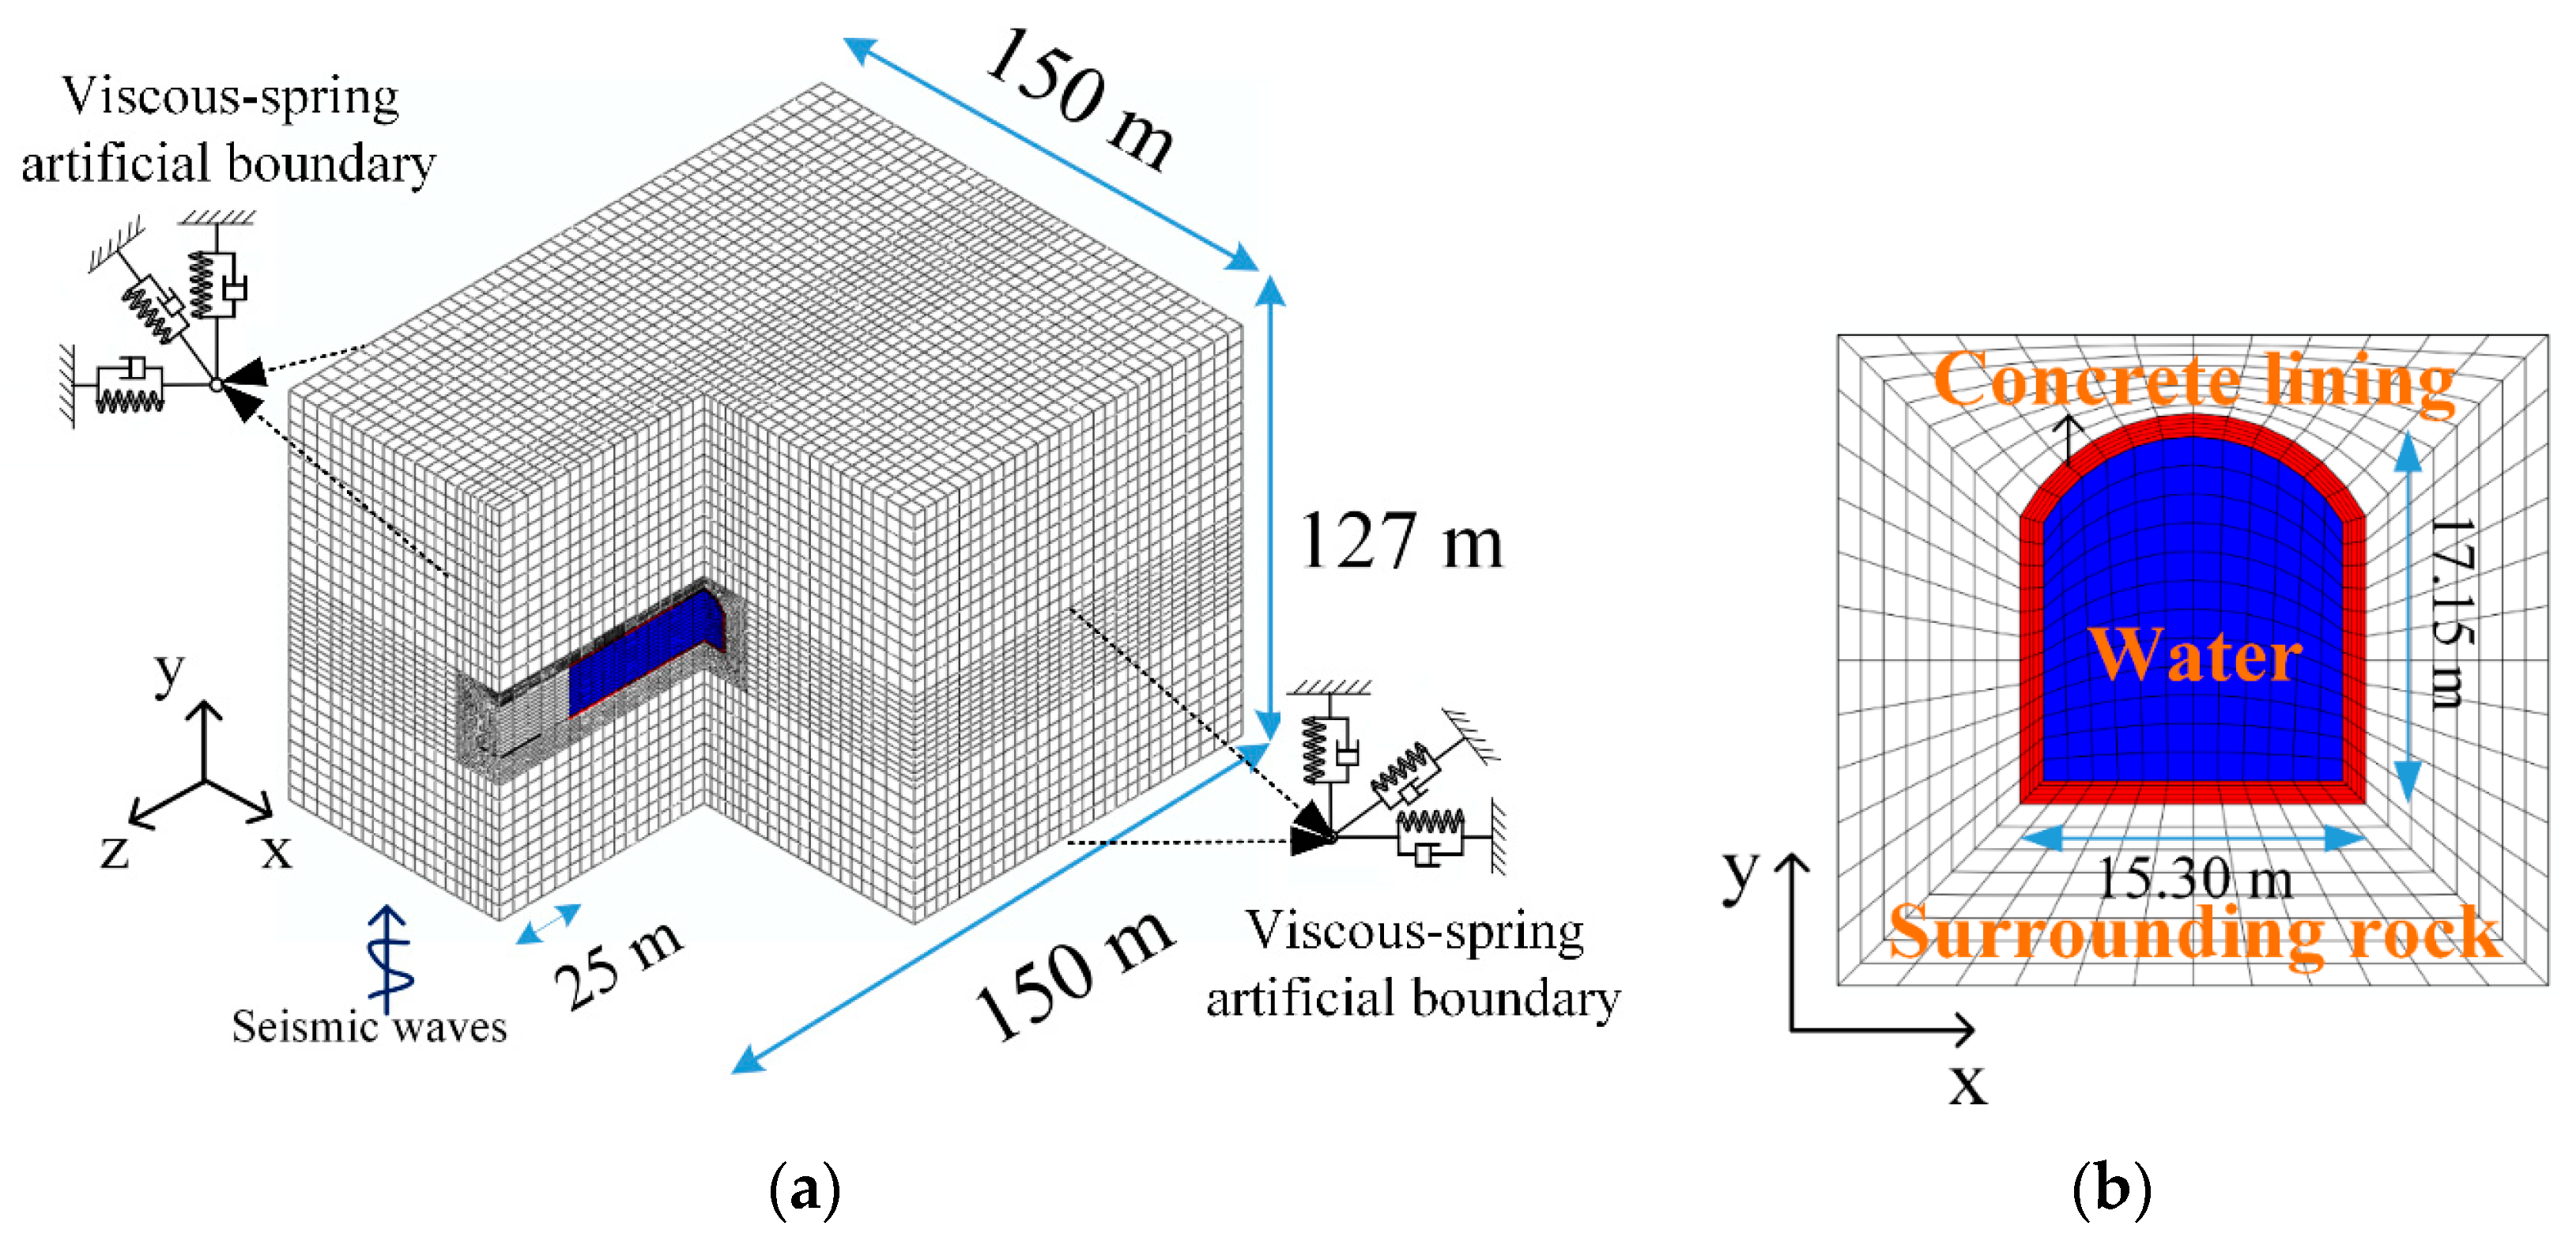
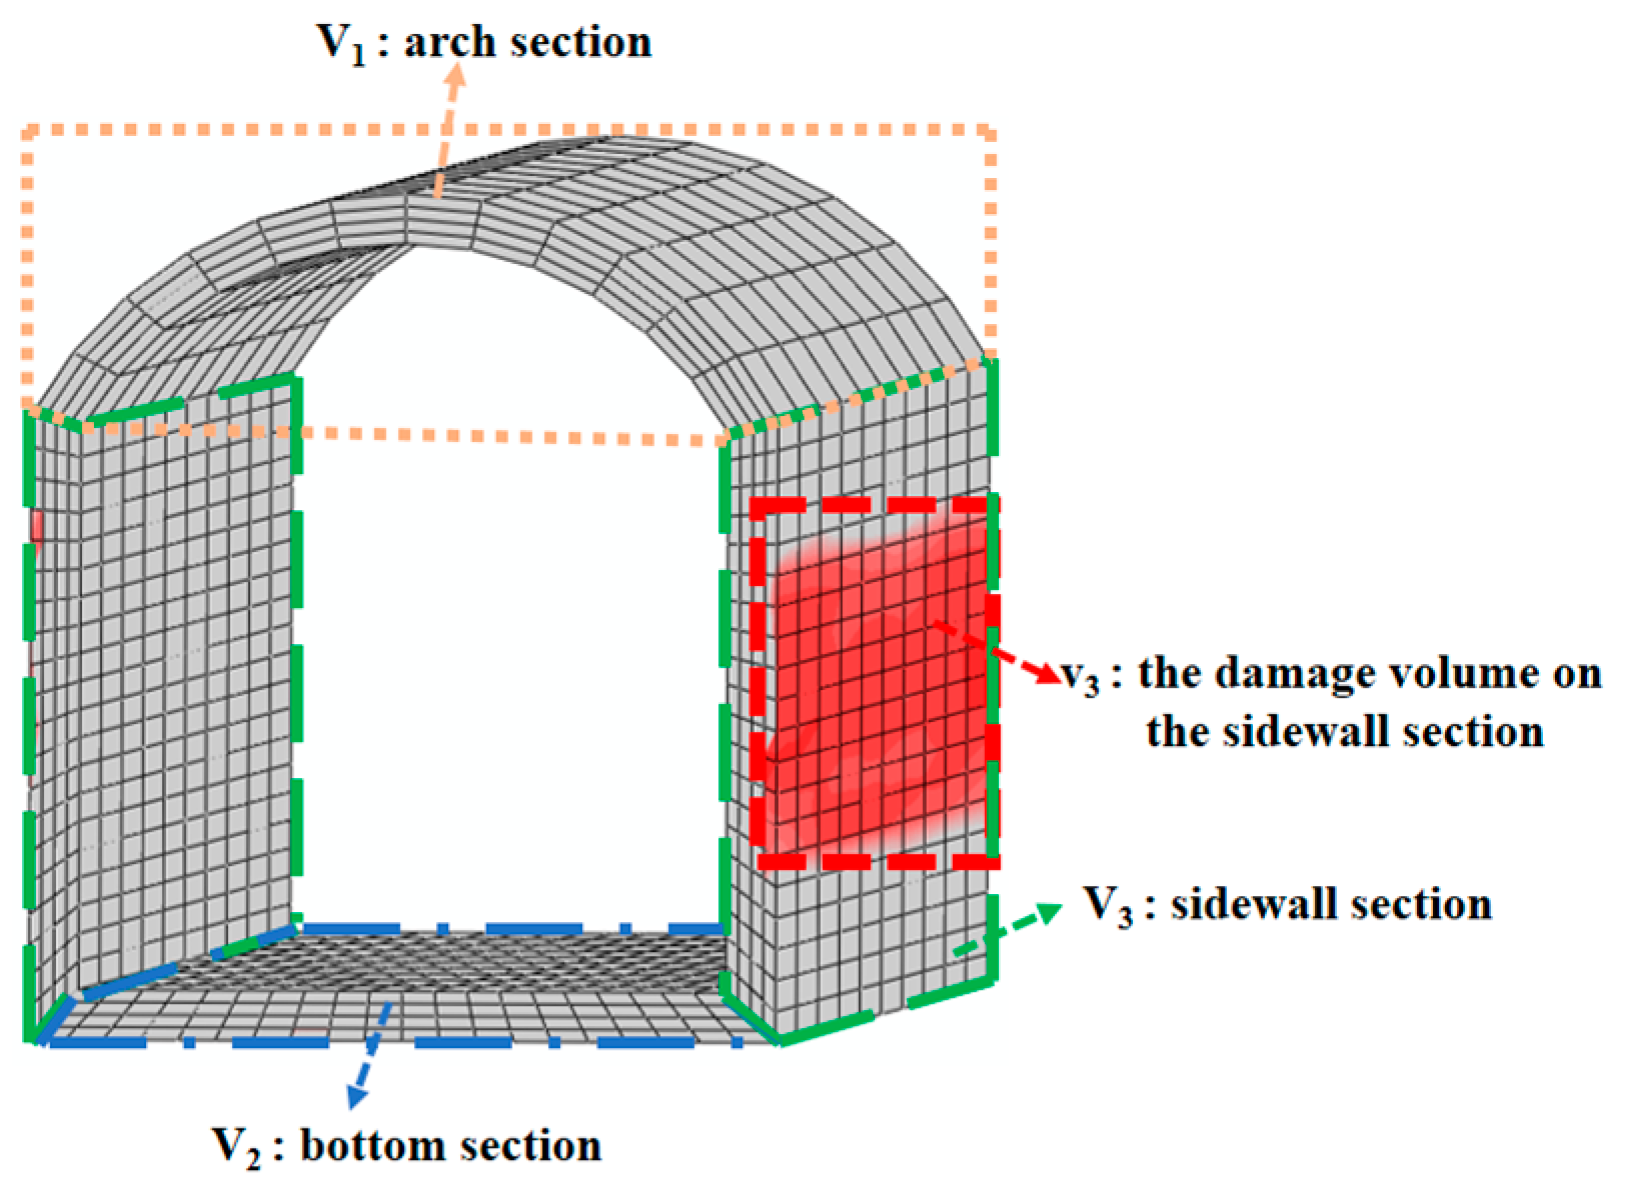
4.1. Finite Element Model

The commercial program ABAQUS was used to evaluate the influence of the duration of the pulse-type NFGMs on the structural response of a 60 m deep hydraulic arched tunnel. The detailed geometry of the three-dimensional (3D) FE model is shown in Figure 4. The outer dimensions of 15.30 m width and 17.15 m height were used in the concrete lining. Subsequently, a fluid element was added to this 3D-FE model to represent the fluid-structure-rock interaction (FSRI) system. Choosing an appropriate mesh size was crucial for the dynamic analysis. It is worth noting that the desirable range of the element size can be calculated by the seismic wave cut-off frequency range and shear wave velocity. According to the work of Lysmer and Kuhlemeyer [35], the largest size of the element should be between 1 / 10 of the transmitted wavelengths and 1 / 8 of the transmitted wavelengths, to minimize the element mesh size effect, which is calculated according to Equations (5) and (6). The maximum and minimum element sizes in the FSRI system are 5.0 m and 1.5 m respectively, which could reduce the element mesh size effect and capture the seismic wave progress in three geometric cases, as illustrated in Figure 4.
Δ l ( 1 8 ~ 1 10 ) λ s , min
λ s , min = V s v f max
Here, f max and V s v are the highest frequency of the input wave and the SV waves velocity, respectively.
To mitigate the dynamic boundary effect, this widely used technique introduces an artificial dynamic boundary and isolates the finite numerical computation area from the semi-infinite elastic medium [37,38]. According to Liu et al. [39], the viscous-spring boundary is used to model the elastic recovery capabilities of the semi-infinite medium and absorb the scattered wave during the dynamic analysis process. Additionally, when the viscous-spring boundary condition is utilized as the boundary condition, the GMs must be transformed into generalized nodal force at the truncated boundary nodes. In this study, our previous work validated the GM input mechanism, the initial load conditions, including the static loads and dynamic loads, and the numerical model [40,41].

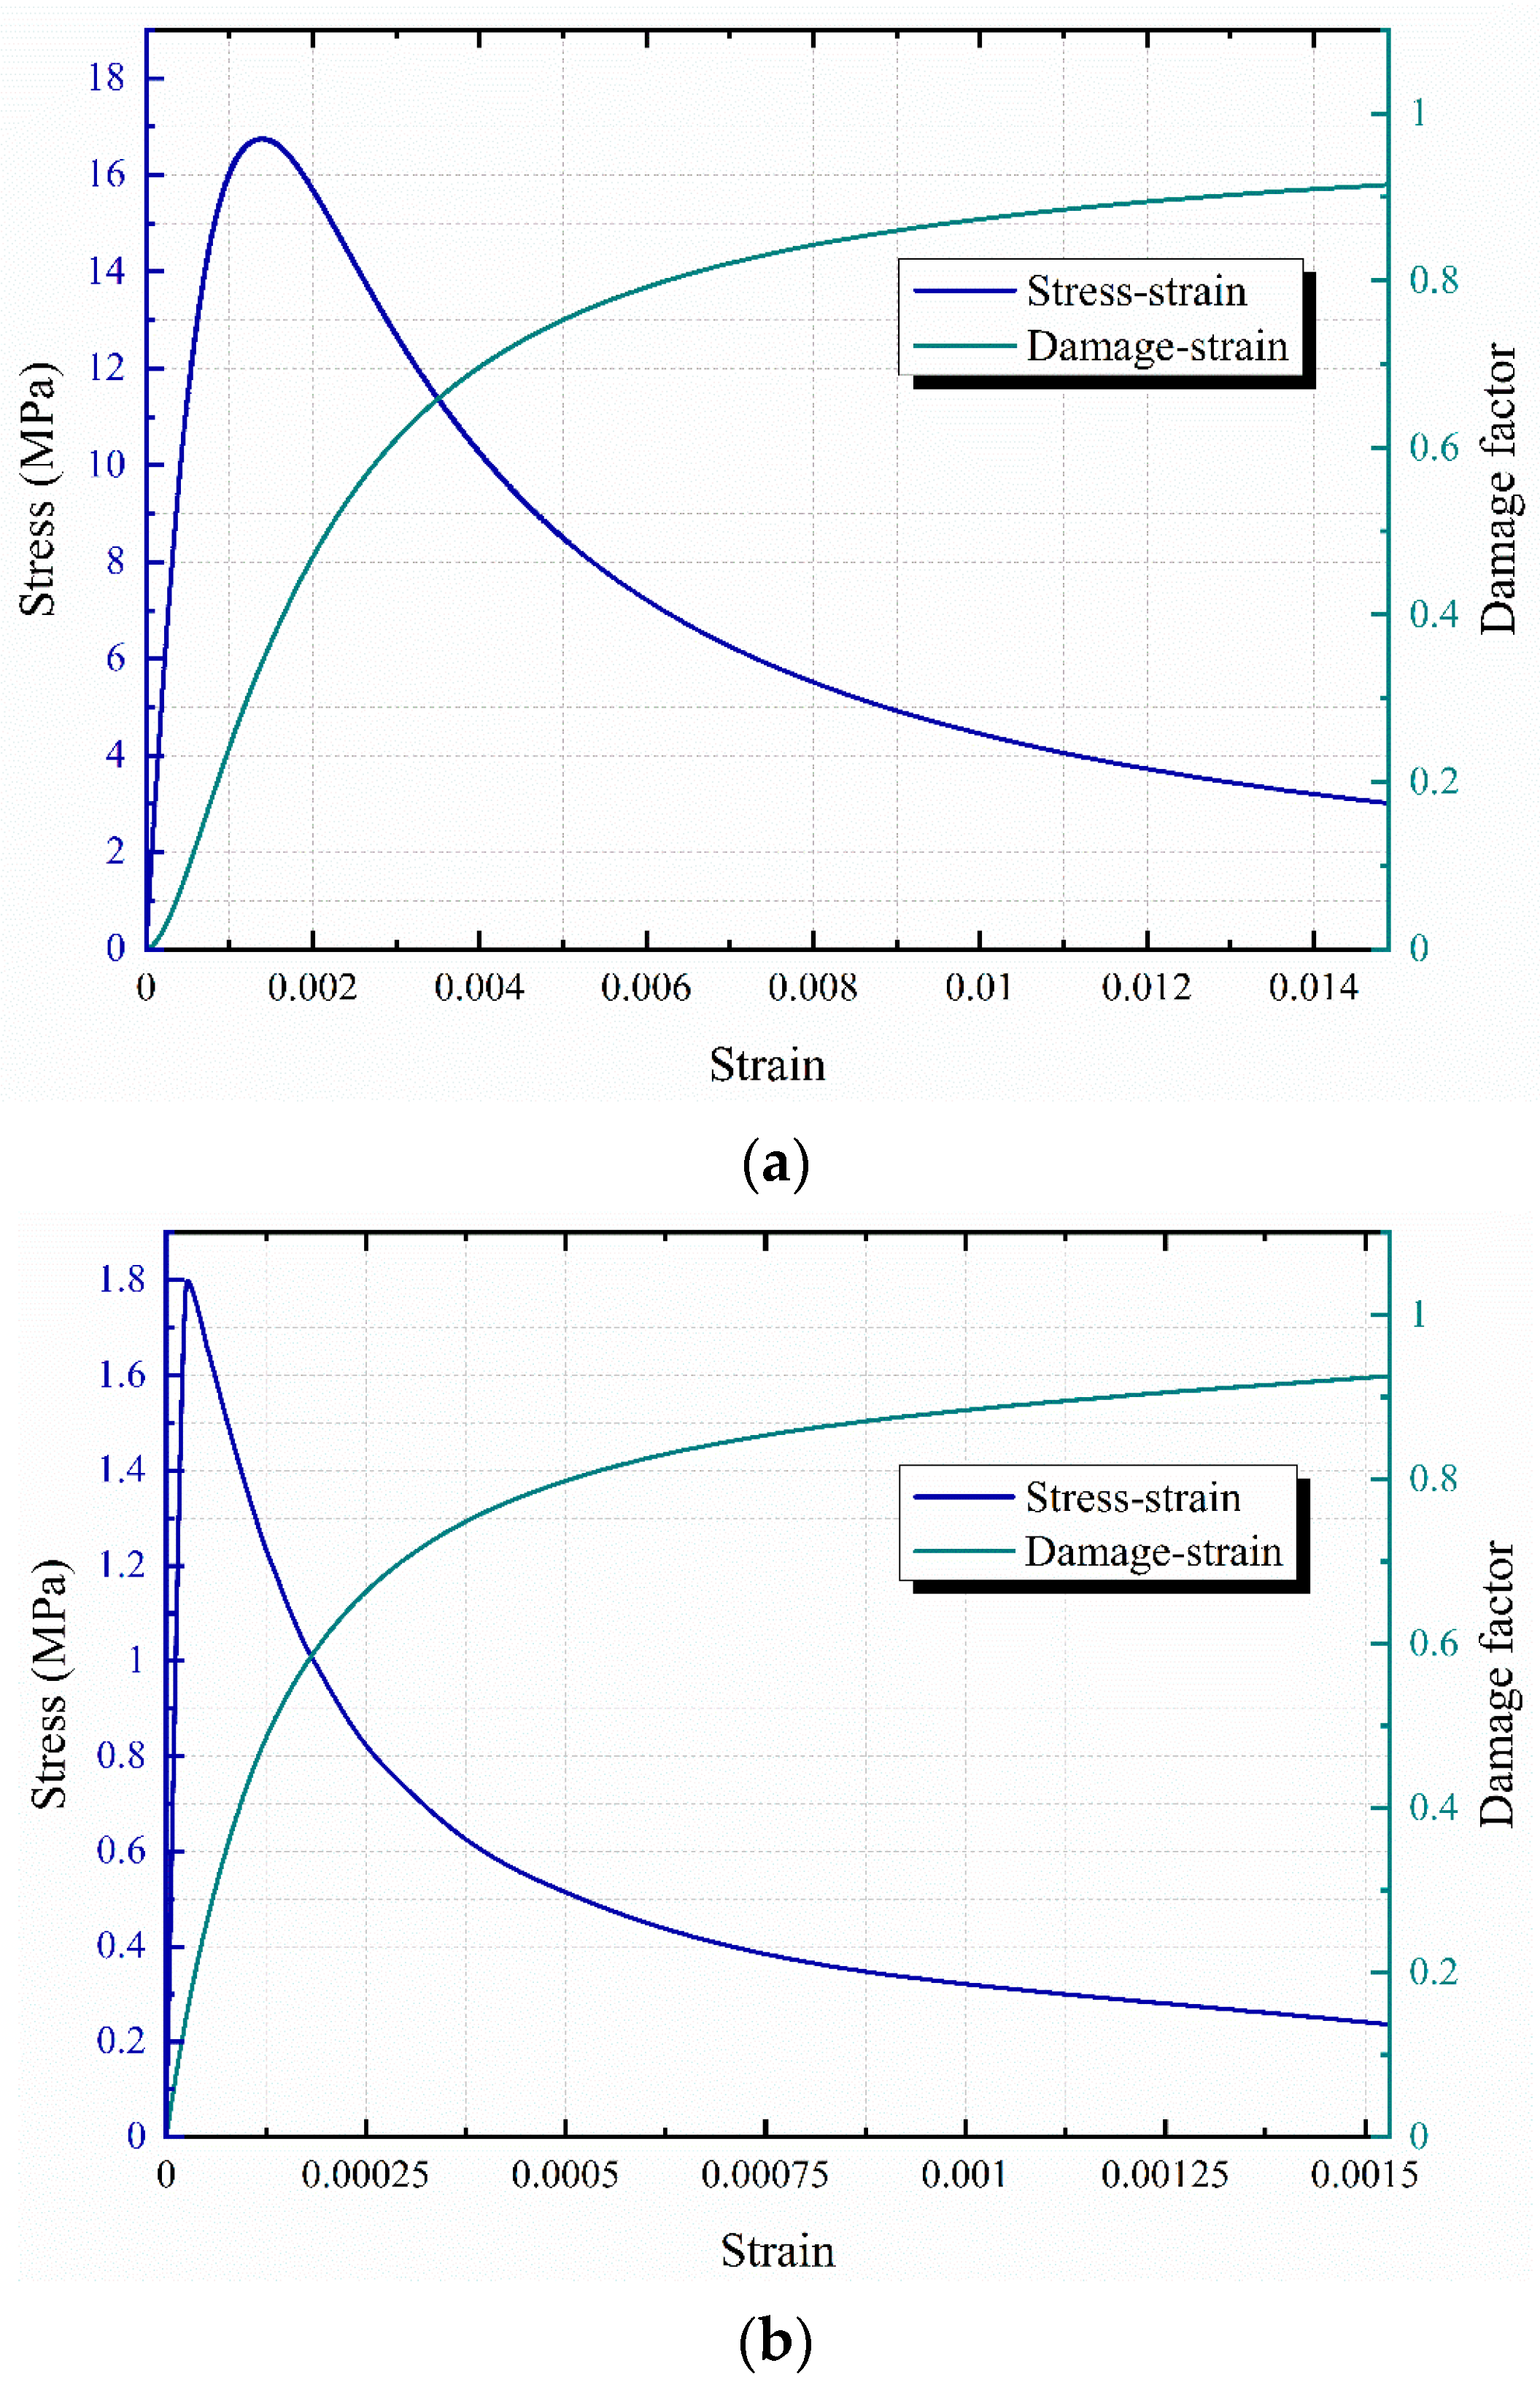
4.2. Constitutive Model and Fluid-Structure Interaction System

The elastic-plastic mechanical behavior of the surrounding rock is explained by using the well-known Drucker-Prager (DP) failure criterion, reflecting the cyclic dissipation and simulating the cyclic dissipation irreversible strain accumulation [25]. For the concrete lining of the hydraulic tunnels, it is well recognized that the efficiency of the adopted material behavior model in reflecting the material nonlinearity is directly related to the precision of the practical crack profile and damage mechanism of the cracked materials. The concrete plastic model (CPM) proposed by Lubliner et al. [42] was employed in this study. Referring to Sidoroff’s energy equivalent technique for the CPM, the mechanical property of the concrete lining is as shown in Figure 5.
During strong earthquakes, the adjoining rock and the lining will inevitably interact. By defining the surrounding rock master surface and the concrete lining slave surface, the penalty function algorithm can be selected to represent the dynamic interaction. At the same time, the average contact direction and tangential contact direction obey Hook’s law and Coulomb’s law, respectively. Moreover, the fluid element, which is supposed to be regarded as a linear elasticity that is inviscid and irrotational, is employed to distribute the compressible internal water [36]. Furthermore, the Lagrangian FE coupled equations are used to account for the FSI system, and a general three-dimensional stress-strain relationship for the fluid elements is as follows:
{ P P x P y P z } = [ C 11 C 22 C 33 C 44 ] { ε v w x w y w z }
where P , C 11 , and ε v are, respectively, pressure, bulk modulus, and volumetric strains; P i are rotational stresses ( i = x , y , z ); C 22 , C 33 , C 44 are constraint parameters and w i are rotations ( i = x , y , z ). Table 1 summarizes the material parameters of the surrounding rock, the concrete lining, and the fluid.

5. Numerical Results and Discussion

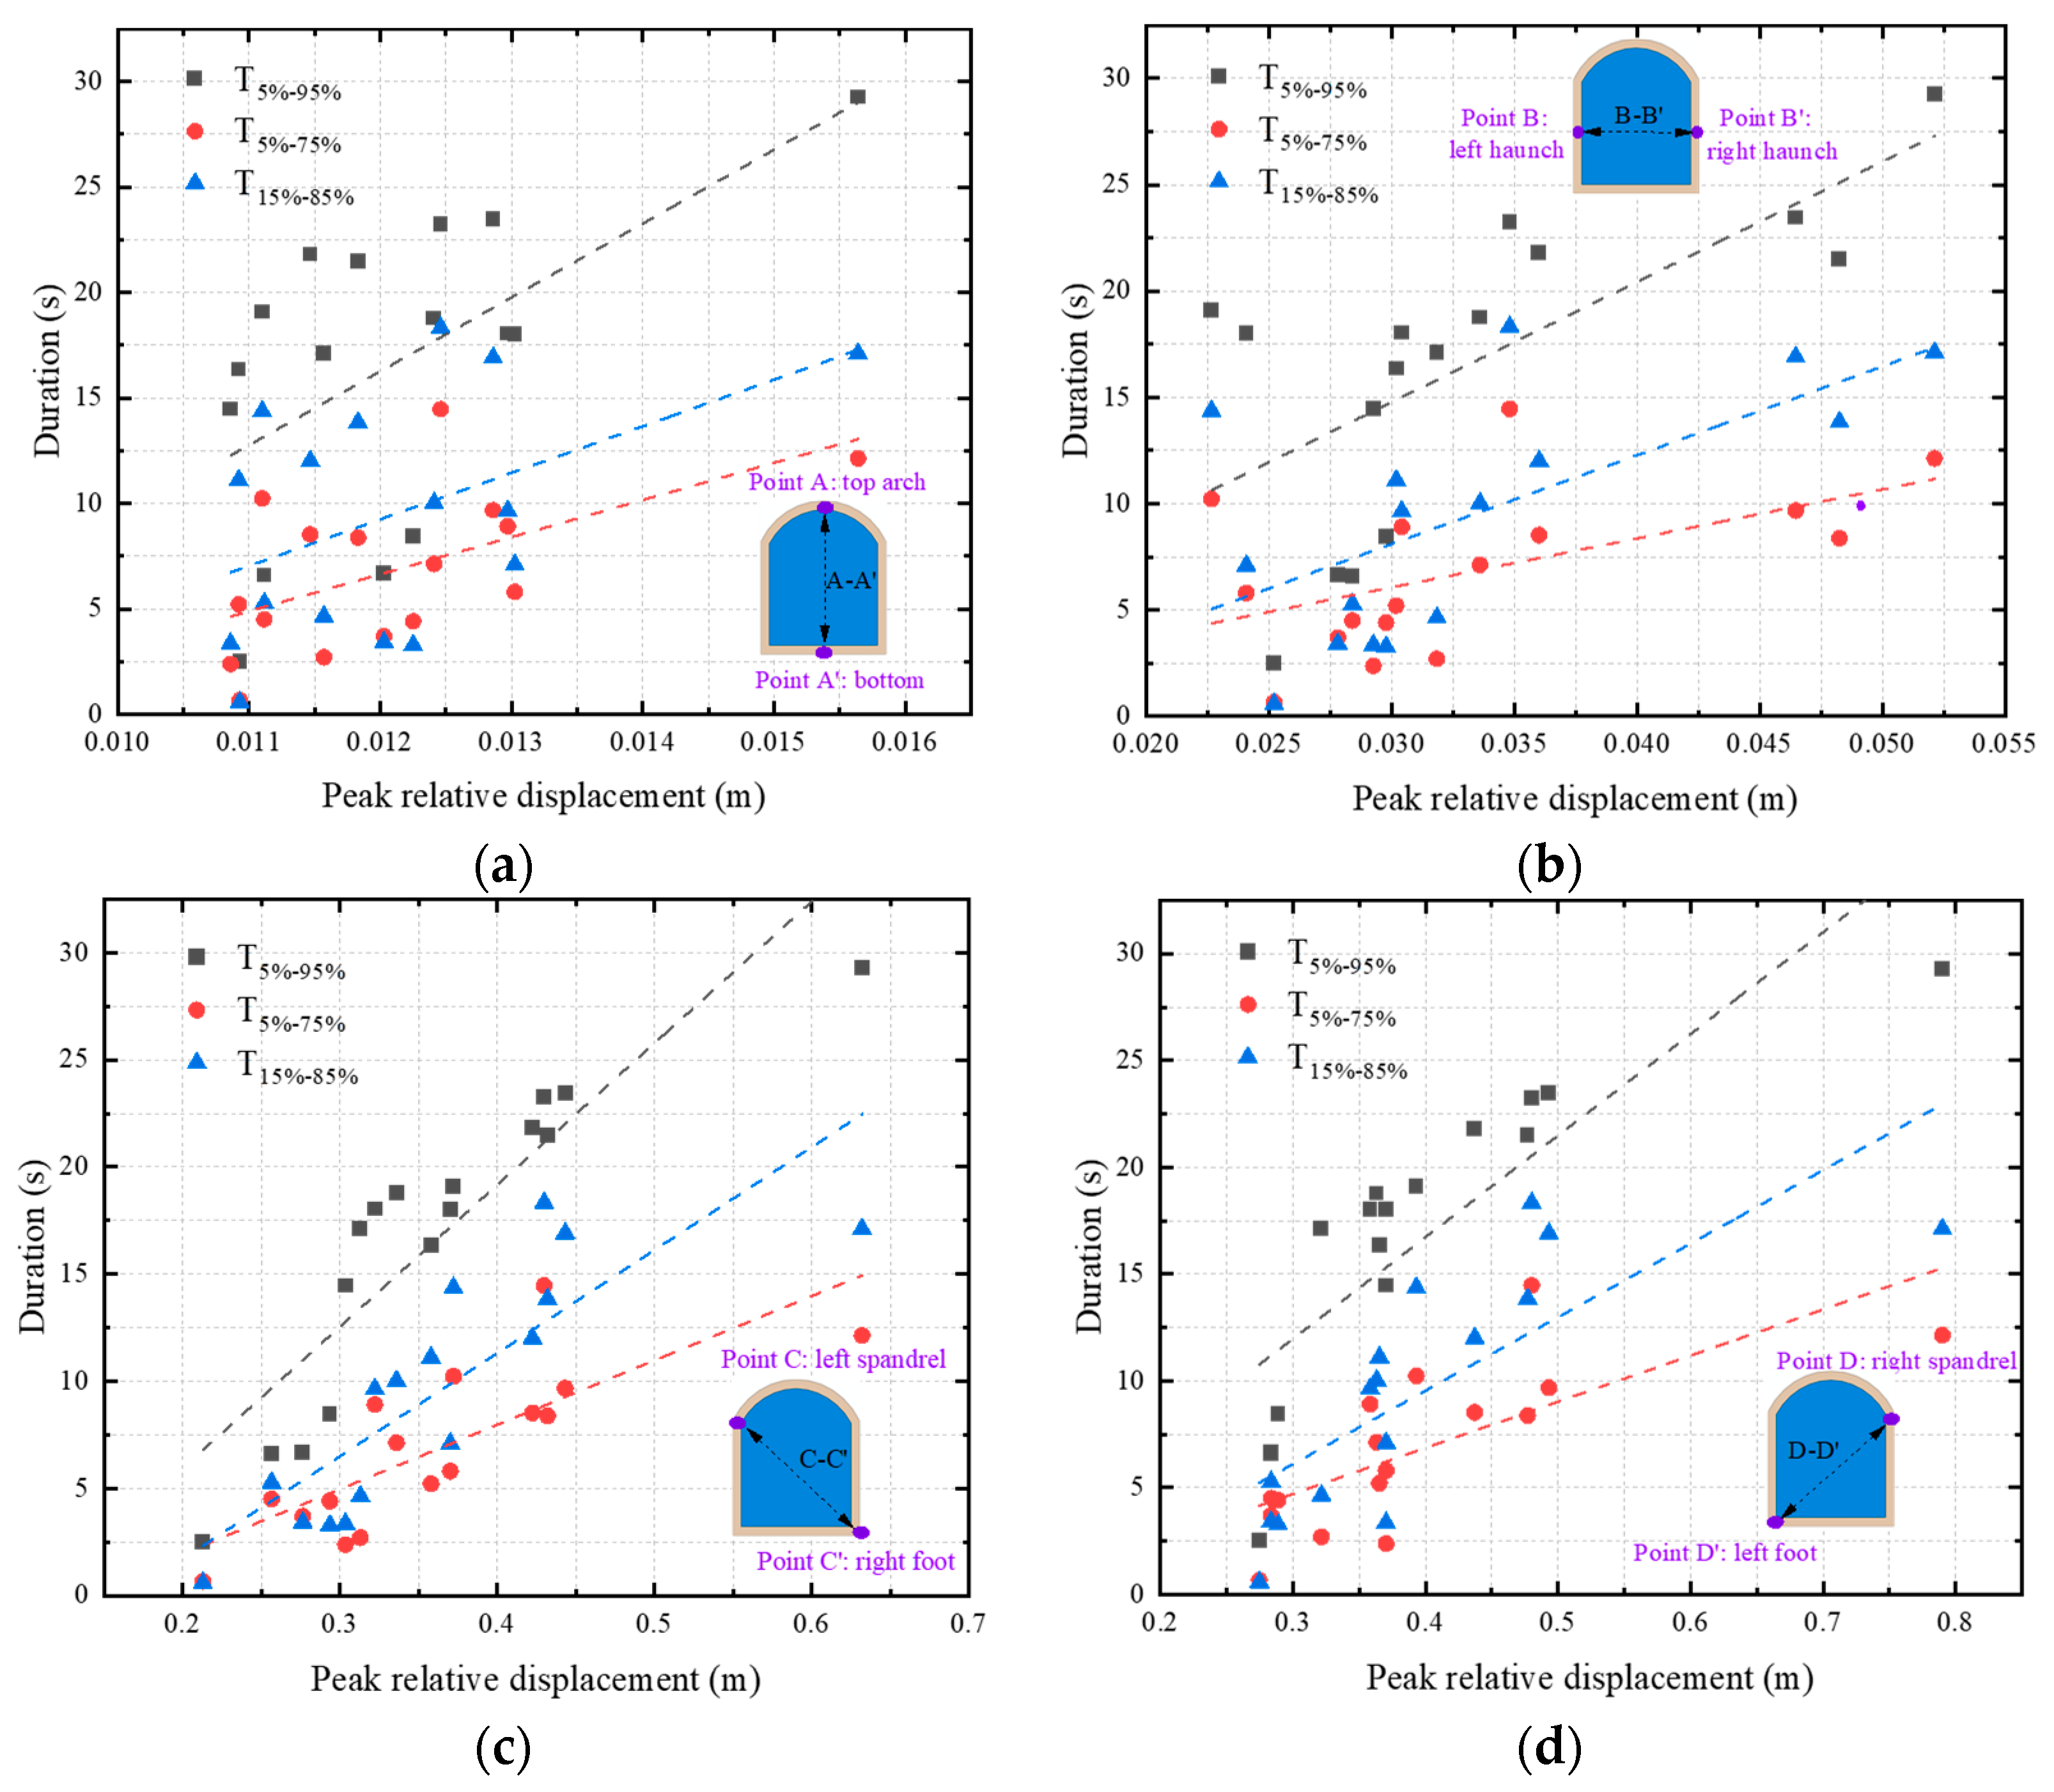
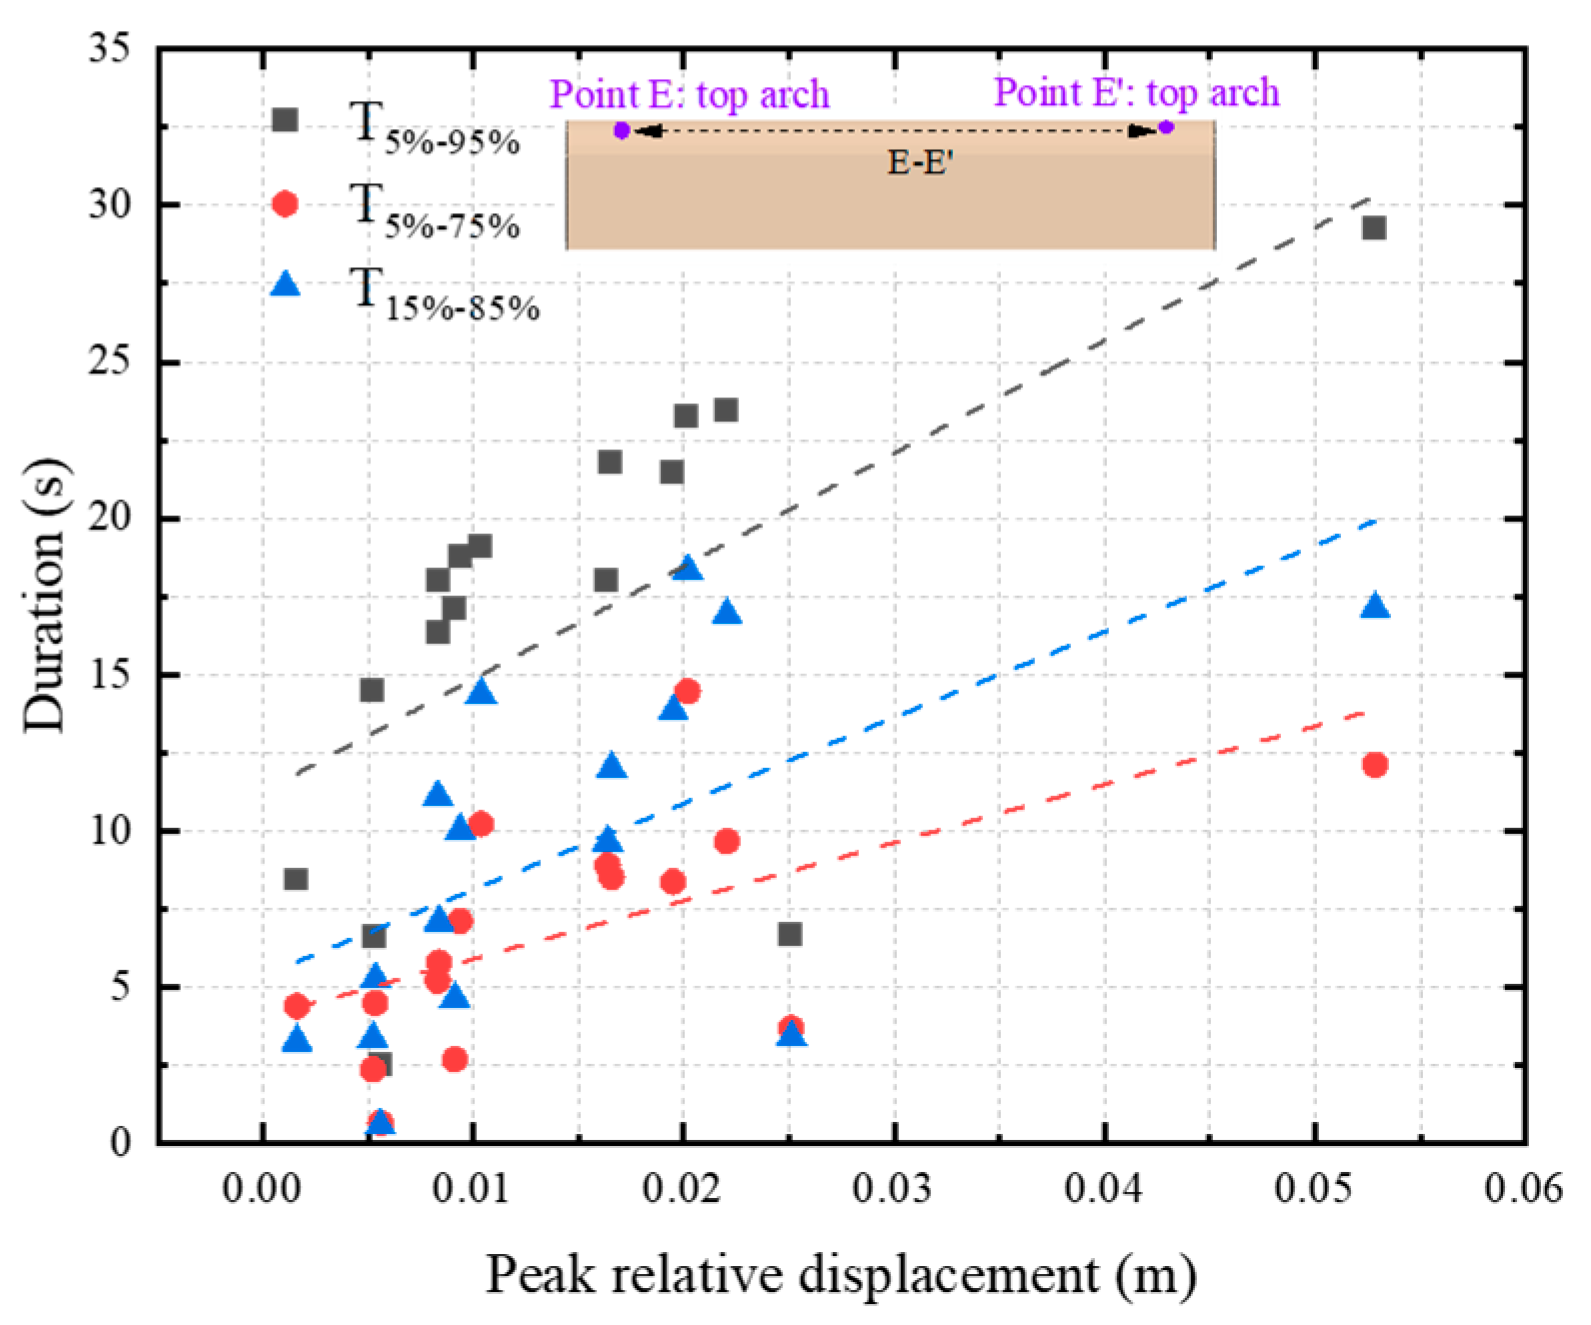
5.1. Identifying the Impact of Effective Velocity Duration on Maximum Relative Displacements

Following the inelastic dynamic analysis of the structure imparted by the 16 NFGMs for the same seismic intensity level, the section at the center of the tunnel was chosen as the typical research object. At the same time, the maximum response for each key reference point during the earthquake course was extracted and studied. The effect of the EVD on the peak relative displacements was examined by using a different fixed threshold value. We note that a linear correlation analysis between the EVD and the peak relative displacement was employed herein to identify a general tendency. The linear correlation analysis was also applied to the following section of the paper. As expected, the trend lines present a positive correlation among all relative peak displacements, which indicates that the relative peak displacement during the NFGMs with a longer EVD is prone to more considerable deformation than those under a shorter EVD for the given level of seismic intensity (see Figure 6). Moreover, changing the fixed threshold value of EVD did not alter the changing law of the trend line. It was also found that the NFGMs with a longer EVD would cause a larger longitude peak displacement compared to the hydraulic arched tunnels than the shorter EVD, as shown in Figure 7.

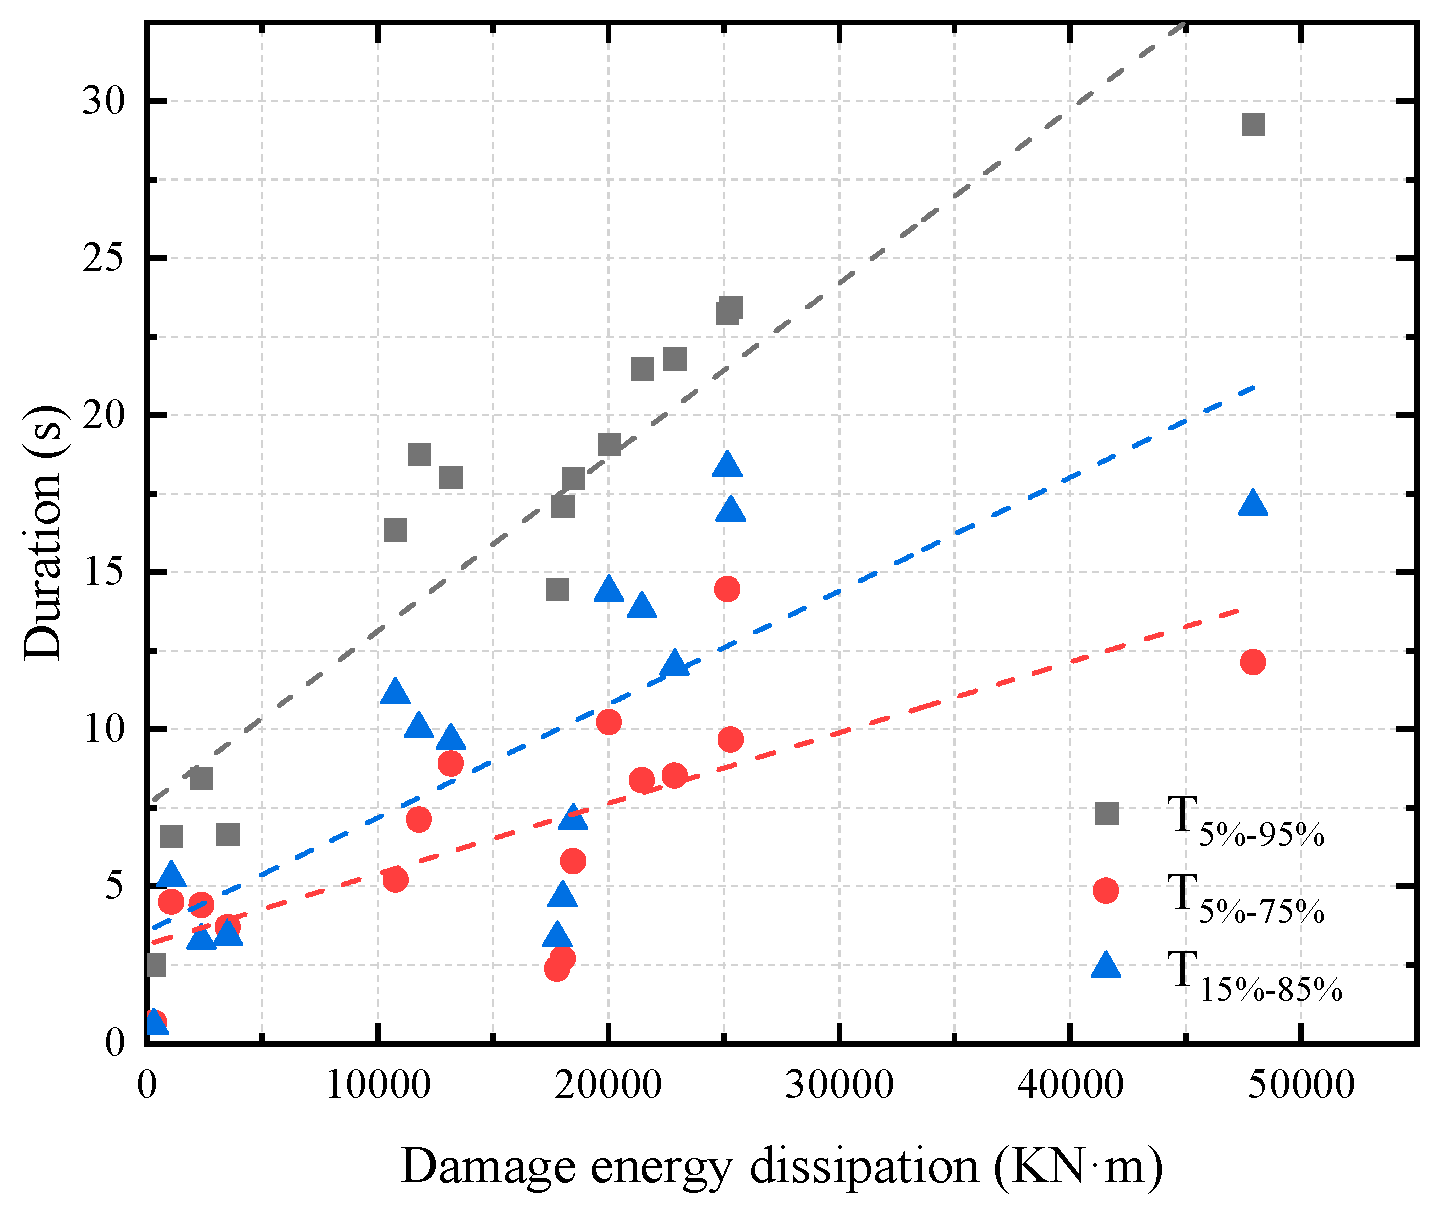
5.2. Identifying the Impact of Effective Velocity Duration on Accumulated Damage Patterns and Cumulative Damage Dissipation Energy

In the presented numerical analysis, the NF earthquake-induced accumulated damage crack patterns of the structure under different duration of NFGMs were generated by the CDP model, as shown in Figure 8. The color depth of the figure for the lining damage indicates the degree of damage. The darker patches were damaged first, and subsequently the cracks spread outward. Clearly, one main crack branch was triggered and propagated to the foot region through the longitudinal thickness of the concrete lining in the bottom region under the shorter NFGM excitations. The concrete lining showed slightly accumulated damage cracking for the top section, which means that shorter EVD earthquakes cannot induce severe damage to the structure. Moreover, as seen in Figure 8, the top section, the sidewall section, and the bottom section of the structure are particularly vulnerable to significant damage during prolonged EVD earthquakes. In addition, the damage energy dissipation index that can directly express the overall damage state of the concrete materials was employed to measure the effect of the EVD, as depicted in Figure 8. The connection between the cumulative damage energy dissipation of the concrete lining and the various EVDs is demonstrated in Figure 9. The damage energy dissipation of the concrete lining exhibited a strong link with EVD, despite the fact that the fixed threshold value had no influence on this effect. It should be noted that the seismic response of the hydraulic tunnel was affected by several ground motion intensity parameters, such as peak ground acceleration, peak ground velocity, Arias intensity specific energy density, etc. Generally, the degree of damage to the lining will increase with the increase of duration. However, special cases may occur due to the influence of other ground motion strength parameters.

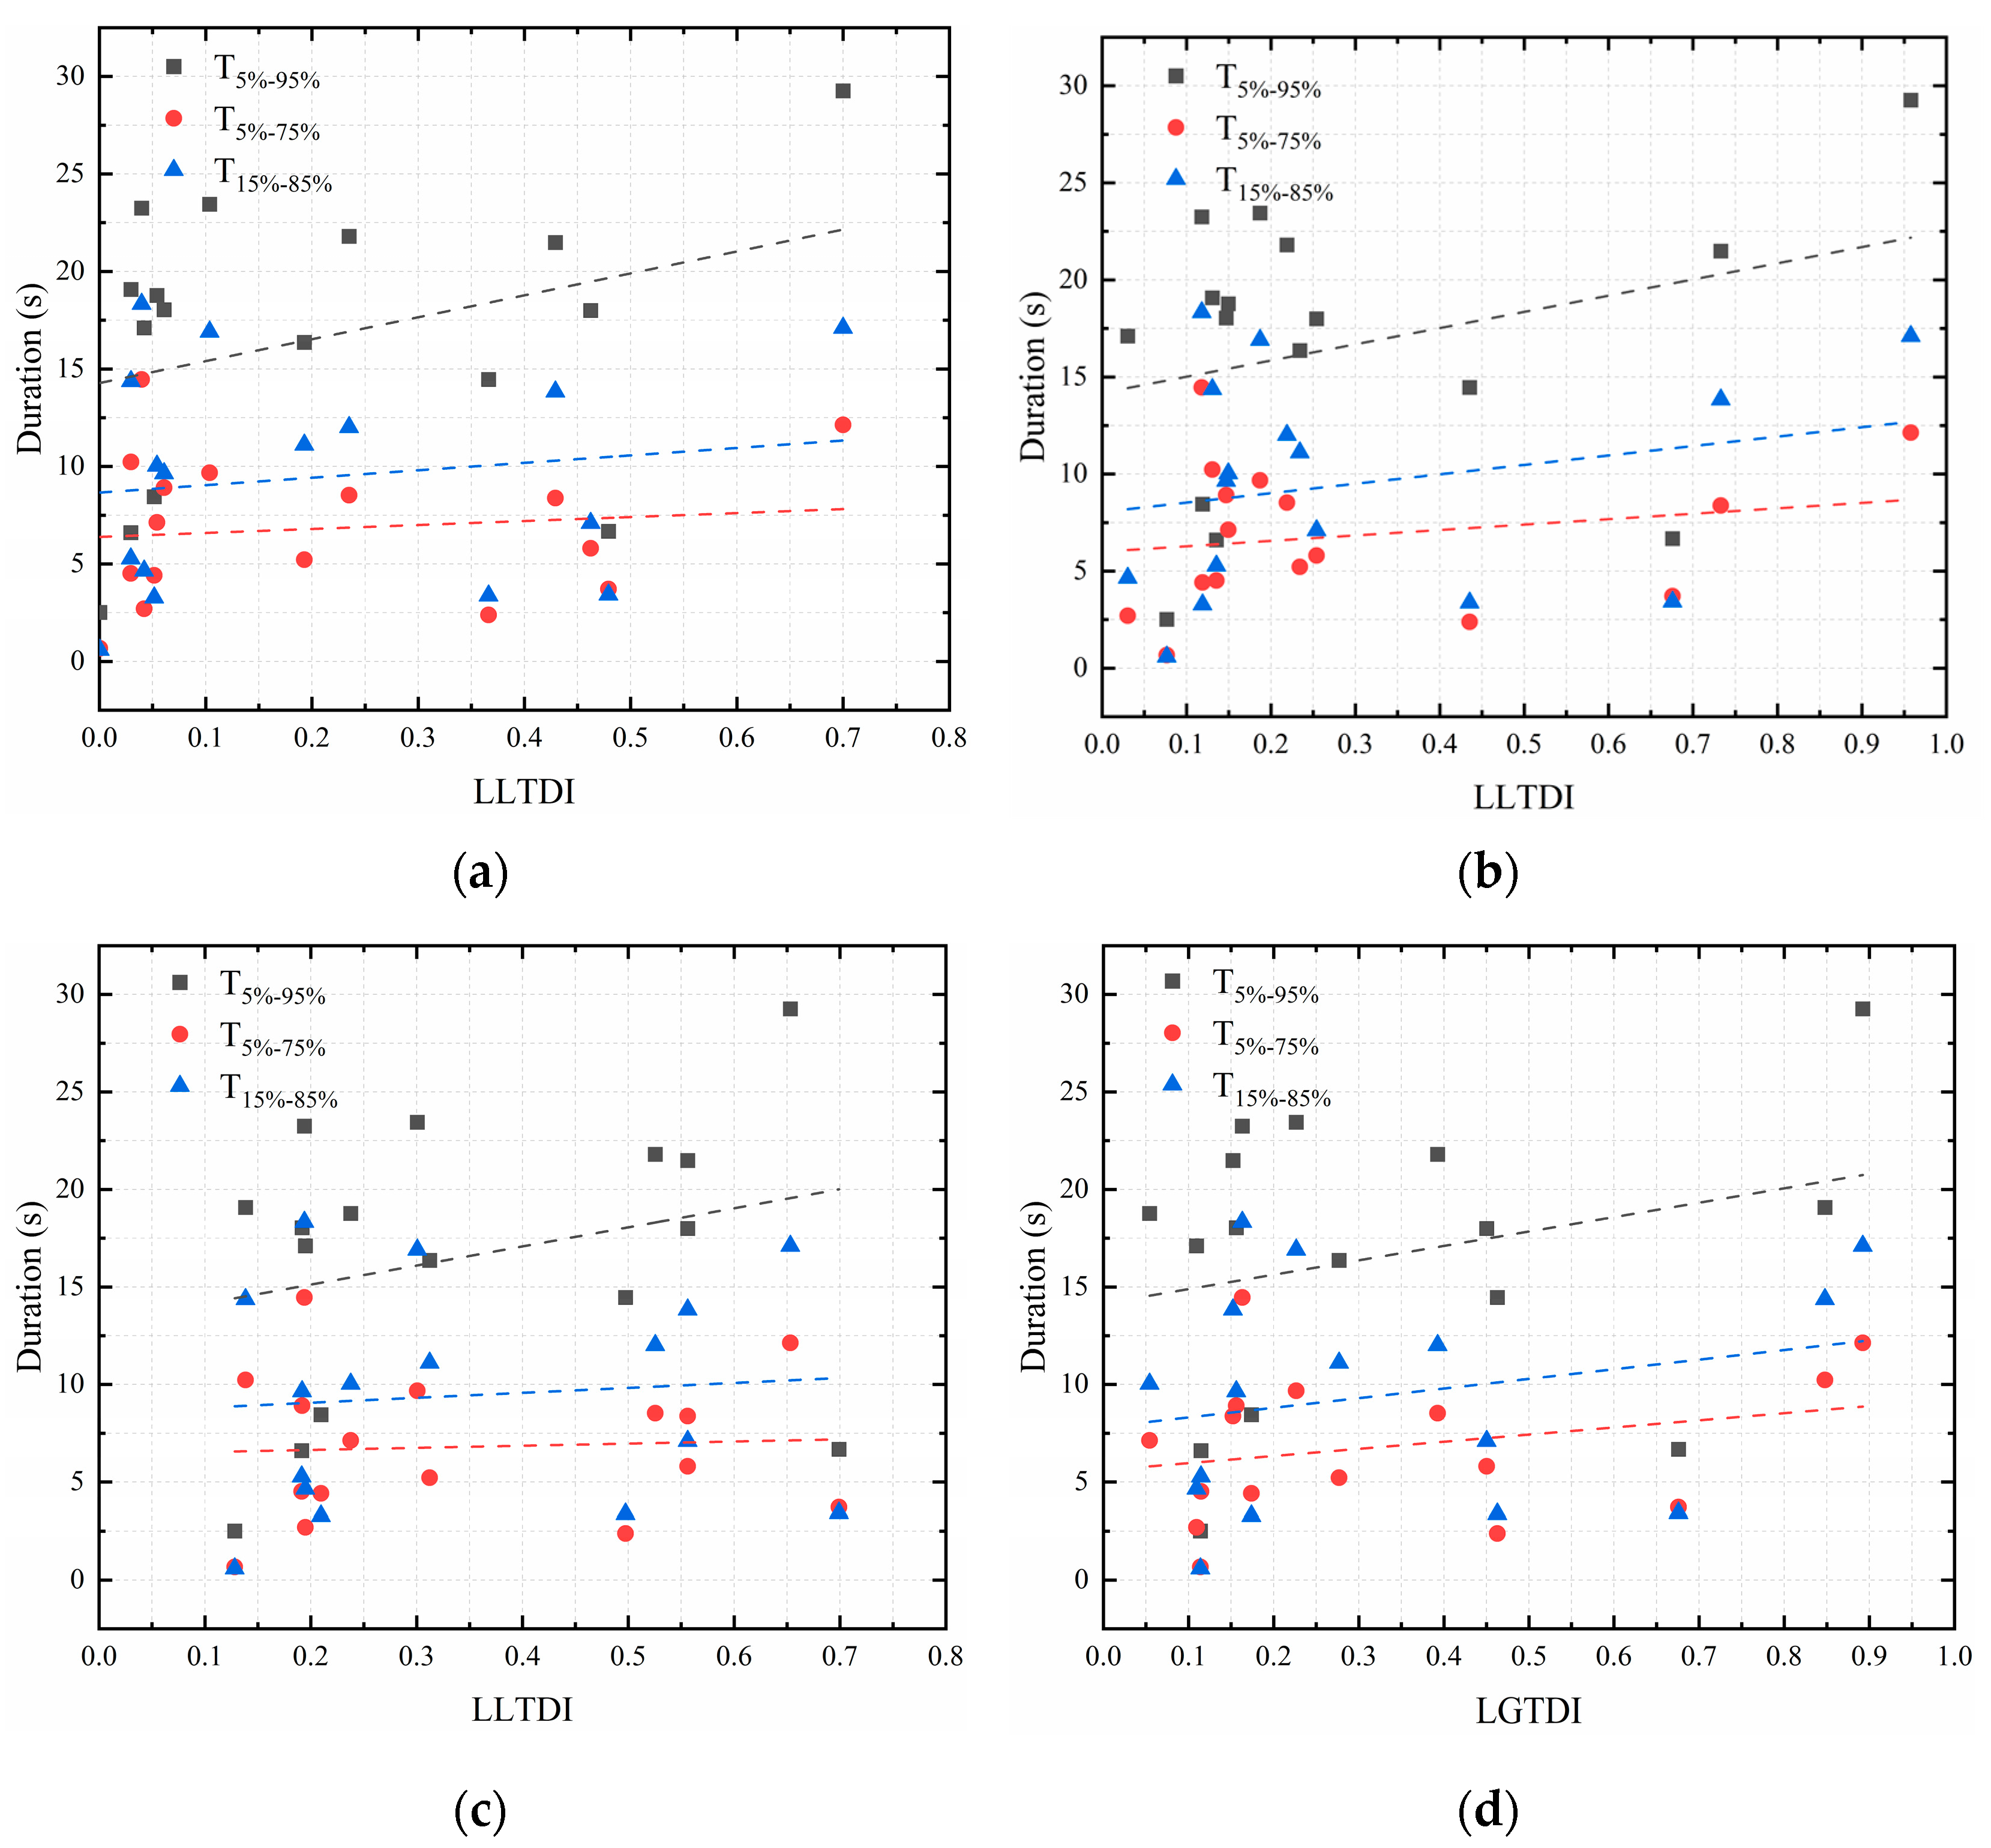
5.3. Identifying the Impact of Effective Velocity Duration on Damage Degree of Hydraulic Tunnels

It is critical to have an estimated damage index to completely analyze the degree of damage to both the local and the global linings when determining the spatial variation effect, as shown in Figure 10. Based on the work of Sun et al. [36], the detailed lining local tensile damage index (LLTDI) and the global tensile damage index (LGTDI) of the concrete lining are written as follows:
L L T D I V i = ( v i V i )
L G T D I = i = 1 n L L T D I V i E i i = 1 n E i
where v i is the damage cracking volume of crucial section i of the concrete lining; V i is the volume of crucial section i; E i is the element damage dissipation energy in the cracked element of crucial section i, and n is the number of crucial sections i. Based on the valuation of the degree of structural damage and lifeline performance of America [43], the damage level of the tunnel is divided into criteria, which are generally considered as follows: (1) DS1 (LGTDI = 0~0.09), the tunnel structure is in an elastic state and no damage has occurred; (2) DS2 (LGTDI = 0.09~0.15), the tunnel shows slight tensile damage; (3) DS3 (LGTDI = 0.15~0.5), the tunnel has moderate damage as the lining shows obvious cracks; (4) DS4 (LGTDI = 0.5~0.85), the tunnel shows severe tensile damage and the lining structure shows a large number of cracks and a large amount of dripping or spraying water along the cracks or weak structural surfaces, requiring the repair of the lining as a whole; (5) DS5 (LGTDI = 0.85~1), the lining is completely damaged and loses its functionality.
The connection between the degree of damage to the critical section and the overall section of the concrete lining and the various EVDs is demonstrated in Figure 11. Furthermore, the EVDs classified as 5% to 95% exhibit a significant correlation with the degree of damage to critical parts. At the same time, the other two fixed threshold values show a slight correlation. Nevertheless, as the EVD of the NFGM increases, the degree of damage of crucial sections still presents a gradually increasing trend. At the same time, it can be inferred that the limit range of the fixed threshold value may significantly affect the relationship between the EVD and the damage degree of the crucial sections. As shown in Figure 11d, the LGTDI for most of the concrete lining is between 0.09 and 0.5, and the lining is slightly or moderately damaged due to the limitations of the seismic intensity. Obviously, the maximum value of the LGTDI is 0.89 for the severely damaged lining, which has the longest effective velocity duration for the seismic input.

6. The Applicability of a Strong Duration Index and Reduced Earthquake Record

6.1. The Applicability of the Strong Acceleration Duration and Effective Velocity Duration with the Different Fixed Threshold Value

Global open-source databases of strong earthquakes, such as the PEER ground motion database, the European strong motion database, the Cosmos Virtual Data Center, and the BRI strong motion database, all contain at least one of the acceleration-type duration indexes BD, UD, SD, or ED. To facilitate rapid engineering application, it is a requirement to address the applicability of four widely used acceleration-type duration indicators to the dynamic response results of hydraulic arched tunnels. Moreover, this section determines the optimal upper and lower limits for the EVD’s set threshold values. The correlation coefficient between the duration index and the numerical results of the hydraulic arched tunnel is shown in Figure 12. Among the acceleration-type duration indicators, it was observed that the SD, based on the Arias energy, was highly correlated with the numerical findings of the hydraulic arched tunnels in the majority of cases. Conversely, the correlation between the duration of BD determined, based on the predetermined peak acceleration and numerical results, that they were the weakest. For the evaluation of the EVD, the fixed threshold values varied from 5% to 95% of the energy density, which was closely related to the numerical results. Meanwhile, it was also found, as shown in Figure 12, that the correlation coefficient under the EVD was almost the same as the correlation coefficient under the duration index of the SD, on average. In other words, the SD can be regarded as a substitute duration index for the dynamic response analysis of the hydraulic tunnels.

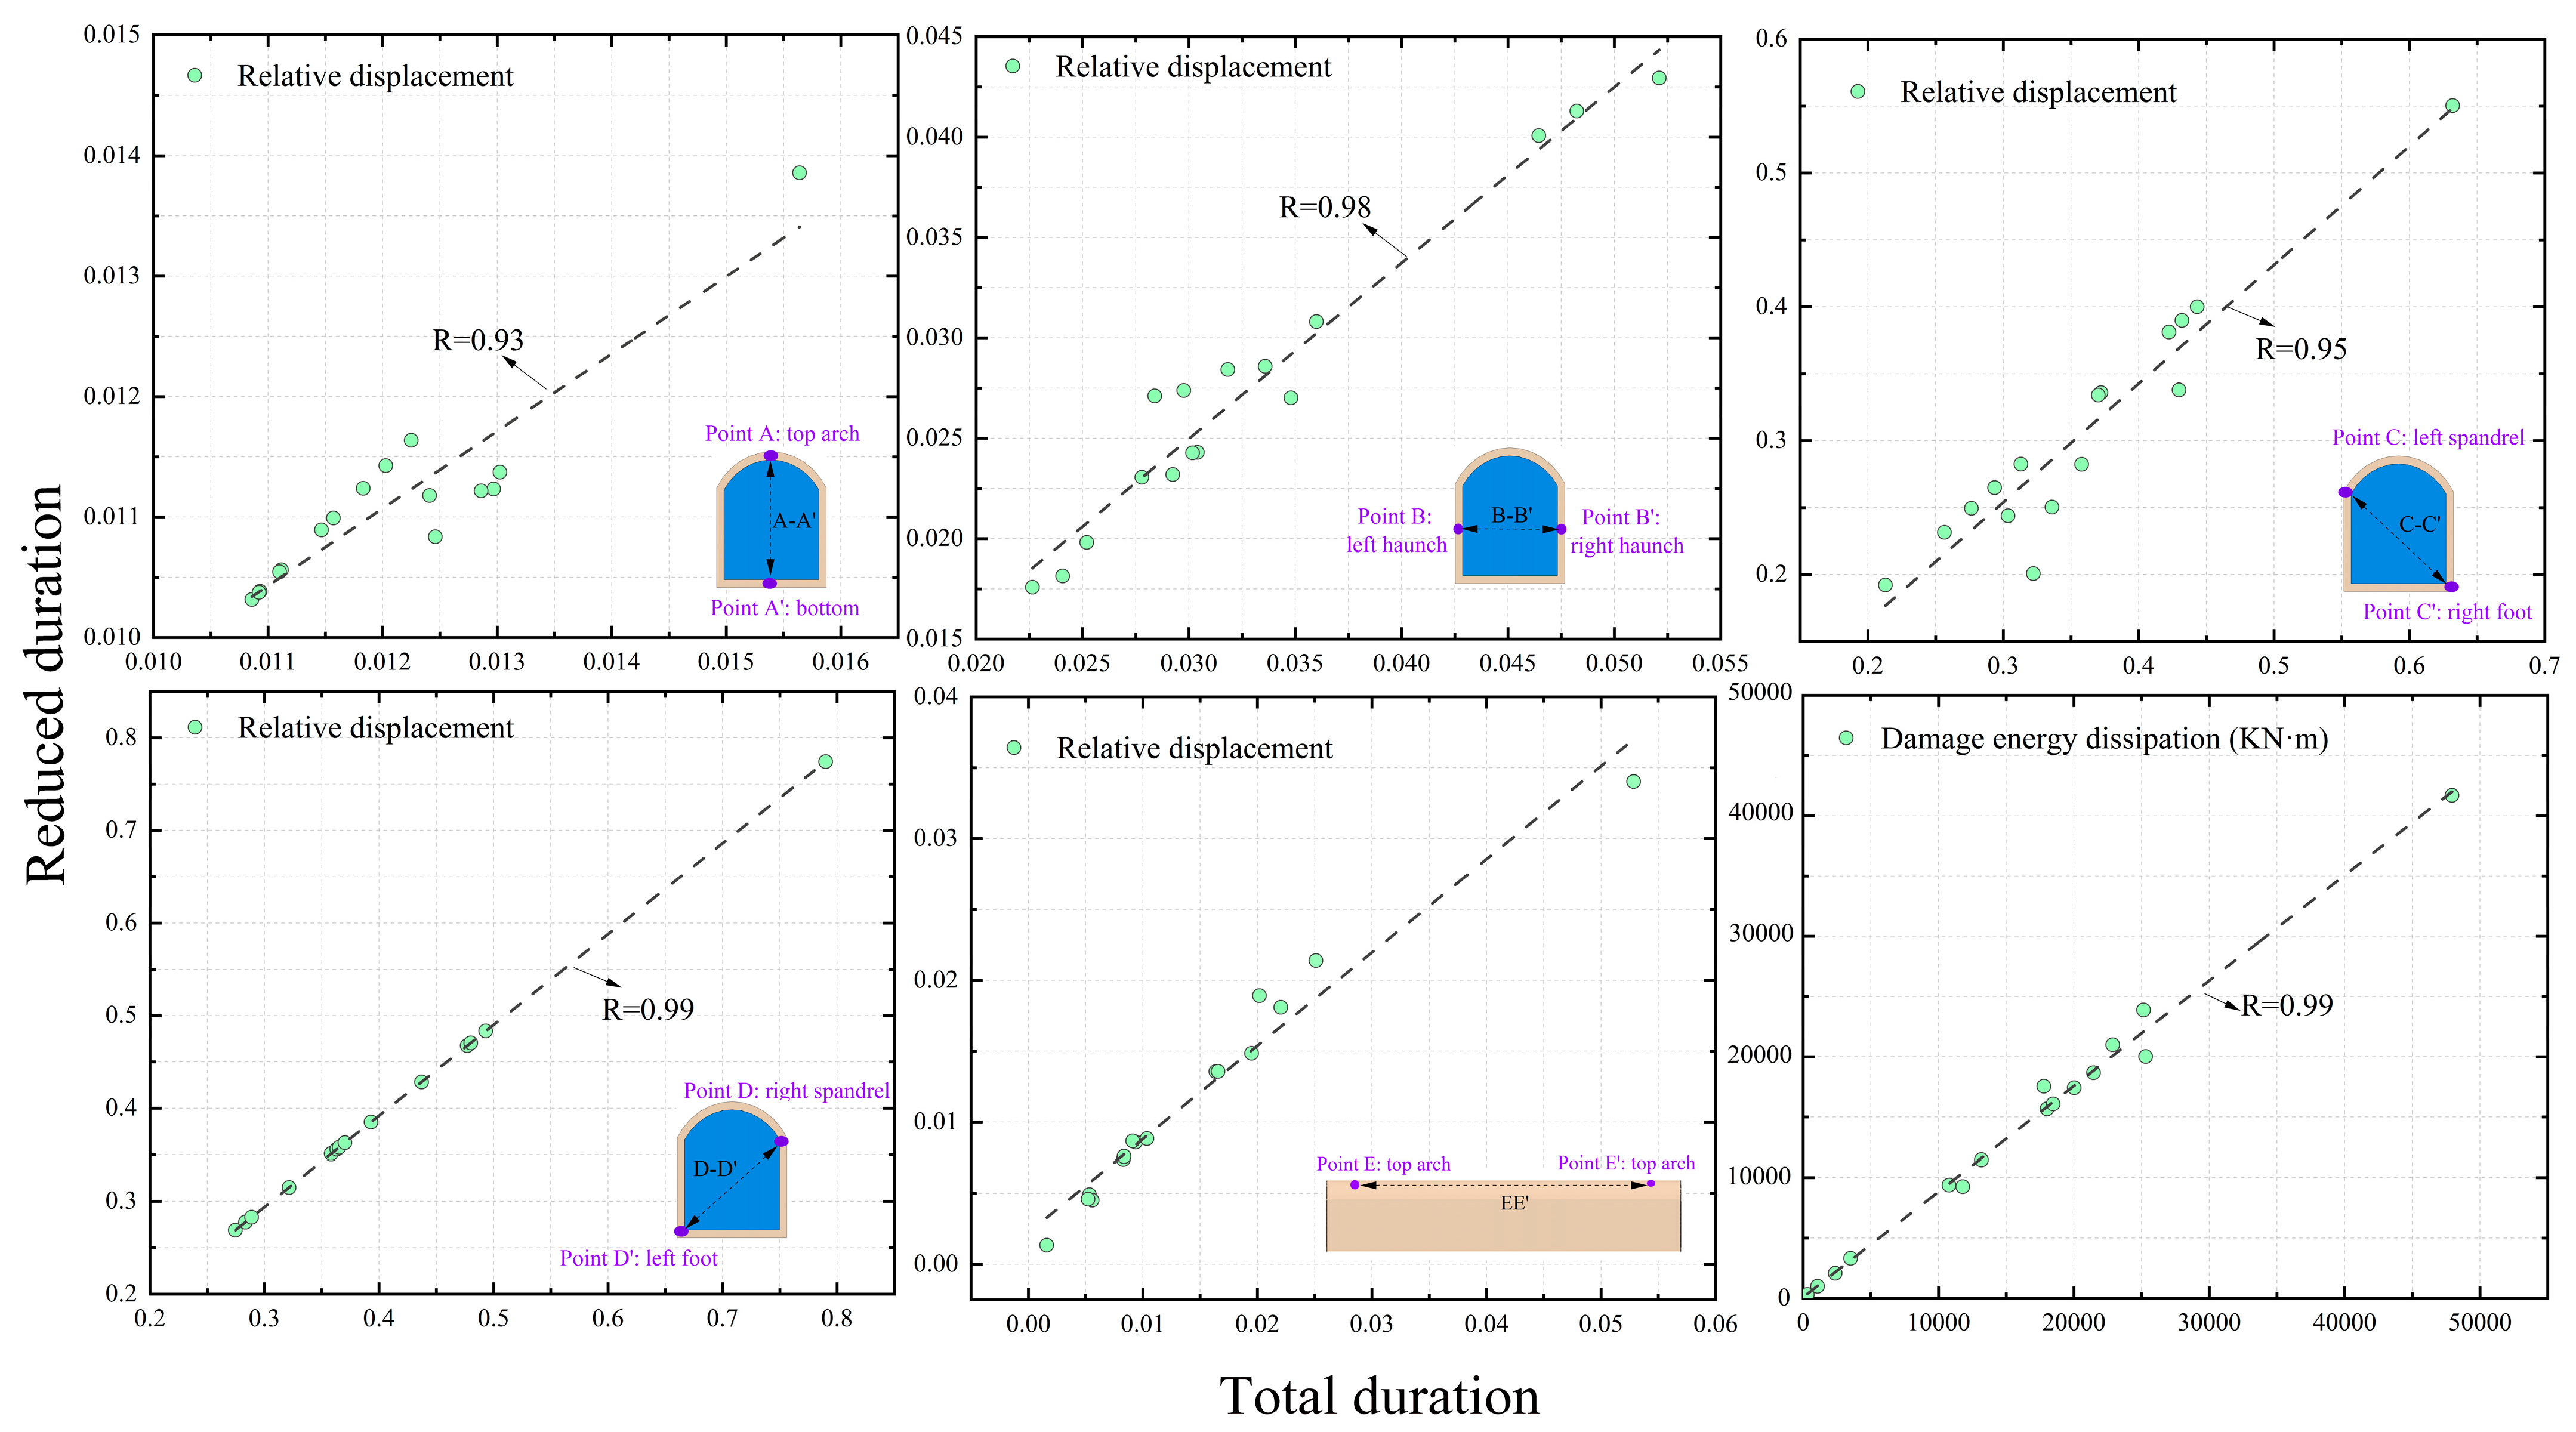
6.2. The Applicability of the Reduced Time-History Methodology of Earthquake Records

Considering the correlation coefficients of different fixed threshold values of the EVD in the abovementioned numerical results, the suggested reduced time-history approach of the truncated earthquake records, the EVD 5–95% should be used in the dynamic analysis of hydraulic arched tunnels that are exposed to the time-history earthquake records covered by the fixed threshold values of 5–95% in Figure 13.
Furthermore, the comparison of the results for every reduced duration and the total duration is also presented in Figure 13. It is seen that the duration of the shortened time-history approach was much less than the total time for all earthquake recordings. Specifically, as shown in Figure 2p, the full-duration and EVD 5–95% of earthquakes were 90 s and 23.25 s, respectively. It takes three days to calculate the 3D hydraulic tunnel using full-duration seismic when ABAQUS calculates with 4 ints of CPU, but the same calculation for EVD 5–95% of earthquakes takes less than a day to calculate. As such, the consumption calculation cost required for the dynamic response analysis using the total duration of the earthquake records is far greater than the reduction of the time course. As a result, it is still to be determined whether the hydraulic arched tunnel’s inelastic dynamic response is feasible under the restricted time-history earthquake recordings.
In Figure 14, the numerical findings for the as-recorded NFGMs are compared to the peak value of the hydraulic arched tunnel’s time-history curves during the seismic excitation. It is evident that the accuracy gained from the inelastic time-history analysis using EVD 5–95% is excellent for all peak values. Specifically, the reduced time-history of the as-recorded NFGMs can be used to replace the full time-history of the as-recorded NFGMs. Furthermore, an obvious advantage is that the full time-history is reduced to a short time-history yet is still in compliance with high precision, which brings convenience for the seismic design practice and seismic performance assessment of tunnels.

7. Summary and Conclusions

The duration of the pulse-type near-fault ground motions (NFGMs) has a significant effect on the nonlinear dynamic response and degree of damage in an hydraulic arched tunnel-water-surrounding rock dynamic interaction system. Firstly, the concept of the effective velocity duration (EVD) index, according to the specific energy density was explained, considering the duration of the low-frequency velocity impulse and the energy released from the velocity time-history. The dynamic interaction system was then subjected to a variety of time-history investigations to reveal the effect of the EVD on the structural response. Subsequently, the most efficient EVD of the limit value and the replaceable acceleration-type duration indicator was discussed. Finally, the feasibility of replacing the reduced ground motion records defined by the EVD duration index for the full-time ground motion records was established. The following conclusions could be drawn from the calculation results:
(1) The correlation analysis results showed that the EVD positively correlates to the maximum relative displacement, which means that the longer the NF earthquake excitation time, the easier it is to cause more considerable deformation and instability to the tunnel. Furthermore, the impacts of the EVD on the cumulative damage pattern were investigated using the concrete damage plasticity model, which simulated the softening and strain hardening behaviors of concrete materials. According to the cracking profiles, it could be deduced that in the majority of instances, the concrete lining exhibited minor cumulative damage and cracks in the bottom and top sections, with a tendency to grow to the sidewall portion as the EVD rose;
(2) The presented three fixed threshold values (5–75%, 15–85%, and 5–95%) of the EVD index could successfully capture the duration of the low-frequency velocity impulse and most of the energy released by strong NFGMs. The link between maximum relative displacement and damage indices was strongest between the 5–95% fixed threshold values evaluated. As a consequence, the fixed threshold value of EVD between 5–95% is proposed as the most appropriate duration measurement for characterizing the duration of the pulse-like NFGMs. Moreover, for the convenience of engineering applications, significant duration indicators can be considered as a backup option for near-fault effective duration indicators to identify the impact of the ground motion duration;
(3) To undertake an efficient and fast analysis of the dynamic response, a simplified time-history technique was provided that covered the time-history range of EVD 5–95% of the original NFGMs. Subsequently, the reduced time history of the NFGMs wass then applied to the inelastic dynamic analysis of the hydraulic arched tunnel, and the computational findings suggested that the reduced and original NFGM records were similar, indicating that the time-history of the original NFGMs can be replaced by the reduced time-history of the NFGMs and employed to predict the structural response with a high efficiency and high precision.

Author Contributions

Conceptualization and methodology, W.L. and B.S.; software, B.S.; validation, B.S., S.Z. and C.W.; formal analysis, W.L. and B.S.; investigation, W.C.; resources, X.Z.; data curation, W.L. and B.S.; writing—original draft preparation, B.S.; writing—review and editing, W.L. and B.S.; supervision, B.S and S.Z.; project administration, B.S. All authors have read and agreed to the published version of the manuscript.

Funding

National Natural Science Foundation of China (No. 52009126 & No. 52209169).

Institutional Review Board Statement

Not applicable.

Informed Consent Statement

Not applicable.

Data Availability Statement

Not applicable.

Conflicts of Interest

The authors declare no conflict of interest.

Appendix A

Table A1. The main information of 16 as-recorded NFGMs is considered in this investigation.
No.EarthquakeStation LocationYearMwRrup (km)TB
(0.05 g)
TU (0.05 g)TS
(90%)
TE
(90%)
1San FernandoPacoima Dam (upper left abut)19716.611.8114.635.657.37.0
2Coyote LakeGilroy Array #619795.743.112.45.034.04.2
3Imperial Valley-06Aeropuerto Mexicali19796.530.3412.445.967.57.26
4Imperial Valley-06Brawley Airport19796.5310.424.716.914.915.2
5Imperial Valley-06El Centro Array #1119796.5312.565.111.49.09.4
6Imperial Valley-06El Centro Array #319796.5312.855.514.814.111.7
7Imperial Valley-06El Centro Differential Array19796.535.094.611.87.06.9
8Cape MendocinoPetrolia19927.018.185.118.717.717.7
9LandersBarstow19927.2834.866.429.621.321.1
10LandersYermo Fire Station19927.2823.627.623.018.917.4
11Northridge-01LA Dam19946.695.923.88.06.56.5
12KocaeliGebze19997.5110.923.97.98.27.5
13Chi-ChiTCU05319997.625.959.428.527.721.8
14Chi-ChiTCU05419997.625.2816.731.825.524.0
15Chi-ChiTCU05619997.6210.4818.034.531.826.2
16Chi-ChiTCU06019997.628.518.628.626.721.3

References

  1. Sun, B.; Zhang, S.; Deng, M.; Wang, C. Nonlinear dynamic analysis and damage evaluation of hydraulic arched tunnels under mainshock–aftershock ground motion sequences. Tunn. Undergr. Space Technol. 2020, 98, 103321. [Google Scholar] [CrossRef]
  2. Wang, X.; Chen, J.; Xiao, M. Seismic damage assessment and mechanism analysis of underground powerhouse of the Yingxiuwan Hydropower Station under the Wenchuan earthquake. Soil Dyn. Earthq. Eng. 2018, 113, 112–123. [Google Scholar] [CrossRef]
  3. Kitayama, S.; Constantinou, M.C. Implications of strong earthquake ground motion duration on the response and testing of seismic isolation systems. Earthq. Eng. Struct. Dyn. 2020, 50, 290–308. [Google Scholar] [CrossRef]
  4. Wang, G.; Wang, Y.; Lu, W.; Zhou, W.; Zhou, C. Integrated duration effects on seismic performance of concrete gravity dams using linear and nonlinear evaluation methods. Soil Dyn. Earthq. Eng. 2015, 79, 223–236. [Google Scholar] [CrossRef]
  5. Ou, Y.-C.; Song, J.; Wang, P.-H.; Adidharma, L.; Chang, K.-C.; Lee, G.C. Ground Motion Duration Effects on Hysteretic Behavior of Reinforced Concrete Bridge Columns. Eng. Struct. 2014, 140, 04013065. [Google Scholar] [CrossRef]
  6. Green, R.A.; Terri, G.A. Number of Equivalent Cycles Concept for Liquefaction Evaluations—Revisited. J. Geotech. Geoenviron. Eng. 2005, 131, 477–488. [Google Scholar] [CrossRef]
  7. Li, T. Damage to mountain tunnels related to the Wenchuan earthquake and some suggestions for aseismic tunnel construction. Bull. Eng. Geol. Environ. 2011, 71, 297–308. [Google Scholar] [CrossRef]
  8. Shen, Y.; Gao, B.; Yang, X.; Tao, S. Seismic damage mechanism and dynamic deformation characteristic analysis of mountain tunnel after Wenchuan earthquake. Eng. Geol. 2014, 180, 85–98. [Google Scholar] [CrossRef]
  9. Wang, W.; Wang, T.; Su, J.; Lin, C.; Seng, C.; Huang, T. Assessment of damage in mountain tunnels due to the Taiwan Chi-Chi Earthquake. Tunn. Undergr. Space Technol. 2001, 16, 133–150. [Google Scholar] [CrossRef]
  10. Wang, Z.; Zhang, Z. Seismic damage classification and risk assessment of mountain tunnels with a validation for the 2008 Wenchuan earthquake. Soil Dyn. Earthq. Eng. 2013, 45, 45–55. [Google Scholar] [CrossRef]
  11. Yu, H.; Chen, J.; Bobet, A.; Yuan, Y. Damage observation and assessment of the Longxi tunnel during the Wenchuan earthquake. Tunn. Undergr. Space Technol. 2016, 54, 102–116. [Google Scholar] [CrossRef]
  12. Baker, J. Quantitative Classification of Near-Fault Ground Motions Using Wavelet Analysis. Bull. Seism. Soc. Am. 2007, 97, 1486–1501. [Google Scholar] [CrossRef]
  13. Ghahari, S.F.; Jahankhah, H.; Ghannad, M.A. Study on elastic response of structures to near-fault ground motions through record decomposition. Soil Dyn. Earthq. Eng. 2010, 30, 536–546. [Google Scholar] [CrossRef]
  14. Lu, Y.; Panagiotou, M. Characterization and Representation of Near-Fault Ground Motions Using Cumulative Pulse Extraction with Wavelet Analysis. Bull. Seism. Soc. Am. 2013, 104, 410–426. [Google Scholar] [CrossRef]
  15. Yaghmaei-Sabegh, S. Detection of pulse-like ground motions based on continues wavelet transform. J. Seism. 2010, 14, 715–726. [Google Scholar] [CrossRef]
  16. Hashash, Y.M.; Hook, J.J.; Schmidt, B.; Yao, J.I.-C. Seismic design and analysis of underground structures. Tunn. Undergr. Space Technol. 2001, 16, 247–293. [Google Scholar] [CrossRef]
  17. Barbosa, A.R.; Ribeiro, F.L.A.; Neves, L.A.C. Influence of earthquake ground-motion duration on damage estimation: Application to steel moment resisting frames. Earthq. Eng. Struct. Dyn. 2016, 46, 27–49. [Google Scholar] [CrossRef]
  18. Bommer, J.J.; Martínez-Pereira, A. The Effective Duration Of Earthquake Strong Motion. J. Earthq. Eng. 1999, 3, 127–172. [Google Scholar] [CrossRef]
  19. Bommer, J.; Stafford, P.; Alarcon, J.E. Empirical Equations for the Prediction of the Significant, Bracketed, and Uniform Duration of Earthquake Ground Motion. Bull. Seism. Soc. Am. 2009, 99, 3217–3233. [Google Scholar] [CrossRef]
  20. Wang, G.; Wang, Y.; Lu, W.; Yan, P.; Zhou, W.; Chen, M. A general definition of integrated strong motion duration and its effect on seismic demands of concrete gravity dams. Eng. Struct. 2016, 125, 481–493. [Google Scholar] [CrossRef]
  21. Sun, B.; Zhang, S.; Wang, C.; Cui, W. Ground motion duration effect on responses of hydraulic shallow-buried tunnel under SV-waves excitations. Earthq. Eng. Eng. Vib. 2020, 19, 887–902. [Google Scholar] [CrossRef]
  22. Repapis, C.C.; Mimoglou, P.P.; Dimakopoulou, V.V.; Psycharis, I.N.; Taflampas, I.M. Efficient strong motion duration of pulse-like records for nonlinear structural analyses. Earthq. Eng. Struct. Dyn. 2020, 49, 479–497. [Google Scholar] [CrossRef]
  23. Di Pilato, M.; Perotti, F.; Fogazzi, P. 3D dynamic response of submerged floating tunnels under seismic and hydrodynamic excitation. Eng. Struct. 2008, 30, 268–281. [Google Scholar] [CrossRef]
  24. Hatzigeorgiou, G.D.; Beskos, D.E. Soil–structure interaction effects on seismic inelastic analysis of 3-D tunnels. Soil Dyn. Earthq. Eng. 2010, 30, 851–861. [Google Scholar] [CrossRef]
  25. Huang, J.-Q.; Du, X.-L.; Jin, L.; Zhao, M. Impact of incident angles of P waves on the dynamic responses of long lined tunnels. Earthq. Eng. Struct. Dyn. 2016, 45, 2435–2454. [Google Scholar] [CrossRef]
  26. Huang, J.-Q.; Du, X.-L.; Zhao, M.; Zhao, X. Impact of incident angles of earthquake shear (S) waves on 3-D non-linear seismic responses of long lined tunnels. Eng. Geol. 2017, 222, 168–185. [Google Scholar] [CrossRef]
  27. Pakbaz, M.C.; Yareevand, A. 2-D analysis of circular tunnel against earthquake loading. Tunn. Undergr. Space Technol. 2005, 20, 411–417. [Google Scholar] [CrossRef]
  28. Qiu, D.; Chen, J.; Xu, Q. 3-D numerical analysis on seismic responses of the underground large scale frame structure under near-fault ground motions. Tunn. Undergr. Space Technol. 2019, 91, 103020. [Google Scholar] [CrossRef]
  29. Xia, C.; Qi, C.; Zhao, B.; Qu, X. Seismic response of the subway station due to a specific active fault. Tunn. Undergr. Space Technol. 2018, 85, 12–20. [Google Scholar] [CrossRef]
  30. Yu, H.; Yuan, Y.; Qiao, Z.; Gu, Y.; Yang, Z.; Li, X. Seismic analysis of a long tunnel based on multi-scale method. Eng. Struct. 2013, 49, 572–587. [Google Scholar] [CrossRef]
  31. Malkus, D.S.; Hughes, T.J. Mixed finite element methods-Reduced and selective integration techniques: A unification of concepts. Comput. Methods Appl. Mech. Eng. 1978, 15, 63–81. [Google Scholar] [CrossRef]
  32. Zhang, S.; Wang, G. Effects of near-fault and far-fault ground motions on nonlinear dynamic response and seismic damage of concrete gravity dams. Soil Dyn. Earthq. Eng. 2013, 53, 217–229. [Google Scholar] [CrossRef]
  33. Sarma, S.K.; Yang, K.S. An evaluation of strong motion records and a new parameterA95. Earthq. Eng. Struct. Dyn. 1987, 15, 119–132. [Google Scholar] [CrossRef]
  34. Husid, R.L. Analisis de Terremoros: Analisis General; Universidad de Chile: Santiago, Chile, 1969. [Google Scholar]
  35. Lysmer, J.; Kuhlemeyer, R.L. Finite Dynamic Model for Infinite Media. J. Eng. Mech. Div. 1969, 95, 859–878. [Google Scholar] [CrossRef]
  36. Sun, B.; Zhang, S.; Cui, W.; Deng, M.; Wang, C. Nonlinear dynamic response and damage analysis of hydraulic arched tunnels subjected to P waves with arbitrary incoming angles. Comput. Geotech. 2019, 118, 103358. [Google Scholar] [CrossRef]
  37. Sun, B.; Deng, M.; Zhang, S.; Wang, C.; Cui, W.; Li, Q.; Zhao, X.; Yan, H. Optimal selection of scalar and vector-valued intensity measures for improved fragility analysis in cross-fault hydraulic tunnels. Tunn. Undergr. Space Technol. 2023, 132, 104857. [Google Scholar] [CrossRef]
  38. Sun, B.; Liu, W.; Deng, M.; Zhang, S.; Wang, C.; Guo, J.; Wang, J.; Wang, J. Compound intensity measures for improved seismic performance assessment in cross-fault hydraulic tunnels using partial least-squares methodology. Tunn. Undergr. Space Technol. 2023, 132, 104890. [Google Scholar] [CrossRef]
  39. Liu, J.; Du, Y.; Du, X.; Wang, Z.; Wu, J. 3D viscous-spring artificial boundary in time domain. Earthq. Eng. Eng. Vib. 2006, 5, 93–102. [Google Scholar] [CrossRef]
  40. Sun, B.; Zhang, S.; Deng, M.; Wang, C. Inelastic dynamic response and fragility analysis of arched hydraulic tunnels under as-recorded far-fault and near-fault ground motions. Soil Dyn. Earthq. Eng. 2020, 132, 106070. [Google Scholar] [CrossRef]
  41. Sun, B.; Zhang, G.; Xue, B.; Kou, L.; Hu, L.; Liu, W. The analysis of the optimal scalar and vector intensity measurements for seismic performance assessment of deep-buried hydraulic arched tunnels. Undergr. Space 2023, 9, 218–233. [Google Scholar] [CrossRef]
  42. Lubliner, J.; Oliver, J.; Oller, S.; Oñate, E. A plastic-damage model for concrete. Int. J. Solids Struct. 1989, 25, 299–326. [Google Scholar] [CrossRef]
  43. Schiff, A.J.; Tang, A.K.; Kieffer, D.S.; Mcrae, C.M.; Chern, J.C.; Kao, H.C.; Lee, J.C. Lifeline Performance. Earthq. Spectra 2001, 17, 153–172. [Google Scholar] [CrossRef]
Figure 1. Plots of the duration of an NF earthquake record with velocity impulse for illustration of EVD. (a) 5–75% (b) 15–85% (c) 5–95%.
Applsci 13 02041 g001
Figure 2. The velocity time-histories and the with the corresponding EVD. (a) San Fernando, (b) Coyote Lake, (c) Imperial Valley-06 (Aeropuerto Mexicali), (d) Imperial Valley-06 (Brawley Airport), (e) Imperial Valley-06 (El Centro Array #11), (f) Imperial Valley-06 (El Centro Array #3), (g) Imperial Valley-06 (El Centro Differential Array), (h) Mendocino, (i) Landers (Barstow), (j) Landers (Yermo Fire Station), (k) Northridge-01, (l) Kocaeli, (m) Chi-Chi (TCU053), (n) Chi-Chi (TCU054), (o) Chi-Chi (TCU056), (p) Chi-Chi (TCU060).
Applsci 13 02041 g002aApplsci 13 02041 g002bApplsci 13 02041 g002cApplsci 13 02041 g002dApplsci 13 02041 g002e
Figure 3. Acceleration spectrum for as-recorded NFGMs.
Applsci 13 02041 g003
Figure 4. 3D FE model of a hydraulic arched tunnel [36]. ((a) FE model, (b) enlarged plot of the local refinement diagram).
Applsci 13 02041 g004
Figure 5. Damage factor and stress-strain constitutive relationships for the CPM [36] ((a) compressive stress-strain-damage factor, (b) tensile stress-strain-damage factor).
Applsci 13 02041 g005
Figure 6. The relative peak displacement of the concrete lining under different fixed threshold values of EVD ((a) the right spandrel—left foot, (b) the left spandrel—right foot, (c) the top arch—bottom, (d) the left haunch—right haunch).
Applsci 13 02041 g006
Figure 7. The peak longitudinal displacement of the concrete lining under different fixed threshold values of EVD.
Applsci 13 02041 g007
Figure 8. The accumulated damage crack patterns of the concrete lining under the different duration of NFGMs. (a) San Fernando, (b) Coyote Lake, (c) Imperial Valley-06 (Aeropuerto Mexicali), (d) Imperial Valley-06 (Brawley Airport), (e) Imperial Valley-06 (El Centro Array #11), (f) Imperial Valley-06 (El Centro Array #3), (g) Imperial Valley-06 (El Centro Differential Array), (h) Mendocino, (i) Landers (Barstow), (j) Landers (Yermo Fire Station), (k) Northridge-01, (l) Kocaeli, (m) Chi-Chi (TCU053), (n) Chi-Chi (TCU054), (o) Chi-Chi (TCU056), (p) Chi-Chi (TCU060).
Applsci 13 02041 g008
Figure 9. The cumulative damage energy dissipation of the concrete lining is subjected to the different duration of NFGMs.
Applsci 13 02041 g009
Figure 10. Schematic diagram of the damage volume [36].
Applsci 13 02041 g010
Figure 11. The LLTDI and LGTDI for concrete lining under NFGM with different EVDs. (a) arch section (b) sidewall section (c) bottom section (d) overall.
Applsci 13 02041 g011
Figure 12. The correlation coefficient between duration index and numerical results of the hydraulic arched tunnels.
Applsci 13 02041 g012
Figure 13. The comparison of the results for all reduced duration and total duration.
Applsci 13 02041 g013
Figure 14. Comparison of the peak value of numerical results for the total duration and the reduced duration of the as-recorded NFGM.
Applsci 13 02041 g014
Table 1. Mechanical parameters of surrounding rock, water, and concrete lining.
Constitutive ModelParameterUnitMagnitude
DP modelCohesionMPa1.1
Friction angle°41
Poisson’s ratio-0.25
Mass densitykg/m32625
Elastic modulusGPa4.0
CPMCompressive yield stressMPa16.7
Tensile yield stressMPa1.78
Poisson’s ratio-0.167
Mass densitykg/m32450
Elastic modulusGPa28
Linear elasticityBulk modulusGPa2.07
Mass densitykg/m31000
Disclaimer/Publisher’s Note: The statements, opinions and data contained in all publications are solely those of the individual author(s) and contributor(s) and not of MDPI and/or the editor(s). MDPI and/or the editor(s) disclaim responsibility for any injury to people or property resulting from any ideas, methods, instructions or products referred to in the content.

