Abstract
Mental workload has a major effect on the individual’s performance in most real-world tasks, which can lead to significant errors in critical operations. On this premise, the analysis and assessment of mental workload attain high research interest in both the fields of Neuroergonomics and Neuroscience. In this work, we implemented an EEG experimental design consisting of two distinct mental tasks (mental arithmetic task, n-back task), each with two conditions of complexity (low and high) to investigate the task-related and task-unrelated workload effects. Since mental workload is an intricate phenomenon involving multiple brain areas, we performed a graph theoretical analysis estimating the Phase Locking Index (PLI) in four frequency bands (delta, theta, alpha, beta). The brainwave-dependent network results show statistically significant reductions in clustering coefficient, characteristic path length, and small-worldness metrics with higher workload in both tasks across several bands. Moreover, functional connectivity analysis indicates a task-independent fashion of the brain topological re-organization with increasing mental load. These results revealed how the brain network is re-organized with increasing mental workload in a task-independent way. Finally, the network metrics were used as classification features, leading to high performance in workload level discrimination.
1. Introduction
In general, performing cognitive tasks with increased difficulty requires more brain resources, leading to higher mental workload. On this premise, a large number of studies have been dedicated in the assessment of mental workload, especially in the field of Neuroscience [1,2]. To that end, a variety of cognitive tasks have been applied [3] (with different complexity conditions) to assess mental workload, ranging from working memory manipulations (e.g., n-back, mental arithmetic) and operator performance (e.g., NASA multi-attribute task battery) to simulations of real-life settings (e.g., car driving [4,5], aircraft flying [5,6], and air traffic monitoring [7] simulations). Furthermore, brain activity recording modalities provide evidence of the complex neurophysiological mechanisms governing cognitive load and subsequently, mental exhaustion. As such, electroencephalography (EEG) is the most common method employed, allowing the monitoring of the brain electrical activity with high-temporal resolution in a non-invasive manner. In this regard, several studies have examined the brain properties in high-mental-load conditions, utilizing EEG-based features both in the time (such as event-related potentials (ERPs) [8], and in frequency domain, such as power spectral density (PSD) [3]). Furthermore, recent development of mobile dry electrodes EEG devices allow monitoring of real-time activities such as car driving [9,10] and aircraft piloting [11]. Nevertheless, the usually smaller number of dry EEG sensors (in few scalp areas), deter the complete comprehension of the underlying mechanisms involved in mental workload management by the brain.
Due to the complexity of the higher cognitive functions and the intricate flow of information between multiple brain regions, graph theory can provide an insightful approach on the brain functional reorganization regulating cognitive load [12,13]. As such, the functional connections paired with Artificial Intelligence (AI) frameworks can shed light on the mental workload neural characteristics, as well as to predict the mental workload impact of tasks in everyday life. On this premise, our previous works investigate the human brain connectome, employing brain networks as classification features for mental workload level prediction in both sensor [14] and source spaces [15]. In other relevant study [16], the Weighted Phase Lag Index (WPLI) networks were used to assess mental workload in dual-task walking. Furthermore, in [6], mental workload in three levels was examined in a flight simulation scenario, revealing different functional connectivity patterns in 2D and 3D environments. Another approach for classification of multilevel mental workload is to create a fusion of features based on power, functional connectivity, and network metrics therefore allowing greater variability of the inputs of the classification procedure [17]. In a similar fashion, a combination of EEG and functional near-infrared spectroscopy (fNIRS) has been utilized to construct brain connectivity networks, subsequently used to classify multi-level mental workload [18]. More recently, a study using a deep learning classifier examined three brain connectivity methods, Phase Transfer Entropy (PTE), Mutual Information (MI), and Phase Locking Value (PLV), with the latter providing superior performance [19]. To that end, several studies utilize a combination of different task in order to find common patterns, unrelated to the task performed (usually employing cross-task classification, where machine learning models trained on one task and tested on another) [20,21]. For instance, in a recent study, recurrent 3D convolutional neural networks were trained on spatial n-back and mental arithmetic tasks based on spatial, spectral and temporal features [22]. Similarly, in [23], four mental workload tasks were evaluated with a dynamic network analysis. Interestingly, in several studies network metrics have been used as input in classification exploiting their ability to discriminate between conditions. These usually include degree, clustering coefficient, characteristic path length and small-worldness [24,25]. This is not limited to mental workload but also in a variety of different tasks across different conditions. The most common examples of network metric classification involve prediction in tasks such as intention decoding [26] and diagnosis of diseases, such as major depressive disorder [27], essential tremor [28], and Parkinson’s Disease [29].
In this work, a two-workload-level (low and high) EEG experiment was carried out, employing two separate working memory (WM) tasks; i.e., an n-back and an arithmetic task. The recorded EEG data were utilized to create a Phase Lag Index (PLI) functional connectivity network, allowing to estimate graph theory metrics. Results showed statistically significant differences in the clustering coefficient, characteristic path length, and small-worldness network metrics, revealing different topological organization of the brain with increased mental workload. Subsequently, the network metrics were utilized as classification features for the discrimination between low- and high-mental-load levels, attaining high performance (over 0.70 classification accuracy in both tasks).
2. Materials and Methods
2.1. Participants
This study included 40 participants (17 males, 23 females, mean age = 21.6 ± 1.6 years), all right-handed and with normal or corrected-to-normal vision. Exclusion criteria included no history of mental diseases or ADHD, sleep disorders, or long-term medication intake, while participants were asked to sleep at least 7 h before the experiment and not to consume caffeine or alcohol. An approval decision was given by the Institutional Review Board of the National University of Singapore (NUS). All participants provided written informed consent.
2.2. Experimental Design
In this study, two working memory (WM) cognitive tasks, n-back and mental arithmetic with two levels of complexity, low- and high-workload levels) were used (Figure 1a). The E-Prime 2.0 software (Psychology Software Tools Inc., Pittsburgh, Pennsylvania, USA) was used for stimulus presentation. The two tasks were performed two times each with random order. A button was required to be pressed for both target and non-target stimuli, while no feedback was provided.
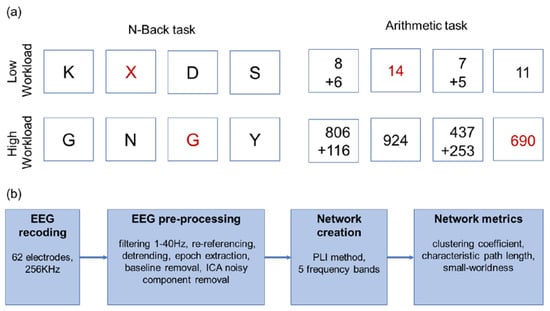
Figure 1.
(a) The experimental design with two tasks and two mental workload levels. The target trials are indicated in red font. (b) The analysis flowchart.
2.2.1. n-Back Task
Two versions of n-back task were employed for n = 0 and n = 2, corresponding to low- and high-workload levels. In 0-back condition, it was requested from the participants to respond to the presence of letter X, while in 2-back to the uppercase letter shown two trials earlier. Each session contained 150 trials, with 30% of them being the target stimuli. All stimuli were displayed for 0.5 s followed by a fixation cross for 1.5 s.
2.2.2. Mental Arithmetic Task
The addition of two numbers with one-digit and three-digit numbers were employed as low- and high-workload levels, respectively. After showing the addition, either the correct sum or a number close in value was shown. The subjects were asked to identify if the addition result was correct or not. Each session contained 25 trials (12 target stimuli). The additions were displayed for 5 sec followed by a fixation cross for 4 s and the answers were shown for 2 s followed by a fixation cross for 2 s.
2.3. Data Recordings and Preprocessing
EEG data were acquired from 62 Ag/AgCl scalp electrodes according to the international 10–20 system using ASA Lab (ANT B.V., Hengelo, The Netherlands). Electrode impedance was kept below 10 kΩ throughout the experiment and the sampling frequency was 256 Hz. Additionally, horizontal and vertical electrooculograms (EOG) were acquired. The EEG preprocessing steps involved F-IR band-pass filtering (1–40 Hz), re-referencing to the average of all electrodes and noise removal. The noise from eye movement was eliminated by performing independent component analysis (ICA) [30] and rejecting the components which were highly correlated with the EOG signals. Data were detrended and epochs were extracted based on stimuli and baseline was removed based on (−100 ms, 0 ms) interval before stimulus presentation. Only epochs that corresponded to correct answers by the participants were selected for further analysis in order to alleviate mental workload-irrelevant cognitive stimuli [31]. All preprocessing steps were performed using the EEGLAB toolbox [32] in MATLAB version 2019b (Mathworks Inc., Natick, Massachusetts, USA). An overview of all processing steps is provided in Figure 1b.
2.4. Brain Connectivity Estimation
In order to study the brain response to mental workload, weighted brain networks were constructed between all electrodes using the PLI method [33]. EEG signals were divided in delta (δ, 1–4 Hz), theta (θ, 4–7 Hz), alpha (α, 8–12 Hz), and beta (β, 13–30 Hz) frequency bands. A PLI brain network was created for each subject, task, and frequency band. For a pair of electrodes i, j, PLI is defined as:
where is the phase obtained by Hilbert transformation and T is the number of time points. PLI indicates the degree of synchronization between a pair of channels and ranges in the interval (0, 1).
2.5. Network Analysis
To investigate the task-independent network properties and deepen our perception in regards of the workload-related reorganization of the underlying brain structures, we used graph theoretical analysis to detect task-independent workload-related common topological patterns. Small-world properties were originally proposed by Watts and Strogatz as the concept of connected adjacent subsets of vertices contained within the network, indicated by higher local clustering coefficient and equivalent characteristic path length compared with random networks [34]. Hence, small-world parameters—including clustering coefficient, characteristic path length, and small-worldness—were estimated in this work. The estimation of these graph theoretical metrics was performed using the Brain Connectivity Toolbox [35]. The grand network average of all trials was calculated for each subject, estimating a mean network for each task, workload level, and condition. A common sparsity was applied to all networks (i.e., keeping a specific percentage of the connections with highest weights) before computing the network metrics to ensure the equivalent wiring cost. Here, we used a wide range of sparsity (15–30% with 1% step) in order to reduce the dependency of any significant differences in network topology on the arbitrary choice of a single threshold. Then, we calculated the integral of the network metrics with respect to sparsity—i.e., the area under curve (AUC)—for the following statistical analysis [36].
Let G be a weighted directed network with N nodes (N = 62 in this work), wij the weight of the edge from node i to j as calculated by PLI functional connectivity and H the adjacency matrix (Hij = 1 if wij ≠ 0).
Clustering coefficient quantifies the degree of local neighborhoods to form a complete network. Clustering coefficient Ci of a node i is defined as [37]:
The clustering coefficient C of the network is the average of the clustering coefficient across all nodes:
Characteristic path length quantifies how efficiently information is transferred in a network [35]. The shortest path length Lij from node i to node j is defined as the minimum number of directed edges connecting the two nodes. The characteristic path length L of a network is defined as the average of the shortest path length between all node pairs:
Small-worldness is a measurement to evaluate the small-world properties and is defined as the ratio of the normalized clustering coefficient to the normalized characteristic path length. The normalization is performed based on matched random networks [38]:
where Crand and Lrand represent the mean clustering coefficient and the mean characteristic path length of the random networks. Here, 100 random networks were created, which were derived from the original brain network by randomly shuffling the edges while preserving the number of nodes and edges, degree distribution, and connectedness.
2.6. Statistical Analysis
The Shapiro–Wilk test was performed to ensure that the network metrics were normally distributed. Then, a repeated-measures two-way ANOVA test was performed for each metric with factors the workload level and the task. For significant cases, a post-hoc paired t-test was performed. For all tests, a significance threshold of 0.05 was used.
2.7. Classification
The aforementioned metrics were used as features for classification of mental workload. In total 12 features were extracted (three metrics by four frequency bands), while the integrated value across sparsity level was used. The classification algorithms were K-nearest neighbors (KNN) using K = 15, support vector machines (SVM) with radial basis function kernel, and random forest (RF) with 100 trees. Training and testing were performed with 10-fold cross-validation, while whole subject data were assigned either to training or to testing subset. Data were normalized (as centralized values) per subject to account for individual differences by subtracting the mean of each feature.
3. Results
3.1. Network Topology
In Figure 2, the 100 edges with highest PLI value are shown on scalp maps for each task, workload condition and frequency band. Most of the connections are located in parietal–occipital areas as well as in frontal areas, while few connections are present in central and temporal areas. Of note, the interactions are about equally distributed across the two hemispheres.
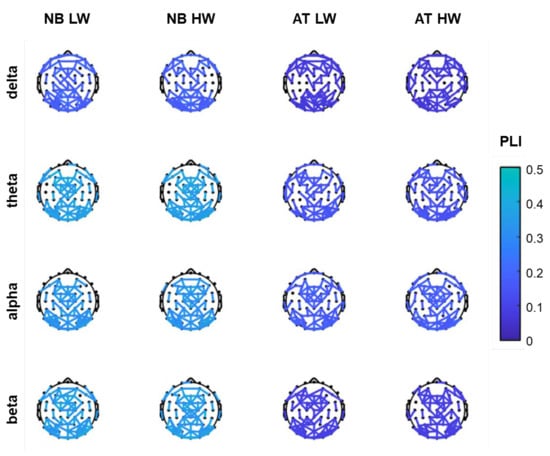
Figure 2.
The top 100 PLI functional connections per frequency band, for n-back (NB) and arithmetic tasks (AT) in low workload (LW) and high workload (HW) conditions.
3.2. Network Metrics Analysis
The global topological alterations of the estimated brain network were quantitatively examined via graph theoretical analysis. Particularly, small-world network properties—including clustering coefficient, characteristic path length, and small-worldness—were estimated. The network metrics (averaged across participants) for each task and workload level are shown for 30% sparsity in Figure 3. Some differences in values are observed for each task, due to their different demands. It seems there is little difference across frequency bands. However, in almost all cases, it is obvious that metric values are decreasing with increased workload level. Similar patterns were observed in other sparsity levels.
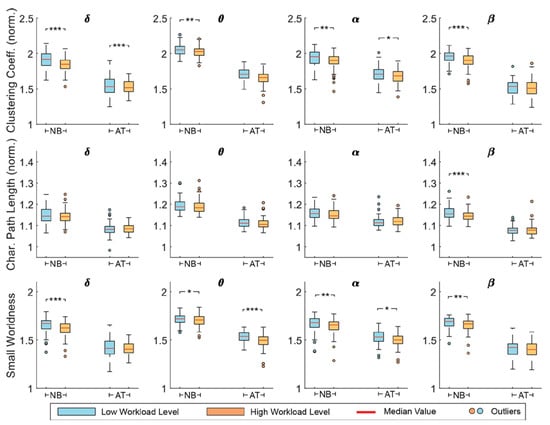
Figure 3.
The normalized clustering coefficient, normalized characteristic path length, and small-worldness metrics per frequency band, for n-back (NB) and arithmetic tasks (AT) in low workload (LW) and high workload (HW) conditions. Network sparsity was set to 30%. Significance level is denoted as: *: p < 0.05; **: p < 0.01; ***: p < 0.001.
Statistical analysis was performed via a repeated-measures two-way ANOVA to assess the workload effects on brain network reorganization. The AUC of each metric over sparsity level was calculated and was used for statistical analysis for all participants together. Data were normally distributed according to Shapiro–Wilk test (p > 0.05). Given that our primary objective was to reveal task-independent mental workload influence on brain activities, we focus mainly on the workload effects (Table 1). Specifically, for the clustering coefficient, a significant workload effect was found for all frequency bands (p < 0.05) and the post-hoc paired t-test revealed significant decrement for all bands for the n-back task (p < 0.05) and in θ and α for the mental arithmetic (p < 0.05). For the characteristic path length, a significant workload effect (F1,316 = 4.50, p = 0.04) as well as significant interaction of task and workload factors (F1,316 = 4.75, p = 0.03) were detected in β band, although the t-test analysis presented significant decrement only for the n-back task (t79 = 3.20, p = 0.002). Finally, the small-worldness metric displayed significant workload effects in θ (F1,316 = 8.61, p = 0.004) and α bands (F1,316 = 7.69, p = 0.006), with the post-hoc analysis further confirming the significant decrement for both tasks (p < 0.05). In all statistically significant cases, a common trend was observed—i.e., a decrement of the network metric values—revealing the way of brain network reconfiguration with the increase in workload levels.

Table 1.
Statistical results for the network metrics (ANOVA—workload factor F1316).
3.3. Classification
Since the metrics showed high capabilities of separating mental workload, they were used as classification features. Indeed, satisfactory classification performance was achieved (Table 2). Best performance was obtained by the RF algorithm for the n-back task (75%) and KNN for the arithmetic task (70%). The confusion matrices are displayed in Figure 4. We observe that the falsely classified instances are equally distributed between the two classes, indicating no bias towards a specific class.
Table 2.
Classification accuracy (mean and standard deviation across 10 folds).
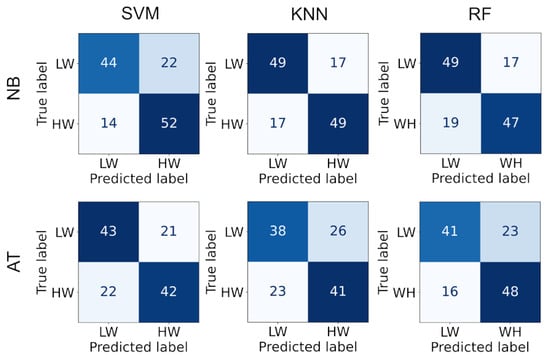
Figure 4.
The confusion matrix for each classifier and task.
4. Discussion
In this work, mental workload was examined across two different working memory tasks, n-back, and mental arithmetic. Towards this aim, brain connectivity was estimated employing PLI method. The connections with highest strength are mostly located on parietal-occipital areas as well as in frontal areas. This pattern appears in all task and workload conditions across all frequency bands. Similar findings have been reported in literature. In a large meta-analysis of 85 brain imaging studies utilizing functional magnetic resonance imaging (fMRI) and positron emission tomography (PET) on various types of n-back tasks, bilateral frontal and parietal regions were found most frequently activated [39]. Regarding the frequency bands related with mental workload, in an EEG study [40] frontal areas were activated in δ, θ, α, and β bands, while parietal-occipital areas were activated in θ, α, and β bands. In an EEG experiment [16], mental workload was found to affect functional connections between Fz and parietal areas in high alpha band, while in [41] frontal theta activity was found to be highly associated with mental workload. Isolation of specific locations and frequency bands is important for efficient real-time performance, for example frontal EEG from a single channel EEG device (Fp1 electrode) was used for mental workload monitoring in four cognitive and motor tasks [42].
Examining the complex brain topological architectures of the PLI network, significant alterations were observed in the clustering coefficient, characteristic path length as well as in small-worldness metrics. Decrements in clustering coefficient indicate that the network is becoming less dense locally, i.e., the neighbor nodes tend to become less connected. Decrements of characteristic path length indicate that remote nodes become more connected. Combining those two observations—since the number of edges is the same in all networks in a specific sparsity level—the conclusion is that the network is rewired, and more edges are present between remote nodes, making more efficient long-range communication. The fact that communication between remote nodes is improved might be the effect of increased task demands, in the sense that more brain resources are required to perform a more difficult task. Decrement of small-worldness shows that the clustering coefficient has decreased at a larger rate than the characteristic path length. Thus, higher workload has more negative impact on local communication than improvement of global communication.
In detail, concerning clustering coefficient, a significant workload effect was apparent for all frequency bands and particularly a converse correlation with cognitive load levels was observed for θ and α frequency bands in the mental arithmetic and in all bands for the n-back, presenting a less clustered network with increasing task difficulty. Consistent with this observation, other studies also report a reduction in the local density of connections with respect to increased cognitive effort especially for WM task [43,44] indicating a functional segregation of the brain network. In a similar manner, the small-worldness metric demonstrated significant effects in θ and α bands with regard to mental load in both tasks. On the grounds of this, the small-world network organization indicates the coordination between the dispersed cognitive resources and the level of global network integration in high-demand WM tasks [45]. Consequently, the θ and α small-worldness decrement relative to workload augmentation is in agreement with analogous reports from task condition complexity modulation, illustrating that the brain network is shifting away from small-world organization [43]. Another important matter is the fact that a significant interaction of task and workload in the characteristic path length for β band was identified, although the divergence was distinguishable by the post-hoc analysis only with reference to the n-back task. As such, this decrement in the path length could be an indication of the variability of performance on WM, being more pronounced in the n-back, while implying an enhancement in the topological efficiency of information transfer between and across remote brain regions [46,47].
Finally, classification was performed, utilizing the network metrics as features. The highest accuracy obtained was 75% for n-back task and 70% for arithmetic task. Of note, a very small number of features was used, which eliminates the need for feature selection and enables fast predictions. We note that the accuracy is high compared to chance level (50%); however, higher accuracy would be required for real-life applications. In the literature, accuracy up to 94% has been reported for similar tasks based on more complex feature selection and extraction schemes [14]. As such, while the network metrics provide consistent evidence about the brain re-organization, their values differ across tasks and participants, which has the effect of reduced classification efficiency. Despite this, network metrics alone have not been used as a feature for mental workload classification (and are usually combined with other types of features/characteristics) to the best of our knowledge. The performance of the machine learning methods employed in this study, illustrates the efficiency of graph theoretical measures in workload assessment. In the future, more sophisticated classifiers—such as deep neural networks—can be tested, in order to achieve higher performance, as well as to estimate additional network metrics. Furthermore, these network metrics can be combined with other types of features, such as power spectral density or network weights.
Author Contributions
Conceptualization, Y.S.; Methodology, G.N.D., I.K. and Y.S.; Software, G.N.D. and I.K.; Formal analysis, G.N.D. and I.K.; Investigation, G.N.D., I.K., A.B. and Y.S.; Resources, A.B. and Y.S.; Writing—original draft preparation, G.N.D., I.K., A.A., A.B., Y.S. and G.K.M.; Writing—review and editing, G.N.D., I.K., A.A., A.B., Y.S. and G.K.M.; Visualization, G.N.D. and I.K.; Supervision, A.B., Y.S. and G.K.M.; Project administration, A.B., Y.S. and G.K.M.; Funding acquisition, A.B., Y.S. and G.K.M. All authors have read and agreed to the published version of the manuscript.
Funding
This research was funded in part by the National University of Singapore for Cognitive Engineering Group at Singapore Institute for Neurotechnology under Grant R-719-001-102-232 and in part by the Ministry of Education of Singapore under Grant MOE2014-T2-1-115.
Institutional Review Board Statement
The study was conducted in accordance with the Declaration of Helsinki, and approved by the Institutional Review Board of National University of Singapore, Singapore with protocol code B-13-132.
Informed Consent Statement
Informed consent was obtained from all subjects involved in the study.
Data Availability Statement
The data presented in this study are available on request from the corresponding author.
Conflicts of Interest
The authors declare no conflict of interest.
References
- Tao, D.; Tan, H.; Wang, H.; Zhang, X.; Qu, X.; Zhang, T. A Systematic Review of Physiological Measures of Mental Workload. Int. J. Environ. Res. Public Health 2019, 16, 2716. [Google Scholar] [CrossRef] [PubMed]
- Charles, R.L.; Nixon, J. Measuring Mental Workload Using Physiological Measures: A Systematic Review. Appl. Ergon. 2019, 74, 221–232. [Google Scholar] [CrossRef] [PubMed]
- Zhou, Y.; Huang, S.; Xu, Z.; Wang, P.; Wu, X.; Zhang, D. Cognitive Workload Recognition Using EEG Signals and Machine Learning: A Review. IEEE Trans. Cogn. Dev. Syst. 2022, 14, 799–818. [Google Scholar] [CrossRef]
- Cantin, V.; Lavallière, M.; Simoneau, M.; Teasdale, N. Mental Workload When Driving in a Simulator: Effects of Age and Driving Complexity. Accid. Anal. Prev. 2009, 41, 763–771. [Google Scholar] [CrossRef]
- Borghini, G.; Astolfi, L.; Vecchiato, G.; Mattia, D.; Babiloni, F. Measuring Neurophysiological Signals in Aircraft Pilots and Car Drivers for the Assessment of Mental Workload, Fatigue and Drowsiness. Neurosci. Biobehav. Rev. 2014, 44, 58–75. [Google Scholar] [CrossRef]
- Kakkos, I.; Dimitrakopoulos, G.N.; Gao, L.; Zhang, Y.; Qi, P.; Matsopoulos, G.K.; Thakor, N.; Bezerianos, A.; Sun, Y. Mental Workload Drives Different Reorganizations of Functional Cortical Connectivity Between 2D and 3D Simulated Flight Experiments. IEEE Trans. Neural Syst. Rehabil. Eng. A Publ. IEEE Eng. Med. Biol. Soc. 2019, 27, 1704–1713. [Google Scholar] [CrossRef]
- Aricò, P.; Borghini, G.; Di Flumeri, G.; Colosimo, A.; Pozzi, S.; Babiloni, F. A Passive Brain–Computer Interface Application for the Mental Workload Assessment on Professional Air Traffic Controllers during Realistic Air Traffic Control Tasks. Prog. Brain Res. 2016, 228, 295–328. [Google Scholar] [CrossRef]
- Roy, R.N.; Charbonnier, S.; Campagne, A.; Bonnet, S. Efficient Mental Workload Estimation Using Task-Independent EEG Features. J. Neural Eng. 2016, 13, 026019. [Google Scholar] [CrossRef]
- Di Flumeri, G.; Borghini, G.; Aricò, P.; Sciaraffa, N.; Lanzi, P.; Pozzi, S.; Vignali, V.; Lantieri, C.; Bichicchi, A.; Simone, A.; et al. EEG-Based Mental Workload Neurometric to Evaluate the Impact of Different Traffic and Road Conditions in Real Driving Settings. Front. Hum. Neurosci. 2018, 12, 509. [Google Scholar] [CrossRef]
- Lin, C.T.; Chuang, C.H.; Huang, C.S.; Tsai, S.F.; Lu, S.W.; Chen, Y.H.; Ko, L.W. Wireless and Wearable EEG System for Evaluating Driver Vigilance. IEEE Trans. Biomed. Circuits Syst. 2014, 8, 165–176. [Google Scholar] [CrossRef]
- Dehais, F.; Duprès, A.; Blum, S.; Drougard, N.; Scannella, S.; Roy, R.N.; Lotte, F. Monitoring Pilot’s Mental Workload Using ERPs and Spectral Power with a Six-Dry-Electrode EEG System in Real Flight Conditions. Sensors 2019, 19, 1324. [Google Scholar] [CrossRef] [PubMed]
- Sporns, O. The Human Connectome: A Complex Network. Ann. N. Y. Acad. Sci. 2011, 1224, 109–125. [Google Scholar] [CrossRef] [PubMed]
- Dimitrakopoulos, G.N.; Balomenos, P.; Vrahatis, A.G.; Sgarbas, K.; Bezerianos, A. Identifying Disease Network Perturbations through Regression on Gene Expression and Pathway Topology Analysis. In Proceedings of the 2016 38th Annual International Conference of the IEEE Engineering in Medicine and Biology Society (EMBC), Orlando, FL, USA, 16–20 August 2016; pp. 5969–5972. [Google Scholar]
- Kakkos, I.; Dimitrakopoulos, G.N.; Sun, Y.; Yuan, J.; Matsopoulos, G.K.; Bezerianos, A.; Sun, Y. EEG Fingerprints of Task-Independent Mental Workload Discrimination. IEEE J. Biomed. Health Inform. 2021, 25, 3824–3833. [Google Scholar] [CrossRef]
- Dimitrakopoulos, G.N.; Kakkos, I.; Dai, Z.; Lim, J.; deSouza, J.J.; Bezerianos, A.; Sun, Y. Task-Independent Mental Workload Classification Based Upon Common Multiband EEG Cortical Connectivity. IEEE Trans. Neural Syst. Rehabil. Eng. 2017, 25, 1940–1949. [Google Scholar] [CrossRef] [PubMed]
- Shaw, E.P.; Rietschel, J.C.; Shuggi, I.M.; Xu, Y.; Chen, S.; Miller, M.W.; Hatfield, B.D.; Gentili, R.J. Cerebral Cortical Networking for Mental Workload Assessment under Various Demands during Dual-Task Walking. Exp. Brain Res. 2019, 237, 2279–2295. [Google Scholar] [CrossRef]
- Pei, Z.; Wang, H.; Bezerianos, A.; Li, J. EEG-Based Multiclass Workload Identification Using Feature Fusion and Selection. IEEE Trans. Instrum. Meas. 2021, 70, 1–8. [Google Scholar] [CrossRef]
- Cao, J.; Garro, E.M.; Zhao, Y. EEG/FNIRS Based Workload Classification Using Functional Brain Connectivity and Machine Learning. Sensors 2022, 22, 7623. [Google Scholar] [CrossRef]
- Gupta, A.; Siddhad, G.; Pandey, V.; Roy, P.P.; Kim, B.G. Subject-Specific Cognitive Workload Classification Using Eeg-Based Functional Connectivity and Deep Learning. Sensors 2021, 21, 6710. [Google Scholar] [CrossRef]
- Ke, Y.; Qi, H.; Zhang, L.; Chen, S.; Jiao, X.; Zhou, P.; Zhao, X.; Wan, B.; Ming, D. Towards an Effective Cross-Task Mental Workload Recognition Model Using Electroencephalography Based on Feature Selection and Support Vector Machine Regression. Int. J. Psychophysiol. 2015, 98, 157–166. [Google Scholar] [CrossRef]
- Zhao, G.; Liu, Y.J.; Shi, Y. Real-Time Assessment of the Cross-Task Mental Workload Using Physiological Measures during Anomaly Detection. IEEE Trans. Hum.-Mach. Syst. 2018, 48, 149–160. [Google Scholar] [CrossRef]
- Zhang, P.; Wang, X.; Zhang, W.; Chen, J. Learning Spatial-Spectral-Temporal EEG Features With Recurrent 3D Convolutional Neural Networks for Cross-Task Mental Workload Assessment. IEEE Trans. Neural Syst. Rehabil. Eng. 2019, 27, 31–42. [Google Scholar] [CrossRef] [PubMed]
- Guan, K.; Zhang, Z.; Chai, X.; Tian, Z.; Liu, T.; Niu, H. EEG Based Dynamic Functional Connectivity Analysis in Mental Workload Tasks with Different Types of Information. IEEE Trans. Neural Syst. Rehabil. Eng. 2022, 30, 632–642. [Google Scholar] [CrossRef] [PubMed]
- Welton, T.; Kent, D.A.; Auer, D.P.; Dineen, R.A. Reproducibility of Graph-Theoretic Brain Network Metrics: A Systematic Review. Brain Connect. 2015, 5, 193–202. [Google Scholar] [CrossRef] [PubMed]
- Sun, Y.; Chen, Y.; Collinson, S.L.; Bezerianos, A.; Sim, K. Reduced Hemispheric Asymmetry of Brain Anatomical Networks Is Linked to Schizophrenia: A Connectome Study. Cereb. Cortex 2017, 27, 602–615. [Google Scholar] [CrossRef]
- Xiong, X.; Yu, Z.; Ma, T.; Luo, N.; Wang, H.; Lu, X.; Fan, H. Weighted Brain Network Metrics for Decoding Action Intention Understanding Based on EEG. Front. Hum. Neurosci. 2020, 14, 232. [Google Scholar] [CrossRef]
- Guo, H.; Cao, X.; Liu, Z.; Li, H.; Chen, J.; Zhang, K. Machine Learning Classifier Using Abnormal Brain Network Topological Metrics in Major Depressive Disorder. NeuroReport 2012, 23, 1006–1011. [Google Scholar] [CrossRef]
- Li, Q.; Tao, L.; Xiao, P.; Gui, H.; Xu, B.; Zhang, X.; Zhang, X.; Chen, H.; Wang, H.; He, W.; et al. Combined Brain Network Topological Metrics with Machine Learning Algorithms to Identify Essential Tremor. Front. Neurosci. 2022, 16, 1891. [Google Scholar] [CrossRef]
- Kazeminejad, A.; Golbabaei, S.; Soltanian-Zadeh, H. Graph Theoretical Metrics and Machine Learning for Diagnosis of Parkinson’s Disease Using Rs-FMRI. In Proceedings of the 19th CSI International Symposium on Artificial Intelligence and Signal Processing, AISP 2017, Shiraz, Iran, 25–27 October 2017; Institute of Electrical and Electronics Engineers Inc.: Piscataway, NJ, USA, 2018; Volume 2018, pp. 134–139. [Google Scholar]
- Jung, T.P.; Makeig, S.; Westerfield, M.; Townsend, J.; Courchesne, E.; Sejnowski, T.J. Removal of Eye Activity Artifacts from Visual Event-Related Potentials in Normal and Clinical Subjects. Clin. Neurophysiol. 2000, 111, 1745–1758. [Google Scholar] [CrossRef]
- Kakkos, I.; Ventouras, E.M.; Asvestas, P.A.; Karanasiou, I.S.; Matsopoulos, G.K. A Condition-Independent Framework for the Classification of Error-Related Brain Activity. Med. Biol. Eng. Comput. 2020, 58, 573–587. [Google Scholar] [CrossRef]
- Delorme, A.; Makeig, S. EEGLAB: An Open Source Toolbox for Analysis of Single-Trial EEG Dynamics Including Independent Component Analysis. J. Neurosci. Methods 2004, 134, 9–21. [Google Scholar] [CrossRef]
- Stam, C.J.; Nolte, G.; Daffertshofer, A. Phase Lag Index: Assessment of Functional Connectivity from Multi Channel EEG and MEG with Diminished Bias from Common Sources. Hum. Brain Mapp. 2007, 28, 1178–1193. [Google Scholar] [CrossRef] [PubMed]
- Watts, D.J.; Strogatz, S.H. Collective Dynamics of “small-World” Networks. Nature 1998, 393, 440–442. [Google Scholar] [CrossRef] [PubMed]
- Rubinov, M.; Sporns, O. Complex Network Measures of Brain Connectivity: Uses and Interpretations. NeuroImage 2010, 52, 1059–1069. [Google Scholar] [CrossRef] [PubMed]
- Achard, S.; Bullmore, E. Efficiency and Cost of Economical Brain Functional Networks. PLoS Comput. Biol. 2007, 3, e17. [Google Scholar] [CrossRef]
- Boccaletti, S.; Latora, V.; Moreno, Y.; Chavez, M.; Hwang, D.U. Complex Networks: Structure and Dynamics. Phys. Rep. 2006, 424, 175–308. [Google Scholar] [CrossRef]
- Humphries, M.D.; Gurney, K.; Prescott, T.J. The Brainstem Reticular Formation Is a Small-World, Not Scale-Free, Network. Proc. R. Soc. B Biol. Sci. 2006, 273, 503–511. [Google Scholar] [CrossRef]
- Mencarelli, L.; Neri, F.; Momi, D.; Menardi, A.; Rossi, S.; Rossi, A.; Santarnecchi, E. Stimuli, Presentation Modality, and Load-Specific Brain Activity Patterns during n-Back Task. Hum. Brain Mapp. 2019, 40, 3810–3831. [Google Scholar] [CrossRef]
- Das Chakladar, D.; Dey, S.; Roy, P.P.; Dogra, D.P. EEG-Based Mental Workload Estimation Using Deep BLSTM-LSTM Network and Evolutionary Algorithm. Biomed. Signal Process. Control 2020, 60, 101989. [Google Scholar] [CrossRef]
- Hamann, A.; Carstengerdes, N. Investigating Mental Workload-Induced Changes in Cortical Oxygenation and Frontal Theta Activity during Simulated Flights. Sci. Rep. 2022, 12, 6449. [Google Scholar] [CrossRef]
- So, W.K.Y.; Wong, S.W.H.; Mak, J.N.; Chan, R.H.M. An Evaluation of Mental Workload with Frontal EEG. PLoS ONE 2017, 12, e0174949. [Google Scholar] [CrossRef]
- Dai, Z.; De Souza, J.; Lim, J.; Ho, P.M.; Chen, Y.; Li, J.; Thakor, N.; Bezerianos, A.; Sun, Y. EEG Cortical Connectivity Analysis of Working Memory Reveals Topological Reorganization in Theta and Alpha Bands. Front. Hum. Neurosci. 2017, 11, 237. [Google Scholar] [CrossRef] [PubMed]
- Sciaraffa, N.; Borghini, G.; Aricò, P.; Di Flumeri, G.; Colosimo, A.; Bezerianos, A.; Thakor, N.V.; Babiloni, F. Brain Interaction during Cooperation: Evaluating Local Properties of Multiple-Brain Network. Brain Sci. 2017, 7, 90. [Google Scholar] [CrossRef] [PubMed]
- Vecchio, F.; Miraglia, F.; Maria Rossini, P. Connectome: {Graph} Theory Application in Functional Brain Network Architecture. Clin. Neurophysiol. Pract. 2017, 2, 206–213. [Google Scholar] [CrossRef] [PubMed]
- Kitzbichler, M.G.; Henson, R.N.A.; Smith, M.L.; Nathan, P.J.; Bullmore, E.T. Cognitive Effort Drives Workspace Configuration of Human Brain Functional Networks. J. Neurosci. 2011, 31, 8259–8270. [Google Scholar] [CrossRef] [PubMed]
- Li, Y.; Liu, Y.; Li, J.; Qin, W.; Li, K.; Yu, C.; Jiang, T. Brain Anatomical Network and Intelligence. PLoS Comput. Biol. 2009, 5, e1000395. [Google Scholar] [CrossRef] [PubMed]


Disclaimer/Publisher’s Note: The statements, opinions and data contained in all publications are solely those of the individual author(s) and contributor(s) and not of MDPI and/or the editor(s). MDPI and/or the editor(s) disclaim responsibility for any injury to people or property resulting from any ideas, methods, instructions or products referred to in the content. |
© 2023 by the authors. Licensee MDPI, Basel, Switzerland. This article is an open access article distributed under the terms and conditions of the Creative Commons Attribution (CC BY) license (https://creativecommons.org/licenses/by/4.0/).