
Using Wearable Sensors to Estimate Vertical Ground Reaction Force Based on a Transformer


Abstract
:1. Introduction
2. Dataset
2.1. Data Acquisition System
2.2. Collection Process
2.3. Pressure Sensor Calibration
3. Methods
3.1. Time Feature
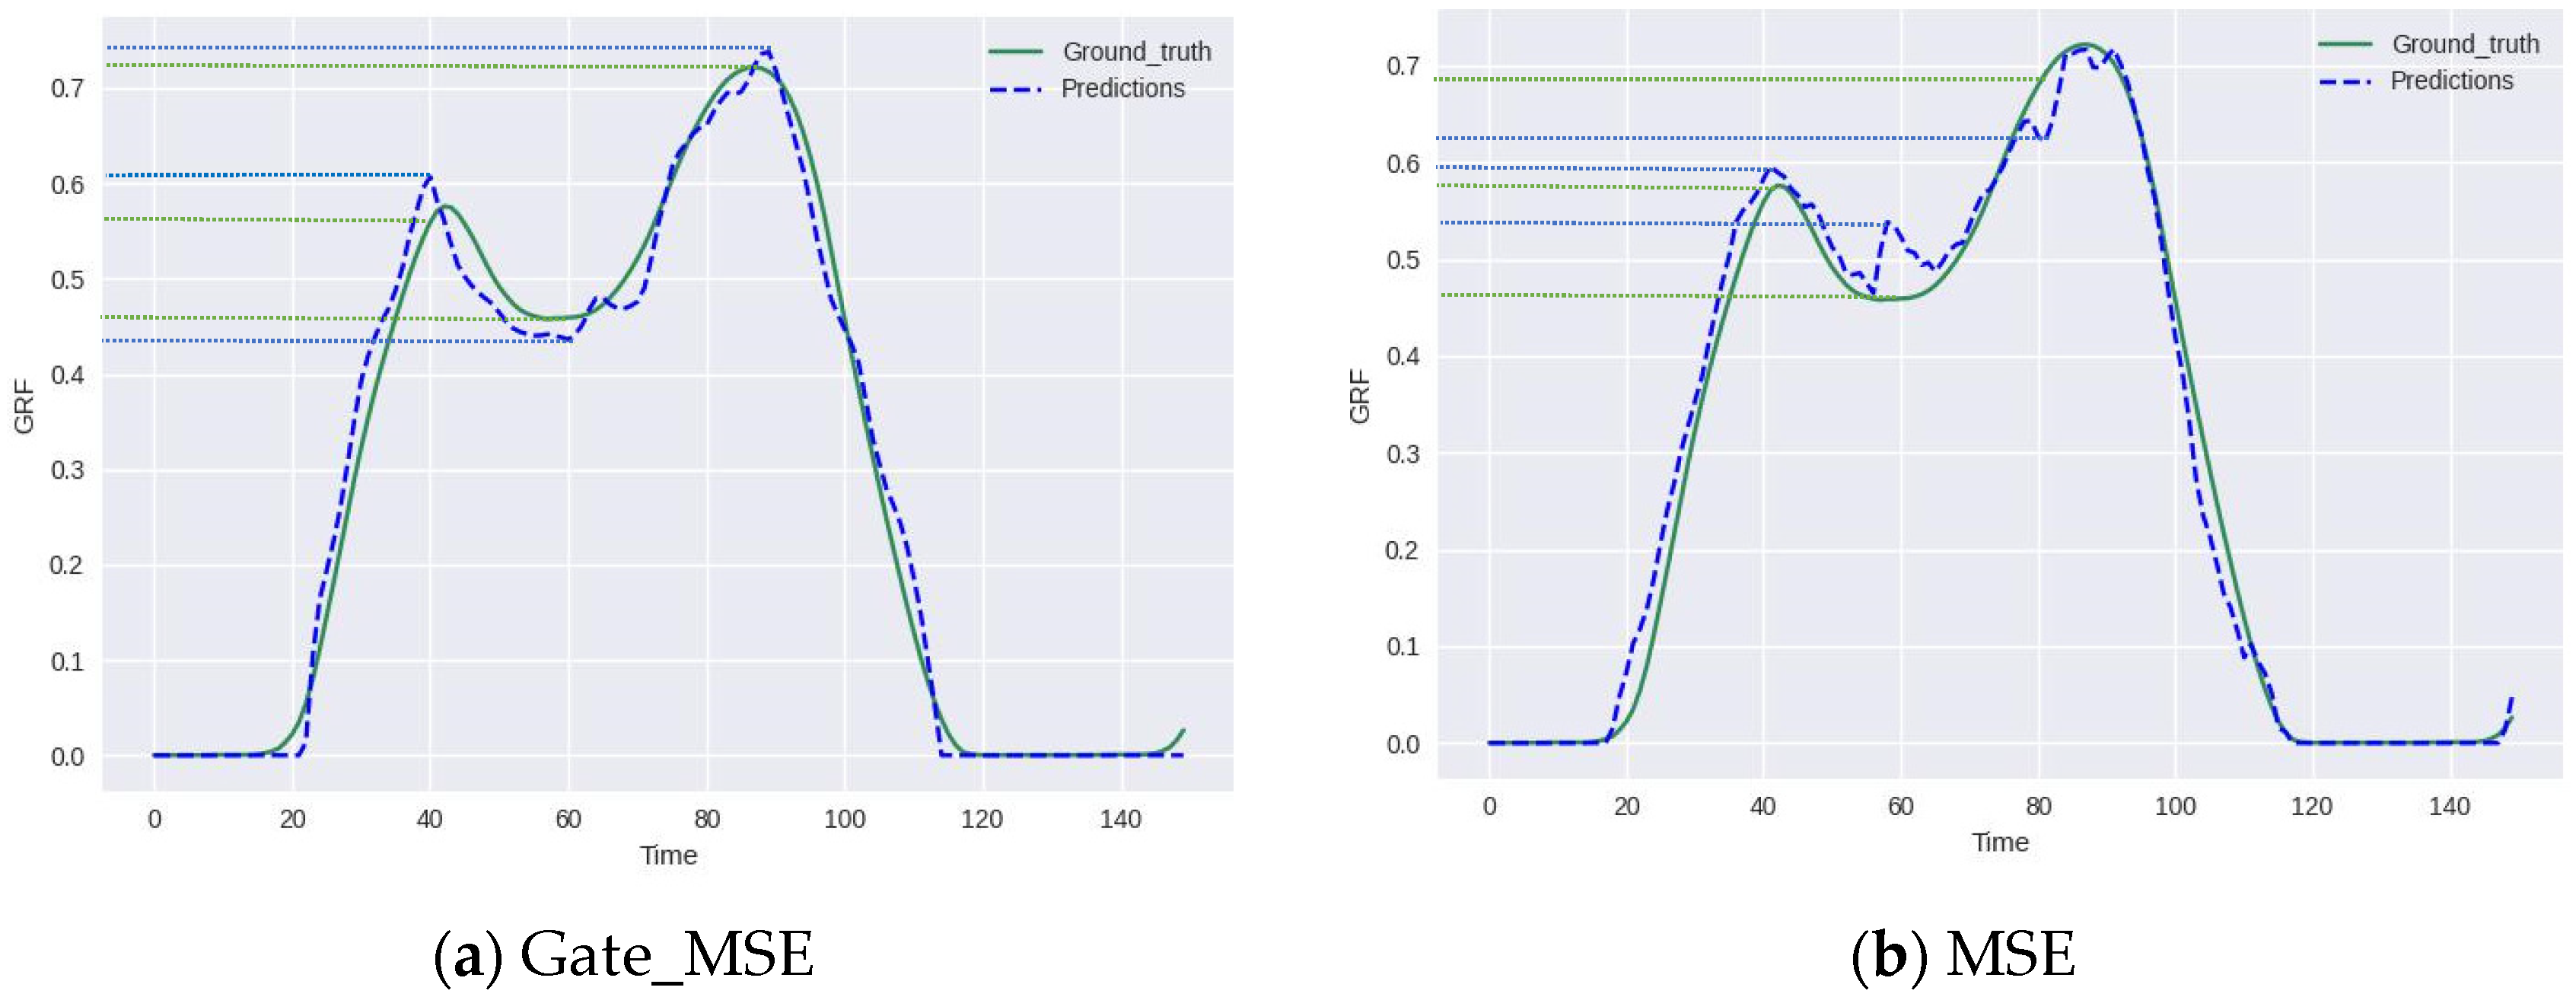
3.2. Loss Function
3.3. Data Format
4. Results
5. Discussions
6. Conclusions
Author Contributions
Funding
Institutional Review Board Statement
Informed Consent Statement
Data Availability Statement
Conflicts of Interest
References
- Shafizadegan, Z.; Karimi, M.T.; Shafizadegan, F.; Rezaeian, Z.S. Evaluation of ground reaction forces in patients with various severities of knee osteoarthritis. J. Mech. Med. Biol. 2016, 16, 1650003. [Google Scholar] [CrossRef]
- Wiik, A.V.; Aqil, A.; Brevadt, M.; Jones, G.; Cobb, J. Abnormal ground reaction forces lead to a general decline in gait speed in knee osteoarthritis patients. World J. Orthop. 2017, 8, 322–328. [Google Scholar] [CrossRef]
- Winter, D. Biomechanics and Motor Control of Human Movement; Wiley: Hoboken, NJ, USA, 2009. [Google Scholar]
- Frost, R.B.; Cass, C.A. A load cell and sole assembly for dynamic pointwise vertical force measurement in walking. Eng. Med. 1981, 10, 45–50. [Google Scholar] [CrossRef]
- Liu, T.; Inoue, Y.; Shibata, K. Wearable force sensor with parallel structure for measurement of ground-reaction force. Measurement 2007, 40, 644–653. [Google Scholar] [CrossRef]
- Chuah, M.Y.; Kim, S. Enabling force sensing during ground locomotion: A bio-inspired, multi-axis, composite force sensor using discrete pressure mapping. IEEE Sens. J. 2014, 14, 1693–1703. [Google Scholar] [CrossRef]
- Cordero, A.F.; Koopman, H.; Van Der Helm, F.C.T. Use of pressure insoles to calculate the complete ground reaction forces. J. Biomech. 2004, 37, 1427–1432. [Google Scholar] [CrossRef] [PubMed]
- Jiang, X.; Napier, C.; Hannigan, B.; Eng, J.J.; Menon, C. Estimating Vertical Ground Reaction Force during Walking Using a Single Inertial Sensor. Sensors 2020, 20, 4345. [Google Scholar] [CrossRef] [PubMed]
- Wouda, F.J.; Matteo, G.; Giovanni, B.; Maartens, E.; Reenalda, J.; van Beijnum, B.-J.F.; Veltink, P.H. Estimation of Vertical Ground Reaction Forces and Sagittal Knee Kinematics During Running Using Three Inertial Sensors. Front. Physiol. 2018, 9, 218. [Google Scholar] [CrossRef] [PubMed]
- Refai, M.I.M.; van Beijnum, B.J.F.; Buurke, J.H.; Veltink, P.H. Portable Gait Lab: Estimating 3D GRF Using a Pelvis IMU in a Foot IMU Defined Frame. IEEE Trans. Neural Syst. Rehabil. Eng. 2020, 28, 1308–1316. [Google Scholar] [CrossRef] [PubMed]
- Verheul, J.; Gregson, W.; Lisboa, P.; Vanrenterghem, J.; ARobinson, M. Whole-body biomechanical load in running-based sports: The validity of estimating ground reaction forces from segmental accelerations. J. Sci. Med. Sport 2019, 22, 716–722. [Google Scholar] [CrossRef] [PubMed] [Green Version]
- Zajac, F.; Gordon, M. Determining muscle’s force and action in multi-articular movement. Exerc. Sport Sci. Rev. 1989, 17, 187–230. [Google Scholar] [PubMed]
- Wu, C.C.; Chen, Y.J.; Hsu, C.S.; Wen, Y.-T.; Lee, Y.-J. Multiple Inertial Measurement Unit Combination and Location for Center of Pressure Prediction in Gait. Front. Bioeng. Biotechnol. 2020, 8, 566474. [Google Scholar] [CrossRef] [PubMed]
- Shahabpoor, E.; Pavic, A. Estimation of vertical walking ground reaction force in real-life environments using single IMU sensor. J. Biomech. 2018, 79, 181–190. [Google Scholar] [CrossRef] [PubMed]
- Neugebauer, J.M.; Hawkins, D.A.; Beckett, L. Estimating youth locomotion ground reaction forces using an accelerometer-based activity monitor. PLoS ONE 2012, 7, e48182. [Google Scholar] [CrossRef] [PubMed]
- Tan, T.; Chiasson, D.P.; Hu, H.; Shull, P.B. Influence of IMU position and orientation placement errors on ground reaction force estimation. J. Biomech. 2019, 97, 109416. [Google Scholar] [CrossRef] [PubMed]
- Alcantara, R.S.; Edwards, W.B.; Millet, G.Y.; Grabowski, A.M. Predicting continuous ground reaction forces from accelerometers during uphill and downhill running: A recurrent neural network solution. PeerJ 2022, 10, e12752. [Google Scholar] [CrossRef] [PubMed]
- Vaswani, A.; Shazeer, N.; Parmar, N.; Uszkoreit, J.; Jones, L.; Gomez, A.N.; Kaiser, Ł.; Polosukhin, I. Attention Is All You Need. arXiv 2017, arXiv:1706.03762. [Google Scholar]
- Xia, D.; Zhu, Y.; Zhang, H. Faster Deep Inertial Pose Estimation with Six Inertial Sensors. Sensors 2022, 22, 7144. [Google Scholar] [CrossRef] [PubMed]
- Kazemi, S.M.; Goel, R.; Eghbali, S.; Ramanan, J.; Sahota, J.; Thakur, S.; Wu, S.; Smyth, C.; Poupart, P.; Brubaker, M. Time2Vec: Learning a Vector Representation of Time. arXiv 2019, arXiv:1907.05321. [Google Scholar]
- Louis, N.; Templin, T.N.; Eliason, T.D.; Nicolella, D.P.; Corso, J.J. Learning to Estimate External Forces of Human Motion in Video. arXiv 2022, arXiv:2207.05845. [Google Scholar]


| Model | MSE | MAPE |
|---|---|---|
| RNN | 0.0365 | 84.4239 |
| LSTM | 0.0293 | 82.7453 |
| Transformer | 0.0218 | 79.2751 |
| Transformer + Gate_MSE | 0.0227 | 80.0136 |
| Number of Encoders | MSE | MAPE |
|---|---|---|
| 1 | 0.0325 | 90.5268 |
| 2 | 0.0237 | 81.5452 |
| 3 | 0.0218 | 79.2751 |
| 4 | 0.0216 | 78.4532 |
| Data format | MSE | MAPE |
|---|---|---|
| Acceleration + Rotation | 0.0325 | 90.5268 |
| Acceleration + Joint position | 0.0237 | 81.5452 |
| Acceleration + Joint position + PCA | 0.0218 | 79.2751 |
| Wearing Method | MSE | MAPE |
|---|---|---|
| Ankle | 0.0294 | 83.1910 |
| Ankle + Pelvis | 0.0218 | 79.2751 |
| Ankle + Pelvis + Thigh | 0.0205 | 78.7815 |
Disclaimer/Publisher’s Note: The statements, opinions and data contained in all publications are solely those of the individual author(s) and contributor(s) and not of MDPI and/or the editor(s). MDPI and/or the editor(s) disclaim responsibility for any injury to people or property resulting from any ideas, methods, instructions or products referred to in the content. |
© 2023 by the authors. Licensee MDPI, Basel, Switzerland. This article is an open access article distributed under the terms and conditions of the Creative Commons Attribution (CC BY) license (https://creativecommons.org/licenses/by/4.0/).
Share and Cite
Zhu, Y.; Xia, D.; Zhang, H. Using Wearable Sensors to Estimate Vertical Ground Reaction Force Based on a Transformer. Appl. Sci. 2023, 13, 2136. https://doi.org/10.3390/app13042136
Zhu Y, Xia D, Zhang H. Using Wearable Sensors to Estimate Vertical Ground Reaction Force Based on a Transformer. Applied Sciences. 2023; 13(4):2136. https://doi.org/10.3390/app13042136
Chicago/Turabian StyleZhu, Yeqing, Di Xia, and Heng Zhang. 2023. "Using Wearable Sensors to Estimate Vertical Ground Reaction Force Based on a Transformer" Applied Sciences 13, no. 4: 2136. https://doi.org/10.3390/app13042136