Article

Parameter Study for Child Booster Seats in Frontal Collisions

School of Automotive and Traffic Engineering, Jiangsu University, Zhenjiang 212013, China
*
Author to whom correspondence should be addressed.
Appl. Sci. 2023, 13(4), 2206; https://doi.org/10.3390/app13042206
Submission received: 3 December 2022 / Revised: 29 January 2023 / Accepted: 1 February 2023 / Published: 9 February 2023

Abstract

:
To improve the safety of middle-aged and older child occupants, this paper proposes a framework to effectively design the layout parameters of child booster seats. The layout parameters of the child booster seat include both the three-point seat belt restraint path parameters and the structural design parameters. First, based on a validated frontal collision simulation model with the sled test, a parametric study of child booster seats for different injury indices is performed based on ECE R129 regulations in terms of a Q6 child dummy. To evaluate the effects of each parameter on the overall injury for children, the modified Weighted Injury Criterion (WIC) is proposed. Then, a parameter sensitivity based on the modified WIC is conducted to screen out parameters that have a significant impact on the response of injury indices. The position of the shoulder belt guide and the stiffness of the backrest have dominant effects on the WIC. Finally, a full factorial experiment is conducted for the above selected design variables based on the newly proposed WIC. The identified design position of the shoulder belt guide is 48 mm and its value corresponds to 30 mm of the relevant headrest position, which is explicitly utilized in the design process. The identified stiffness of the backrest is 30,400 Nm/rad. The corresponding WIC is decreased significantly, and the value is reduced by 19.6% compared with the reference model.

1. Introduction

According to “Global Road Safety 2010–2018”, traffic accidents are the leading cause of death for 5–20 year olds [1]. In particular, regarding the safety of middle-aged and older children in vehicles, 3–11 year olds account for 42% of child occupant fatalities, with approximately 62% of children sitting in booster seats at the time of the collision [2,3]. The booster seat is a Child Restraint System (CRS) for middle-aged and older children and can significantly reduce children’s injuries during a motor vehicle crash. According to the Washington State motor vehicle crash data between 2002 and 2015 involving children aged 8–12 years, child occupants using booster seats were 29% less likely to be injured than those restrained only by seat belts [4].
The booster seat is equipped with a three-point seat belt to constrain the child occupants, so the study of the general layout parameters of the booster seat includes both the study of the three-point seat belt restraint path parameters and the structural design parameters [5,6]. Since the three-point seat belt restraint path is designed according to the adult body size, the situation occurs that the shoulder belt is too close to the child’s neck and the lap belt slips from the pelvic bone position during the seat belt operation process, resulting in a larger neck and abdominal injury to the child during a collision [7,8]. Therefore, the restraint path specification of a three-point seat belt is a primary factor in achieving an ideal level of protection [9].
In addition, during the process of analyzing the kinematic posture changes and the injury indices of child dummies during the collision, it was found that the adjustment of +structural design parameters of CRS has a large impact on child occupant injuries [10,11]. Johansson M. et al. [12] established a frontal collision simulation model for CRS and analyzed the effects of seat belt webbing stiffness variation. The results showed that the seat belts absorb the impact energy, so the webbing stiffness directly affects the injury response of the dummy. Bing et al. [13] analyzed the correlation between the seat cushion angle and injury indices, and between the backrest stiffness and injury indices. The results showed that the seat cushion angle can influence a child’s sitting posture before the car crash and kinematic posture in the car crash, while the backrest stiffness affects the deformation of the seat, thereby affecting the response of injury indices. To analyze the root causes of bias during experimental testing of CRS, Zhang et al. [14] explored the influence of the initial tension of the shoulder belt by changing the initial position of the shoulder belt. Therefore, the suitable design of the structural design parameters of the CRS can enhance the safety of child occupants [15]. Currently, most studies have only investigated the effects of single or partial parameters on the response of injury indices. However, the overall injury severity is a comprehensive response of different parts of a human body induced by various parameters of the CRS. To obtain those appropriate design parameters, a multi-objective optimization algorithm can be constructed [16,17]. However, multi-objective optimization and design may not be the best strategy for engineering applications due to its slow convergence and a lack of direct observability in high-dimensional spaces [18]. To accelerate the efficiency of product development, time-consuming multi-objective optimization and design can be transformed into single-objective optimization and design. The single-objective optimization and design with the Weighted Injury Criterion (WIC) as the optimization and design objective can facilitate an efficient search of the best solution [19].
However, the traditional occupant Weighted Injury Criterion (WIC) [20] is designed for adults and considers the Head Injury Criterion, 3 ms chest resultant acceleration, the thoracic compression deformation and maximal axial forces of the left and right thigh. Regarding the injury types of child occupants in booster seats, the thoracic injury usually does not occur due to the higher degree of flexibility of the ribs, compared with those of adults [21,22]. Moreover, since the child booster seat is placed on the back seats of the vehicle and does not come into contact with the vehicle’s instrumental panel, there are no injuries due to axial forces of the left and right thighs. In the China-New Car Assessment Program (C-NCAP) [23,24], both Head Injury Criterion and head resultant acceleration can be utilized to evaluate injury. There is a lack of knowledge to choose the suitable head injury index. Further, the traditional WIC does not consider the neck injury, which is an important index in C-NCAP. Therefore, a modified WIC is indispensable to evaluate the child injury.
The main purpose of this manuscript is to propose a design framework for the layout parameters of a child booster seat. First, evaluation of each layout parameter is conducted and their impacts on the child injury indices are ranked based on the sensitivity study. Then, two top influential parameters of backrest stiffness and shoulder belt guide position are chosen as the design parameters of the child booster seat. Lastly, a full factorial experiment is performed to identify the backrest stiffness and shoulder belt guide position based on a newly proposed WIC with the consideration of neck injury. The remainder of the present work is organized as follows: in Section 2, a RADIOSS frontal collision simulation model of a child booster seat is established and validated via a sled test. Section 3 describes the design framework of the sensitivity analysis-based full factorial experiment. In Section 4, a single-factor study is performed for each layout parameter on the child injury indices, including two three-point seat belt restraint path parameters and four structural design parameters. In Section 5, a corresponding parameter sensitivity study is further conducted, and the design variables of the backrest stiffness and the shoulder belt guide position are selected as the target design variables. In Section 6, a full factorial experiment is performed to determine the design values for the backrest stiffness and the shoulder belt guide position based on the modified WIC. Section 7 and Section 8 are the discussion and conclusion.

2. The Frontal Collision Simulation Model with a Child Booster Seat

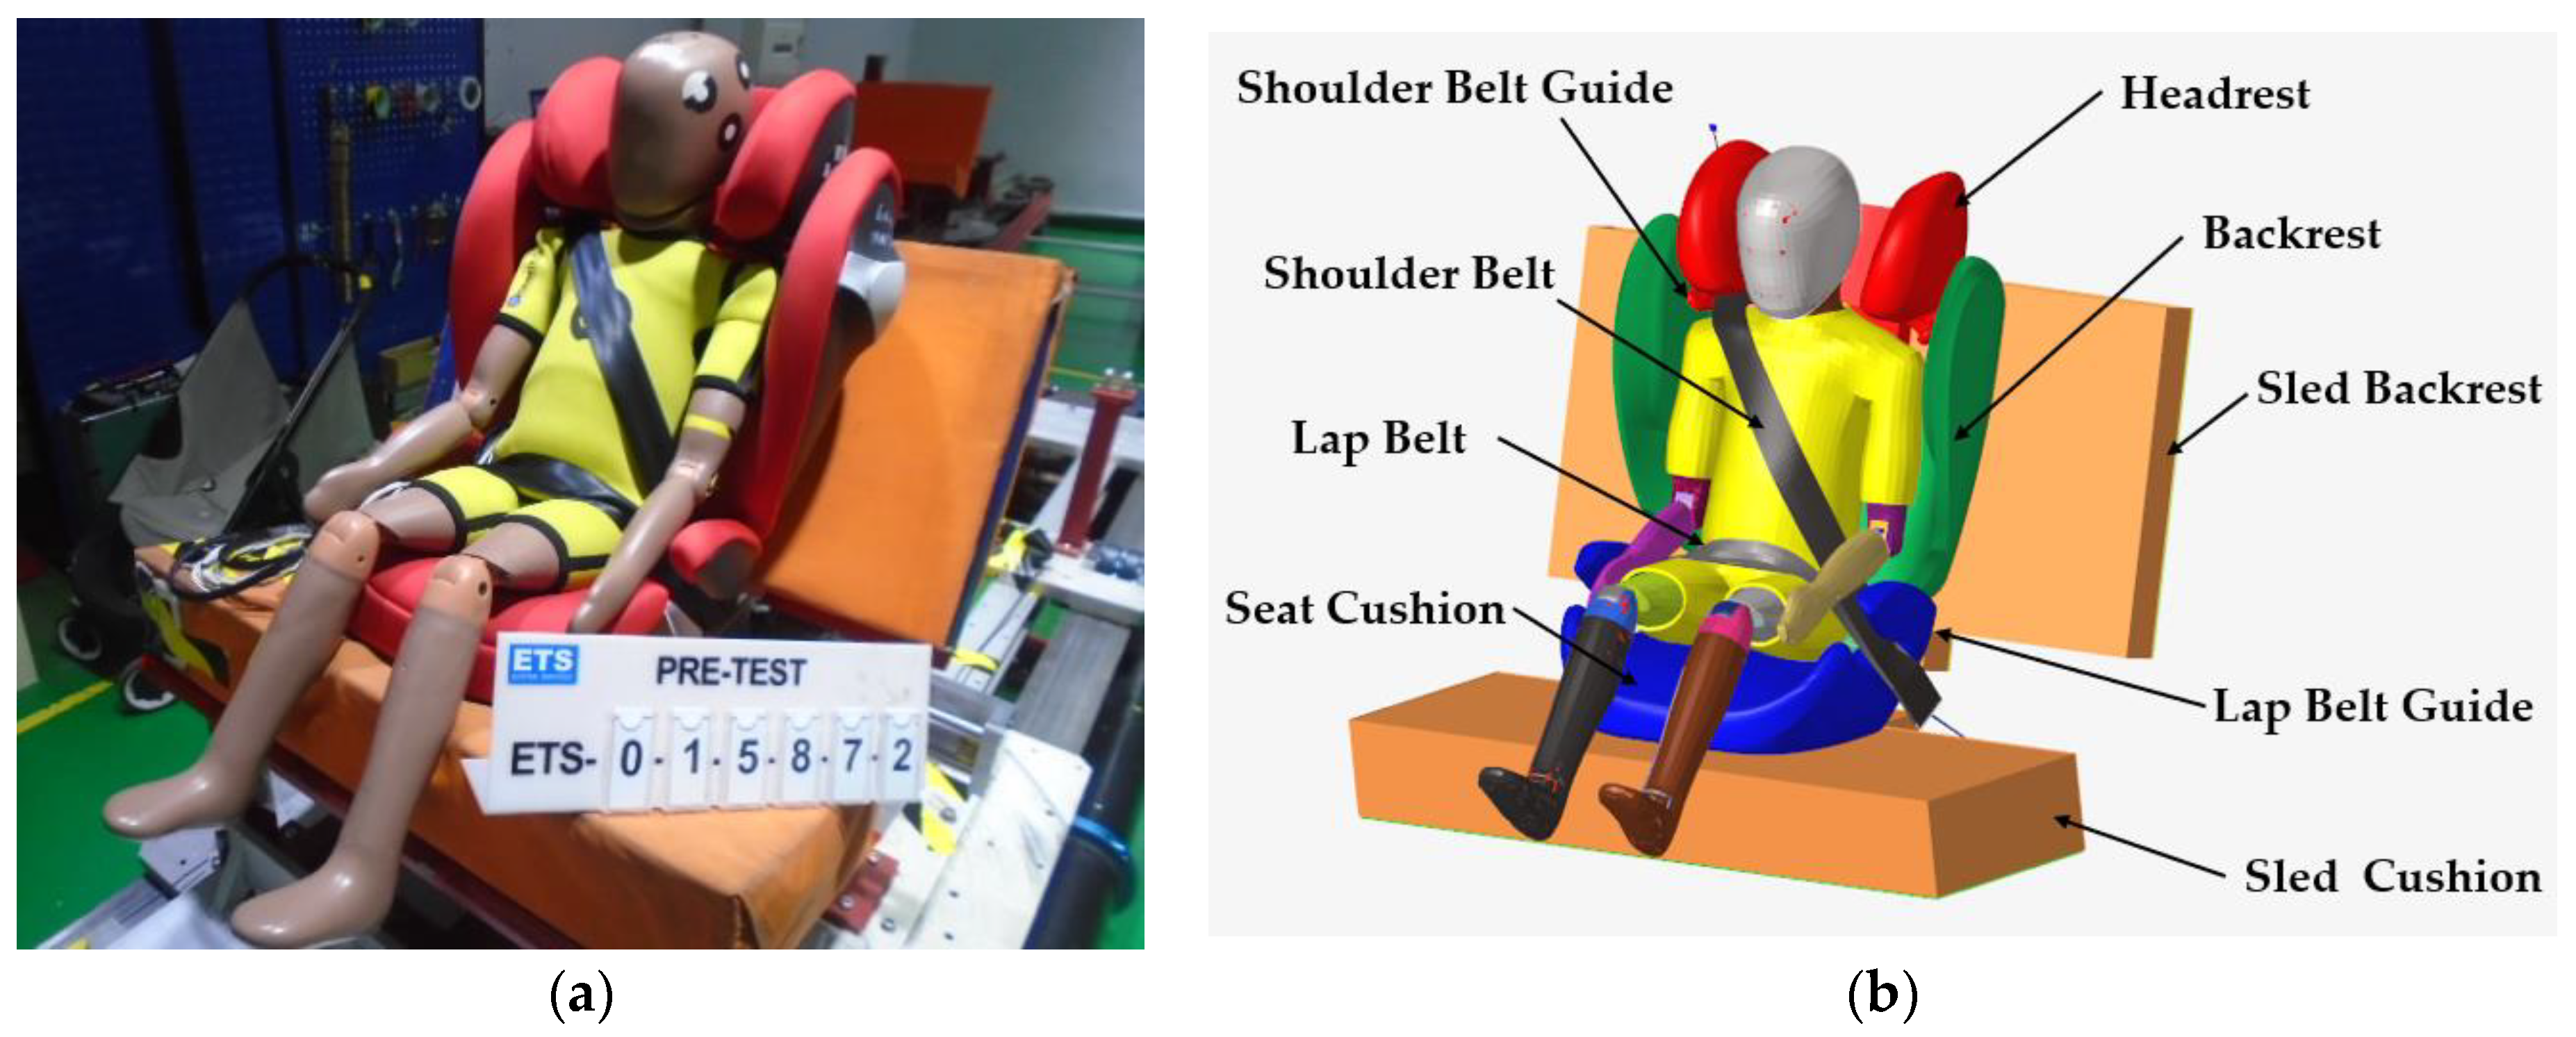
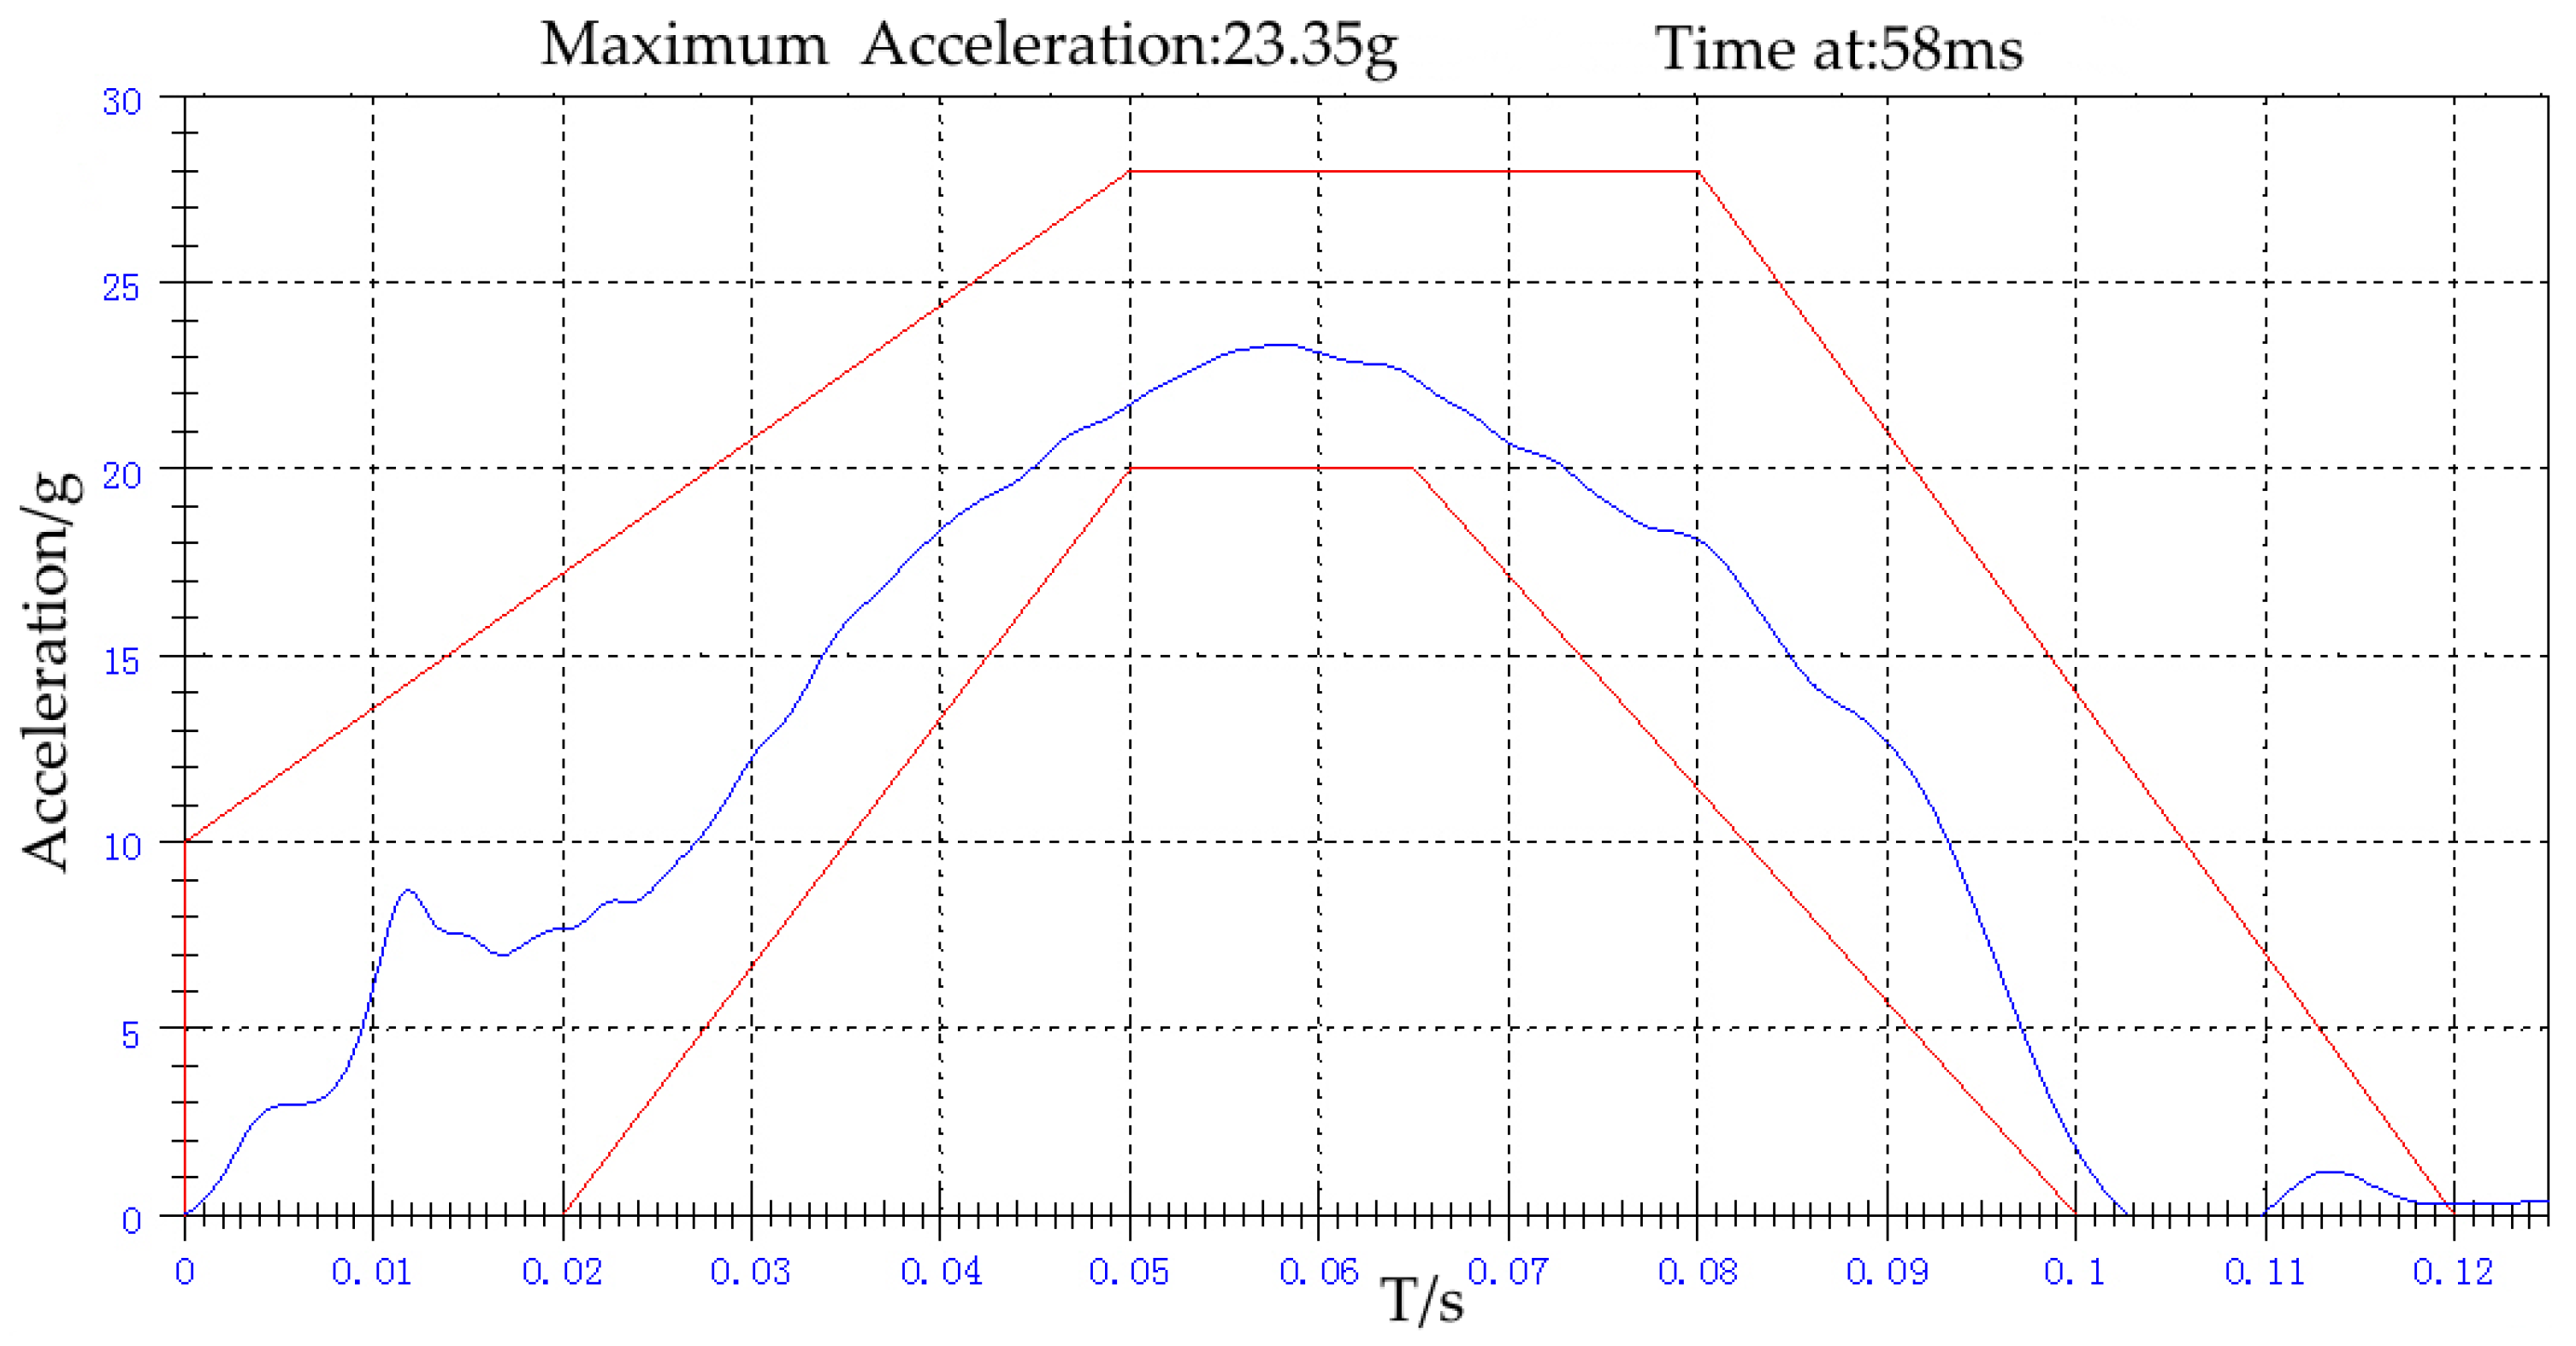
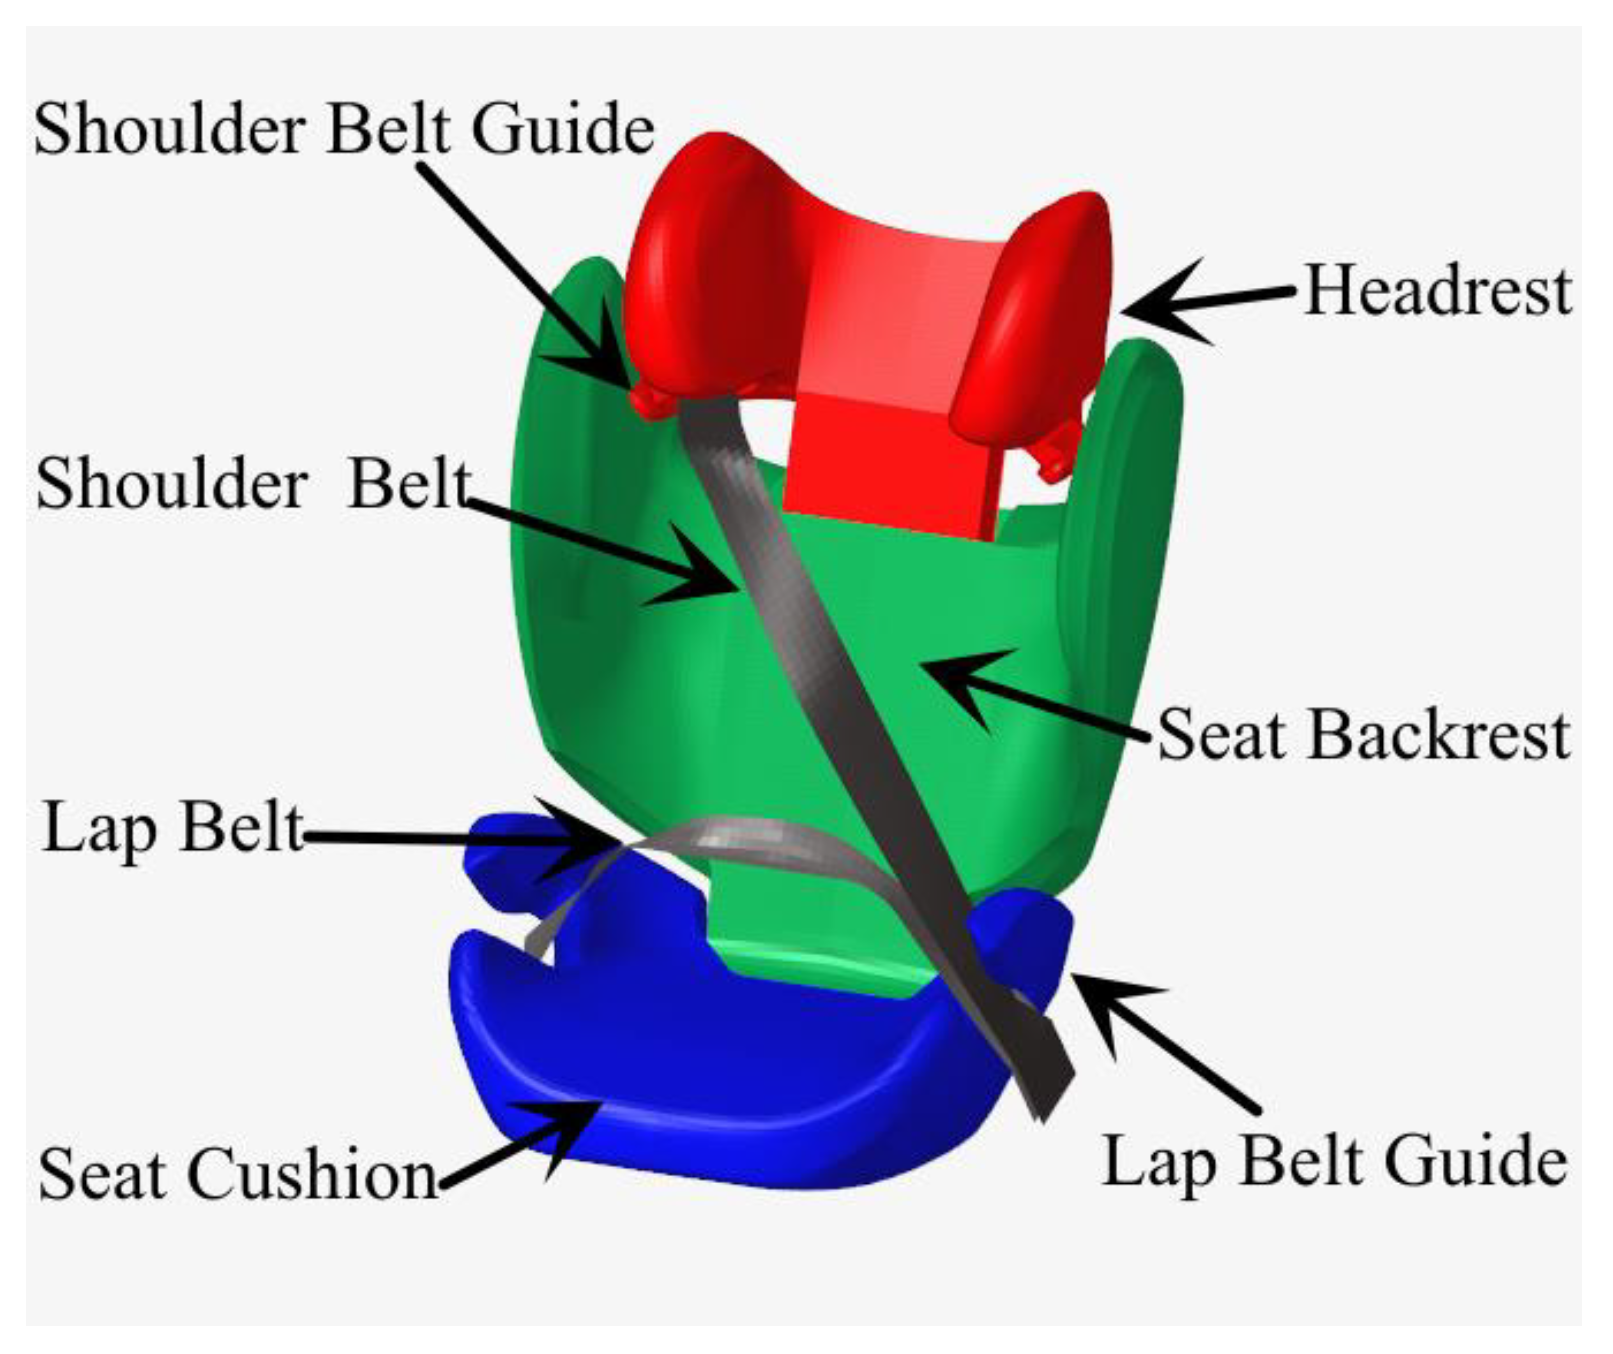
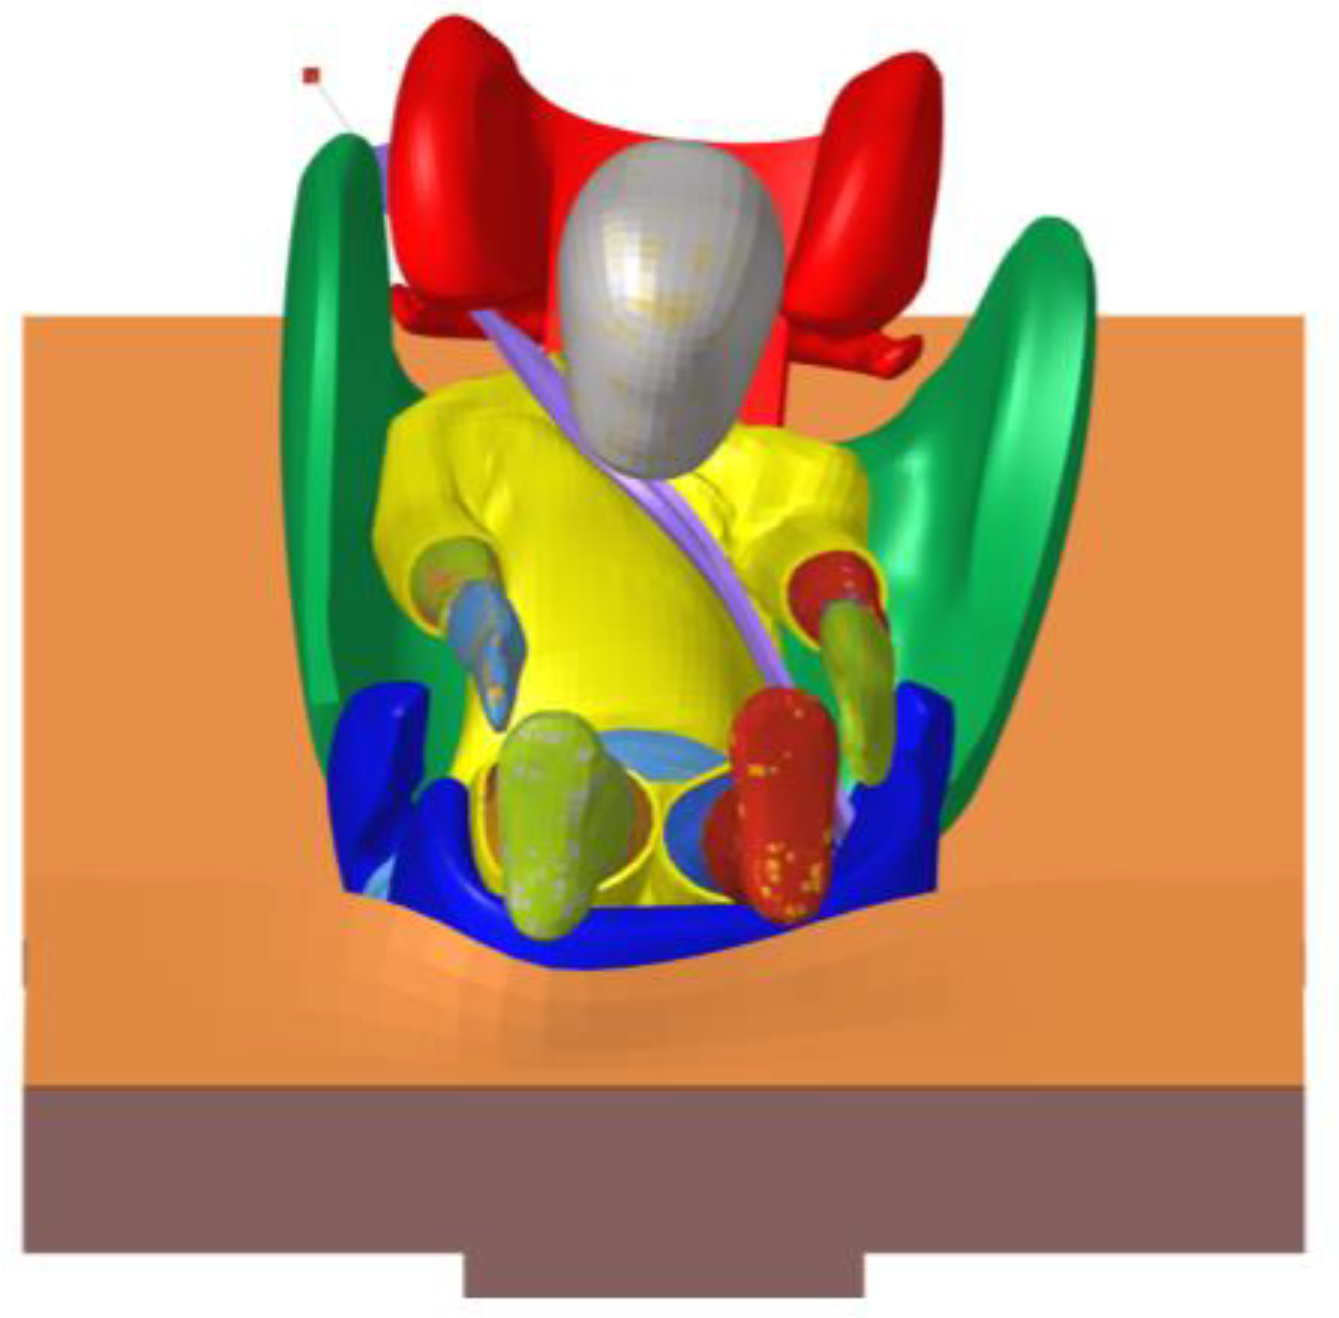
2.1. Establishment of the Simulation Model

According to ECE R129 regulations, this paper establishes a sled model consisting of a sled cushion, sled cushion fixing plate, ISOFIX fixing rod and seat belt anchorage point. A branded child booster seat has been selected as the research object, which is restrained by the three-point seat belt. The seat belt includes three parts: shoulder belt, lap belt and reel retractor. The Q series 6-year-old child dummy with excellent biological fidelity and injury assessment capability is selected for the sled test [25]. To eliminate the gaps between the dummy and the booster seat, and between the dummy and the seat belt, the three-point seat belt was adjusted till its tension stayed within 50 ± 5 N and the child dummy and the booster seat are both well restrained. The final setup of a child booster seat during the frontal sled test is shown in Figure 1a.
Figure 1b illustrates the components of the child booster seat and sled model. The child booster seat model includes headrest, backrest, seat cushion, shoulder belt guide and lap belt guide and those parts are discretized via shell elements. PP-K8009 are specified for the child booster seat. Its Young’s module, Poisson’s ratio, Yielding stress and density are 1.2 GPa, 0.3, 25 MPa and 906 kg/m3, respectively. The sled model includes sled cushion and sled backrest and they are discretized via hexagonal elements. According to ECE R 129 regulation, PU foam is specified for the sled model. The seatbelt is modelled via fabric material. The belt width is 48 mm and the elongation is 8% under 10 kN. The total element number of the child booster seat and the sled model is 576,789. Regarding connection setup between different parts, the headrest is connected with the backrest via contact and the friction coefficient is 0.33. The backrest is also connected with the seat cushion via contact and the friction coefficient is 0.33. The shoulder belt guide and the lap belt guide are connected to the headrest and seat cushion, respectively, via rivets and this type of connection is modelled via rigid body connections. Figure 2 illustrates the acceleration pulse (the blue curve) utilized both in the test and simulation and the range (the red curves) specified in ECE R 129 regulation.
During the procedure of dummy positioning, dynamic balance is often performed to correctly position the dummy and seat belts [26,27]. While in the current study, all positioning data are directly measured from the sled test and the dynamic balance associated with dummy positioning is not necessary.

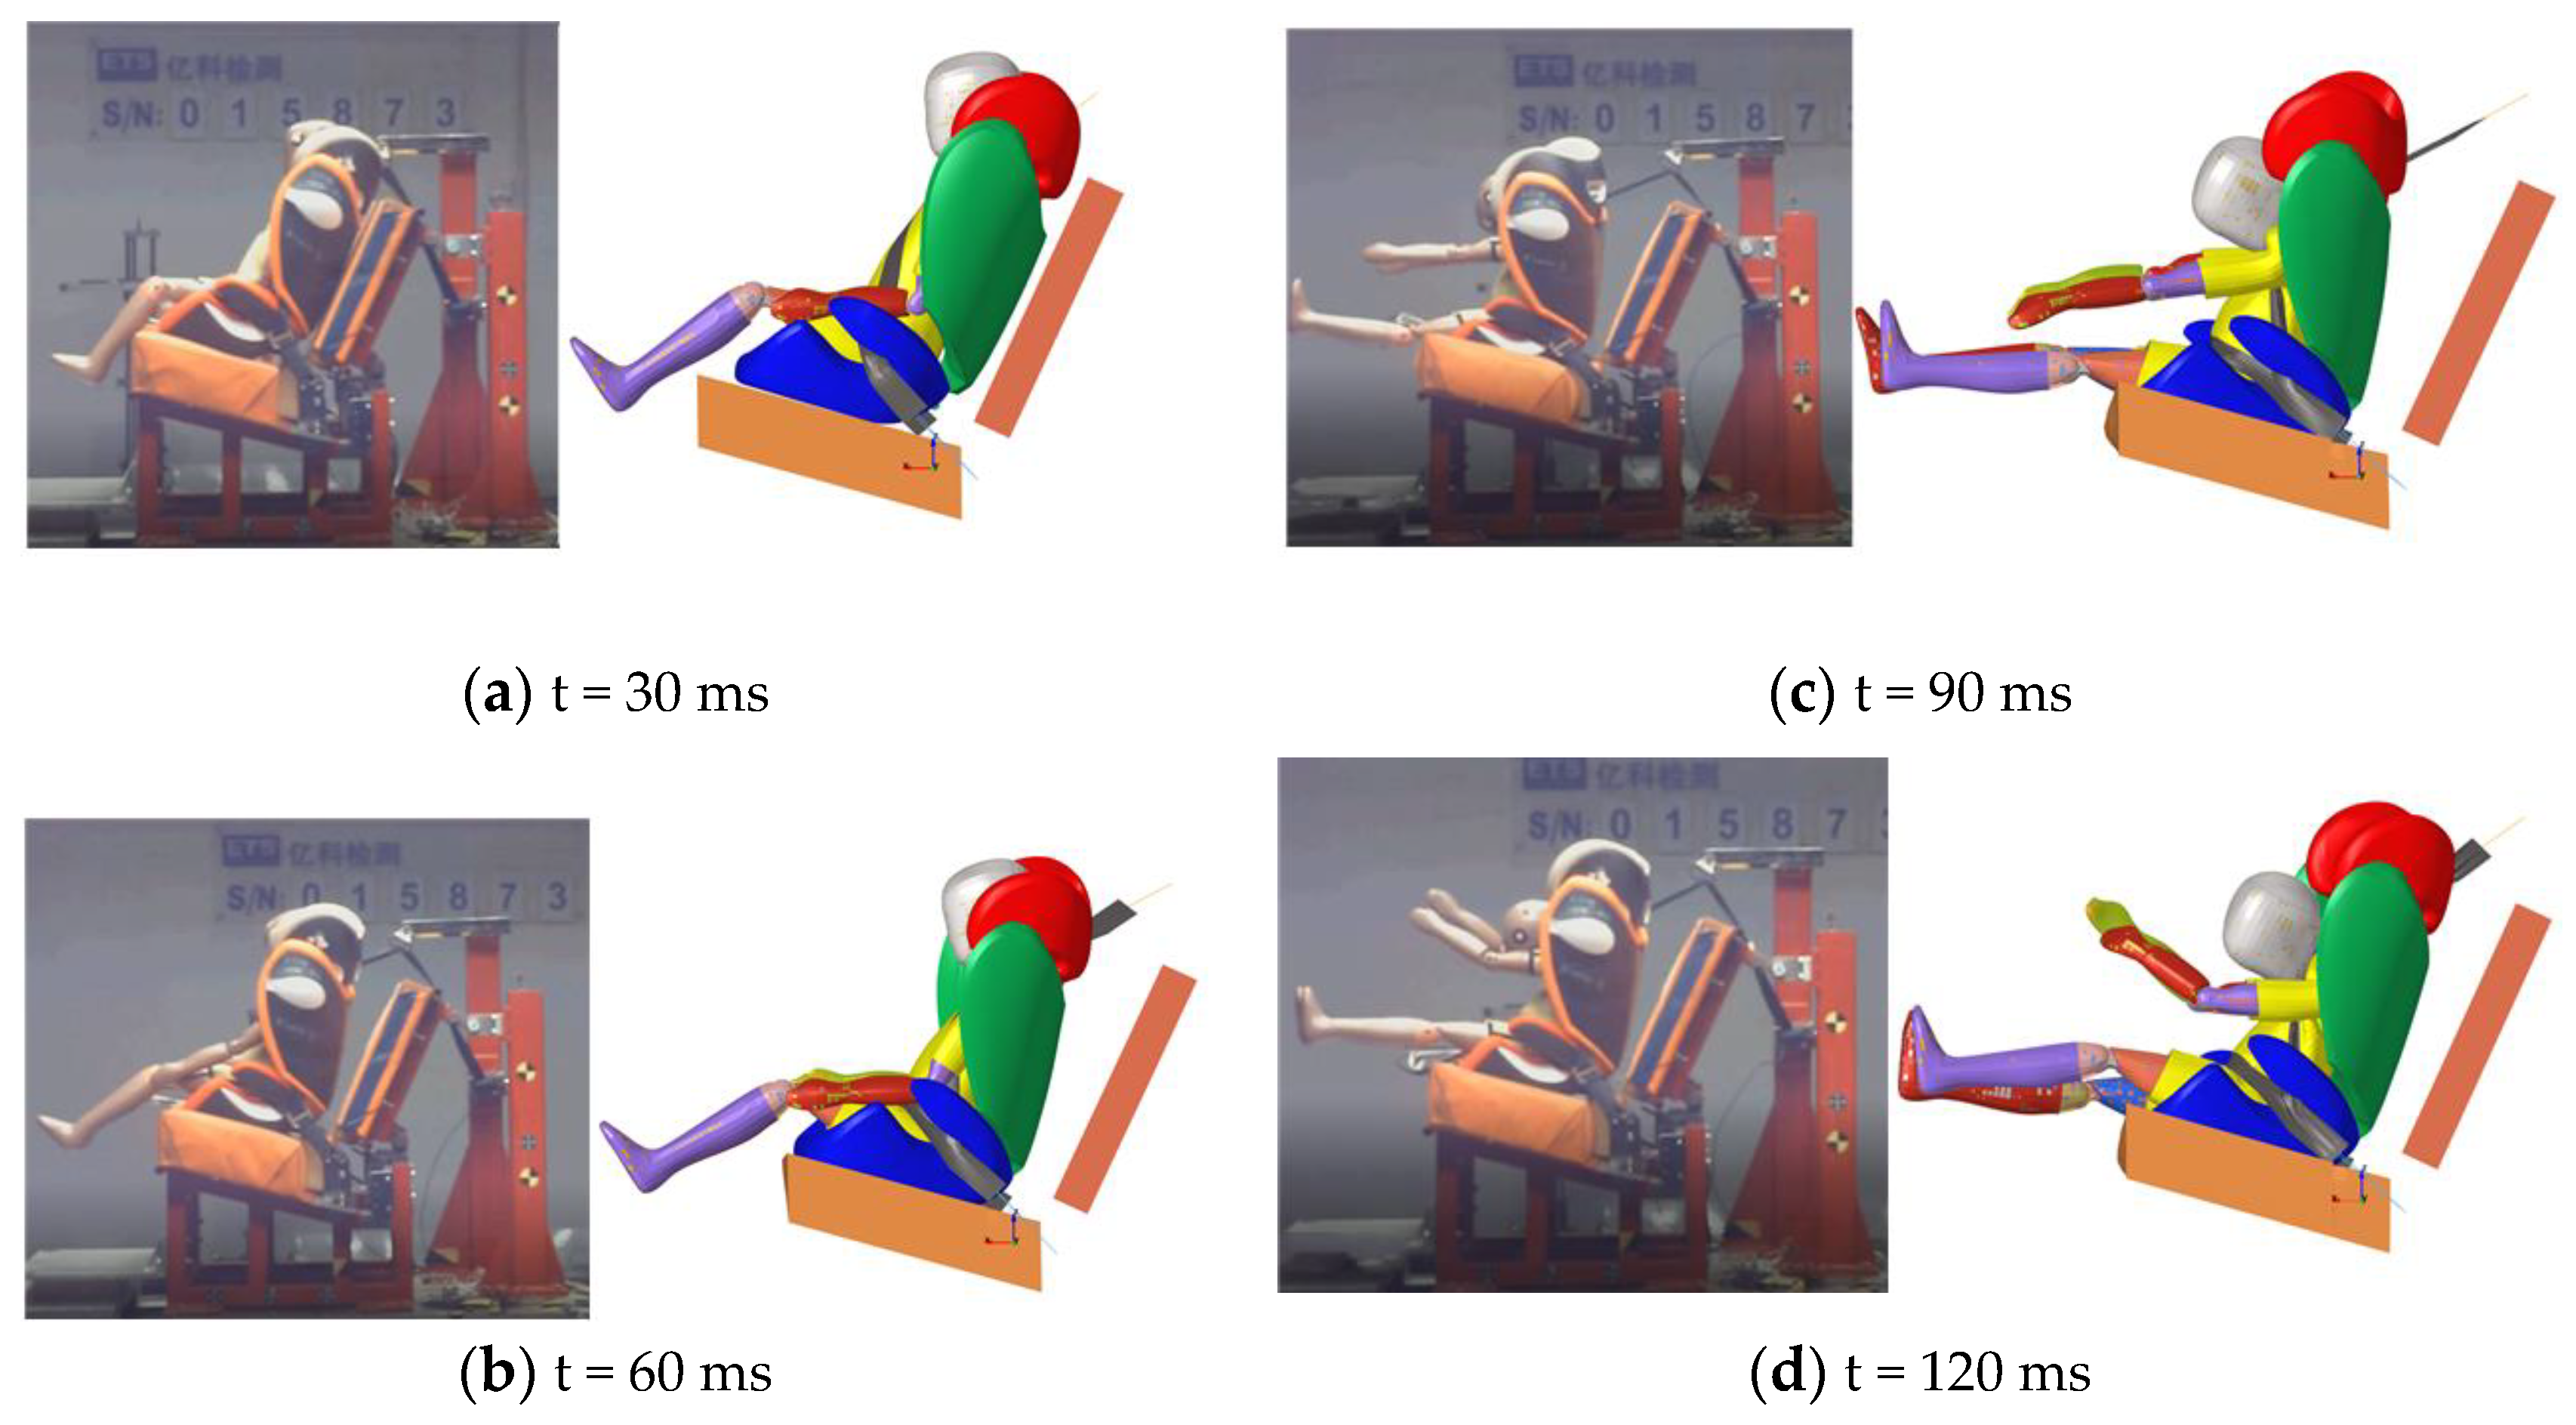
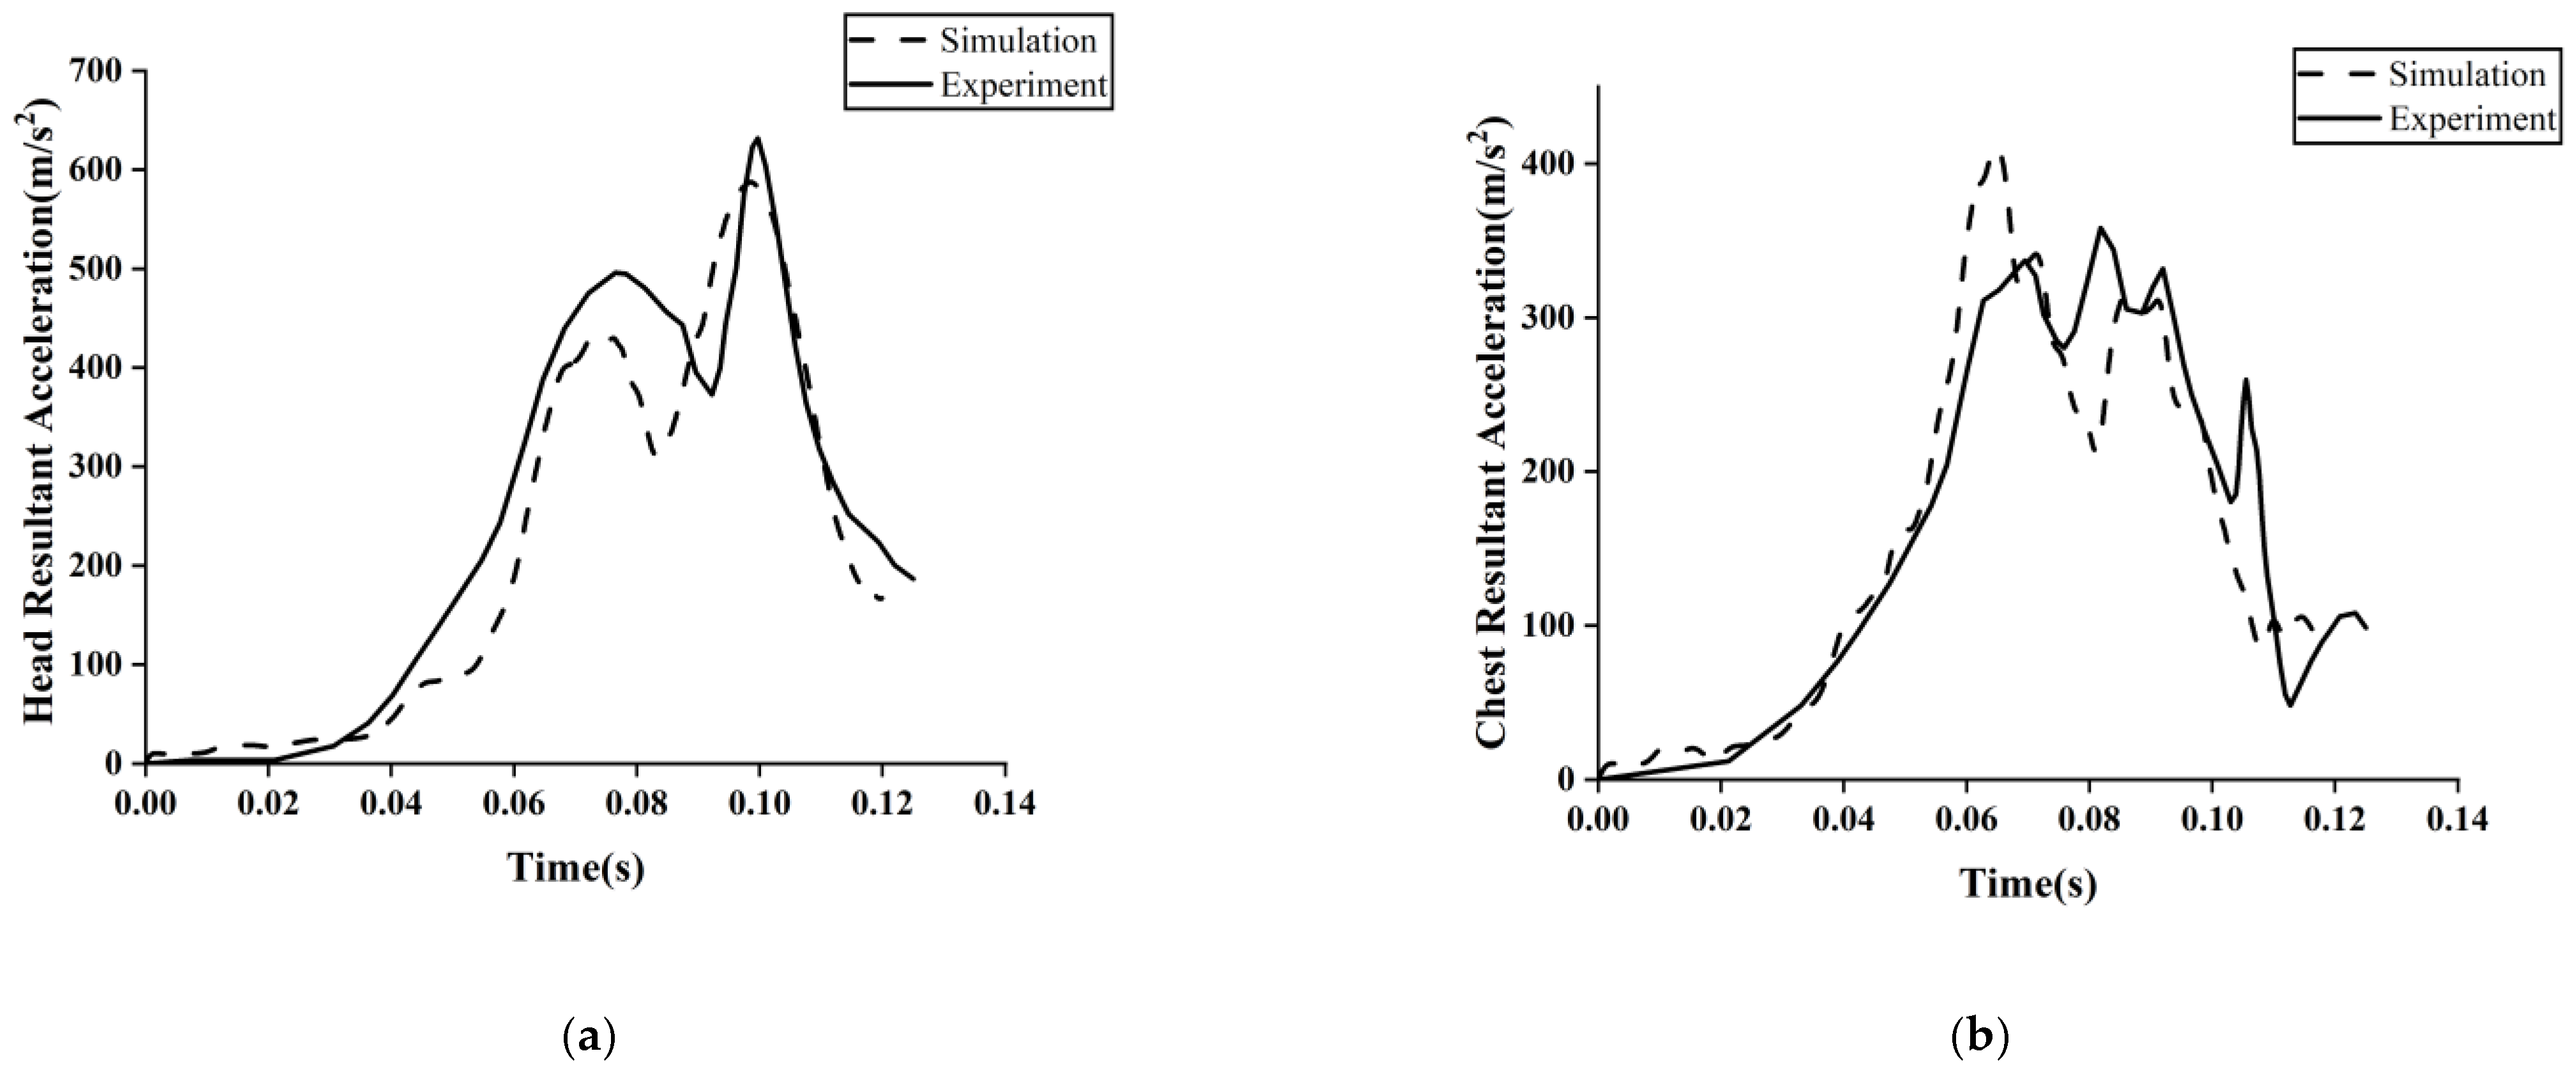
2.2. Validation of the Simulation Model
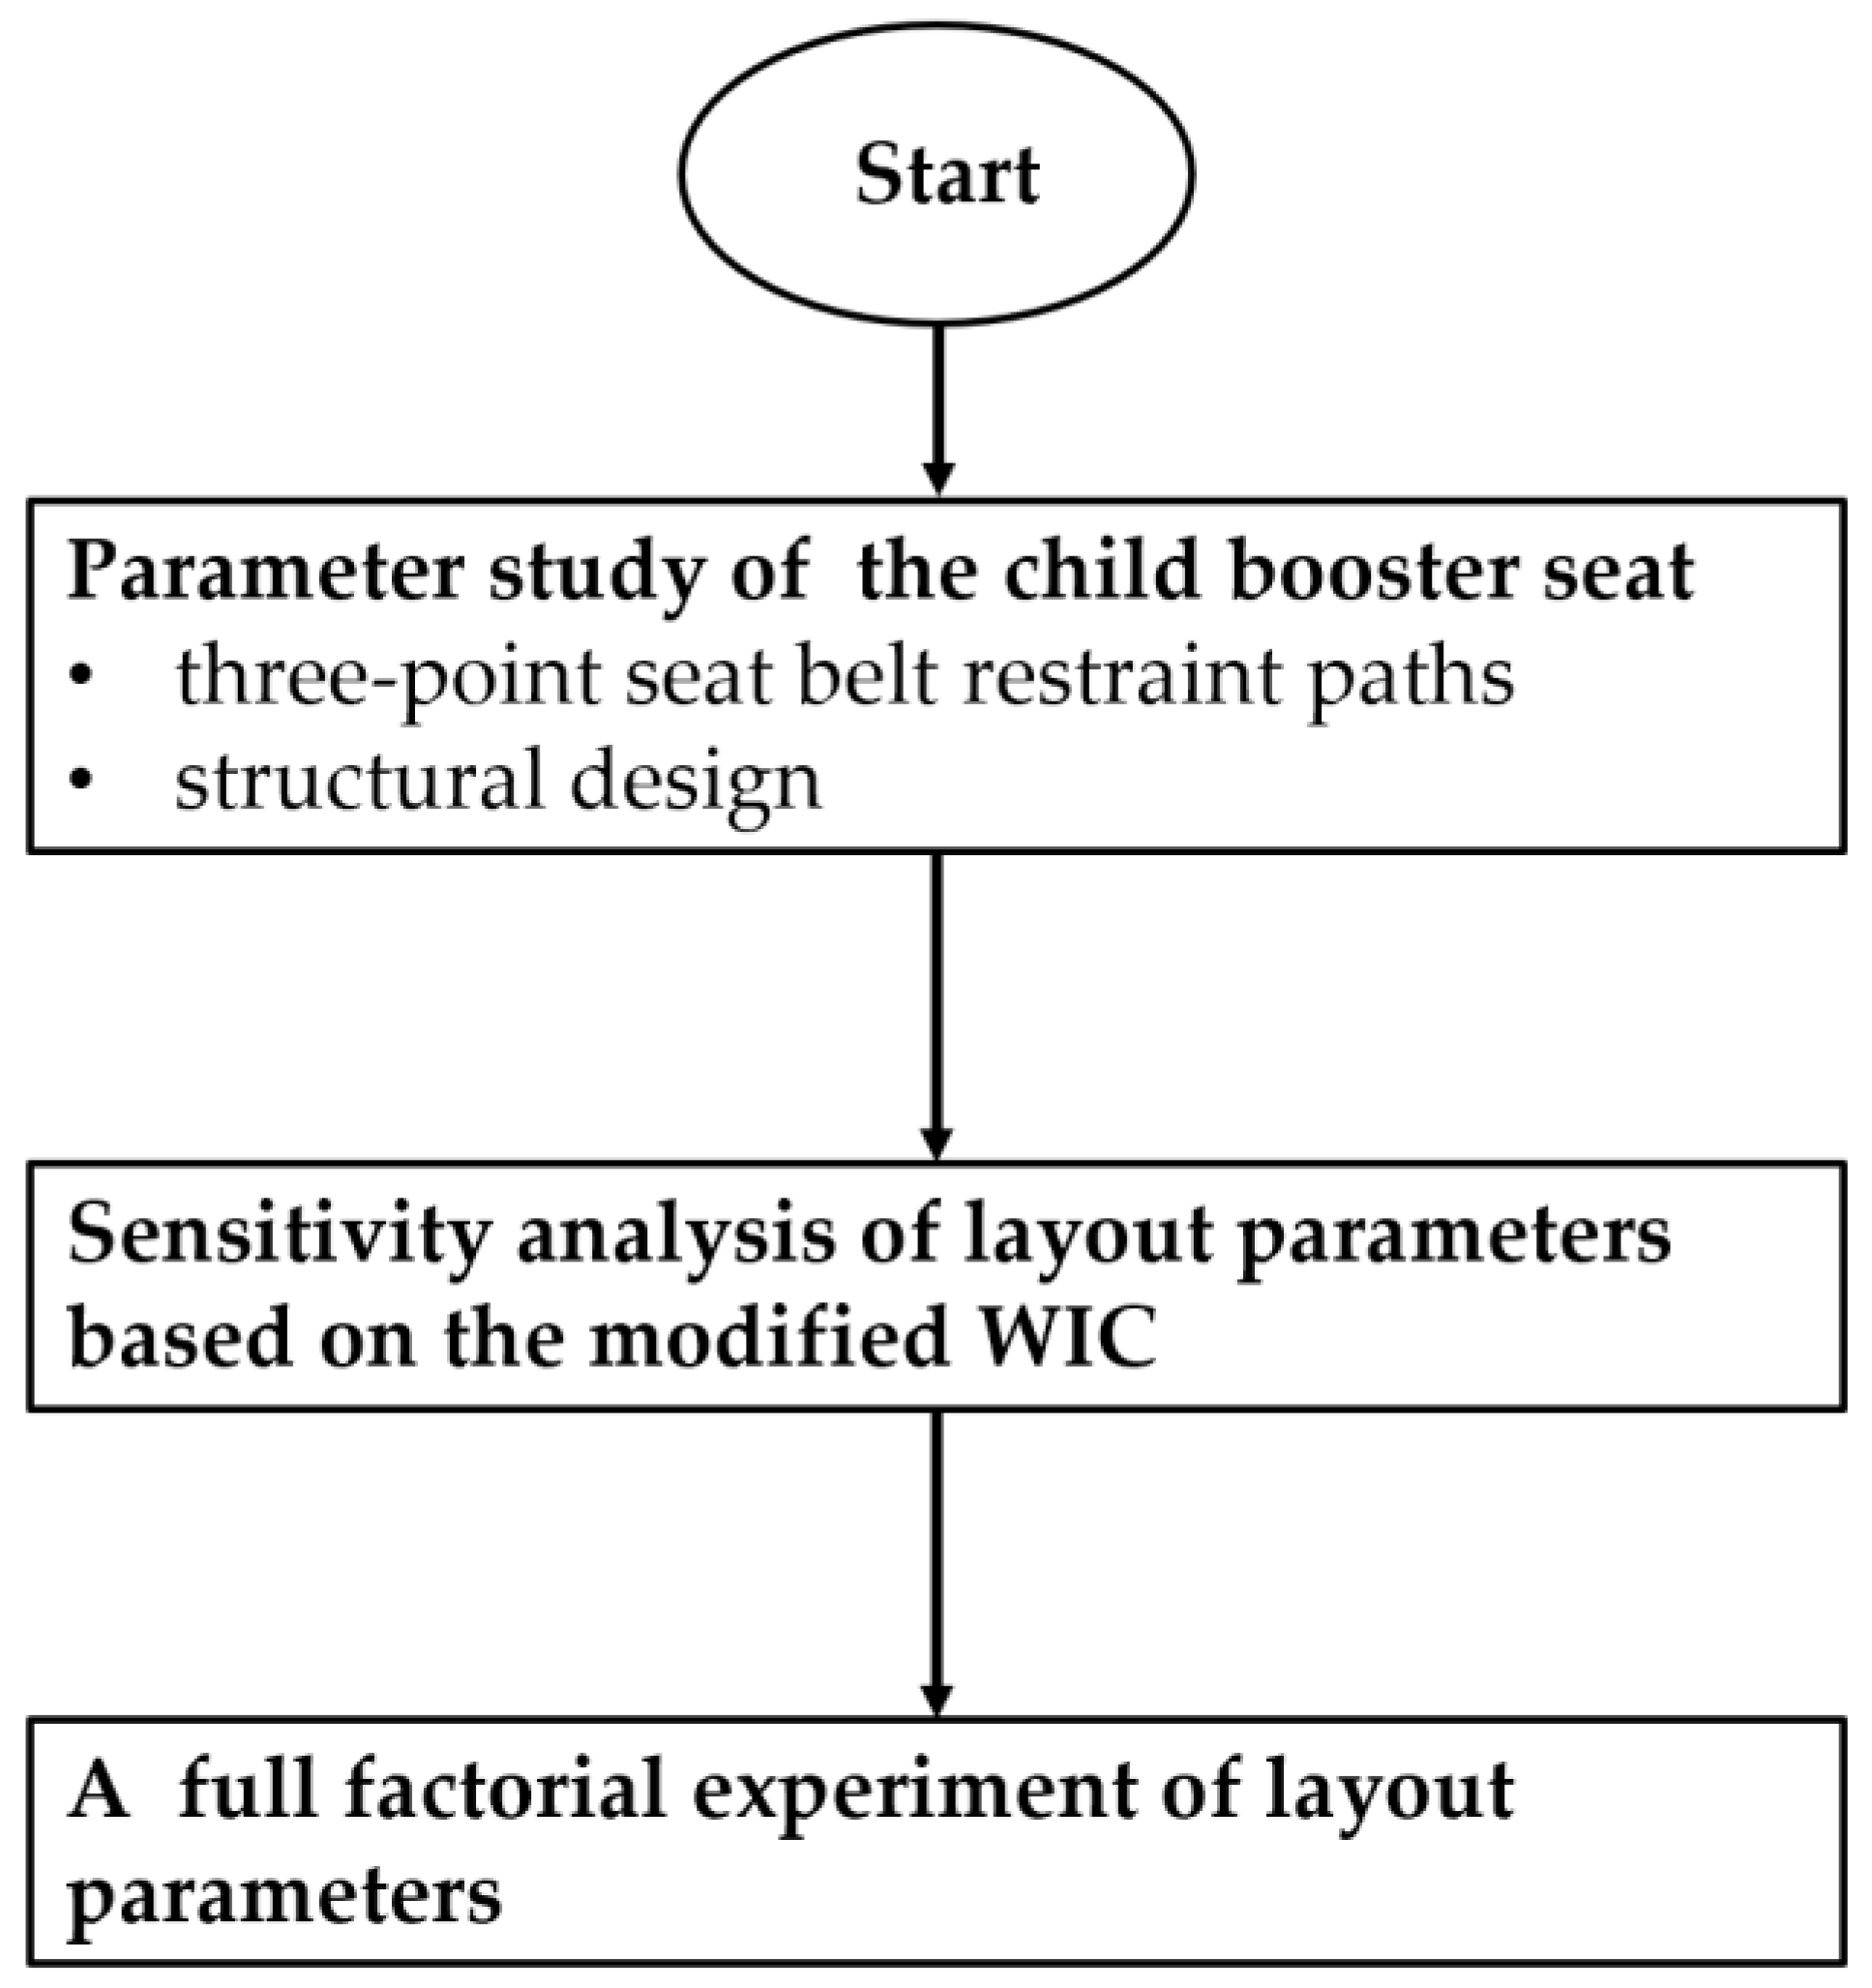
In order to validate the effectiveness of the simulation model, the simulation animation results are compared directly with the video footage taken by a high-speed camera in the sled test at 30, 60, 90 and 120 ms as shown in Figure 3. The kinematic postures of the child dummy at various times in the simulation agree well with those of the sled test. Figure 4a,b illustrate the time history curve comparison between FEA modeling and the sled test with respect to the head and chest resultant accelerations. The accelerations obtained from the simulation have good agreement with the test data for both the general trend and the peak values. Further, four injury indices from the simulation are compared with the results obtained from experiment testing. Overall, the simulation results agree well with the experimental data and the maximal difference is below 15%. As shown in Table 1, the errors between simulation results and testing data are −8.7%, −6.7%, −8.1%, 13.9% and 14.5% for 3 ms head resultant acceleration a H , head resultant acceleration peak, 15 ms Head Injury Criterion H I C 15 , 3 ms chest resultant acceleration a C and chest resultant acceleration peak, respectively, based on ECE R129 regulations.
We should notice that in C-NCAP, both 15 ms Head Injury Criterion H I C 15 and the 3 ms head resultant acceleration a H are utilized to evaluate head injury. The 3 ms head resultant acceleration a H reflect a more severe injury according to C-NCAP. The boost seat scores 1.5 points according to 3 ms head resultant acceleration a H and scores 2 points according to 15 ms Head Injury Criterion H I C 15 . Therefore, the 3 ms head resultant acceleration a H is utilized in the modified WIC.

3. Design Framework

Figure 5 illustrates the design framework to effectively determine the layout parameters of a child booster seat based on a modified WIC. First, a parameter study is performed for the layout parameters including two three-point seat belt restraint path parameters and four structural design parameters. The head and chest are the most vulnerable body parts for child occupants in various collision directions and types of CRS. Therefore, based on ECE R129 regulations, the corresponding injury indices of 3 ms head resultant acceleration a H , 3 ms chest resultant acceleration a C are selected. Meanwhile, the three-point seat belt restraint paths also have a great influence on the neck injury and the head horizontal displacement of child occupants. So, the upper neck tension F Z and the head horizontal displacement x H are also selected as the main injury indices according to the ECE R129 regulations. Further, to provide a more comprehensive and accurate evaluation of injury prediction for the child dummy, a modified WIC is proposed, which combines above different injury indices. Based on the modified WIC, the sensitivity analysis is conducted to screen out the dominant design variables. Finally, a simple full factorial experiment can be directly utilized to identify the design values of the above selected layout parameters based on the modified WIC.

4. Parameter Study of Child Booster Seats

The layout parameters of the booster seat are divided into three-point seat belt restraint path parameters and structural design parameters. The specific parts associated with the layout parameters are as shown in Figure 6. First, the three-point seat belt restraint parameters have significant effects on children’s safety. For instance, if the restraint path is too close to a child’s neck, the seat belt will cause severe injury to a child’s neck during a frontal crash and Figure 7 reveals this phenomenon. The upper neck tension F Z is 2.61 kN and the upper neck bending moment M y is 26.8 Nm. Meanwhile, the structural design parameters including the webbing stiffness, the backrest stiffness and the seat cushion angle may strongly affect the seat deformation and the dummy sitting posture and then the child injury indices.

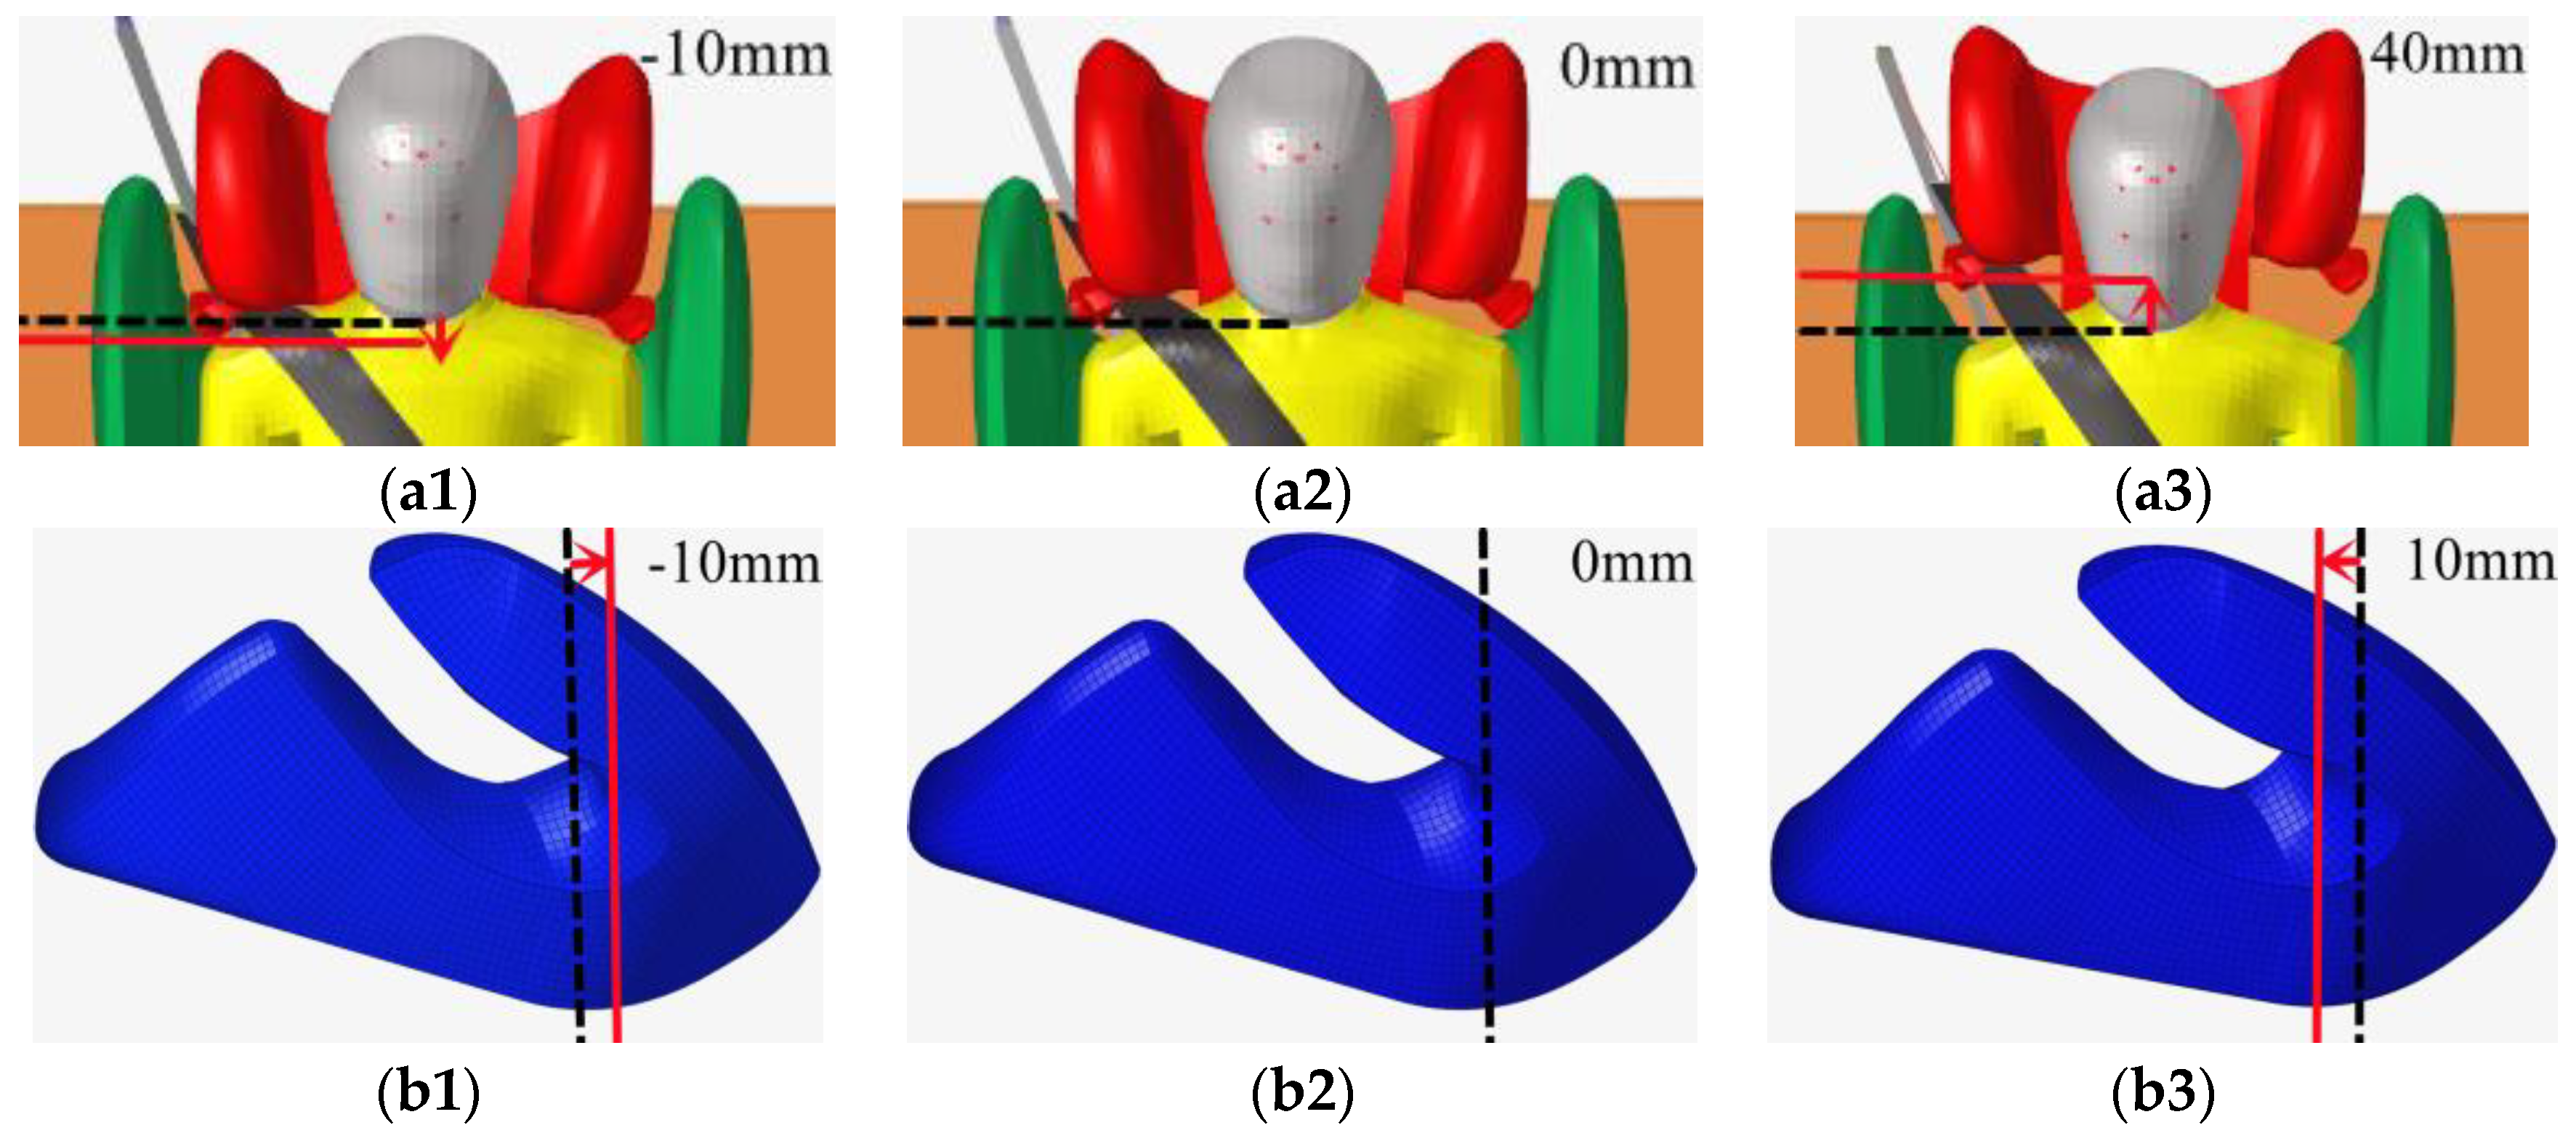
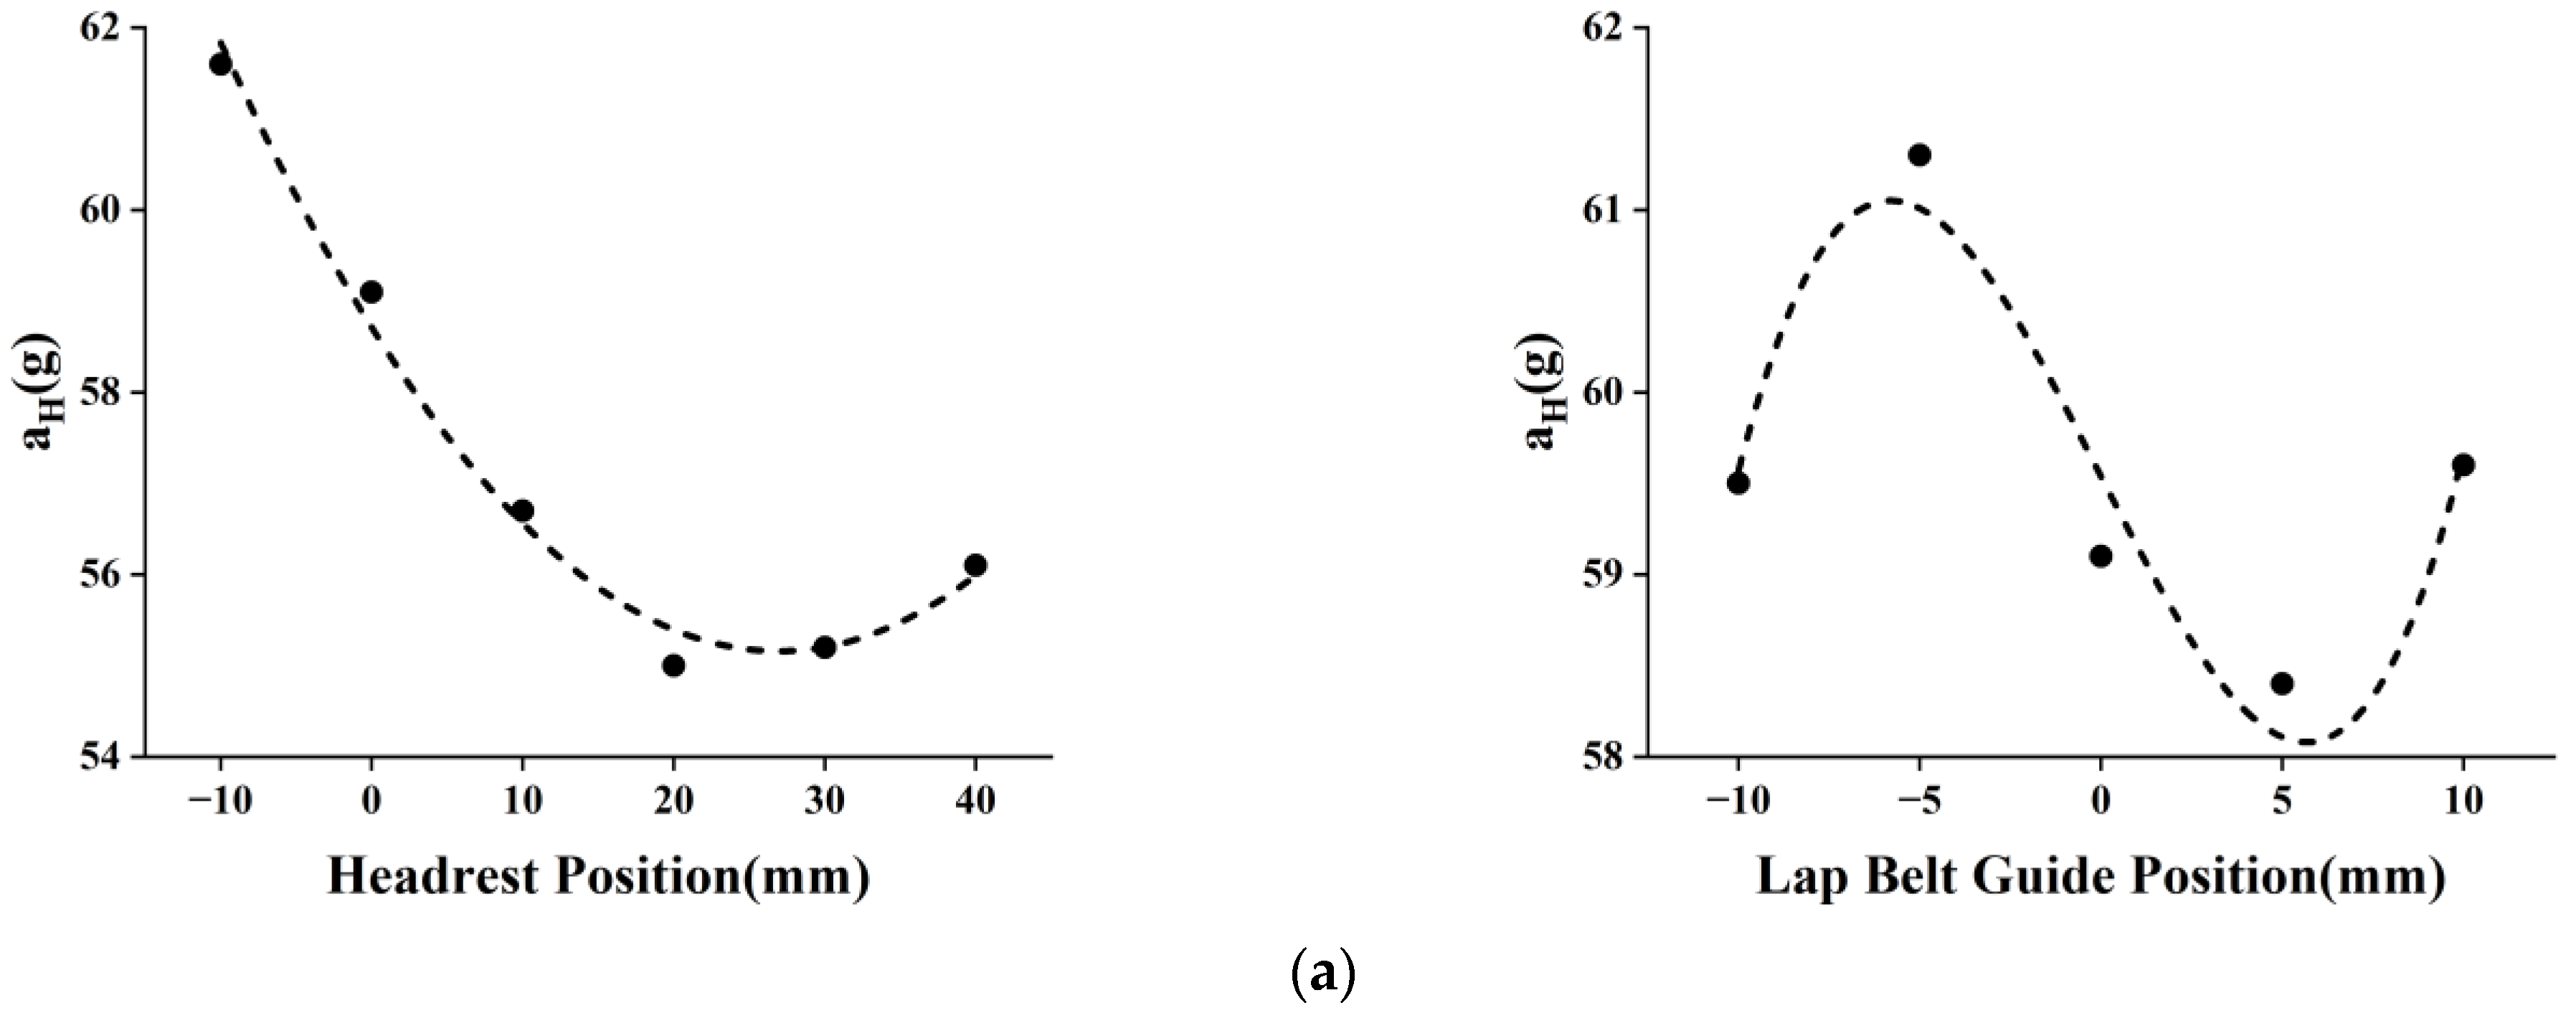
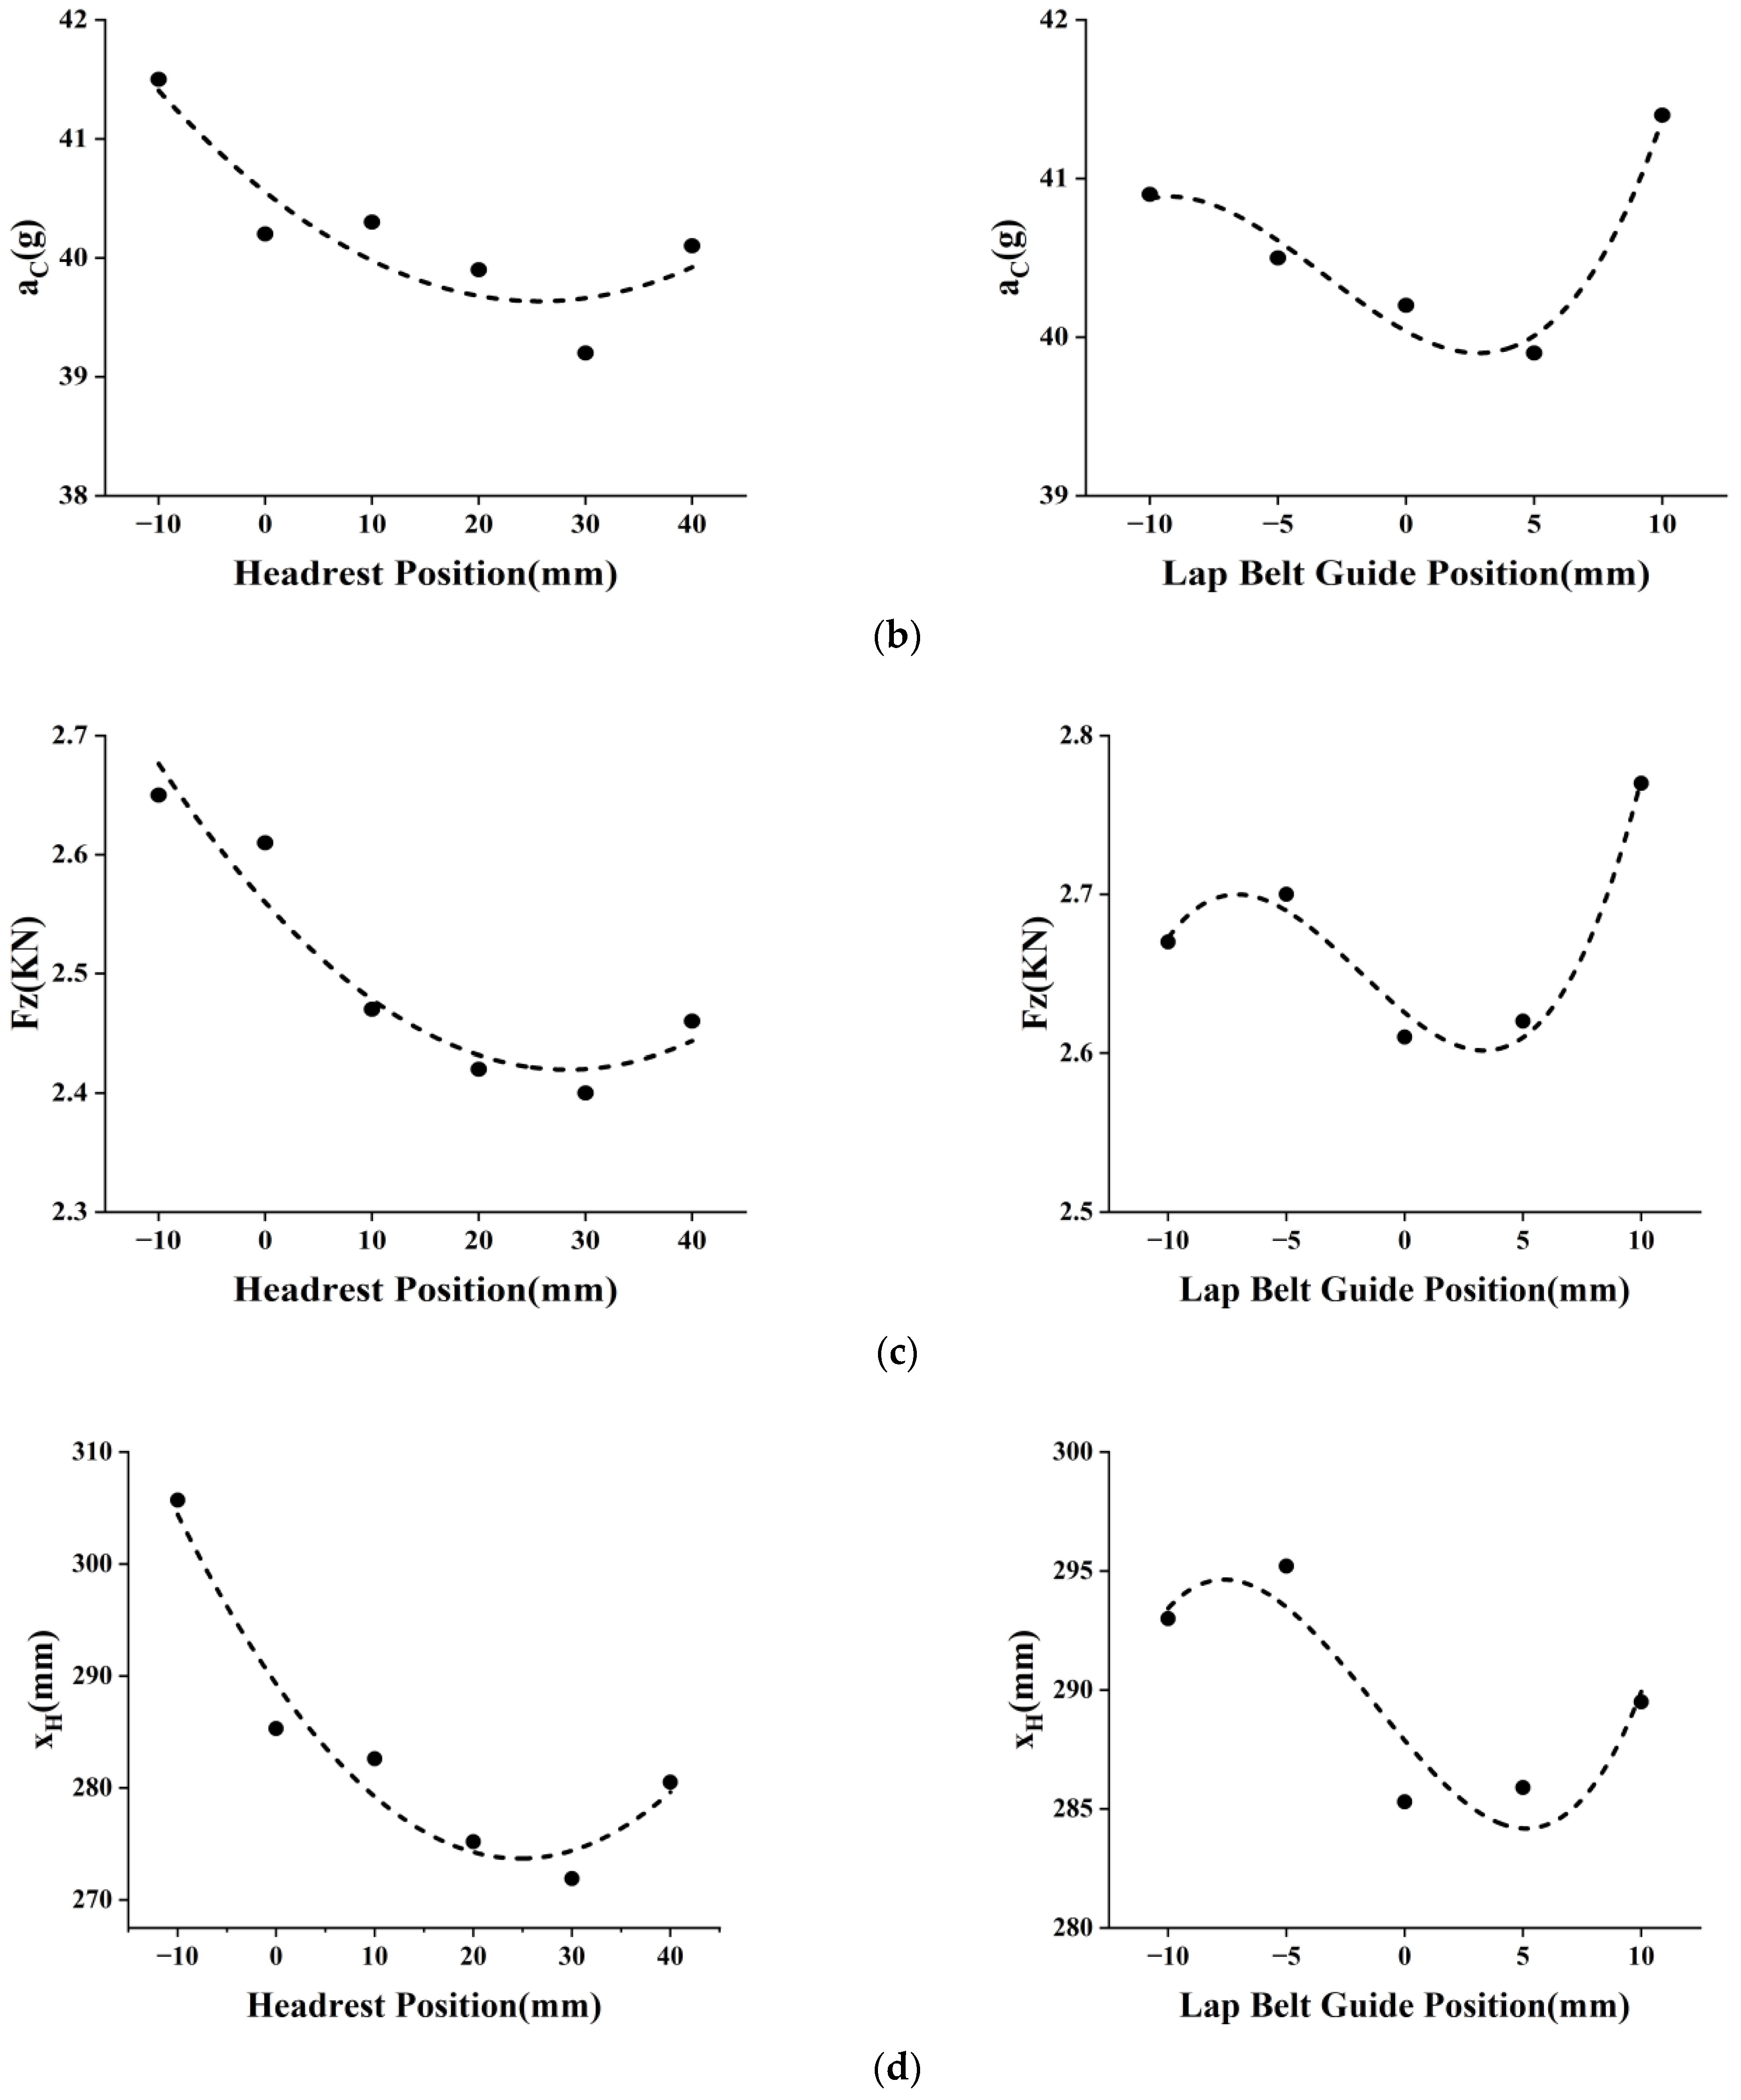
4.1. Parametric Study of Three-Point Seat Belt Restraint Path

The three-point seat belt restraint path is adjusted by changing the position of the shoulder belt guide and the lap belt guide. More specifically, the shoulder belt guide is adjusted by changing the height of the seat headrest. In the current study, the headrest height of the reference model was set to 0 mm, as shown in Figure 8a2. Since the distance between the child dummy and the shoulder belt guide is relatively small in the reference model, the minimal downward adjustment value of the headrest is set as −10 mm as shown in Figure 8a1. The maximal upward adjustment distance of the headrest is set as 40 mm as shown in Figure 8a3. Regarding the lap belt guide position, the value is set to 0 mm in the reference model as shown in Figure 8b2. The inward movement is defined as negative, and the minimum value is set to −10 mm, as shown in Figure 8b1. The outward movement is defined as positive, and the maximal value is set to 10 mm, as shown in Figure 8b3.
As shown in Figure 9, all four injury indices have similar variation when changing the headrest position or the lap belt guide position. In general, the responses of the four injury indices of the child dummy generally tend to decrease and then increase with the increase in headrest height and lap belt guide position. When the headrest height falls into the range of 20 mm to 30 mm, the values of all injury indices are small, and the minimal values lie within the range. Then the shoulder belt guide is also in a relatively ideal position. When the lap belt guide position falls into the range of 0 mm to 5 mm, the pelvic part of the child dummy is well restrained by the lap belt, and the occurrence of the lap belt slipping down to the thigh or sliding to the abdomen can be effectively avoided.

4.2. Parameter Study of Structural Design

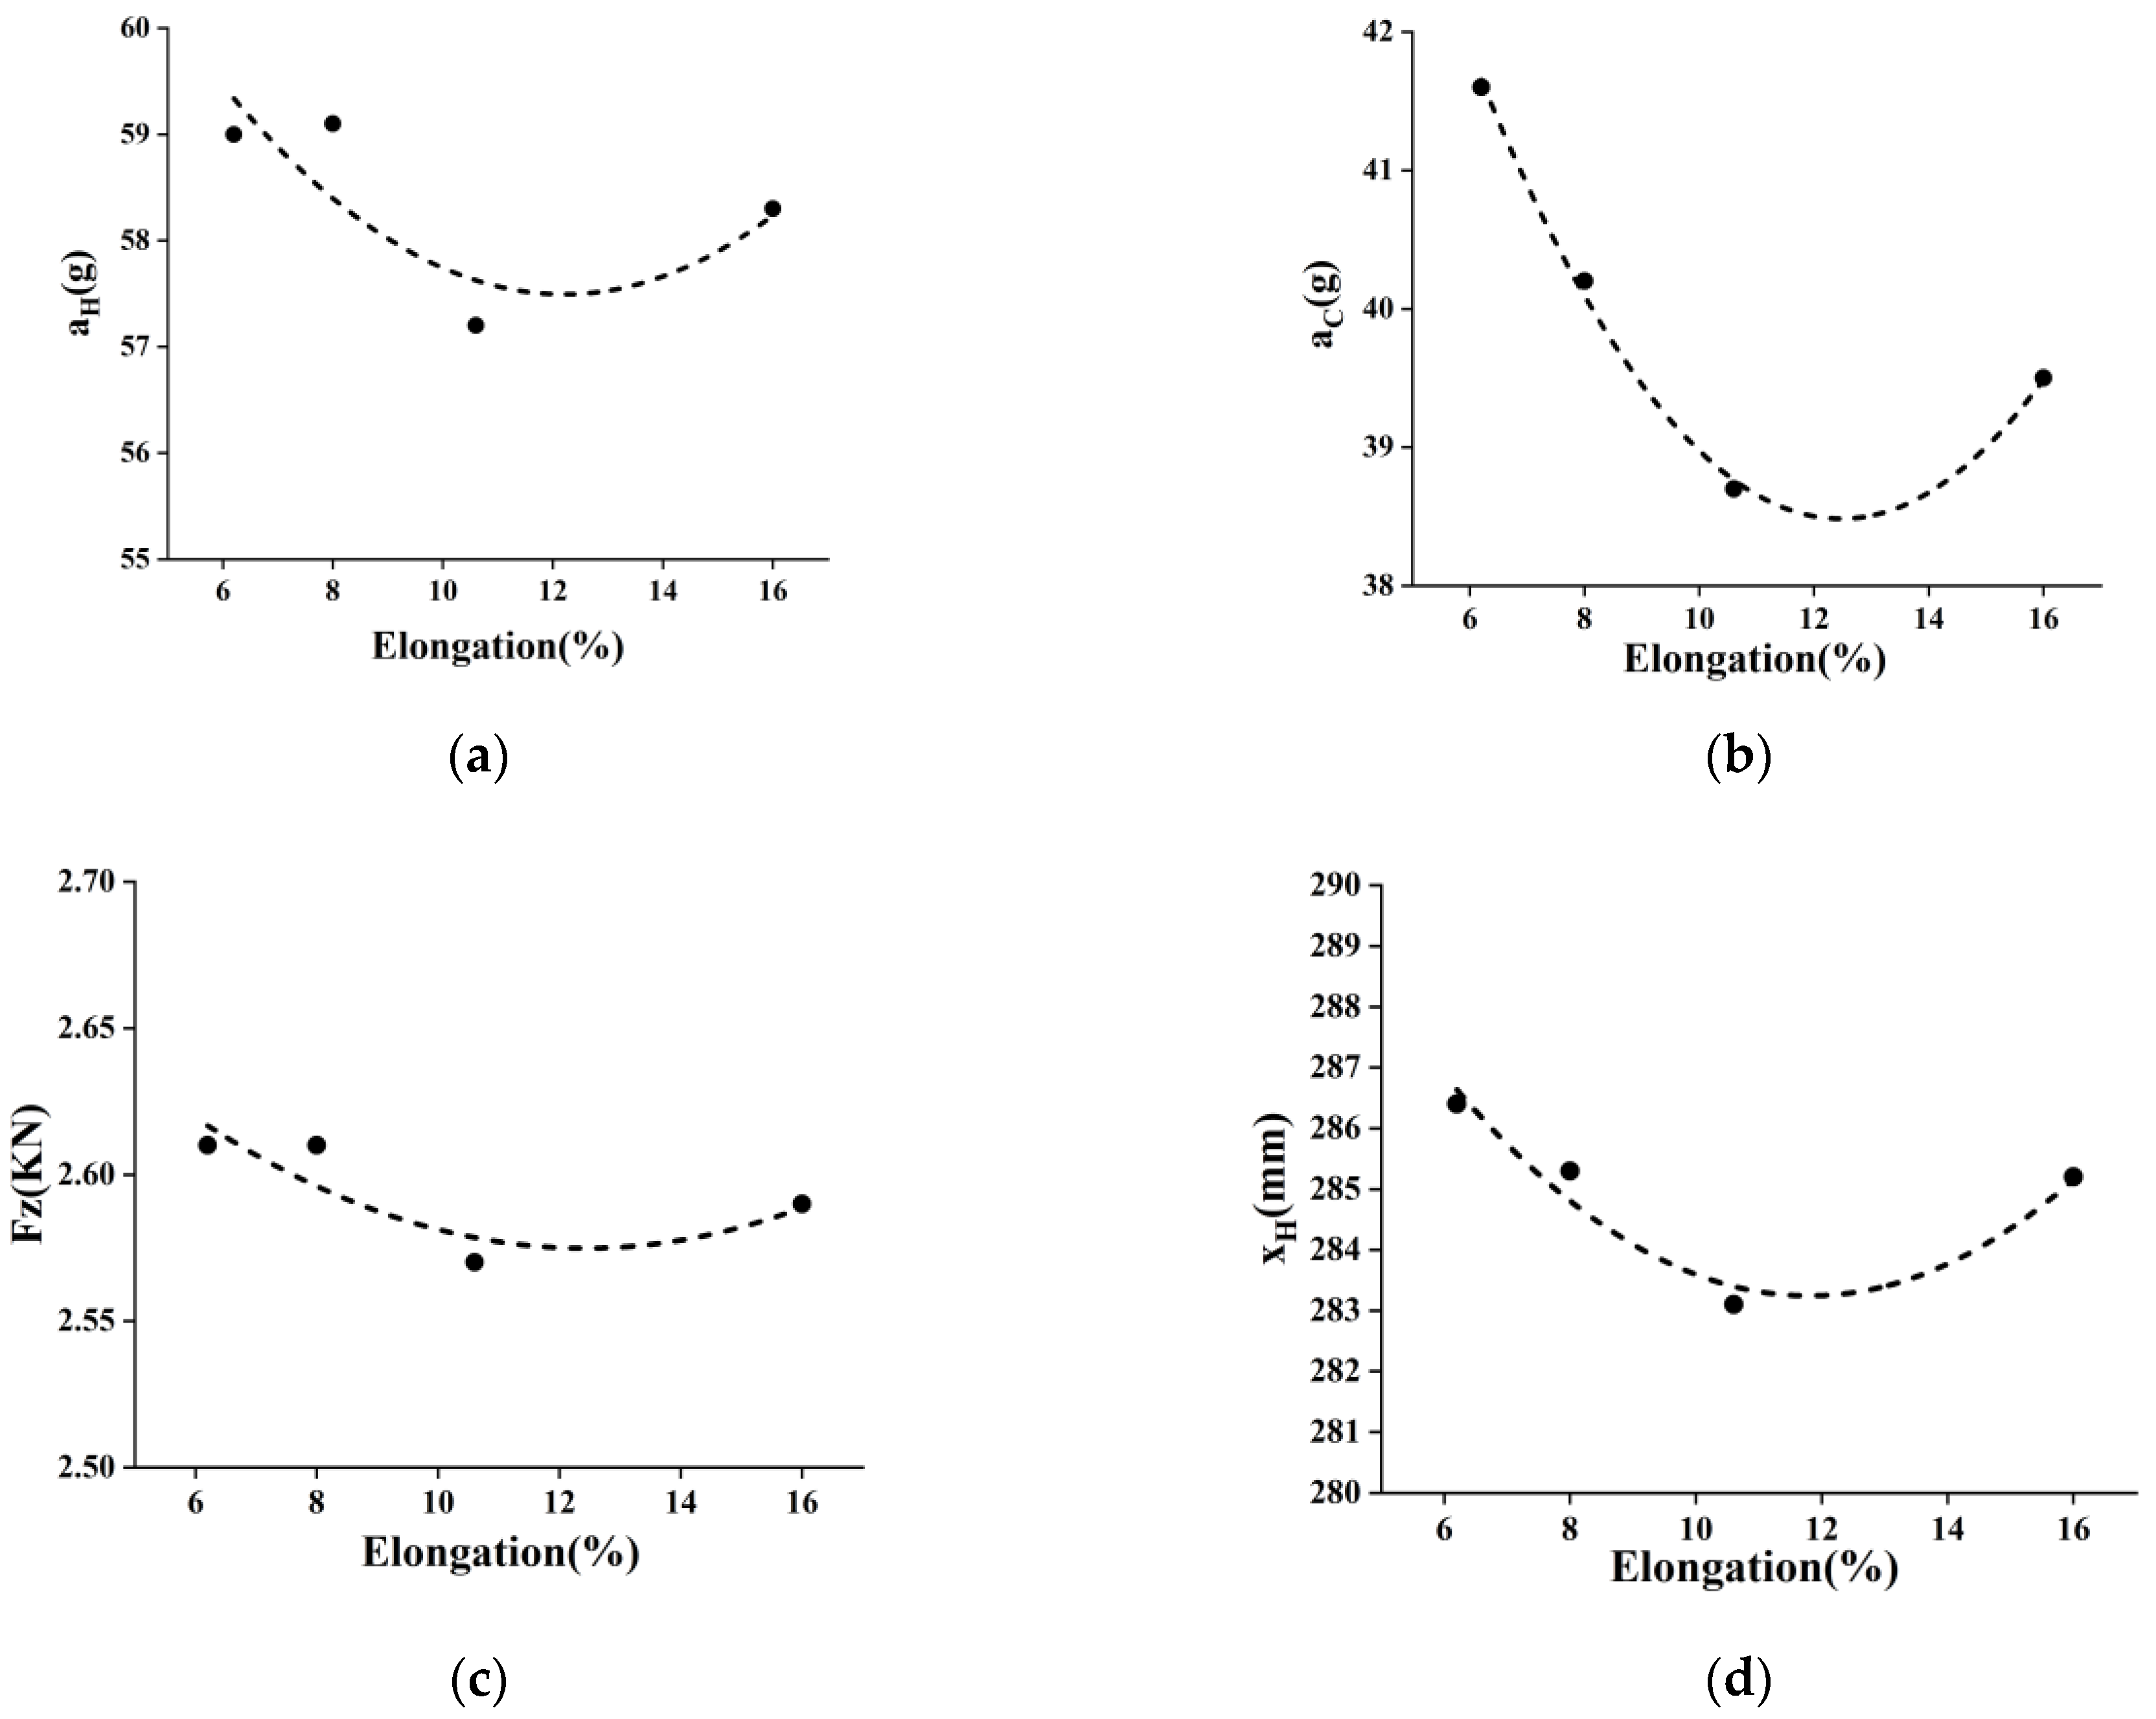
4.2.1. Webbing Stiffness

In a crash event, the seat belt deformation directly affects the injury indices of a child dummy, and the webbing stiffness determines the elongation of the seat belt. In this study, the webbing stiffness is characterized by the elongation of the seat belt when the tensile force reaches 10 kN. In the reference model, the seat belt elongation is 8%. To study the effects of webbing stiffness, four different elongation values are specified, that is 8% elongation for the reference model and 16%, 10.6% and 6.2% for the other three models. The corresponding four indices are determined through the frontal collision simulation and their variations are shown in Figure 10. When the elongation is 10.6%, the four injury indices of the child dummy are the smallest.

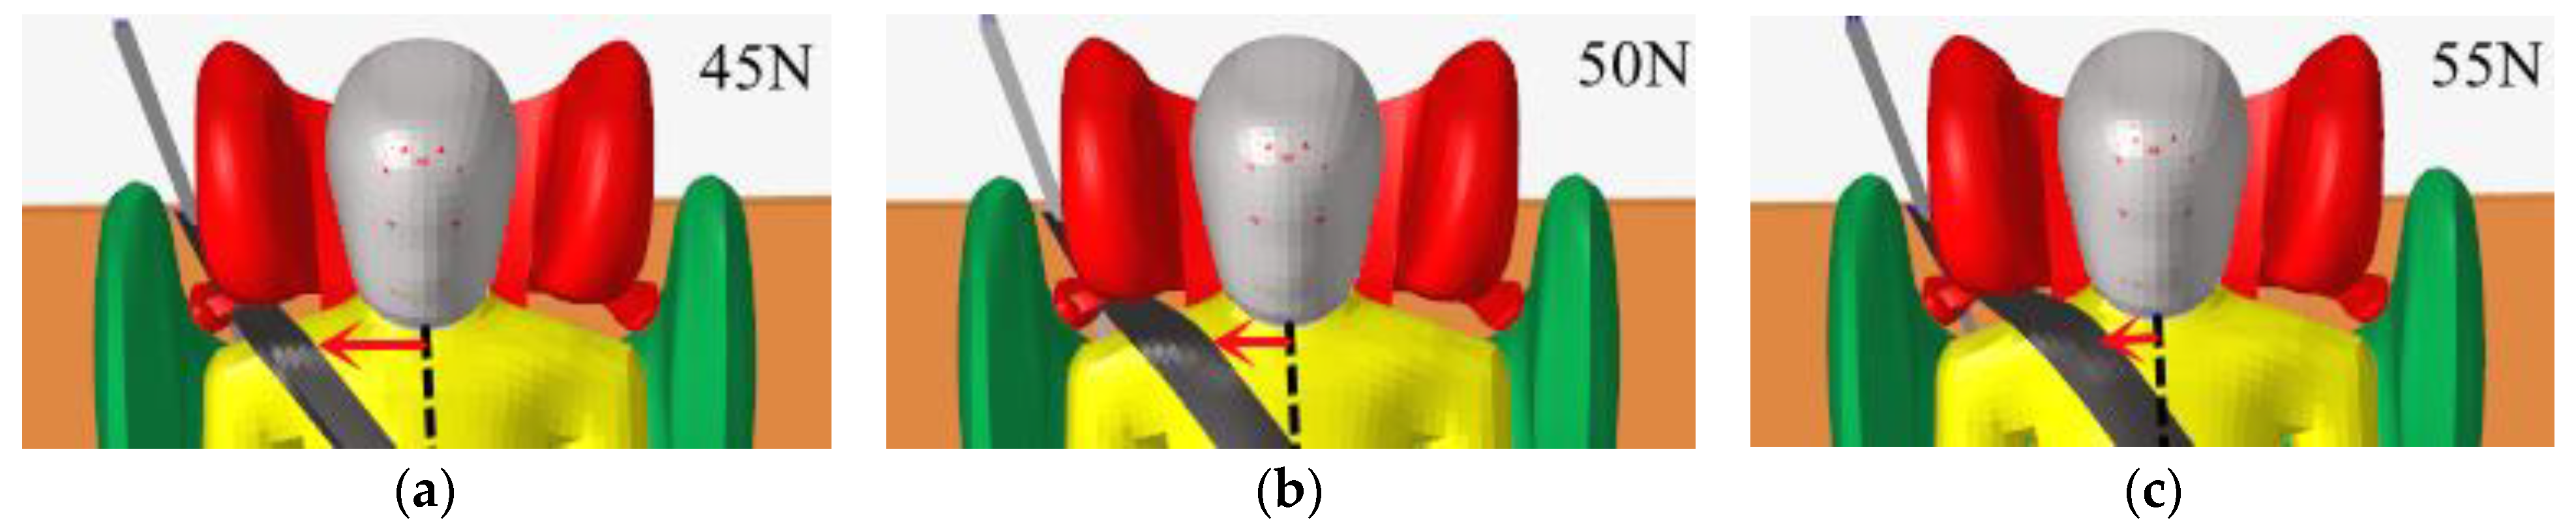
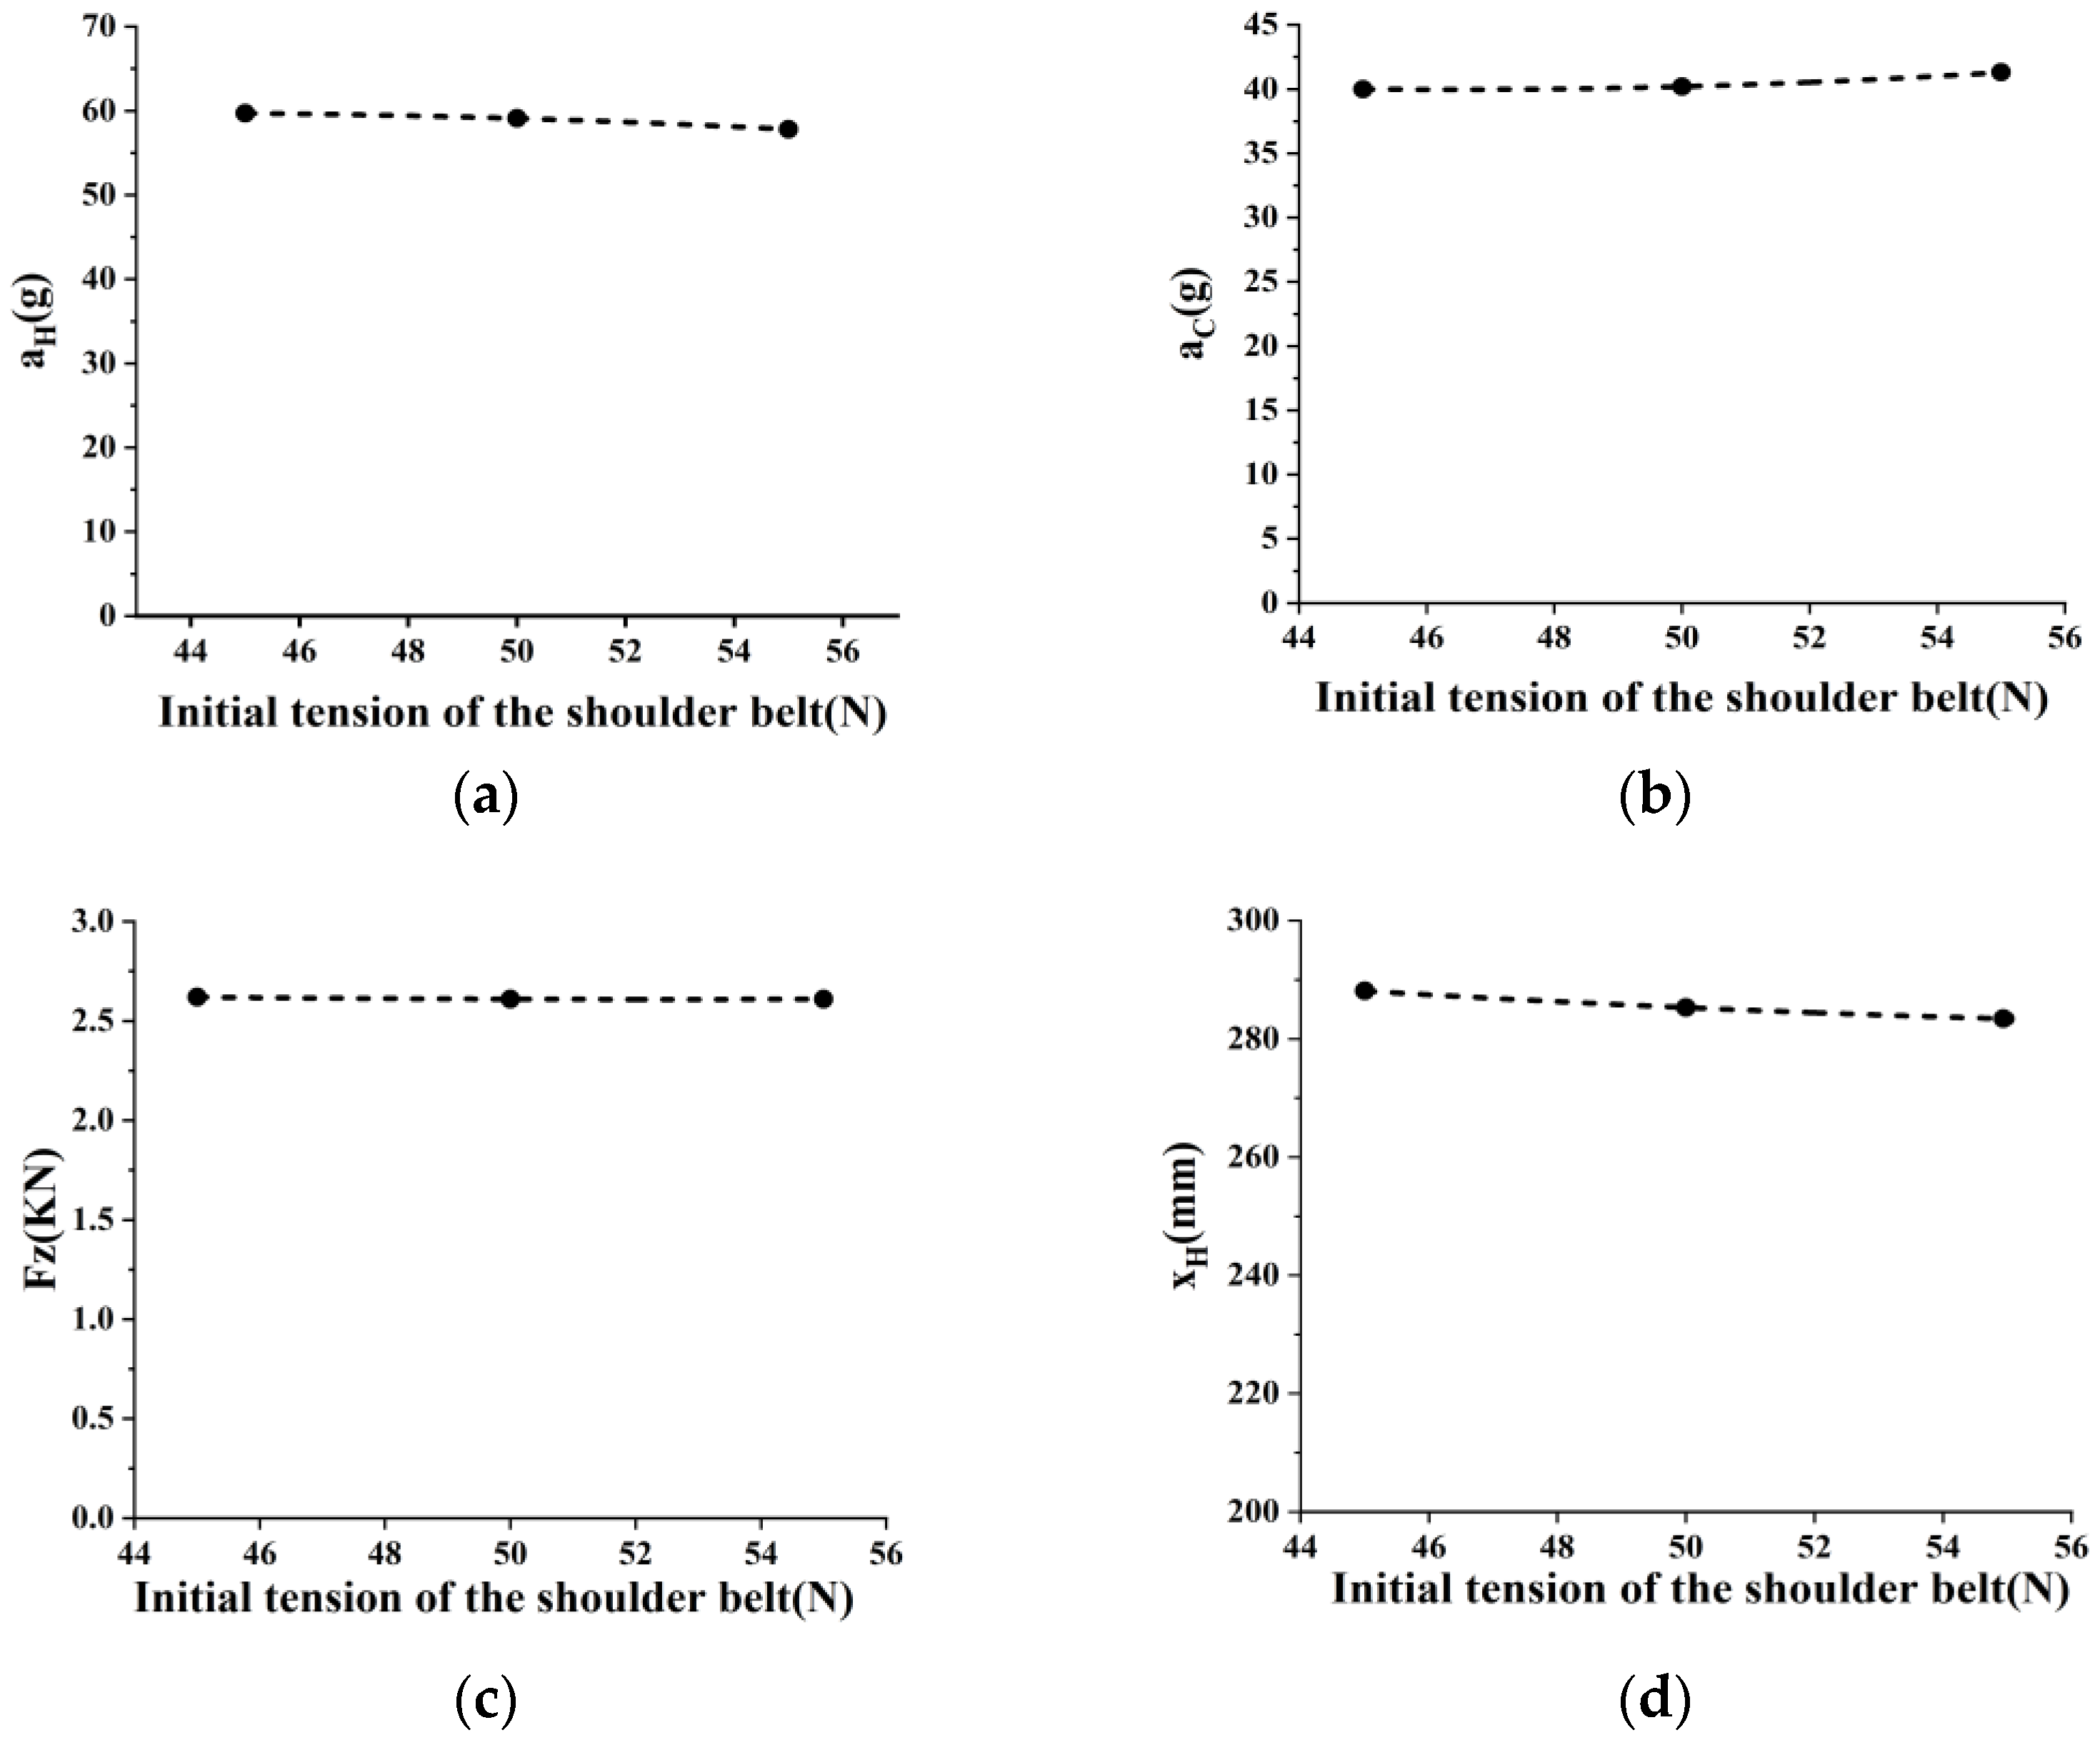
4.2.2. Initial Tension of the Shoulder Belt

The initial tension of the shoulder belt should be controlled between 45N and 55N [28,29], which is characterized by the contact position between the shoulder and the shoulder belt, as shown in Figure 11. To study the effect of initial tension on injury response, this paper divides the initial tension of the shoulder belt into three levels, indicated by the red arrow in Figure 11.
By analyzing the injury response corresponding to different initial tensions (Figure 12), the maximum deviations of F Z and x H in all three cases are less than 1%, and the maximum deviations of a H and a C do not exceed 2%. Therefore, the effect of different shoulder belt initial tension on the child injury indices is negligible. The smaller the initial tension, the less restrictive the belt is. Regarding the active nature of the children, the initial position of the shoulder belt that is farther away from the neck is preferred.

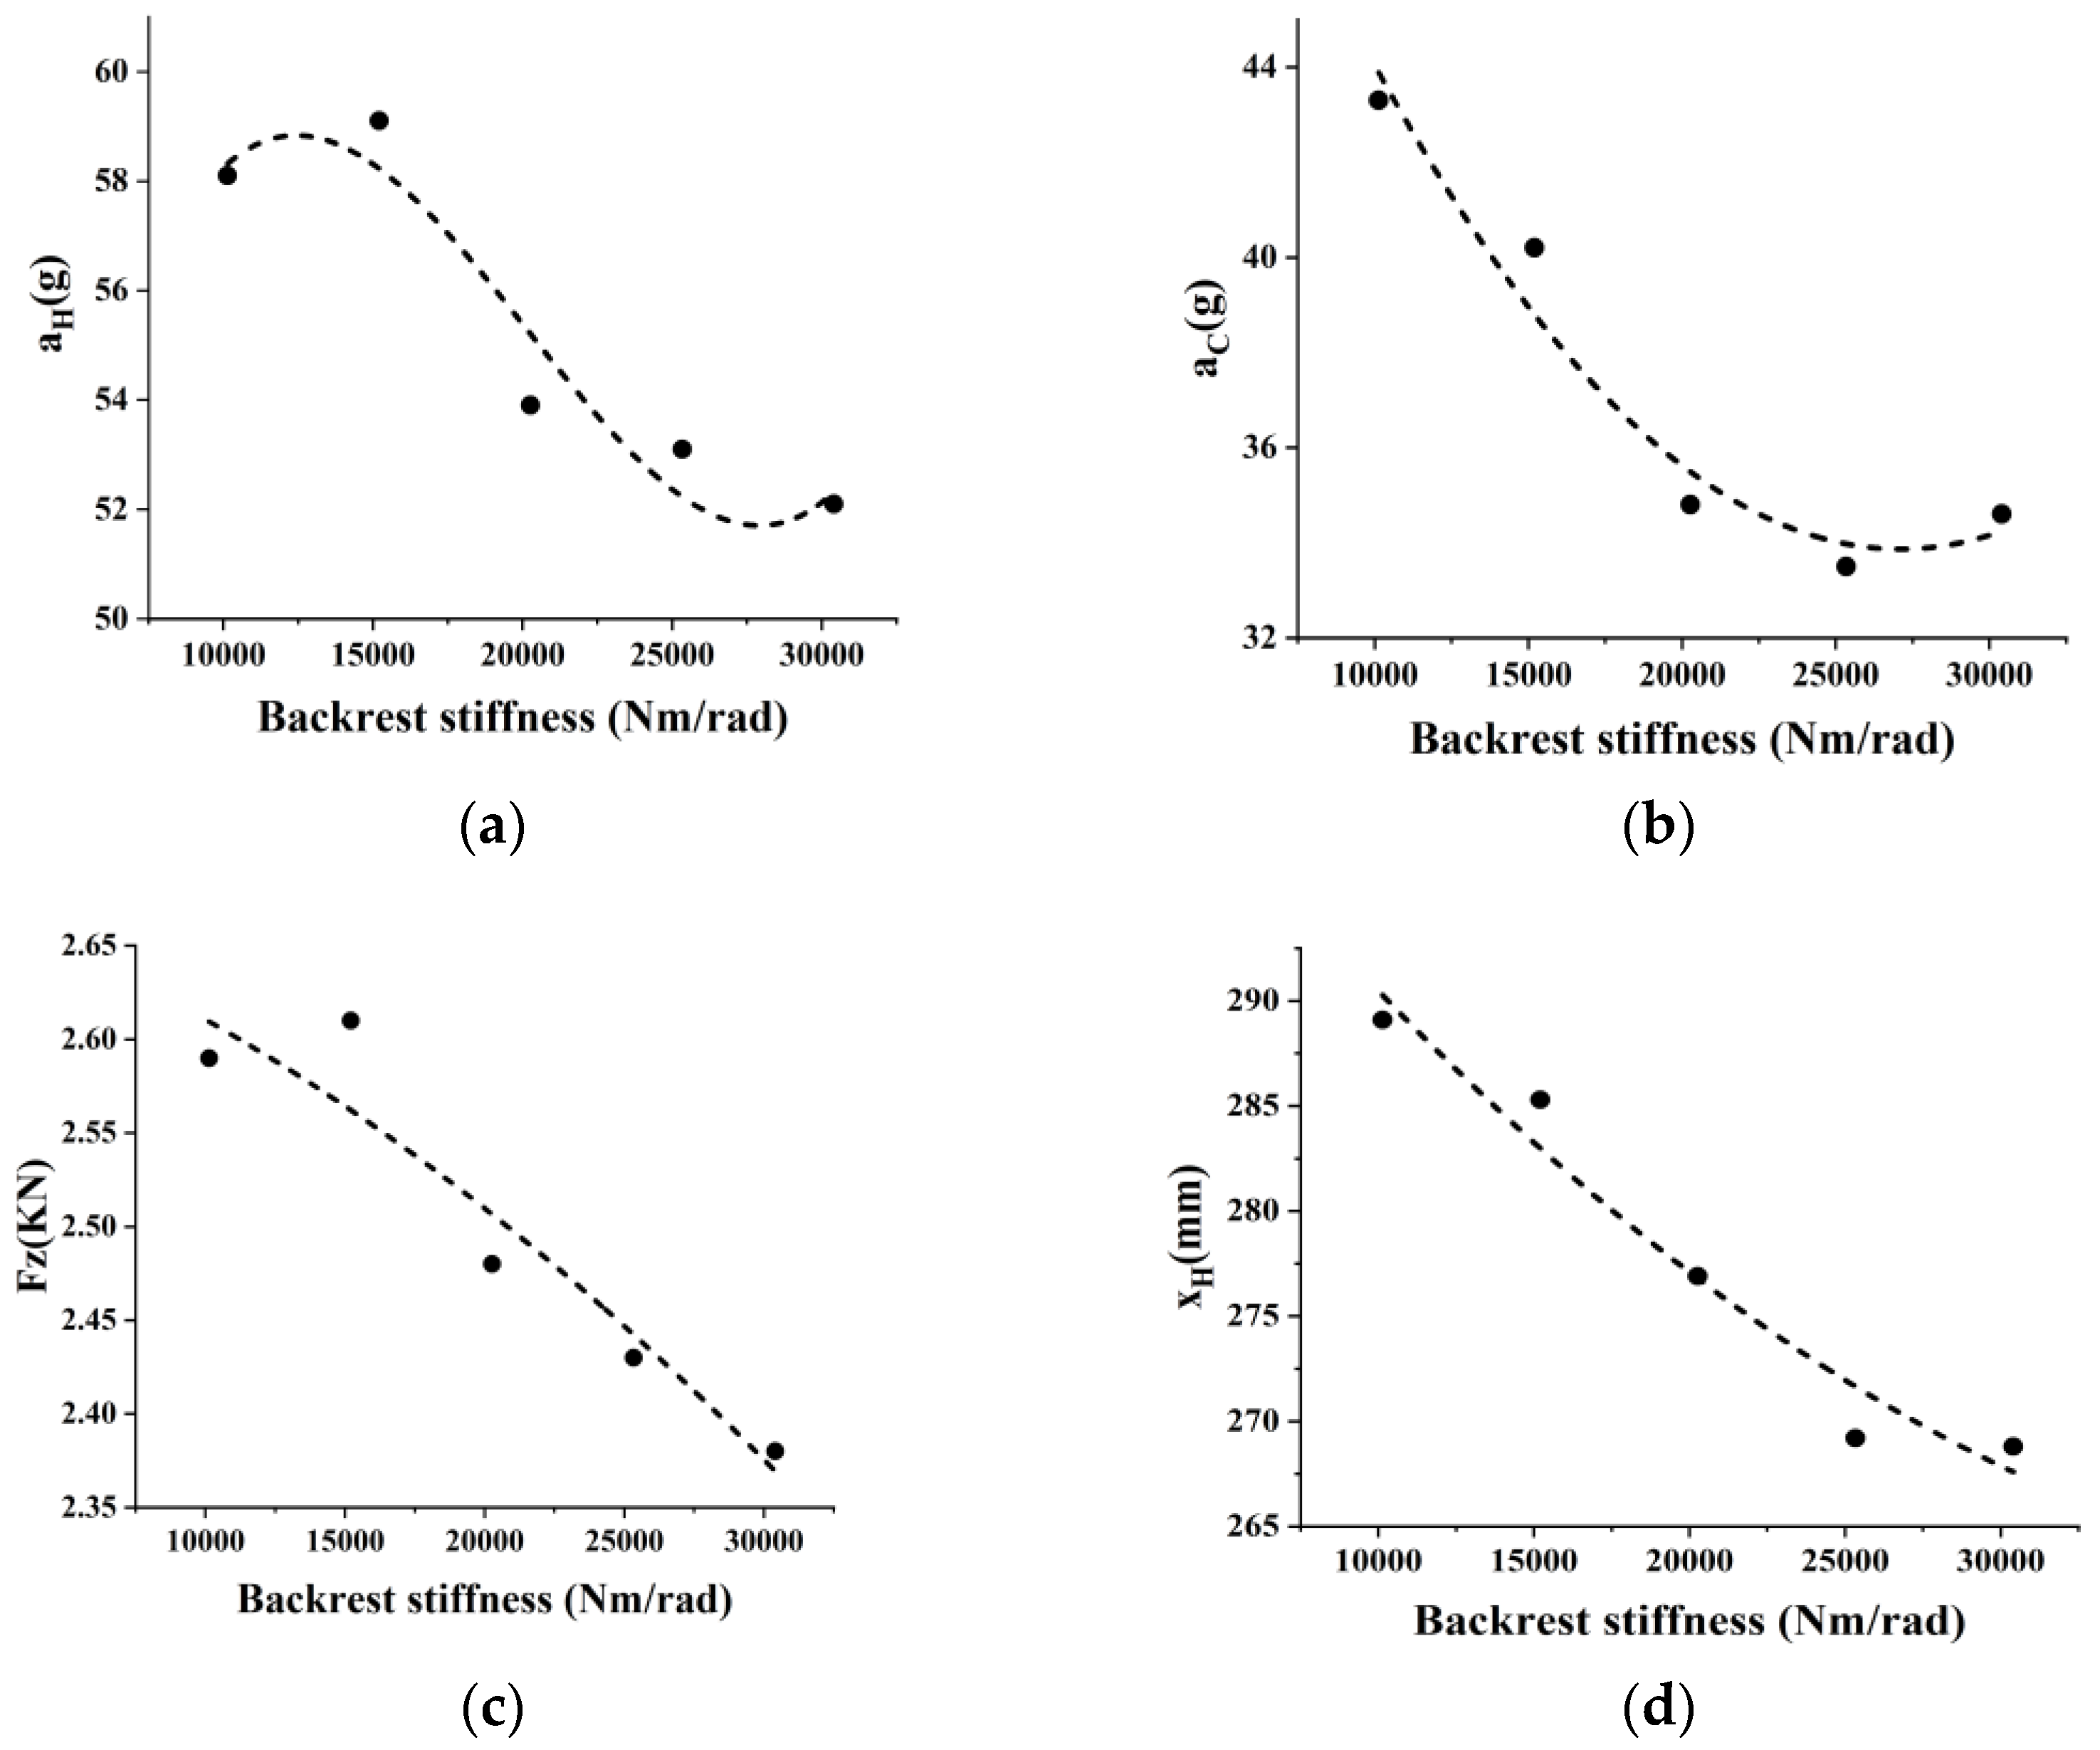
4.2.3. Seat Backrest Stiffness

In engineering applications, the backrest stiffness can be adjusted by adding stiffeners or modifying the structure. The stiffness of the seat backrest can be characterized by the torque that causes the seat rotation to reach 0.1 rad. In this study, the backrest stiffness in the reference model is 15,200 Nm/rad. The backrest stiffness is adjusted by varying the shell element thickness in the FEA model. In the current study, the minimal stiffness value is two-thirds of the reference model, and the maximal value is twice the reference model. The other two stiffnesses, 20,267 Nm/rad and 25,333 Nm/rad between the reference and the maximal value are also specified. As shown in Figure 13, the injury indices, a H , a C , F Z and x H initially decreased with the increase in backrest stiffness, and then remained stable in the range of 20,267 Nm/rad to 30,400 Nm/rad. This is because once the backrest stiffness reaches 20,267 Nm/rad, the backrest can provide sufficient stiffness to resist the deformation caused by the three-point seat belt during the crash event.

4.2.4. Cushion Angle

The cushion angle is determined by the angle between the seat cushion and the horizontal plane. As shown in Figure 14, the angle is 4° in the reference model. The minimum value of the cushion angle is 1° and the maximal value is 13°. The increment value is 3°. As shown in Figure 15, the a H , a C , F Z and x H of the child dummy monotonically increase as the increase of the cushion angle, and the response reaches the maximum value when the cushion angle was 13°. When the cushion angle is 1°, the head and neck injury and horizontal head displacement of the child dummy are the smallest, and the chest injury is also relatively small.

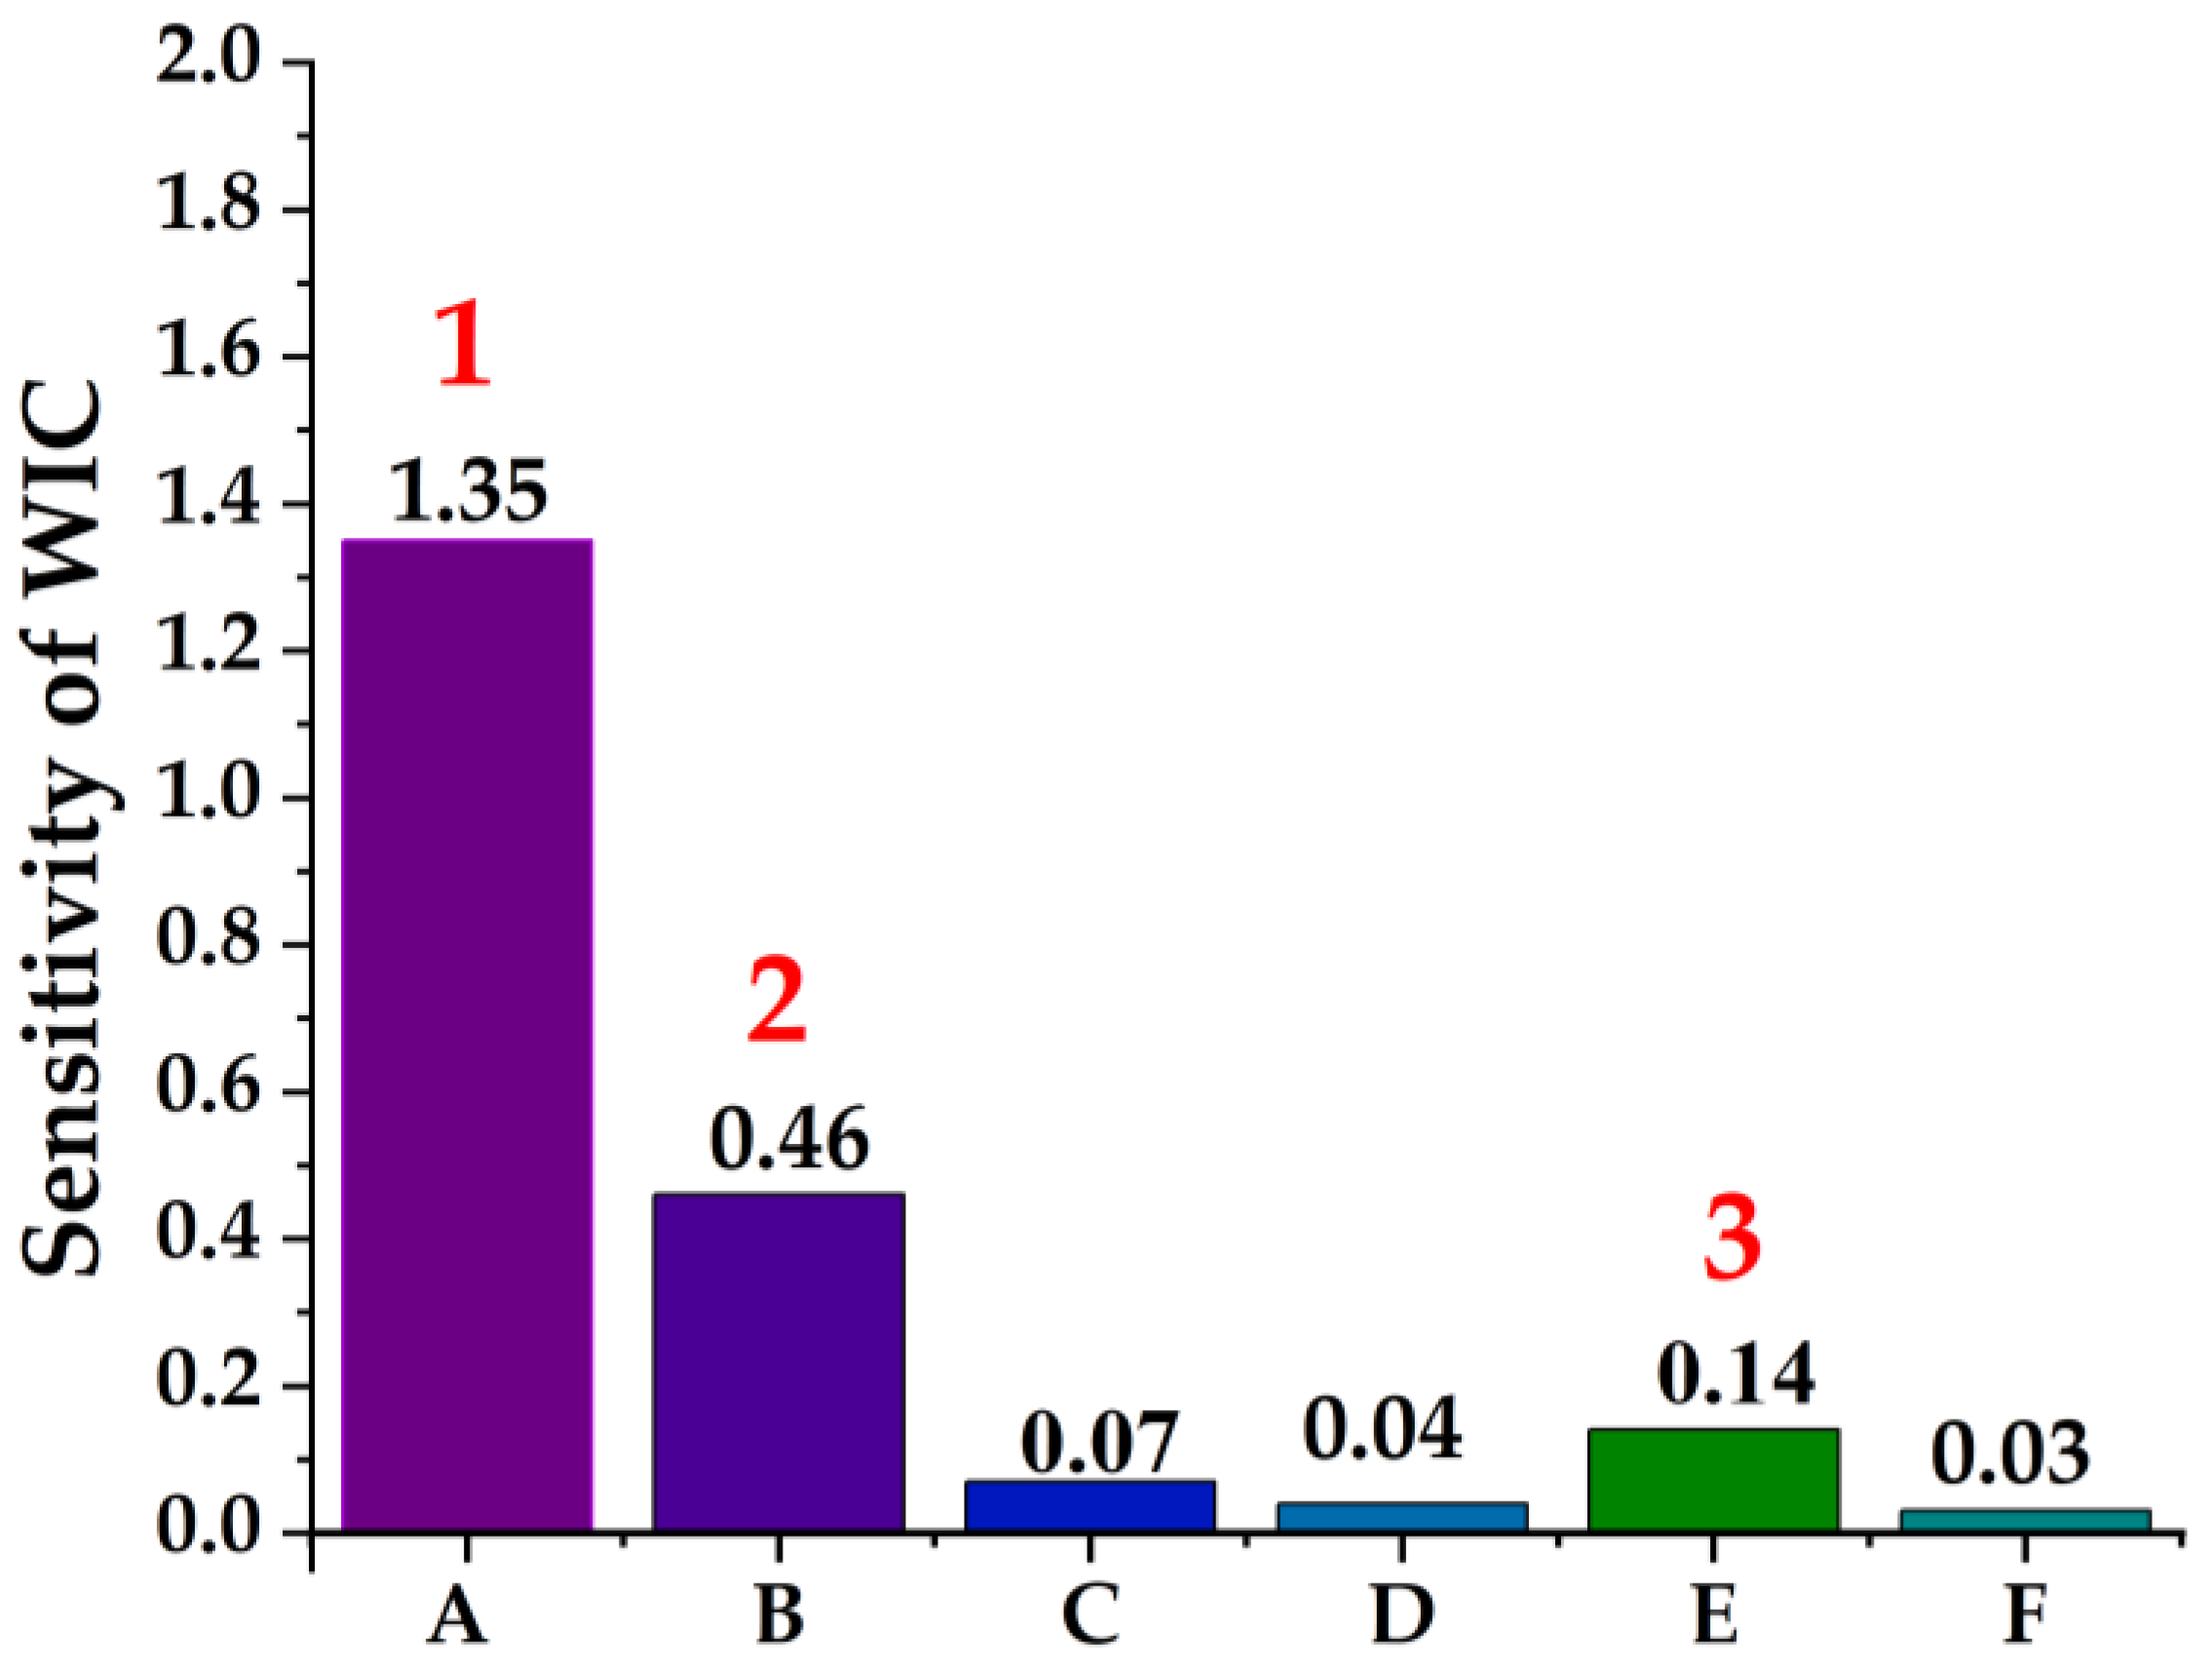
5. Parameter Sensitivity Analysis

In this section, sensitivity analysis is performed for all the layout parameters based on the parametric study in Section 4. The injury evaluation of the occupant should consider the comprehensive effects of children’s multiple injury indices [30,31]. This is addressed through the Weighted Injury Criterion (WIC) for adults by combining all these injuries [32,33]. Equation (1) is the traditional WIC formula, where HIC is the head injury criterion, a C is 3 ms chest resultant acceleration (unit: g), D is the thoracic compression deformation (unit: mm), and F F L and F F R are the maximum axial force of the left and right thigh (unit: kN). However, weighting factors in Equation (1) for the occupant’s head and chest are too high.
W I C = 0.6 × ( H I C 1000 ) + 0.35 × (   a C 60 + D 75 ) / 2 + 0.05 × ( F F L + F F R 20 )
Due to the intrinsic difference between the injury types and severity between the children and adults, a modified WIC is proposed for the child in the booster seats and the detailed form is shown in Equation (2). First, 3 ms head resultant acceleration a H is utilized instead of the Head Injury Criterion HIC due to a H reflecting a more severe injury in the same sled test and provides a safer injury estimation. Secondly, thoracic compression deformation is not considered due to the fact that children usually do not suffer this type of injury due to a higher flexibility of ribs compared with adults [34]. Thirdly, the injury caused by F F L and F F R is not considered due to the fact that the child booster seat is installed on the back seats and this type of injury does not happen. Instead, neck injuries are an important injury feature of child dummies in booster seats and are included according to both ECE R129 regulation and C-NCAP. During the process of evaluating the seat protection performance, the head horizontal displacement x H of the dummy is used as a constraint and its value should not exceed 550 mm according to the ECE R129 regulations. In the study of Section 4, the head horizontal displacement x H meets the requirements. Therefore, the sensitivity analysis focuses on three other injury indices, including the 3 ms head resultant acceleration a H , 3 ms chest resultant acceleration a C and upper neck tension F Z .
The weighting factors are determined by the score of each injury category in the C-NCAP [35]. Accoring to the scoring system of C-NCAP, the head score is 2 points, and the chest and neck score are 1 point each, so the weighting coefficient of modified WIC is defined propotionally to the score point by setting the summation of three weighting coefficients as unit 1. Therefore, the weighting coefficients for 3 ms head resultant acceleration a H , 3 ms chest resultant acceleration a C and upper neck tension F Z are 0.5, 0.25, 0.25, respectively. The scale factors for injury indices are the maximal values given in ECE R129 regulation and C-NCAP. For instance, 80 g and 55 g are the maximal values of the Q6 dummy injury indices in ECE R129 regulation, and 2.84 kN is chosen from C-NCAP due to the lack of specification in ECE R129 regulation.
W I C = 0.5 × ( a H 80 ) + 0.25 × ( a C 55 ) + 0.25 × ( F Z 2.84 )
The sensitivity of each parameter to WIC can be characterized by the WIC magnitude variation due to the variation of the independent variables [36]. The sensitivity calculation formula is shown in Equation (3), where x R e f e r e n c e is the parameter level of the reference model, y R e f e r e n c e is the WIC value corresponding to the parameter level of the reference model, x is the parameter level change and y is the WIC change corresponding to the parameter level change.
S = Δ y / y R e f e r e n c e Δ x / x R e f e r e n c e
Figure 16 illustrates the sensitivity values of the WIC for each parameter. And their ranking sequence of top 3 is labeled with number 1, 2, 3. Among those layout parameters, the parameters with negative correlation with WIC include shoulder belt guide position, lap belt guide position, belt webbing stiffness, initial tension of the shoulder belt and seat backrest stiffness. The parameter with positive correlation with WIC is the cushion angle. The shoulder belt guide position was the highest one at 1.35. This was followed by the position of the lap belt guides and backrest stiffness, which are 0.46 and 0.14, respectively. It should be noted that the child booster seat is used by children from 3 to 10 years old. In order to satisfy the usage requirements of different age groups, the parameter level of the lap belt guide position in engineering applications is set to a fixed value, so the lap belt guide position is not specified as a design variable. The sensitivities of other factors such as belt webbing stiffness, initial tension of the shoulder belt, and cushion angle are below 0.1 and can be neglected. Therefore, the shoulder belt guide position and seat backrest stiffness are selected as the design parameters in the next section.

6. Value Determination of the Selected Layout Parameters

After determining the influential factors of shoulder belt guide position ( x 1 ) and backrest stiffness ( x 2 ) from the above sensitivity analysis, a full factorial experiment can be directly utilized to determine the design value of shoulder belt guide position and backrest stiffness. The experimental scheme and the simulation results are shown in Table 2. The minimal WIC, 0.660, appears in the ninth column. The best backrest stiffness is 30,400 Nm/rad. The headrest height relevant to the reference model is 30 mm and the corresponding shoulder belt guide is 48 mm along the seat backrest. Further, the values of WIC and each injury index in the final design model are compared with those values in the reference model, as illustrated in Table 3. The WIC is significantly reduced, and its value is 19.6%. Meanwhile, a H , a C , F Z and x H of the child dummy in the final design model are reduced by 18.9%, 19.9%, 20.3% and 10.1%, respectively.

7. Discussion

In the current study, we are able to determine the suitable design variables of shoulder belt guide position and backrest stiffness via the proposed design framework. However, the final design of the child booster seats has not been validated via test. In our future practice, we will validate the proposed new design. Moreover, the current study is focused on the research of the layout parameters of the child booster seat in a frontal collision for a 6-year-old child. To better design a booster seat for children between 3 and 12 years old in our future work, Q series 3-year-old and 10-year-old child dummies will also need to be utilized. Meanwhile, since the Q series dummies utilized in this paper are not equipped with abdominal pressure twin sensors (APTSs) and anterior superior iliac spine (ASIS) sensors, the study does not include the risk assessment of belt slippage from the pelvis. In our future work, to further improve the safety guidelines, the latest dummies equipped with the above sensors will be utilized to study the relationship between abdominal and iliac injury indices and the dummy subduction risk. In contrast with the three-point seat belts, the four-point seat belt can provide a better restraint to the occupant [37] and we will also look into the seat booster design with four-point seat belts in our future study.

8. Conclusions

In this study, a modified WIC was successfully proposed based on the ECE R129 regulation and C-NCAP and an efficient design framework was established based on a frontal collision FEA model validated by the sled test. The design framework consists of a parameter study of child booster seats, the parameter sensitivity analysis and a full factorial experiment via the modified WIC. There are two major advantages associated with the proposed design strategy. First, the proposed design framework is simple and effective without resorting to the regular time-consuming optimization searching process. Secondly, the parametric and sensitivity study-based design strategy establishes a direct relation between the design parameters and the design target, and a direct assessment of the importance of each design parameter. Those knowledge items are critically important for the industrial design of child booster seats.
The proposed design framework was successfully applied to sort out the complex layout parameters of child booster seats, including two three-point seat belt restraint path parameters and four structural design parameters. Two design parameters consisting of the seat backrest stiffness and the shoulder belt guide position are identified via a parameter sensitivity study. The WIC of the final design is 19.6% significantly smaller than the value of the reference model and the final design variables of the seat backrest stiffness and the shoulder belt guide position are 30,400 Nm/rad and 48 mm (along the seat backrest, relative to the dummy shoulder), respectively. Meanwhile, the corresponding 3 ms head resultant acceleration a H , 3 ms chest resultant acceleration a C and upper neck tension F Z are significantly reduced and are 18.9%, 19.9% and 20.3% smaller than the values of the reference model, respectively. Those findings offer valuable guidance for the future design of child booster seats.

Author Contributions

Conceptualization, W.T.; Methodology, X.Z.; Software, J.G.; Validation, J.G.; Formal analysis, X.Z. and J.G.; Investigation, W.T.; Data curation, X.Z. and J.G.; Writing—original draft, X.Z.; Writing—review & editing, W.T.; Supervision, W.T. All authors have read and agreed to the published version of the manuscript.

Funding

X. Zhang acknowledges the support of Goodbaby International Holdings Limited for providing the child safety seat test data. X. Zhang also acknowledges funding support of 2021 Jiangsu High-value Patent Cultivation Program (upgrade category) (8411123002) and Goodbaby International (8421123004). W. Tu acknowledges the support of Jiangsu University Faculty Startup Fund (5501120014) and Jiangsu Shuangchuang Doctor Program (1711120022).

Data Availability Statement

The data used to support the findings of this research are included within the article.

Conflicts of Interest

The authors declare that there is no conflict of interest.

References

  1. Rosen, H.E.; Bari, I.; Paichadze, N.; Peden, M.; Khayesi, M.; Monclús, J.; Hyder, A.A. Global road safety 2010–18: An analysis of Global Status Reports. Injury 2022. [Google Scholar] [CrossRef] [PubMed]
  2. Jermakian, J.S.; Klinich, K.D.; Orton, N.R.; Flannagan, C.A.; Manary, M.A.; Malik, L.A.; Narayanaswamy, P. Factors affecting tether use and correct use in child restraint installations. J. Saf. Res. 2014, 51, 99–108. [Google Scholar] [CrossRef] [PubMed]
  3. Pitt, T.M.; Howard, A.W.; HubkaRao, T.; Hagel, B.E. The effectiveness of booster seat use in motor vehicle collisions. Accid. Anal. Prev. 2021, 159, 106296. [Google Scholar] [CrossRef]
  4. Anderson, D.M.; Carlson, L.L.; Rees, D.I. Booster seat effectiveness among older children: Evidence from Washington state. Am. J. Prev. Med. 2017, 53, 210–215. [Google Scholar] [CrossRef]
  5. Ma, X.; Griffin, R.; McGwin, G.; Allison, D.B.; Heymsfield, S.B.; He, W.; Zhu, S. Effectiveness of booster seats compared with no restraint or seat belt alone for crash injury prevention. Acad. Emerg. Med. 2013, 20, 880–887. [Google Scholar] [CrossRef] [PubMed]
  6. Visvikis, C.; Carrol, J.; Pitcher, M.; Waagmeester, K. Assessing Lap Belt Path and Submarining Risk in Booster Seats: Abdominal Pressure Twin Sensors vs. Anterior-superior Iliac Spine Load Cells. In Proceedings of the IRCOBI Conference, Athens, Greece, 12–14 September 2018; pp. 655–668. Available online: http://www.ircobi.org/wordpress/downloads/irc18/pdf-files/92.pdf (accessed on 13 November 2022).
  7. Baker, G.H.; Mansfield, J.A.; Hunter, R.L.; Bolte IV, J.H. Comparison of Child and ATD Static Belt Fit and Belt Torso Contact on Belt-Positioning Booster Seats. In Proceedings of the IRCOBI Conference, online, 8–10 September 2021; pp. 556–580. Available online: http://www.ircobi.org/wordpress/downloads/irc21/pdf-files/2160.pdf (accessed on 13 November 2022).
  8. Baker, G.H.; Mansfield, J.A.; Hunter, R.L.; Bolte IV, J.H. Evaluation of static belt fit and belt torso contact for children on belt-positioning booster seats. Traffic Inj. Prev. 2021, 22, S87–S92. [Google Scholar] [CrossRef]
  9. Cruz-Jaramillo, I.; Torres-San-Miguel, C.; Cortes-Vásquez, O.; Martínez-Sáez, L. Numerical low-back booster analysis on a 6-year-old infant during a frontal crash test. Appl. Bionics Biomech. 2018, 2018, 2359262. [Google Scholar] [CrossRef]
  10. Hu, J.; Wu, J.; Reed, M.P.; Klinich, K.D.; Cao, L. Rear seat restraint system optimization for older children in frontal crashes. Traffic Inj. Prev. 2013, 14, 614–622. [Google Scholar] [CrossRef]
  11. Gras, L.-L.; Stockman, I.; Brolin, K. Evaluation of 6 and 10 year-old child human body models in emergency events. PLoS ONE 2017, 12, e0170377. [Google Scholar] [CrossRef]
  12. Johansson, M.; Pipkorn, B.; Lövsund, P. Child safety in vehicles: Validation of a mathematical model and development of restraint system design guidelines for 3-year-olds through mathematical simulations. Traffic Inj. Prev. 2009, 10, 467–478. [Google Scholar] [CrossRef] [PubMed]
  13. Bing, J.A.; Agnew, A.M.; Bolte IV, J.H. Compatibility of booster seats and vehicles in the US market. Traffic Inj. Prev. 2018, 19, 385–390. [Google Scholar] [CrossRef] [PubMed]
  14. Xuerong, Z.; Wenqian, Y. Simulation and experimental study on influencing factors of child safety seat collision detection deviation. Automot. Eng. 2019, 41, 915–921. [Google Scholar] [CrossRef]
  15. Albanese, B.; Bohman, K.; Bilston, L.; Koppel, S.; Charlton, J.L.; Olivier, J.; Keay, L.; Brown, J. Influence of child restraint system design features on comfort, belt fit and posture. Saf. Sci. 2020, 128, 104707. [Google Scholar] [CrossRef]
  16. Gu, X.; Sun, G.; Li, G.; Huang, X.; Li, Y.; Li, Q. Multiobjective optimization design for vehicle occupant restraint system under frontal impact. Struct. Multidiscip. Optim. 2013, 47, 465–477. [Google Scholar] [CrossRef]
  17. Zhao, Y.; Alashmori, M.; Bi, F.; Wang, X. Parameter identification and robust vibration control of a truck driver’s seat system using multi-objective optimization and genetic algorithm. Appl. Acoust. 2021, 173, 107697. [Google Scholar] [CrossRef]
  18. Liang, R.; Liu, N.; Liu, X.; Tang, X.; Hu, Y.; Bastien, C.; Liu, X. Effectiveness analysis of a foldable booster safety seat with integrated seatbelt buckle for reducing children’s vehicle accident injury risk. Int. J. Crashworthiness 2022, 1–17. [Google Scholar] [CrossRef]
  19. Jiang, Y.; Wu, P.; Zeng, J.; Zhang, Y.; Zhang, Y.; Wang, S. Multi-parameter and multi-objective optimisation of articulated monorail vehicle system dynamics using genetic algorithm. Veh. Syst. Dyn. 2020, 58, 74–91. [Google Scholar] [CrossRef]
  20. Du, X.; Deng, Y.; Zhang, G.; Cao, L.; Zhu, F. Conceptual design and evaluation of a novel bilateral pretension seatbelt: A computational study. Int. J. Crashworthiness 2019, 25, 391–400. [Google Scholar] [CrossRef]
  21. Yang, X.; Shi, J.; Fu, Q.; Pu, S.; Pan, Z.; Lian, C.; Yin, Z.; Liu, S.; Wang, G. Optimization Design and Injury Analysis of Driver’s Restraint System in Sedan Small Offset Collision. Processes 2022, 10, 940. [Google Scholar] [CrossRef]
  22. Zhou, H.; Liao, J.; Zhang, Q.; Zhang, G.; Zhang, D. Injuries analysis of rear row occupants exposed to vehicle’s frontal oblique collision. Int. J. Automot. Technol. 2021, 22, 595–607. [Google Scholar] [CrossRef]
  23. Hongling, L.; Yude, D.; Changliang, C.; Chen, C. Combined with finite element analysis of car seat safety performance improvement. J. Mech. Sci. Technol. 2021, 35, 79–89. [Google Scholar] [CrossRef]
  24. Song, Z.; Cao, L.; Chou, C.C. Development of test equipment for pedestrian-automatic emergency braking based on C-NCAP (2018). Sensors 2020, 20, 6206. [Google Scholar] [CrossRef] [PubMed]
  25. Durbin, D.R.; Hoffman, B.D.; Agran, P.F.; Denny, S.A.; Hirsh, M.; Johnston, B.; Lee, L.K.; Monroe, K.; Schaechter, J.; Tenenbein, M. Child passenger safety. Pediatrics 2018, 142, e20182461. [Google Scholar] [CrossRef]
  26. Sybilski, K.; Mazurkiewicz, Ł.; Jurkojć, J.; Michnik, R. Evaluation of the effect of muscle forces implementation on the behavior of a dummy during a head-on collision. Acta Bioeng. Biomech. 2021, 23, 1–21. [Google Scholar] [CrossRef]
  27. Sybilski, K.; Małachowski, J. Impact of disabled driver’s mass center location on biomechanical parameters during crash. Appl. Sci. 2021, 11, 1427. [Google Scholar] [CrossRef]
  28. Baker, G.; Stockman, I.; Bohman, K.; Jakobsson, L.; Osvalder, A.-L.; Svensson, M.; Wimmerstedt, M. Kinematics and shoulder belt engagement of children on belt-positioning boosters during evasive steering maneuvers. Traffic Inj. Prev. 2018, 19, S131–S138. [Google Scholar] [CrossRef]
  29. Zhang, X.; Shi, Y. Simulation and experiment study on the deviation influence factors of dynamic collision test for child safety seat. Int. J. Crashworthiness 2021, 26, 283–294. [Google Scholar] [CrossRef]
  30. Liu, Q.; Tong, N.; Han, X. A Global Sensitivity Analysis Method for Multi-Input Multi-Output System and Its Application in Structural Design. Int. J. Comput. Methods 2022, 19, 2141005. [Google Scholar] [CrossRef]
  31. Hong, L.; Liu, G. Optimal design of rear-seat restraint system based on new safety seat during frontal collisions. Proceedings of the Institution of Mechanical Engineers. Part D J. Automob. Eng. 2022, 09544070221076899. [Google Scholar] [CrossRef]
  32. Koc, K.; Ekmekcioğlu, Ö.; Gurgun, A.P. Integrating feature engineering, genetic algorithm and tree-based machine learning methods to predict the post-accident disability status of construction workers. Autom. Constr. 2021, 131, 103896. [Google Scholar] [CrossRef]
  33. Zhang, X.; Niu, Y. Research on general layout parameters of I-SIZE child safety seat in frontal impact. Int. J. Crashworthiness 2022, 27, 968–978. [Google Scholar] [CrossRef]
  34. Binhui, J.; Shuifang, D.; Haojie, M.; Jinhai, Y. Simulation study of thoracic injury criteria in children. Automot. Eng. 2015, 37, 897–903. [Google Scholar] [CrossRef]
  35. China Automotive Technology Research Center Co. C-NCAP Management Rules; 2021 ed.; Automotive Technology Research Center: Tianjin, China, 2020; Available online: https://www.c-ncap.org.cn/ (accessed on 13 November 2022).
  36. Shasthri, S.; Kausalyah, V.; Shah, Q.; Abdullah, K. Parametric study for head injury criteria response of three-year olds in a child restraint system in oblique and lateral intrusive side impact. Int. J. Crashworthiness 2015, 20, 1–11. [Google Scholar] [CrossRef]
  37. Sibilski, K.; Małachowski, J. Sensitivity study on seat belt system key factors in terms of disabled driver behavior during frontal crash. Acta Bioeng. Biomech. 2019, 21, 169–180. [Google Scholar] [CrossRef]
Figure 1. (a) Frontal sled test setup; (b) The corresponding frontal collision simulation model.
Applsci 13 02206 g001
Figure 2. The acceleration pulse of sled test.
Applsci 13 02206 g002
Figure 3. Comparison of child dummy kinematics between simulation and test: (a) t = 30 ms; (b) t = 60 ms; (c) t = 90 ms; (d) t = 120 ms.
Applsci 13 02206 g003
Figure 4. Comparison of (a) head resultant acceleration and (b) chest resultant acceleration between test and simulation.
Applsci 13 02206 g004
Figure 5. The design framework of sensitivity analysis-based full factorial experiment.
Applsci 13 02206 g005
Figure 6. Layout of a Child Restraint System.
Applsci 13 02206 g006
Figure 7. Simulation illustration of severe injury in a child’s neck during a frontal crash due to seatbelt slippage.
Applsci 13 02206 g007
Figure 8. Headrest positions and lap belt guide positions: −10 mm adjustment (a1), reference position (a2) and 40 mm adjustment (a3) of the headrest; −10 mm adjustment (b1), reference position (b2) and 10 mm adjustment (b3) of the lap belt guide.
Applsci 13 02206 g008
Figure 9. A value of (a) 3 ms head resultant acceleration a H variation due to the lap belt guide position (Left) and the lap belt guide position (Right); (b) 3 ms chest resultant acceleration a C variation due to the lap belt guide position (Left) and the lap belt guide position (Right); (c) upper neck tension F Z variation due to the lap belt guide position (Left) and the lap belt guide position (Right); (d) the head horizontal displacement x H variation due to the lap belt guide position (Left) and the lap belt guide position (Right).
Applsci 13 02206 g009aApplsci 13 02206 g009b
Figure 10. A value of 3 ms head resultant acceleration a H variation (a), 3 ms chest resultant acceleration a C variation (b), upper neck tension F Z variation (c), the head horizontal displacement x H variation (d), caused by the elongation adjustment.
Applsci 13 02206 g010
Figure 11. Different initial contact positions between the shoulder belt and the shoulder: the shoulder belt leaning outward relative to the reference model with an initial tension of 45N; (a) the reference model with an initial tension of 50N; (b) the shoulder belt leaning inward relative to the reference model with an initial tension of 55N (c).
Applsci 13 02206 g011
Figure 12. A value of 3 ms head resultant acceleration a H variation (a); 3 ms chest resultant acceleration a C variation (b); upper neck tension F Z variation (c); the head horizontal displacement x H variation (d) caused by the shoulder belt initial tension adjustment.
Applsci 13 02206 g012
Figure 13. A value of 3 ms head resultant acceleration a H variation (a), 3 ms chest resultant acceleration a C variation (b), upper neck tension F Z variation (c), and the head horizontal displacement x H variation (d) caused by the backrest stiffness adjustment.
Applsci 13 02206 g013
Figure 14. Seat cushion angles: 1° (a); 4° (reference model) (b); 13° (c).
Applsci 13 02206 g014
Figure 15. A value of 3 ms head resultant acceleration a H variation (a), 3 ms chest resultant acceleration a C variation (b), upper neck tension F Z variation (c), and the head horizontal displacement x H variation (d) caused by the cushion angle adjustment.
Applsci 13 02206 g015
Figure 16. Maximum sensitivity analysis of each parameter: A = Position of the shoulder belt guides; B = Position of the lap belt guides; C = Belt webbing stiffness; D = Initial tension of shoulder belt; E = Seat backrest stiffness; F = Cushion angle.
Applsci 13 02206 g016
Table 1. Comparison of dummy injury evaluation indices in simulation and test.
Injury Evaluation IndicesExperimentSimulationError (%)
3 ms head resultant acceleration a H (g)64.859.1−8.7
Head resultant acceleration peak (g)64.259.9−6.7
15 ms Head Injury Criterion H I C 15 403.7371.1−8.1
3 ms chest resultant acceleration a c (g)35.340.213.9
Chest resultant acceleration peak (g)36.641.914.5
Table 2. Experimental scheme and simulation results.
Number x 1 (mm) x 2 (Nm/rad) a H
(g)
a c
(g)
F z
(kN)
WIC
12020,26751.434.42.20.6713
22520,26751.334.32.190.6693
33020,26751.234.82.180.6701
42025,33347.532.62.110.6308
52525,33347.632.52.100.6301
63025,33348.032.42.070.6295
72030,40047.332.52.120.6300
82530,40047.632.42.100.6296
93030,40047.932.22.080.6288
Table 3. Comparison of child dummy injury indices between the final design model and the original model.
Project a H
(g)
a c
(g)
F z
(kN)
x H
(mm)
WIC
Original model59.140.22.61285.30.7819
Final design model 47.932.22.08256.60.6288
Reduced injury (%)18.919.920.310.119.6
Disclaimer/Publisher’s Note: The statements, opinions and data contained in all publications are solely those of the individual author(s) and contributor(s) and not of MDPI and/or the editor(s). MDPI and/or the editor(s) disclaim responsibility for any injury to people or property resulting from any ideas, methods, instructions or products referred to in the content.

