Abstract
In this paper, a design procedure for a mono-anchor head anchoring a 2360 MPa high-strength steel strand is proposed. The performance criteria of the existing anchor head based on PTI (Post-Tensioning Institute) have been reorganized so that they can be evaluated based on the plastic hoop strain appearing at the top of the wedge hole. In order to design a mono-anchor head that does not exceed the permissible performance standard, the stress and deformation mechanisms of the mono-anchor head were investigated. It was confirmed that the external force was locally concentrated at the top of the wedge hole due to the interaction between the components of the anchorage device. An investigation based on the finite element method was conducted to identify the degree of external force concentration at the location and establish the relationship with the plastic hoop strain. An analytical investigation was conducted according to the design variables of the mono-anchor head, and in this process, static load tests and material tests were conducted to create an analytical model that reflects the actual behavior of the anchorage system. An equation was established regressionally so that the plastic hoop strain, which is a performance criterion, can be calculated according to the configuration and yield strength of the anchor head. Following the proposed design procedure, the configuration can be properly determined when the yield strength determination is limited due to material supply and demand. In addition, when space is limited during the construction of an anchorage device, the dimensions of an anchorage device in a small size can be determined, and the yield strength appropriate for that size can be determined.
1. Introduction
Concrete is vulnerable to tensile stress, and prestressing is therefore utilized to prevent the cracking of concrete structures under a service load. Therefore, the construction of PSC structures capable of increased serviceability and durability is increasing, and in the United States, more than 45% of bridges designed and constructed after 2010 are built with PSC [1]. Prestressing methods are classified as the post-tension method in which prestressed steel is anchored on hardened concrete, and the pre-tension method in which tensioning of the prestressing steel is applied before the concrete is cast on prestressed steel. Both methods require anchoring to transmit tensioning forces to the concrete. The steel used for prestressing is 1720~2360 MPa, which is a higher level than other structural steel materials, but the ultimate strength of individual anchoring device is only 500 MPa. The stress resisting at the initial stage of anchoring is 80% of the ultimate strength, and 95% of the yield strength of the prestressing steel [2]. When a prestressing anchoring system fails, it is expected to cause enormous damage to structures, with a huge release of energy of prestressing tendons. Therefore, it is very important to find and solve the factors that threaten the safety of the anchor system. In prior studies, the safety of individual components is important to improve the performance of anchorage systems under sustained loads. Accordingly, many researchers have pursued improvement of the anchorage system by considering the load pattern applied to the anchorage system, the shape of the anchorage device, the friction between parts, and the eccentricity according to the arrangement and shape of the wedge hole [3,4,5,6,7,8,9]. The main concern in these studies is fracture due to local stress concentration in the strand, which is the main cause of breakage in the anchoring system, and the purpose is to control the failure of the strand. These studies are limited to anchorage systems dealing with 1860 MPa prestressing steel.
Previously, 1860 MPa class strands were used as the main member for prestressing, but with the launch of 2360 MPa class strands, a smaller number of strands can efficiently transmit prestressing force to concrete [10]. As the tensile capacity of the individual strands increases, the serviceability of anchorage devices that need to resist higher loads should be considered. Kim et al. [4] applied the newly developed 2200 MPa and 2400 MPa single strands and performed tensile tests according to the combination of the components of the anchorage device of various specifications. They discussed the stress concentration of the strand by the anchorage device, and mentioned that a previously used anchorage device could be used to anchor the 2400 MPa grade strands. On the other hand, PTI [11] presents performance standards so that the anchor head can have a margin for safety. However, Kim et al. [4] did not consider the evaluation of the mechanical damage of the anchor head during the tensile test. Therefore, when anchoring high-strength strands, the anchor head must be improved to satisfy the PTI performance criteria for anchoring devices.
Anchorage devices used on construction sites must be approved for conformity based on proof tests [12]. To this end, newly designed products are accompanied by a static load test to determine suitability. However, the static load test, which has been mainly used in the past, takes a lot of time and money, so it is difficult to perform it every time depending on the design parameters to be determined. Therefore, many studies are optimizing based on numerical analysis and minimizing experiments to solve these problems [7,10,13]. On the other hand, structural analysis of anchorage devices has difficulty in reflecting actual behavior due to complex mechanical interactions. Therefore, the method of providing analysis results for the complex behavior of the anchorage device in advance can efficiently determine design specifications when designing the anchor head.
The purpose of this study is to design a mono-anchor head for anchoring seven-wire 15.2 mm 2360 MPa high-strength strands. In order to design a mono-anchor head, we referred to the anchor head performance standards presented by PTI [11]. In PTI [11], the permanent deflection of the upper surface of the anchor head is adopted as the evaluation criteria, but the shape characteristic of having a wedge hole in the center makes it difficult to measure the permanent deflection of the upper surface of the mono-anchor head. Therefore, it has been transformed into an index that can be evaluated. Then, the mechanical behavior characteristics of the mono-anchor head were analyzed, and the main variables affecting the performance criteria were identified. An analytical study was conducted according to the combination of various design variables, and the analysis results were quantified to evaluate the performance criteria according to the design specifications. In this process, a static load test and a test of the materials used were conducted in advance to construct an analytical model that reflects the actual behavior. A design procedure is presented based on the quantified analysis results, and if this is used when designing a mono-anchor head, design variables can be easily determined without experimentation and analysis.
2. Performance Criterion of Mono-Anchor Head
PTI [11] contains performance standards with a stable margin for safety that are meant to reduce the damage to the anchor head due to the tension introduced into the strand. A static load test of the anchoring system is recommended, including the anchorage devices and the strands, with unloading after loading 95% of the minimum tensile strength (MUTS) of the strands, followed by an evaluation of any permanent deflection of the anchor head after disassembly of the anchoring components. The permanent deflection is measured at the top of the anchor head, as shown in Figure 1a, and the corresponding allowance criteria should not exceed 1/600th of the clear span. However, it is difficult to evaluate the performance of a mono-anchor head by applying the aforementioned method. Instead, the residual deformation around the wedge hole can be taken as a parameter of performance for a mono-anchor head because the permanent deflection of the anchor head is closely related to deformation of wedge holes.
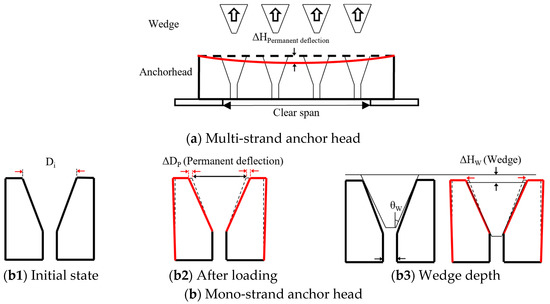
Figure 1.
Permanent deflection of the anchor head.
In this study, a new performance evaluation method for a mono-anchor head is proposed by replacing the vertical deflection with the lateral deformation of the wedge hole. The deflection of the anchor head top surface suggested by PTI [11] can be assumed to be the relative depth into which the wedge slips in Figure 1(b3). Assuming that the material of the wedge and the strand is rigid, due to the slip depth of the wedge, the diameter of the wedge hole () becomes wider. Accordingly, the deformation of the wedge hole diameter in a mono-anchor head can be converted to the above-mentioned relative depth of the wedge by Equation (1).
The allowable criterion for the relative depth of the wedge () in the anchor head to be analyzed is 0.0373 mm, which is 1/600th of the clear span length of 22.38 mm of the used anchor head in this study. Therefore, the increase in the allowable diameter of wedge hole (), which will be the performance criterion of the mono-anchor head, is calculated by Equation (1) as 0.0009 mm. When recalculating the plastic hoop strain at the top of the wedge hole (), a performance parameter, the maximum acceptable is 0.000283.
3. Behavioral Mechanism of Mono-Anchor Head
The anchorage device for single strands consists of a wedge and a mono-anchor head. When the strand is tensioned, the wedge is drawn into the anchor head together with the strand and transmits the tensioning force to the inclination inside the anchor head. As shown in Figure 2a, assuming that the inclination angles of the anchor head and wedge are the same, the normal stress is uniformly distributed over the entire inclined surface of the anchor head. The normal stress of the anchor head inclined surface is the load transmitted through the wedge () divided by the inclined surface area of the anchor head () as in Equation (2). The load acting perpendicular to the inclined surface is calculated by Equation (3). In this case, P is the load on the strand, is the inclination angle of the anchor head, α is the friction angle between the wedge and the anchor head, and the friction coefficient () is defined as μ = tan(α) [14,15,16].
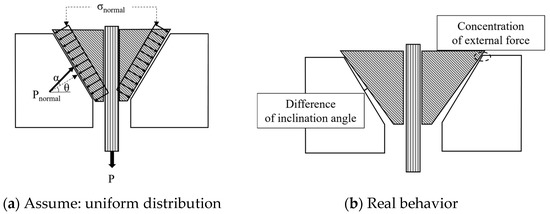
Figure 2.
Behavioral mechanism of mono-anchor head.
However, the wedge has a large inclination angle of 0.3° to 0.7° compared to the angle of the anchor head inclination, so the load is concentrated on the top of the wedge hole as shown in Figure 2b. The load applied to that location is several times higher than the load assumed to be uniform. In this context, the degree of external force concentration at the top of the wedge hole was defined as the concentration factor (k), and the unit force of that was expressed as . When the unit load acting perpendicular to the anchor head inclination surface is converted into a cylindrical coordinate system in consideration of the anchor head shape, it is separated into a vertical load and a radial load. Each component force can be regarded as the principal stress acting on the element located at the top of the wedge hole, and the effective stress can be calculated as a combination of each principal stress applied to the element before yielding. The effective stress was calculated according to the von-Mises stress theory, and it can be arranged as in Equation (6) by combining Equations (4) and (5) [17].
The plastic hoop strain at the top of the wedge hole, which is a performance criterion of the mono-anchor head, can be quantified in relation to the stress at that location. Although the stress at the location can be calculated mechanically, it is difficult to derive a clear value numerically for the behavioral characteristics of the material. Therefore, the degree of concentration of external force is calculated based on finite element analysis.
4. Finite Element Modeling of Mono-Anchor Head
Finite element modeling that reflects the behavior of an actual anchorage device is important to establish the stress and strain characteristics occurring at a specific location of the mono-anchor head. Therefore, reliable analysis modeling of an anchoring system using a 2360 MPa strand and a high-strength mono-anchor head was performed based on the static load test and the material test used for the anchor head in advance.
4.1. Static Load Test
Finite element modeling that reflects the behavior of an actual anchorage device is important to establish the stress and strain characteristics occurring at a specific location of the mono anchor head. Therefore, the static load test of the anchoring system using the anchor head of the shape shown in Figure 3 and Table 1 was performed in advance to understand the behavior characteristics of the actual mono-anchor head. The test was performed, and the deformation characteristics of the anchor head according to the applied load were identified by attaching a strain gauge to the outer surface of the mono-anchor head. As shown in Figure 4a, a three-piece wedge and a mono-anchor head were used at both ends of a 2360 MPa strand with a free length of 1500 mm. The load was measured on the universal test machine, and the displacement was measured as the movement of the UTM crosshead. The strain gauge attached to the mono-anchor head measured the strain in the hoop direction as shown in Figure 4b. In order to eliminate undesired initial set-up error, the test specimens were loaded and unloaded three times up to 50 kN and then loaded until the strand failed. Two specimens were prepared and tested to establish reliable behavioral characteristics for all specimen groups.
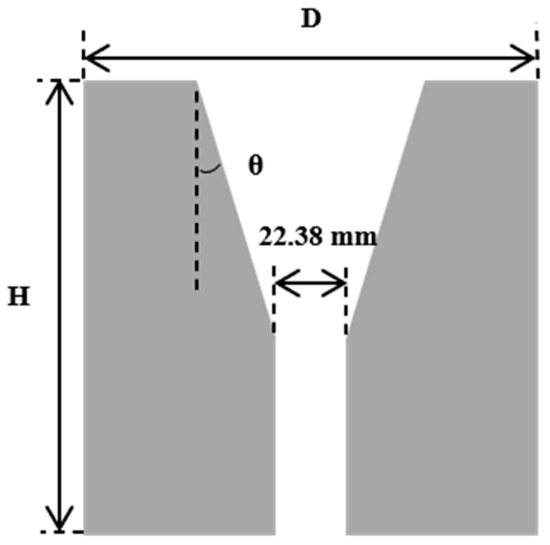
Figure 3.
Detail of mono-anchor head.

Table 1.
Anchor head specifications for the static load test.
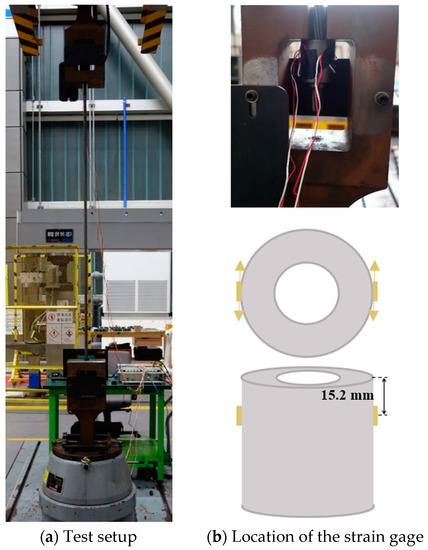
Figure 4.
Static load test.
The load-displacement curve for each specimen is shown in Figure 5. When the load-displacement curves of all specimens are compared, as shown in Figure 5e, the behavior characteristics according to the configuration of the mono-anchor head cannot be discriminated, and it can be confirmed that only the dominant behavior appears in the strand. On the other hand, the results of strain measurement in the hoop direction measured to specify the behavior of the mono-anchor head are shown in Figure 6, according to the load applied to the strand. It can be confirmed that the individual strains attached to the same specimen show non-constant result values. This is considered to be the effect of the wedge placed inside the anchor head, and should be specifically considered through analysis when investigating the behavior according to the design variables of the anchor head.
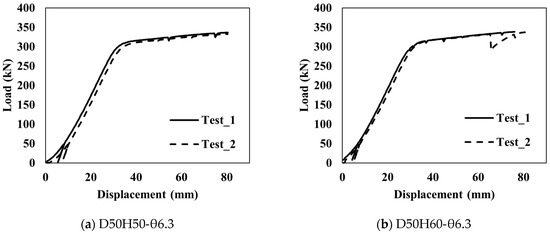
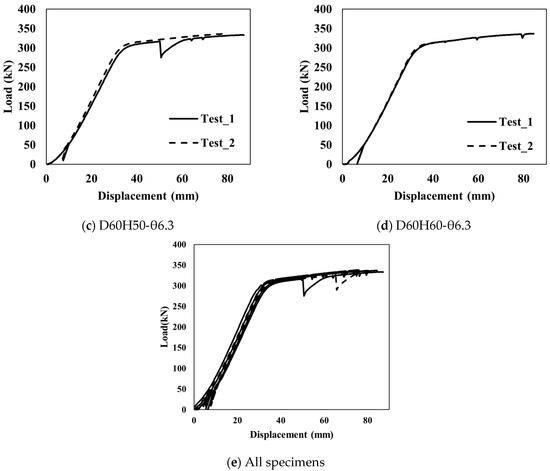
Figure 5.
Load-displacement curve of anchorage system.
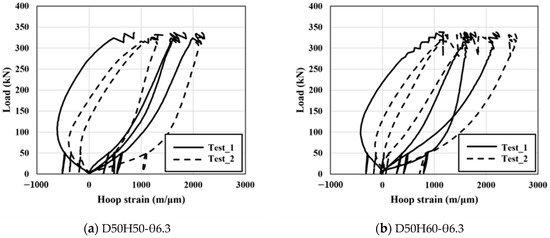
Figure 6.
Hoop strain of mono-anchor head.
4.2. Material Test of Steel for Mono-Anchor Head
Conventionally, the material used for anchor heads is C45 [18], which has a yield strength of 340 MPa; stress in the local region of the anchor head will inevitably exceed the yield strength. Therefore, in this study, a carburized 42CrMo4 [19] anchor head was adopted to increase the yield strength and reduce inelastic deformation during tensioning of strands. Tensile tests were conducted on non-carburized (H0) and 1 mm-deep carburized specimens (H1) in an effort to understand the effect of carburization. During the carburizing process, the surface is hardened by the carbon penetrating into a surface layer, and the carbon content decreases as the depth increases from the surface, resulting in lower yield strength and hardness. In order to consider the hardened layer with higher strength in FEM modeling, the mechanical properties for each layer should be defined. In this study, hardness tests for H0 and H1 were conducted, and correlation between the strength and hardness was used to indirectly identify the material properties in each layer of heat-treated anchor heads.
4.2.1. Tensile Test of Carburized 42CrMo4
The specimen for the tensile test was manufactured according to the standard dimensions in ISO 6892-1 [20]. The specifications of the tensile test specimen are shown in Figure 7. Three specimens were manufactured and tested for each of the two variables according to the carburizing process. The stress-strain curves for two carburizing parameters are shown in Figure 8, and the average yield and ultimate strengths of the three specimens with the same parameters were computed, as shown in Table 2. With carburization, the ultimate strength of the material increased by 40% and the yield ratio increased by 20%.
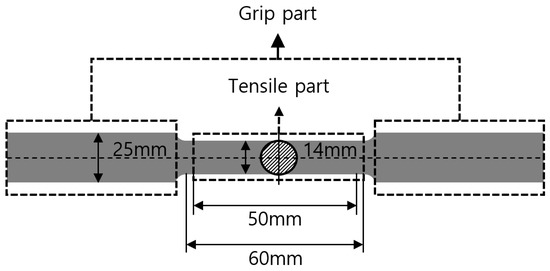
Figure 7.
Tensile test specimen.
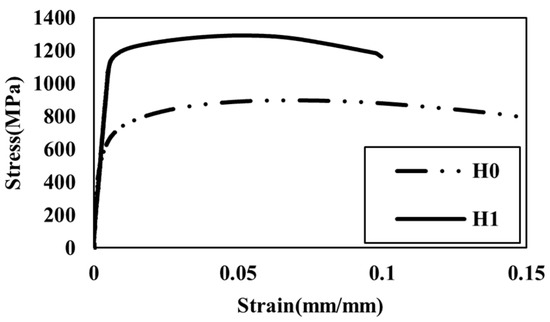
Figure 8.
Stress-strain curve of the tensile test specimens.
Table 2.
Tensile test results.
4.2.2. Hardness Test of Carburized 42CrMo4
In the cross-section of the carburized steel, the hardness decreases linearly up to a certain depth from the surface according to the carbon content and remains constant at a depth beyond that point [21,22]. Here, a hardness test was conducted to identify the degree of hardening according to the depth from the surface. A grip part of a circular cross-section of a tensile test specimen was cut, and the Vickers hardness was measured at 0.5 mm intervals from the surface of the test specimen, as shown in Figure 9.
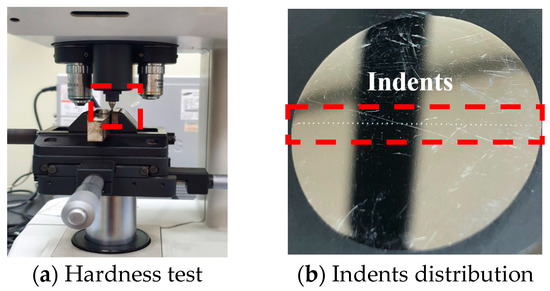
Figure 9.
Vickers hardness test.
In the two specimens, for each variable, the Vickers hardness is distributed as shown in Figure 10. In addition, Table 3 shows the maximum, minimum, and average values according to the carburizing parameters. The hardness of the carburized specimens was approximately 40% higher than that of the non-carburized specimen. For the carburized specimens, a linear decrease of hardness was present up to a depth of 1 mm. Therefore, the carburized specimen can be divided into an inner layer and an outer layer according to the effective hardening depth, inferring that each layer has different yield strength and tensile strength values.
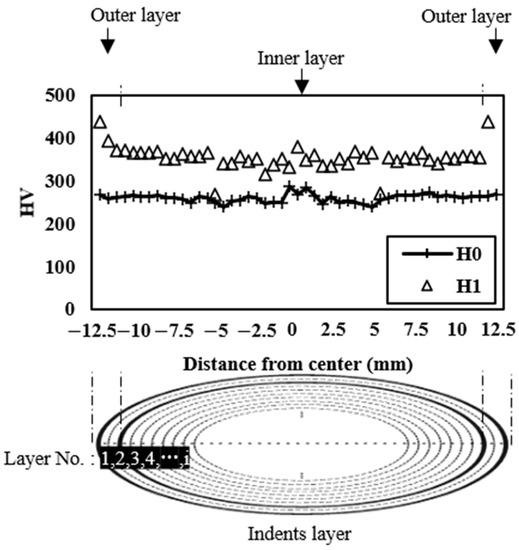
Figure 10.
Hardness distribution according to the distance from the center.
Table 3.
Hardness test results (unit: HV).
4.2.3. Estimation of the Strength of Carburized 42CrMo4 Considering the Hardened Layer
The effective hardness () values of the outer and inner layer are average values calculated by weighting the area of each layer () with the hardness at each indent (). This is expressed by Equation (7).
Pallina et al. [23] derived the regression equations, presented as Equations (8) and (9), by defining correlations between hardness, yield, and tensile strength of various steel samples. In this study, the yield strength and tensile strength of the outer and inner layers used in FEM modeling were computed using Equations (8) and (9) for the hardness distribution obtained from the tests above. The values are presented in Table 4.
Table 4.
Strength conversion (Pallina et al. [23]).
Based on the area weighted average strengths of Equations (10) and (11), the yield and tensile strength can be calculated as 937 MPa and 1234 MPa, respectively. The tensile strength by Equation (11) is similar to the test results in Table 2, even though predicted yield strength by Equation (10) shows some discrepancy. Nevertheless, linear correlation between strengths and hardness from test results and Pallina et al. [23] can rationalize the new anchor head modeling method considering carburized depth. Therefore, this study proposes a new anchor head modeling that has two layers with different strengths.
4.3. Finete Element Modeling
4.3.1. Specification of Components and Parameters of a Mono-Anchor Head
In this study, in order to analyze the behavior of the anchor head, considering the interaction between components of the anchorage system, detailed modeling of the individual parts was conducted. All individual steel wires were modeled according to the standard of seven-wire strands presented in ASTM A416 [24]. The geometric properties of the strand wire, wedge, and anchor head are shown in Figure 11, and the variables of the outer diameter, height, and surface inclination angle of the anchor head are the same as those performed in the static load test.
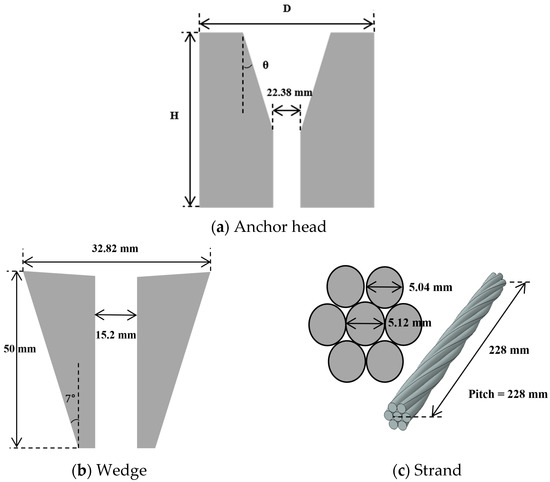
Figure 11.
Details of anchorage components.
4.3.2. Material Properties
The material properties of the carburized 42CrMo4 anchor head were assigned to 1 mm thick outer and inner surface layers as shown in Figure 12. The wedge was made of AISI 4320 steel, and the yield and tensile strength were obtained through uniaxial tensile tests. To assess the strength of the seven-wire strand, the nominal strength specified ISO 6934-4 [25] was referenced. The outer wire of the strand under axial load exhibits not only tensile behavior, but also torsional behavior due to the helical geometry [26]. The nominal strength of the strand takes into account the loss due to torsion of the individual wire, so the strength of the wire should be higher than the nominal strength of the strand in ISO 6934-4 [25]. Therefore, the strength of the individual steel wires was adjusted to match the stress-strain curve of the static load test. The material properties of the anchor head, wedge, and individual wire are described in Table 5.
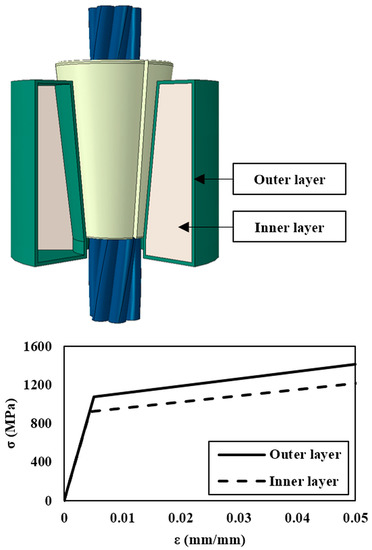
Figure 12.
Application of material properties for each layer.
Table 5.
Material properties.
4.3.3. Geometric Modeling: Interaction, Boundary, and Loading Conditions
The anchoring mechanism of the strand is as follows. When a load is applied to the strand, the wedge holding the strand slides along the inner slope of the anchor head, and the normal stress transmitted to the strand increases as the applied force increases. At this moment, the saw teeth existing on the inner surface of the wedge grasp the strand strongly, with the result being that it behaves almost as a single part. Accordingly, the saw teeth are not modeled, and a ‘rough’ property of Abaqus is applied with regard to the interaction between the wedge and the strand to prevent the parts from separating. A ‘penalty’ algorithm is used to implement the interactions between the individual wires constituting the strand, and the interaction between the anchor head and the wedge via friction contact. The coefficient of friction at the contact surface between steel materials is usually evaluated as 0.3 to 0.7 in a dry condition [27]. The friction coefficient between the strands was applied at 0.3, and the analysis was performed by changing the friction coefficient to 0.4, 0.5, and 0.6 for the wedge-anchor head interface, which can significantly affect the behavior of the anchorage device. The result was compared with the static load test result as shown in Figure 13; when the friction coefficient was 0.5, it showed the most similar behavior to the specimen used in the test. Additionally, the wedge and the inner surface of the anchor head have a single differential angle, meaning that the contact area changes due to the deformation of the individual parts according to the increase of the load step. ‘Interference fit’ was applied to improve the convergence of the analysis. As the load is applied, the wedge holding the strand slides inside the anchor head and then transmits the radial, and axial stress to the anchor head. As shown in Figure 14, the z-axis was constrained with respect to the bottom surface of the anchor head. For loading, a displacement-controlled method was used. Displacement was applied in the axial direction relative to the ends of the strands. In order to reduce computational time, a free length of 147 mm for the strand was modeled.
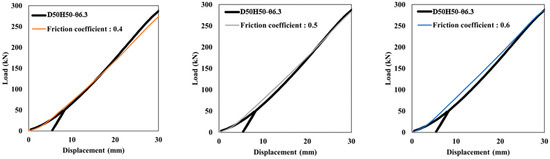
Figure 13.
Friction coefficient evaluation at wedge-anchor head interface.
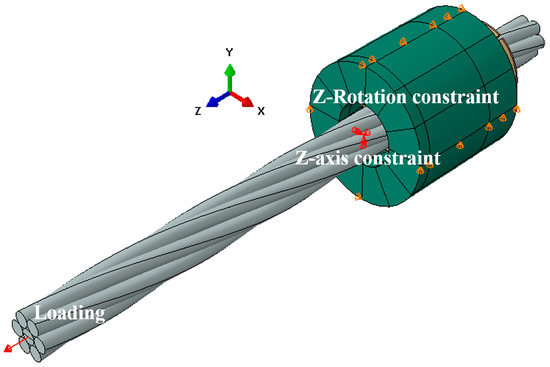
Figure 14.
Boundary and loading condition.
4.4. Verification of the FE Model
As shown in Figure 15, the total displacement in the anchoring system includes not only the increased length of the strand, but also the slip displacement between the anchor head and the wedge [28]. The analysis model that has a shorter free length was calibrated for comparison with the displacement measured in the static load test.
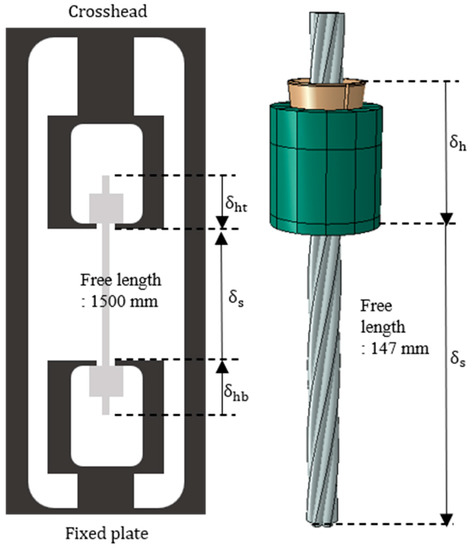
Figure 15.
Correction of analysis displacement.
In the load-displacement curve obtained from the finite element analysis results, the point where the stiffness changes at the beginning of the load in the elastic section is found. This is the effect of ‘interference fit’ applied to control the analysis error that occurs between the contact between the wedge and the anchor head. It is not a matter to be considered because it is not an area of interest to be obtained through analysis. In the load-displacement relationship obtained from the test and finite element analysis, since the displacement ratio of the strand is dominant compared to the total displacement, the material properties of the strand can be verified. The load displacement from the test and the corrected analysis results are shown in Figure 16, and showed good agreement. In addition, the measured hoop strain was compared to specify the behavioral characteristics of the anchor head. Prior to comparison, the hoop strain of the outer surface of the anchor head obtained from the FE analysis is shown in Figure 17a. When a piece of three-piece-wedge slides into the anchor head, the amount of strain appears differently depending on the contact position with the wedge. Since this strain distribution has unique characteristics depending on the design parameters of the anchor head, it is desirable to verify the analytical model by comparing it with the strain distribution in the test. Figure 17b shows the maximum, minimum, and average values according to the design variables of the hoop strain obtained in the test and FE analysis. The maximum and minimum hoop strains show some differences, but on average, show similar results. This may be attributed to imperfect settlement of the wedge in the anchor head. However, since the overall tendency is similar, the modeling method of the anchor head can be evaluated as well reflecting the actual behavior.
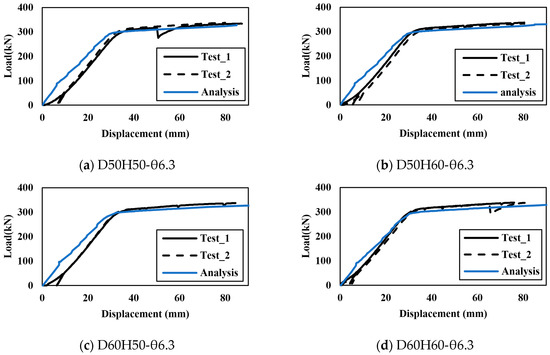
Figure 16.
Comparison of load-displacement curves between the test and the analysis.
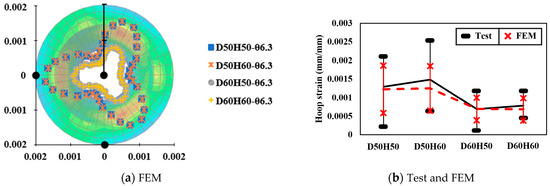
Figure 17.
Hoop strain distribution in anchor head.
5. Parametric Study
5.1. Determination of Design Parameters
The purpose of the parametric analysis is to establish the behavioral characteristics of the anchor head. The quantitative properties to be established are stress and plastic hoop strain, and design parameters have been determined so that these can be obtained. First, the concentration of external force must be quantified so that the stress applied to the top of the wedge hole can be quantified. Diameter, height, and internal inclination angle, which are shape variables that affect the degree of external force concentration, were adopted as design parameters. In addition, the plastic hoop strain, which is a performance evaluation criterion, is also adopted as a design parameter because the stress caused by external force exceeds the yield strength. The adopted variables are outer diameter, height, and inner inclination angle, and are organized as shown in Table 6.
Table 6.
Design parameters of the Anchor head.
5.2. Performance Evaluation According to the Design Parameters
In total, 72 models were analyzed to assess the behavior of the anchor head. With the combination of the diameter, height, and inclination angle shown in Table 6, two materials with 36 configurations were used for the models. Carburized 42CrMo4 and C45 were used. The yield strengths were 1170 MPa and 340 MPa, respectively. The behavior of the anchor head according to the design variables was compared under 95% of the MUTS of the strand, the standard load suggested for a performance evaluation by PTI [11]. At this time, the maximum von-Mises stresses were compared in the anchor head in the triaxial state due to the axial stress and the circumferential and radial stresses. In addition, the plastic hoop strain at the top of the wedge hole, which is the performance parameter, was extracted and compared with the acceptance criterion.
At the top of the wedge hole in the anchor head, the load was concentrated, the maximum stress occurred, and it showed different patterns depending on the configuration. Figure 18 shows the maximum stress according to the configuration of the anchor head for each material, and the resulting plastic strain is shown in Figure 19. The effect of the height was insignificant, and thus only the effects of the diameter and inclination angle are compared. The stress of the anchor head using the carburized 42CrMo4 did not exceed the yield strength and only showed elasticity. Accordingly, plastic hoop strain did not occur at all. On the other hand, the stress of the anchor head using C45 exceeded the yield strength locally and exceeded the allowable plastic hoop strain in all configurations. It can be implied that the carburized 42CrMO4 anchor head has excessive strength, but the C45 anchor head needs improvement in strength for use with 2360 MPa high-strength steel strand.
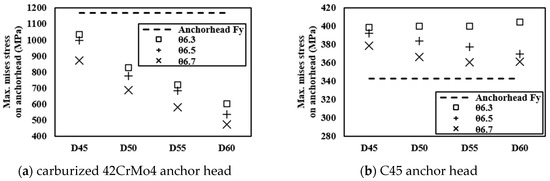
Figure 18.
Maximum stress of the anchor head at 95% MUTS.
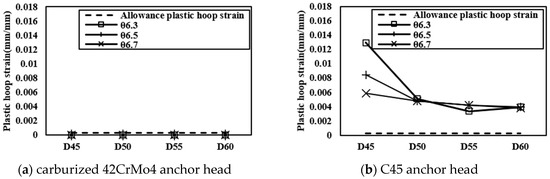
Figure 19.
Plastic hoop strain on the top of the wedge hole.
5.3. Determination of Mono-Anchor Head Design Specifications
The maximum stress obtained by parametric analysis refers to the stress at the top of the wedge hole. The concentration of external force was compared with the maximum stress of the 42CrMo4 anchor head to be quantified based on Equation (6), calculated in Chapter 3. Concentration factor (k) is distributed according to the diameter and inclination angle as shown in Figure 20, and Equation (12) was derived so that it can be calculated by those parameters. Therefore, when the diameter and internal inclination angle are determined, the concentration factor can be calculated using Equation (15) and the maximum stress during elastic behavior can be calculated by applying the calculated concentration factor to Equation (6).
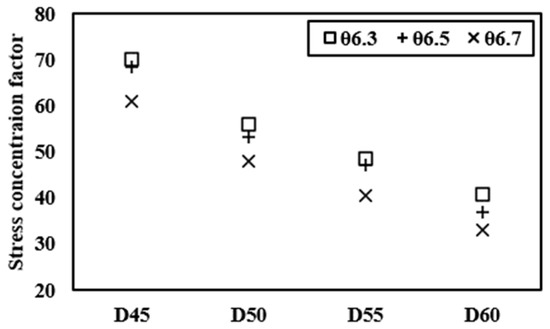
Figure 20.
Stress concentration factor.
Then, the relationship between the plastic hoop strain distributed in the C45 anchor head and the stress exceeding the yield strength was established. In Figure 21, the x-axis is the yield strength excess stress, and it is calculated as the difference between the maximum elastic stress for each configuration and the yield strength of the anchor head. The y-axis represents the plastic hoop strain occurring at the top of the wedge hole due to the stress exceeding the yield strength. The points shown in the graph were derived as a quadratic equation with 0 as the y-intercept as in Equation (16).
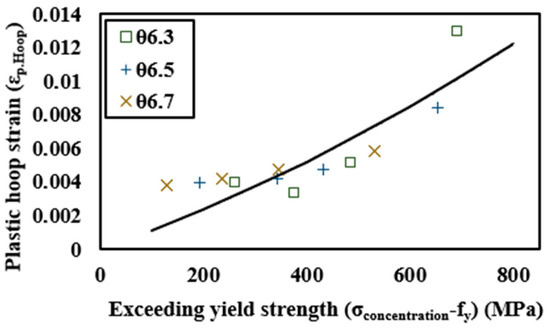
Figure 21.
Plastic hoop strain for stress exceeding the yield strength.
Taking into account the relationship between the yield strength and the plastic hoop strain, an additional FE analysis was performed for verifying Equation (16). The arbitrary designated yield strength values are 343 MPa and 800 MPa, and the calculations of the plastic hoop strain for each configuration based on Equation (16) and the FE analysis results were compared. The two verification results are described in Figure 22a,b, respectively. In the proposed equation, when the difference between the elastic maximum stress () and determined yield strength () of the same configuration exceeds 300 MPa, the plastic hoop strain overestimates compared to FEM; when it is below 300 MPa or exceeds 700 MPa, the plastic hoop strain is underestimated compared to FEM. However, all cases here show similar results and it is judged that there will be no limit when evaluating whether the plastic hoop strain allowance is met. Based on the equations proposed in this paper, anchor head design parameters with safe performance can be determined. Figure 23 shows the minimum yield strength of steel that can be applied according to the shape of the anchor head.
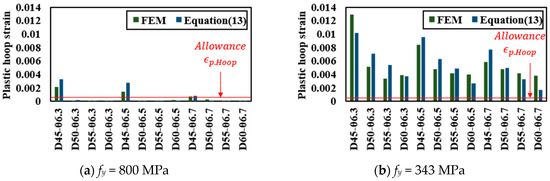
Figure 22.
Comparison of the FEM and Equation (15) results at the specified yield strength.
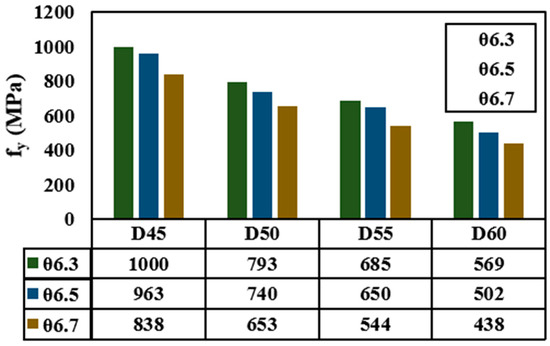
Figure 23.
Minimum yield strength according to the configuration of the mono-anchor head.
6. Design Procedure of the Mono-Anchor Head for Use with 2360 MPa Steel Strand
Generally, steel structures are designed not to exceed their allowable stress. It would be efficient to design the anchor head so that its stress does not exceed the allowable stress. However, despite having a simple shape, a structure such as a mono-anchor head exhibits complex behavior due to the interaction with the wedge, so performance evaluation should be performed through static load test during product design. PTI, which requires anchor head performance evaluation through testing, recommends evaluating the permanent deflection of the upper surface of the anchor head as a performance criterion. In order to exclude the complex process required for testing, this paper proposes a simple design procedure.
In this paper, the behavior characteristics of the anchor head were investigated in advance by finite element analysis that reflects the actual behavior based on the static load test. Based on the investigated behavior characteristic, it is possible to evaluate the performance of the anchor head according to the design parameters of the anchor head. The simplified procedure determining design parameters of the diameter, angle of the inclined surface, and yield strength of the anchor head to meet the safety performance specifications of a mono-anchor head is illustrated in the flowchart in Figure 24. The following procedure can be applied in the anchoring system using the 2360 MPa strand and three-piece wedge.
Figure 24.
Procedure to determine the design parameters of a mono-anchor head.
- (1)
- The standard loading load for the performance evaluation of the anchor head was 310 kN, the allowable plastic hoop strain was 0.000283, the friction coefficient between the anchor head and the wedge was 0.5, and the additional angle (α) formed by friction was 26.6°.
- (2)
- Assume the configuration parameters, which are the diameter (D) and angle of the inclined surface (θ) within the range analyzed in this study.
- (3)
- Calculate the concentration factor of the specified configuration of the anchor head.
- (4)
- Additionally, calculate the area of the inclined surface of the anchor head and the normal stress applied to the inclined surface.
- (5)
- Calculate the elastic maximum stress in a given configuration of the anchor head.
- (6)
- Assume the yield strength, which is more than 200 MPa, of the anchor head.
- (7)
- Calculate the plastic hoop strain of the anchor head.
- (8)
- If the plastic hoop strain exceeds 0.000283, reassume the yield strength.
- (9)
- When the plastic hoop strain is less than or equal to 0.000283, loop is stopped and are determined.
7. Summary and Conclusions
In this paper, we present a design procedure to determine the design parameters that satisfy the safety performance criteria of anchor heads anchoring high-strength strands. Performance criteria for evaluating mono-anchor heads were presented. Next, the mechanical behavior characteristics of the mono-anchor head were identified, and finite element analysis was performed to quantify it numerically. A static load test was conducted so that the analysis model reflected the actual behavior, and a highly reliable analysis model was modeled through the material test of the anchor head. A parametric analysis was performed according to the diameter, internal inclination angle, and yield strength of the material, which are considered major parameters in designing the anchor head, and the relationship between stress and plastic strain was established. The results of this study are summarized as follows:
- (1)
- It is reasonable to evaluate the permissible performance criteria of a mono-anchor head using the plastic hoop strain. Accordingly, in this paper, the permissible performance criteria were evaluated using the plastic hoop strain at the top of the wedge hole in the anchor head.
- (2)
- Among the anchoring device components, the difference in inclination angle between the wedge and the anchor head is the main cause of stress concentration at the top of the wedge hole, and finite element analysis was performed to quantify it numerically.
- (3)
- In the static load test conducted prior to finite element analysis, the steel used for the anchor head was carburized 42CrMo4. When modeling for this analysis, it is effective to separate the hardened layer and the inner layer of the material and apply each strength.
- (4)
- The concentration of the load applied to the top of the wedge hole was calculated by analyzing the behavior of the carburized 42CrMo4 anchor head with elastic response according to the configuration based on the finite element analysis. Through this, the stress of the element located at the top of the wedge hole can be calculated.
- (5)
- The plastic hoop strain at the top of the wedge hole, which is the performance criterion, was established in relation to the stress exceeding the yield strength. Using this relationship, the plastic hoop strain can be calculated when the anchor head diameter, internal inclination angle, and yield strength are determined.
- (6)
- A design simplification procedure was proposed to determine the design parameters.
According to the design method developed in this paper, the following two advantages can be expected. (1) When the selection of steel strength is limited, the configuration of the anchor head can be easily determined. (2) When the construction space of the anchor head is limited, the yield strength can be easily determined.
Author Contributions
Conceptualization, S.-W.K. and J.-K.K.; methodology, S.-W.K.; software, S.-W.K.; validation, S.-W.K. and J.-K.K.; formal analysis, S.-W.K.; investigation, S.-W.K.; resources, J.-K.K.; data curation, S.-W.K.; writing—original draft preparation, S.-W.K.; writing—review and editing, J.-K.K.; visualization, S.-W.K.; supervision, J.-K.K.; project administration, S.-W.K. All authors have read and agreed to the published version of the manuscript.
Funding
This study was supported by the Research Program funded by SeoulTech (Seoul National University of Science and Technology).
Institutional Review Board Statement
Not applicable.
Informed Consent Statement
Not applicable.
Data Availability Statement
Not applicable.
Conflicts of Interest
The authors declare no conflict of interest.
References
- Hiba, A.J.; Glisic, B. Monitoring of prestressing forces in prestressed concrete structures—An overview. Struct. Control Health Monit. 2019, 26, e2374. [Google Scholar]
- Sétra. European Technical Approval No. ETA-09/0068; Sétra: Bagneux, France, 2009. [Google Scholar]
- Noh, M.H.; Seong, T.R.; Kim, J.K. Nonlinear analysis of anchor head for high strength steel strand. COSEIK 2012, 25, 163–174. (In Korean) [Google Scholar]
- Kim, J.K.; Seong, T.R.; Park, K.P. Tensile behavior of new 2200 MPa and 2400 MPa strands according to various types of mono anchorage. Struct. Eng. Mech. 2013, 47, 383–399. [Google Scholar] [CrossRef]
- Musselman, E.; Fournier, M.; McAlpine, P.; Sritharan, S. Behavior of unbonded post-tensioning monostrand anchorage systems under short duration, high amplitude cyclical loading. Eng. Struct. 2015, 104, 116–125. [Google Scholar] [CrossRef]
- Yang, C.; Okumus, P. Mechanical behavior and prestress loss of unbonded posttension strands in self-centering structures. J. Mater. Civ. Eng. 2020, 29, 04017245. [Google Scholar] [CrossRef]
- Ma, Z.; Chen, C.; Sun, X.; Wu, G.; Liu, P.; Gao, L. Test and numerical simulation of failure mechanism of barrel and wedge anchorage in coal mines. Constr. Build. Mater. 2020, 237, 117647. [Google Scholar] [CrossRef]
- Bedriñana, L.A.; Zhang, K.; Nishiyama, M. Evaluation of the behavior and ultimate capacity of unbonded monostrand-anchorage systems under concentric and eccentric inelastic cyclic loading. Eng. Struct. 2018, 176, 632–651. [Google Scholar] [CrossRef]
- Walsh, K.Q.; Kurama, Y.C. Behavior of Unbonded Post-tensioning Monostrand Anchorage Systems under Monotonic Tensile Loading. PCI J. 2010, 55, 97–117. [Google Scholar] [CrossRef]
- Kim, J.K.; Seong, T.R.; Lee, J.K. Development of 2,160 MPa/2,400 MPa PS strand and its application technology. Mag. Korea Concr. 2012, 24, 45–50. (In Korean) [Google Scholar]
- PTI. PTI M50.2-00: Anchorage Zone Design; Post-Tensioning Institute: Chicago, IL, USA, 2000. [Google Scholar]
- EOTA. Post-Tensioning Kits for Prestressing of Structures; EAD 160004-00-0301; European Organization for Technical Approvals: Brussels, Belgium, 2016. [Google Scholar]
- Bastien, J.; Marceau, D.; Fafard, M.; Ganz, H.R. Use of FEA for design of posttensioning anchor head. J. Bridge Eng. 2007, 12, 194–204. [Google Scholar] [CrossRef]
- Komura, T.; Wada, K.; Takano, H.; Sakamoto, Y. Study into mechanical properties and design method of large cable sockets. JSCE 1990, 7, 251–262. [Google Scholar] [CrossRef] [PubMed]
- Yoo, H.; Lee, S.H.; Seo, J.W. Effect of the tapered angle on the ultimate load factors of PPWS socket in main cables of suspension bridges. KSCE 2013, 33, 47–59. (In Korean) [Google Scholar] [CrossRef]
- Yoo, H.; Lee, S.H.; Seo, J.W. Behavior analysis of PPWS sockets for suspension bridges considering frictional contact. KSCE 2013, 33, 1281–1293. (In Korean) [Google Scholar] [CrossRef]
- Mises, R.V. Mechanik der festen Körper im plastisch-deformablen Zustand. Nachr. Von Der Ges. Der Wiss. Zu Göttingen Math. Phys. Kl. 1913, 1913, 582–592. (In German) [Google Scholar]
- EN 10083-3; Steel for Quenching and Tempering-Part3: Technical Delivery Conditions for Alloy Steels. CEN: Berlin, Germany, 2007.
- EN ISO 683-1; Heat-Treatable Steel, Alloy Steels and Free-Cutting Steel-Part1: Non-Alloy Steel for Quenching and Tempering. ISO: Geneva, Switzerland, 2018.
- ISO 6892-1; Metallic Materials—Tensile Testing—Part 1: Method of Test at Room Temperature. Beuth Verlag: Berlin, Germany, 2019.
- Walvekar, A.A.; Sadeghi, F. Rolling contact fatigue of case carburized steels. Int. J. Fatigue 2017, 95, 264–281. [Google Scholar] [CrossRef]
- Xu, G.; Hao, M.; Qiao, Y.; Zhang, Y.; Wang, G.; Zhao, M. Characterization of elastic-plastic properties of surface-modified layers introduced by carburizing. Mech. Mater. 2020, 144, 103364. [Google Scholar] [CrossRef]
- Pavlina, E.J.; Van Tyne, C.J. Correlation of yield strength and tensile strength with hardness for steels. J. Mater. Eng. Perform. 2008, 17, 888–893. [Google Scholar] [CrossRef]
- ASTM A416; Standard Specification for Low-Relaxation, Seven-Wire Steel Strand for Prestressed Concrete. American Society for Testing and Materials International: West Conshohocken, PA, USA, 2018.
- ISO 6934-4; Steel for the Prestressing of Concrete—Part 4: Strand. ISO: Geneva, Switzerland, 2020.
- Heydarinouri, H.; Motavalli, M.; Nussbaumer, A.; Ghafoori, E. Development of mechanical strengthening system for bridge connections using prestressed CFRP rods. J. Struct. Eng. 2021, 147, 4020351. [Google Scholar] [CrossRef]
- Salmon, C.G.; Johnson, J.E. Steel Structures: Design and Behavior. In Emphasizing Load and Resistance Factor Design; HarperCollins College Publishers: New York, NY, USA, 1996. [Google Scholar]
- Heydarinouri, H.; Vidovic, A.; Nussbaumer, A.; Ghafoori, E. FE analysis and experimental validation of mechanical wedge-barrel anchor for CFRP rods. Compos. Struct. 2021, 275, 114509. [Google Scholar] [CrossRef]
Disclaimer/Publisher’s Note: The statements, opinions and data contained in all publications are solely those of the individual author(s) and contributor(s) and not of MDPI and/or the editor(s). MDPI and/or the editor(s) disclaim responsibility for any injury to people or property resulting from any ideas, methods, instructions or products referred to in the content. |
© 2023 by the authors. Licensee MDPI, Basel, Switzerland. This article is an open access article distributed under the terms and conditions of the Creative Commons Attribution (CC BY) license (https://creativecommons.org/licenses/by/4.0/).