1. Introduction
Alpine skiing is a popular winter sport requiring excellent technique, dexterity and courage. Courses in alpine skiing are set up on different slopes and under different conditions, according to governing rules. The level of difficulty depends on many variables and is difficult to assess objectively. The difficulty rating is usually based on subjective feelings verified by the number of unfinished runs. However, it is possible to distinguish certain parts of the route that clearly cause problems for all competitors and describe them using indicators.
In the analysis of the available literature, no data directly describing the difficulty of alpine skiing competition courses at the highest level were found. Several attempts have been made to quantify different slalom courses, in terms of route difficulty. Early attempts include fragmentary observations of the competitors run by a coach, as well as the three-gates drive tests presented by Cotelli F. and Cotelli M. [
1] and Nachbauer [
2]. However, such approaches do not allow for accurate determination of course sections which are more difficult than others. In related work, Twardokens [
3] studied a short fragment of a course and described the optimal path between two points (i.e., one section between a pair of gates), which is the shortest traveling distance between these points. However, due to gravity, the shortest time is not achieved along a straight line, but rather along an arc. To this day, there are no objective metrics available to quantify gate-to-gate difficulty in alpine skiing.
By calculating the mechanical parameters of a course, it is possible to approximately estimate the degree of difficulty of a given alpine skiing course in an objective manner. Much depends on the psychomotor skills of the competitor, their reaction time, muscle strength, endurance, the level of fear of injury or speed, the level of technique, etc. At the same time, this information could improve course safety [
4,
5], as it directly depends on gate setting around a course. A tool that would allow to assess the course route before the first run, based only on geometric data, would be very useful. This data can be collected during pole setup and difficulty assessed, allowing for instantaneous corrections if needed.
All calculated parameters of the difficulty coefficients of the course are based on the velocity of the competitor. Since these are the first attempts to determine these coefficients, the values of the individual impacts are not yet known. Therefore, the following velocity data are taken from the actual runs of the competitors and the assessment of the difficulty of the route is possible after the run. The next step will be to consider the predicted speed based on the course geometry. Then, we will get the opportunity to evaluate the course before the competition and correct difficult, dangerous fragments during the setting of gates.
Purpose of research: To objectively determine the difficulty of alpine skiing competition courses, based on the geometry of the course and the kinematic coefficients of the run.
2. Materials and Methods
The research monitored the runs of alpine skiers during 12 FIS World Cup events in four disciplines. Three downhill competitions (Val Gardena, Garmisch-Partenkirchen, Kvitfjelll), super G (Val Gardena, Hinterstoder, Kvitfjelll), giant slalom (Alta Badia, Hinterstoder, Kranjska Gora), and slalom (Alta Badia, Garmisch-Partenkirchen, Kranjska Gora). A total of 798 competitors took part in 12 competitions. Participants were considered the highest-ranked competitors in the world. A total of 978 runs were analyzed. A total of 160 competitors did not complete the run (16% of total).
Based on geodetic measurements, the coordinates of the gates, distances between gates, the angles of inclination, and route deviation were calculated. The measurements were made with a geodetic GPS receiver, achieving an accuracy of less than 0.01 m. The runs of all competitors were recorded with a video camera (60 f/s); 5 cameras placed on the edge of the route were used for longer routes such as DH and SG, and the unregistered fragment of the run was supplemented with official recordings of the competition organizer. In the AS-1 software, the times of passage between consecutive gates were marked. The accuracy of the measurement can be increased by involving at least three experts in the analysis of the runs, but it is extremely time-consuming. Having the time and distance, the run’s velocity (average velocity of the section), acceleration (calculated as the change in average velocity between the sections divided by the run time of these sections), and frequency (reciprocal of the period) were calculated on all sections between the gates [
5]. Based on these data, a route difficulty factor was then estimated.
By the concept of difficulty of run, we understand the sum of all factors that prevent a skier from obtaining the best result of a trial that would be theoretically possible, i.e., indirectly slowing down the run. Factors influencing course difficulty are operationalized below (the graphs are for illustration only):
First, a significant change in direction deviation, labelled here as α, represents deviation of the direction of a turn from the slope axis. The easiest way is to ski along a straight line (0° deviation), and the hardest is to complete a 360° turn (an extreme situation that does not occur during competition). Difficulty level 1 was the average deviation angle (α average) found in four disciplines from slalom to downhill routes (different values for individual competitions); see
Figure 1.
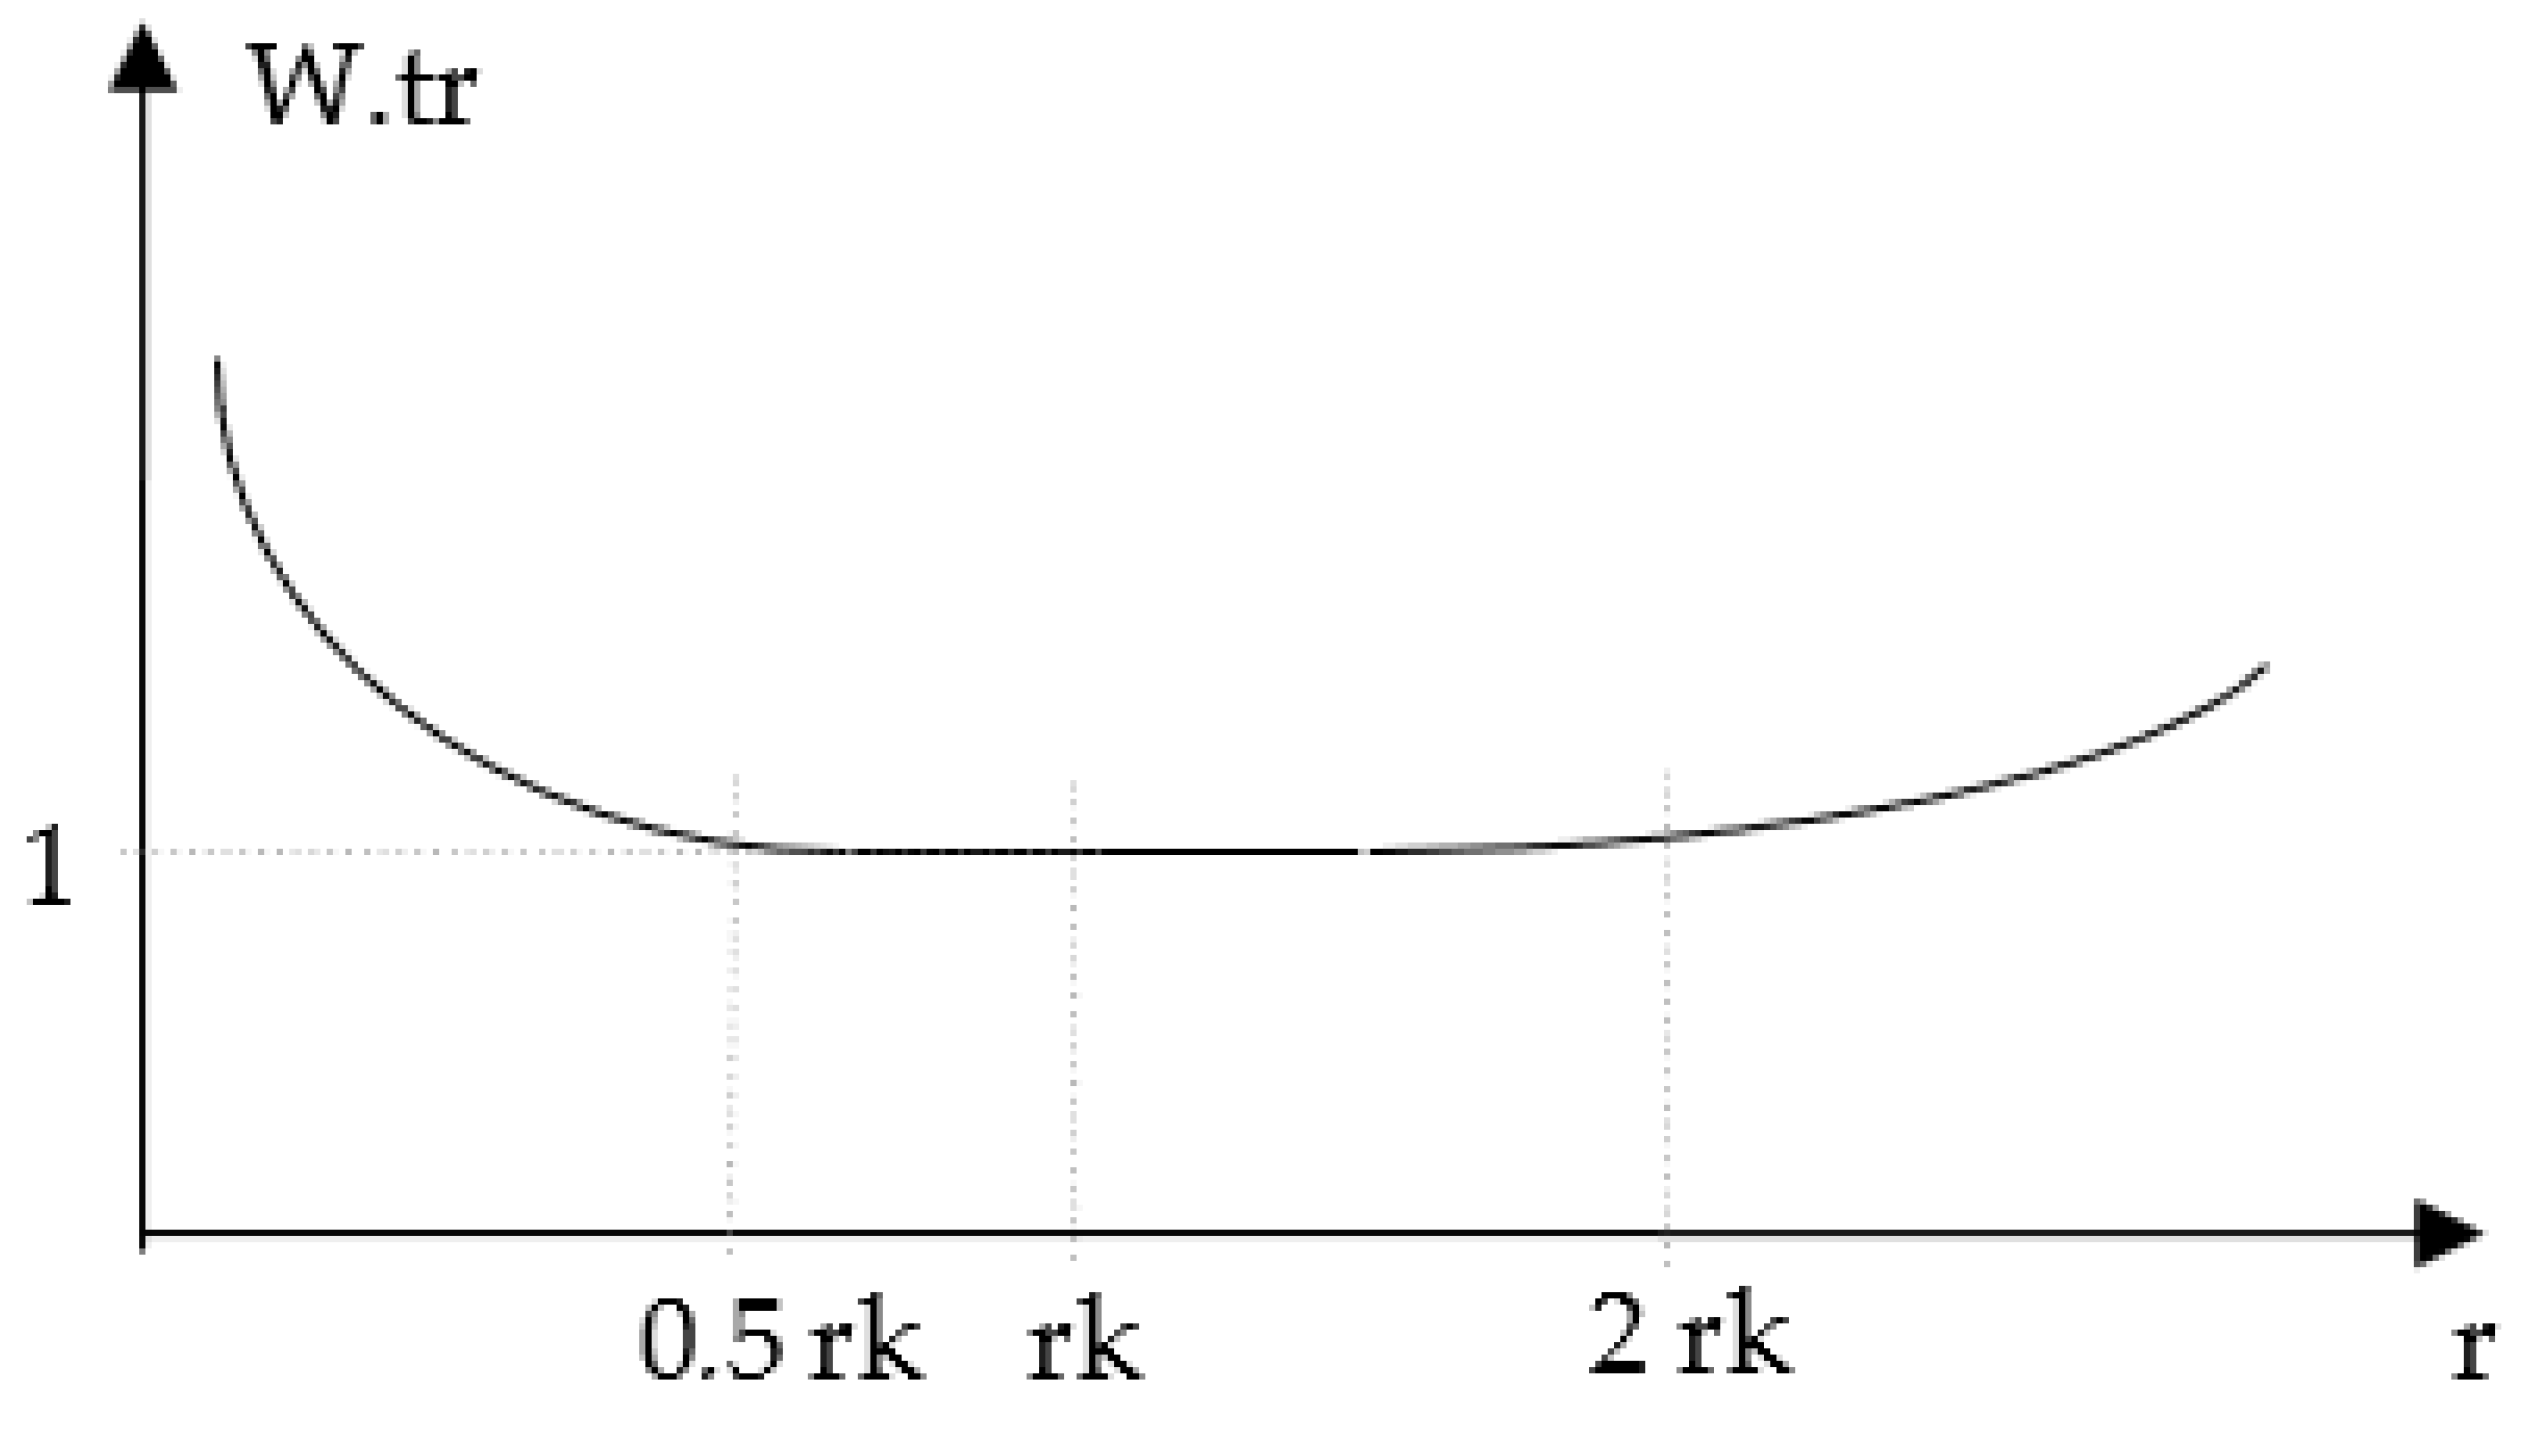
Second, turning the radius deviating from the radius of the ski, assuming that the turns are made on the edges with a cut trail. The easiest way to do this is to make a curve with a radius close to the design radius of the ski (difficulty level 1). The competitor can control the cut radius by changing the edge of the ski and its longitudinal curve. It is more challenging to cross curves with a small radius in this way (below 0.5 of the construction radius of the skier-rk) and longer ones over two rk (the difficulty of long curves is less than the short ones, but more remarkable than the optimal ones); see
Figure 2.
Third are sudden changes in rhythm, which represents the frequency coefficient calculated as the quotient of the average standard deviation of the frequency determined for individual sections of the slalom, and the average frequency of the entire slalom run obtained for the first 15 competitors Equation (1):
where W.zc-coefficient of variation of the turning frequency,
f.S-mean, standard deviation of the turning frequency,
f.śr-average turning frequency.
Fourth, high velocity makes it difficult to pass, mainly due to the increased overload on curves and unevenness of the route and shortening the travel time between poles, which means less time for assessing the situation and making decisions. Many of the missings of the gates were the result of a late turn. At high speeds, the role of psychological factors also increases, such as fear of injury. Therefore, passing slowly over a given set of gates is more accessible. The optimal speed was assumed as the level of difficulty 1 for the average velocity obtained in individual competitions (for the top ten) (
Figure 3).
Fifth is small distances between subsequent turns (short time for changing the edge).
Sixth, overloads on the run are a value proportional to the weight of the competitor and the square of the speed and inversely proportional to the turning radius r. Difficulty level 1 is the overload occurring when passing a curve with an average radius at medium speed (values characteristic for a given competition), as per
Figure 4.
Based on the above observations, a formula for W.tr
i can be proposed as the difficulty factor for setting gates in slalom and downhill, taking into account the factors described Equation (2):
where f are the coefficients: f.ok-direction deviations, f.r-turning radius, f.f-frequencies, f.v-velocity, f.s-segment length, f.a-overloads
Further planned studies will determine the importance of individual factors. Formulas for individual factors (markings as before, average values for a given competition):
W.tr is the arithmetic mean of the difficulty of individual turns on the course Equation (9). By comparing W.tr between courses, you can determine the average difficulty setting for the entire course. However, there is often one difficult part, the so-called “Traps”, for which the mean value and standard deviation W.tr will not show. Therefore, the value of W.tr max will also be shown hereafter, calculated as the average of the five most challenging turns. Since there is no previous research on slalom gate setting, it is impossible to determine the difficulty on a scale: easy, complex, and challenging. Therefore, we can only compare the gate settings and see which is more complicated. With more data in the future, it is possible to establish severity limit values at which accidents may occur.
The calculated indices were subjected to standard descriptive analysis, with means, medians, and SDs determined. Before the main analyses, data distribution was checked for normality using the Shapiro–Wilk test. We tested for mean differences (on all variables) between the courses using analysis of variance for independent groups.
4. Discussion
The results of this research correspond to the general feelings of competitors and coaches (based on subjective interviews), according to which the downhill is the most difficult run and the slalom is the easiest. Even to professional coaches, it is still unclear why and where skiers lose or win the race. Major mistakes by skiers such as “bad timing” or “low track” are easily identifiable, but what makes a poor performance is much more difficult to pinpoint. When looking for problematic sections of the route, it helps to evaluate the individual factors affecting the calculated W.tr difficulty factor; see
Table 2.
By analyzing the individual components of the difficulty index W.tr in individual competitions, several irregularities emerged. In the downhill run, the component f.ok deviations in direction had the most significant values, averaging 1.96 with a maximum value of 4.35. In the super giant, f.ok had the second largest average value (1.27) and highest maximum value (3.88). Technical competitions had significantly lower values of f.ok; for slalom, the average was 0.78 with a max of 1.60. It follows that in speed competitions, the biggest problem is to overcome a turn with a significant deviation from the axis of the route at high speed. It is not so difficult in slalom, where the speeds are much slower and turns with a large yaw angle are natural.
In the super giant, the largest component is f.a overload (f.a = 1.32). In SG, runs are carried out at speeds close to the speeds achieved in the downhill run. Additionally, gate systems have shorter sections and greater deviation angles than in the downhill, which results in negotiating curves with a small radius at high speed. As a result, overloads are the highest in speed competitions (SG, DH). There are no such overloads in slalom, which is less of a problem (f.a for slalom is 0.92). In giant slalom, despite the low average f.a = 1, f.a max is the largest of all the events (2.75). This proves that the entire route is relatively easy, with complicated settings of gates. Giovanis [
6] estimated the forces acting on the skier based on a given speed and turning radius (centrifugal force). In
Table 3, the values of the load factor according to the Giovanis method, calculated from data obtained herein, are presented. This confirms that the greatest loads experienced by competitors occurred in the DH event.
In giant slalom and slalom, the most difficulty emerged based on section distance with f.s scores of 1.74 and 1.06, respectively, with the maximum value for GS as high as 4.87 (which is the highest factor in all disciplines). Short distances make it necessary to complete the bends with a smaller radius and reduce travel time between gates. In speed competitions, short sections of bends occur sporadically and, in principle, cannot be too tricky for safety reasons (high speeds); see
Figure 5.
Our first idea was to find a universal formula for all disciplines so that they could be compared with each other and therefore we decided not to exclude any data. However, it is possible that a more appropriate approach would be separate calculations for individual disciplines due to their specificity. Further research should clarify this. The correlations between the parameters were different in different occupations. For example, the correlation of speed and frequency was high if the distances between the gates were equal, as in technical disciplines, and low if distances were unequal, as in speed disciplines.
It has been shown that parameters such as the magnitude of reaction forces, turning radius, speed, and acceleration are insufficient to determine the quality of the run [
7]. Reaching a high speed on a given section does not always mean a correct run; the competitor may be following the wrong trajectory or, in a moment, will be forced to brake excessively due to the too-high initial speed. To evaluate the quality of the turn, Supej [
8] relied on the mechanical principles of energy conversion. The main driving force in alpine skiing is potential energy; the skier’s contribution (muscle strength) to the total kinetic energy (speed) is very small or even negligible [
9]. Some researchers propose a mechanical model that considers the effect of muscle work on speed but under special conditions at low speeds [
10]. Supej [
11] uses the energy distribution during a turn to quantitatively compare different runs. The dissipation of mechanical energy is mainly due to air and snow drag. The efficient use of potential energy reflects the technique and skill of the skier to minimize drag and thus maintain a higher speed. During a smooth turning, the energy dissipation is small, while when the energy losses are high, it is characteristic of an imprecise technique (e.g., side skid).
Based on the results obtained, the level of skiers can also be assessed. No significant correlation coefficient was found when comparing the coefficient of W.tr of single turns with speed obtained by individual competitors on a given curve. A problematic section can be both with a slower and a faster run. On the other hand, a significant correlation was found between W.tr and the size of the standard velocity deviation on a given arc. This proves the difficulties of weaker competitors in maintaining the speed close to the average group. The weaker the competitors (with a lower average speed), the greater the speed deviations on the problematic section, i.e., they had technical problems maintaining a smooth and fast ride.
The component f.r (turning radius) is most significant in GS, where there are combinations of turns with a small and medium radius that differ from the GS ski’s design radius. This makes it difficult to make cut turns. The smallest values of f.r are in speed competitions, where the construction radius of the ski is so large that the turns occurring are within its range. Turning radii [m] in different disciplines (medians) are as follows SL: 14.8 m, GS: 28.2 m, SG:75.2 m, DH:127.8 m.
The minimum ski radius values allowed by the FIS regulations in individual competitions for seniors have been adopted: SL-11 m (no minimum value in the regulations, the value was based on the average value of skis used by competitors), GS-27 m, SG-35 m, DH-40 m. The design radius of the ski determines the theoretical radius of the cut turn (on the edges) at the edge of the ski on flat hard ground at an angle of 45°. By increasing the edge of the ski and longitudinal bend, it is possible to reduce the radius of the cut turn (up to about 50%—own observation, no data on this subject in the available literature). The lengthening of the turn above the value of the two design radii is achieved by tempering the edges and guiding the skis on sliding rather than the cut track. We assume that a cut turn is more advantageous in a sports competition.
Specifying the turning radius and turn angle alone (
Figure 6) will not describe the difficulty of the turn, as a lot depends on the speed of the run.
In the available literature, it is difficult to find research of the entire track during the competition, as in this work. Erdmann and Giovanis [
12] studied the entire run, but the control group were not the world’s top competitors but the best Greek skiers. The length of the giant slalom was about 40% shorter than in the World Cup, and the speeds achieved were 20% lower. Erdmann attempted to present the relationship between the route’s kinematic parameters and the competitors’ average speed [
5]. The findings were similar to our observations on the impact of small radius turns on speed loss.
The tactic of the run is closely related to technical skills and the level of physical preparation. Bandalo [
13] examined 30 Slovenian athletes competing in the World Cup. He used the expert method to assess the sports level and tactics of the ride. He found statistically significant relationships between sports performance and the factors of somatic structure and motor abilities. In our paper, we pay attention to the aspect of overloads that can affect the difficulty of the course. A large sum of overloads with a poor condition of the competitor may cause deterioration of his run. So, we can make an assumption that the more turns with heavy overload, the more difficult the route.
Supej [
11,
14] examines the influence of changing route conditions on run parameters. During the repeated use of subsequent riders, the route deteriorates, especially in technical events. Using 3D kinematic analysis, he compared the performance of 5 top skiers on the same slalom stretch under different conditions. He did not observe a significant change in speed, but there was a significant change in the trajectory and different positions of the starting and finishing points of the turn. Changes in route conditions are essential in technical competitions, while speed competitions do not significantly impact speed [
15]. We did not have the opportunity to examine the parameters of the run in starting conditions with such accuracy, but such data can be used to verify our assumptions.
Supej [
16] notes that an essential issue in the analysis of the slalom route is the determination of the mechanical parameters of the right turn. Based on a 3D kinematic analysis of 16 top skiers filmed during the run during the World Cup competition notes that the shortest route with a short turning radius is not the most effective passing strategy, as many coaches have so far believed. He proves it additionally by analyzing the distribution of mechanical energy during the turn. We believe that it is possible to calculate the perfect run on a given setting of gates, just based on mechanical parameters.
The most frequently discussed issue among coaches is the choice of the optimal trajectory during a turn [
17]. This element should also be possible to theoretically determine on the basis of calculations, which we will strive for in the next research study. It will be necessary to significantly increase the accuracy of determining the trajectory of the run.
In modern sports at the highest level, success must be supported by research on the broadest possible level of various scientific fields, taking into account, among other things, psychology, physiology, biomechanics, and sociology. Therefore, these tests should be included in the training planning process.


