Article

Application of Thermochemical Method to Determine the Crystallinity Degree of Cellulose Materials

by
Michael Ioelovich
Designer Energy, Rehovot 7670504, Israel
Appl. Sci. 2023, 13(4), 2387; https://doi.org/10.3390/app13042387
Submission received: 11 January 2023 / Revised: 9 February 2023 / Accepted: 10 February 2023 / Published: 13 February 2023
(This article belongs to the Special Issue Advanced Polymers Synthesis, Analysis and Applications)

Abstract

:
Currently, to characterize the crystallinity of cellulose, such an estimated parameter as the crystallinity index is used, measured by various methods and techniques. The main purpose of this article was to develop a thermochemical method for determining the real degree of crystallinity (X) of cellulose based on the measurement of the enthalpy of wetting. Various cellulose samples, such as MCC, pure cotton cellulose, bleached wood pulps, mercerized celluloses, and viscose rayon fibers, were used. For these samples, the exothermic wetting enthalpy (ΔHw), the maximum amount of sorbed moisture (Ao), as well as the X-ray index of crystallinity (CrI) were studied. The dependence of ΔHw on Ao was linear and can be expressed by the equation: ΔHw = k Ao, where the coefficient k = 336 (J/g). After substituting the theoretical value Ao,a = 0.5 (g/g) into this equation, the numerical value of maximum wetting enthalpy ΔHw,a = 168 (J/g) for completely amorphous cellulose was obtained. As a result, the equation for calculating the real crystallinity degree (X) expressed in mass fractions was derived: X = 1 (ΔHw/ΔHw,a). Analysis of the obtained results showed that only the X parameter can characterize the real content of crystallites in cellulose samples, instead of the approximate CrI parameter.

1. Introduction

Being a linear stereoregular semicrystalline polysaccharide, cellulose is the most abundant natural organic matter on Earth [1]. This biopolymer is present in all terrestrial plants, algae, and tunicates; furthermore, it is also synthesized by some microorganisms [2,3]. To isolate chemically pure cellulose from natural sources, two main industrial pulping methods are applied, such as sulfite and kraft processes accompanied by multi-stage bleaching [4,5]. Several pilot and laboratory pulping methods also exist, e.g., soda, oxidative, Organosolv, etc. [6,7]. The resulting matter isolated from natural biomasses is cellulose, a semicrystalline biopolymer having crystalline allomorph CI (α and β). The crystallinity of isolated cellulose depends on the used natural source and the isolation conditions [8]. In addition, the physicomechanical treatments (e.g., ball-grinding [9]), physicochemical modifications (e.g., treatment with liquid ammonia, primary amines, and diamines, some solvents, and concentrated solutions of alkalis [8,10,11,12]), and chemical modifications (e.g., hydrolysis with boiling dilute mineral acids [3,8]) of natural cellulose lead to a significant change in the crystallinity.
In the subsequent structural analysis of cellulose samples, a problem arises due to the lack of an accurate method for determining such an important characteristic as the degree of crystallinity. In fact, there are only approximate indices of cellulose crystallinity, which can be estimated by various methods, such as wide-angle X-ray scattering (WAXS), solid-state 13C NMR, FTIR, Raman spectroscopy, as well as by physicochemical (e.g., sorption iodine), chemical (e.g., hydrolysis with boiling 2.5 M HCl) methods, etc. [3,13,14,15,16,17,18]. However, different methods give different values of the crystallinity index (CrI) for the same cellulose sample; therefore, it is not clear which value of CrI should be preferred.
Even applying the same method, e.g., WAXS, also gave different CrI values for the same sample if different measurement techniques were used to separate X-ray scattering from the crystalline and amorphous domains. So, the study of microcrystalline cellulose Avicel PH-101 showed that the measuring of peak heights gave CrI 0.80–0.93, deconvolution of the peaks gave CrI 0.55–0.61, subtraction of amorphous scattering gave CrI 0.60–0.78, Ruland’s technique gave CrI 0.55–0.61, the technique of Jayme–Knolle gave CrI about 0.69, and the technique of Hermans–Weidinger gave CrI ranging from 0.63 to 0.82 [13,14,15]. Moreover, if one technique of the same method for the same sample (e.g., Avicel PH-101) is used, then the CrI value obtained by different researchers turns out to be poorly reproducible [13].
There are several main reasons for the large discrepancies in the values of the crystallinity indices when they are evaluated by different methods or by different measurement techniques of the same method. Firstly, it is due to the application of different calculating equations, mathematical functions, and software to calculate CrI. Secondly, it is due to the different experimental conditions of different methods. Thirdly, it is due to the use of inadequate structural models to evaluate the crystallinity of real cellulose samples. In addition, there are no standard protocols for preparing cellulose samples for the determination of their crystallinity. In particular, the value of the X-ray crystallinity index is affected by the type of crystalline allomorph, the size of crystallites, the distortions, and the texture of the sample [15]. Thus, it is not possible to conclude which of the currently used methods and/or measurement techniques of cellulose crystallinity is the most appropriate.
Therefore, it is advisable to develop a new method operating on other principles, namely the thermochemical method based on the measurement of the wetting enthalpy of various cellulose samples. Unlike the methods discussed above, this thermochemical method is direct, simple, fast, reliable, and reproducible; furthermore, it does not require the use of special models, complex software, and calculations. Several terms are used to express the exothermic effect of the interaction between cellulose and water. This effect is called the “heat” or “enthalpy” of “wetting” or “swelling”. In this article, the thermochemical term “enthalpy of wetting” (or “wetting enthalpy”) will be used.
The history of the study of the enthalpy of wetting covers more than 90 years. In the early investigations, it was found that the presence of residual moisture in cellulose significantly reduced the exothermic effect of wetting [19]. It was also discovered that the increase in water temperature from 0 to 40 °C reduced the relative value of wetting enthalpy by 14% for the same cellulose sample [20].
More recent studies have shown that the wetting enthalpy of dry and pure samples depends on the structural state of cellulose, in particular, on the ratio between accessible amorphous and inaccessible crystalline domains. For example, it was found that the enthalpy of wetting for cotton fibers is almost twice lower than for viscose fibers, which was explained by the lesser crystallinity of the latter [21].
Estimating the content of accessible amorphous domains in cellulose by the amount of water sorbed in them, a linear correlation between moisture content in cellulose and wetting enthalpy was obtained [22,23]. In addition, a directly proportional relationship was found between the index of non-crystallinity estimated by the WAXS method and the wetting enthalpy for various cellulose samples, both natural and regenerated fibers [23].
These publications show that there is a real opportunity to develop a thermochemical method for determining the degree of amorphicity or its inverse value, the degree of crystallinity of cellulose, which is the main purpose of this study.

2. Materials and Methods

2.1. Materials

The following cellulose samples were investigated:
Pure chemical-grade cotton cellulose (CC) of Hercules, Inc. (Wilmington, DE, USA).
Microcrystalline cellulose (MCC) prepared by treatment of CC with boiling 2.5 M HCl for 1 h at the acid-to-CC ratio of 20, followed by washing and drying.
Mercerized cotton cellulose (CCM) prepared by treatment of CC with 6 M NaOH for 1 h at room temperature and alkali-to-CC ratio of 20, followed by washing and drying.
Bleached Kraft pine chemical pulp (KP) of Weyerhaeuser, further refined by treatment with 2 M NaOH for 1 h at room temperature and alkali-to-pulp ratio of 20, followed by washing and drying.
Bleached high-pure sulfite spruce pulp (SP) of Weyerhaeuser Co. (Seattle, WA, USA).
Mercerized sulfite pulp (SPM) prepared by treatment of SP with 6 M NaOH for 1 h at room temperature and alkali-to-pulp ratio of 20, followed by washing and drying.
Viscose rayon fibers (VF) of Rayonier, Inc. (Wildlight, FL, USA).
Some characteristics of the used samples are shown in Table 1.

2.2. Methods

2.2.1. Characterization
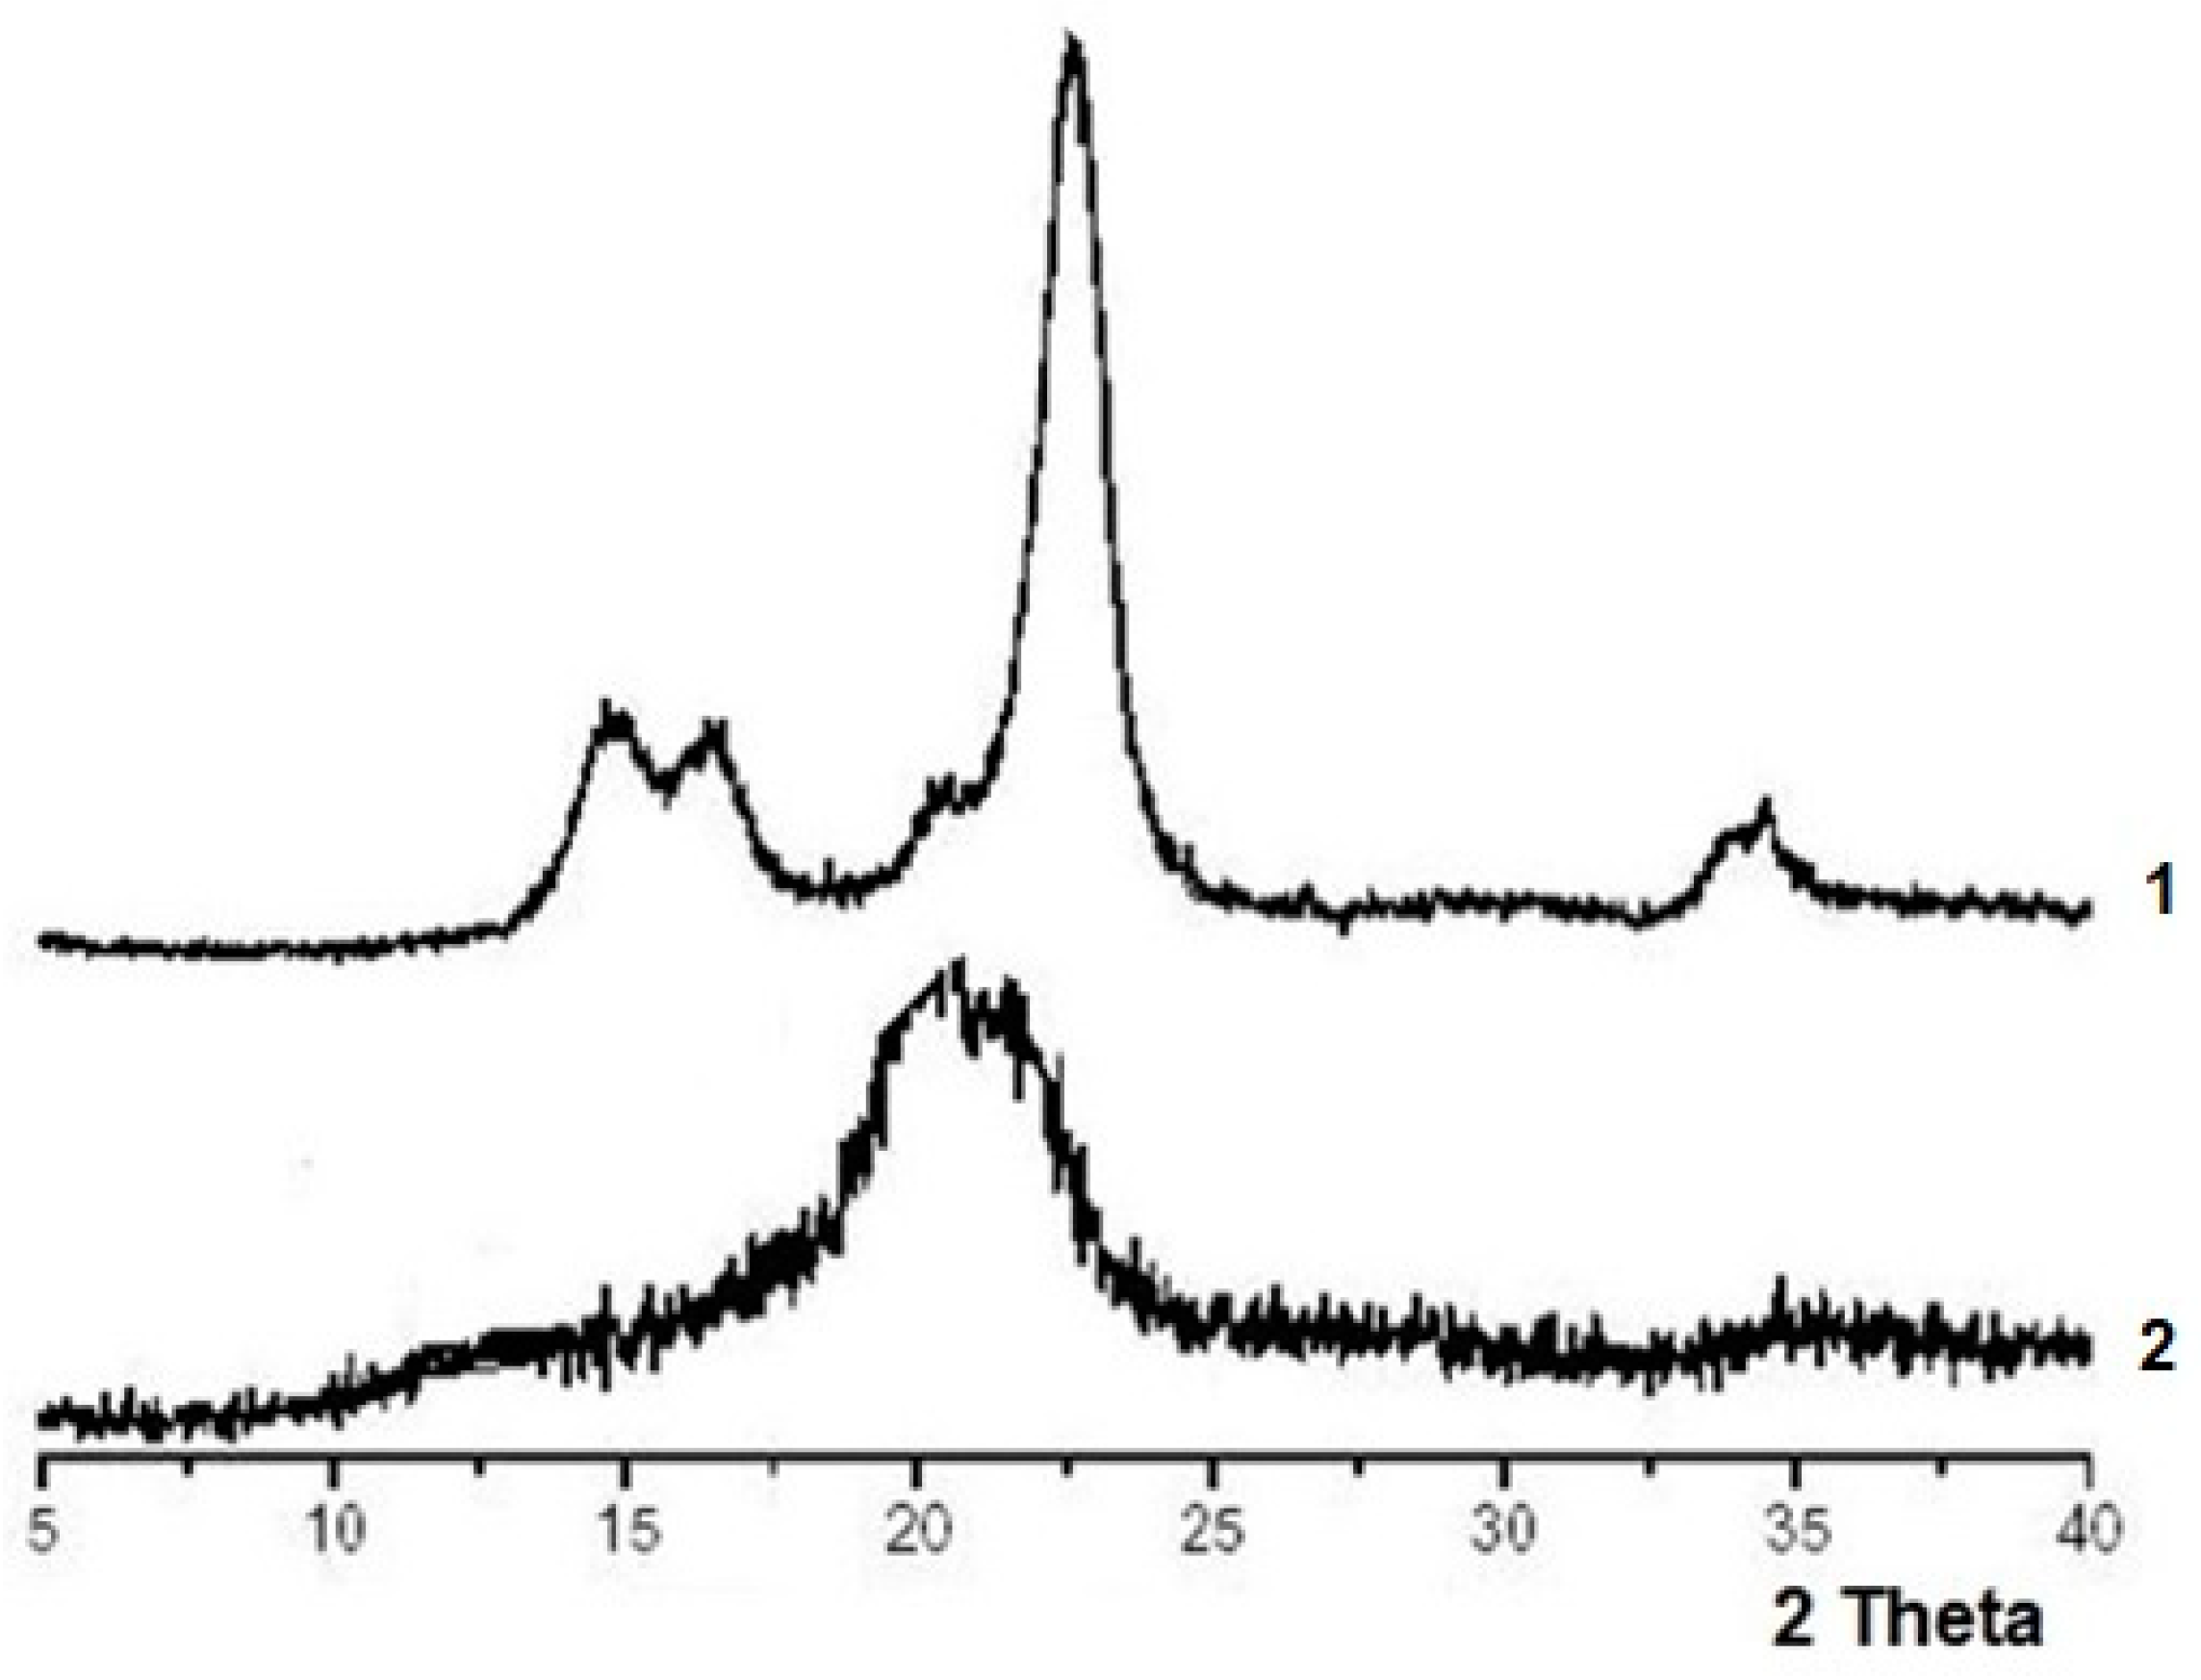
The content of α-cellulose was tested according to the standard TAPPI method T-203 [24]. The average degree of polymerization (DP) was calculated from the viscosity of diluted cellulose solutions in Cuen [25]. The CrI of the samples was estimated using the peak heights measurement technique of WAXS [13,14,26]. Moreover, for some samples (e.g., CC and VF), such characteristics as specific volume, specific gravity, sorption of water vapor and alkali, accessibility for deuterium, and hydrolyzability were also measured according to methods described in the references [2,3,8,27,28].

2.2.2. WAXS

In the WAXS method, the experiments were carried out on a Rigaku-Ultima Plus diffractometer (CuKα—radiation, λ = 0.15418 nm) in the 2Θ-angle range from 5 to 50° using a reflection mode. Collimation included a system consisting of vertical slits and Soller slits. The procedure of 0.02° step-by-step scanning was used to determine the exact position of the peaks. The tested specimens in the shape of tablets with a diameter of 16 mm and a thickness of 2 mm were prepared by pressing crushed cellulose samples in a mold at a pressure of 50 MPa. To estimate the CrI, the peak heights measurement technique was used. The calculation was made according to the equation [26]:
CrI = 1 − (Imin/Imax)
where Imin is the minimum intensity of X-ray diffraction at 2Θ = 18° for samples of cellulose I and at 2Θ = 15° for samples of cellulose II, while Imax is the maximum intensity of the (200) peak at 2Θ = 22–23° for samples of cellulose I and of the (110) peak at 2Θ = 20–21° for samples of cellulose II.
Three diffractograms were recorded for each cellulose sample to calculate the average CrI value and its standard deviation. The obtained results are shown in Table 1.

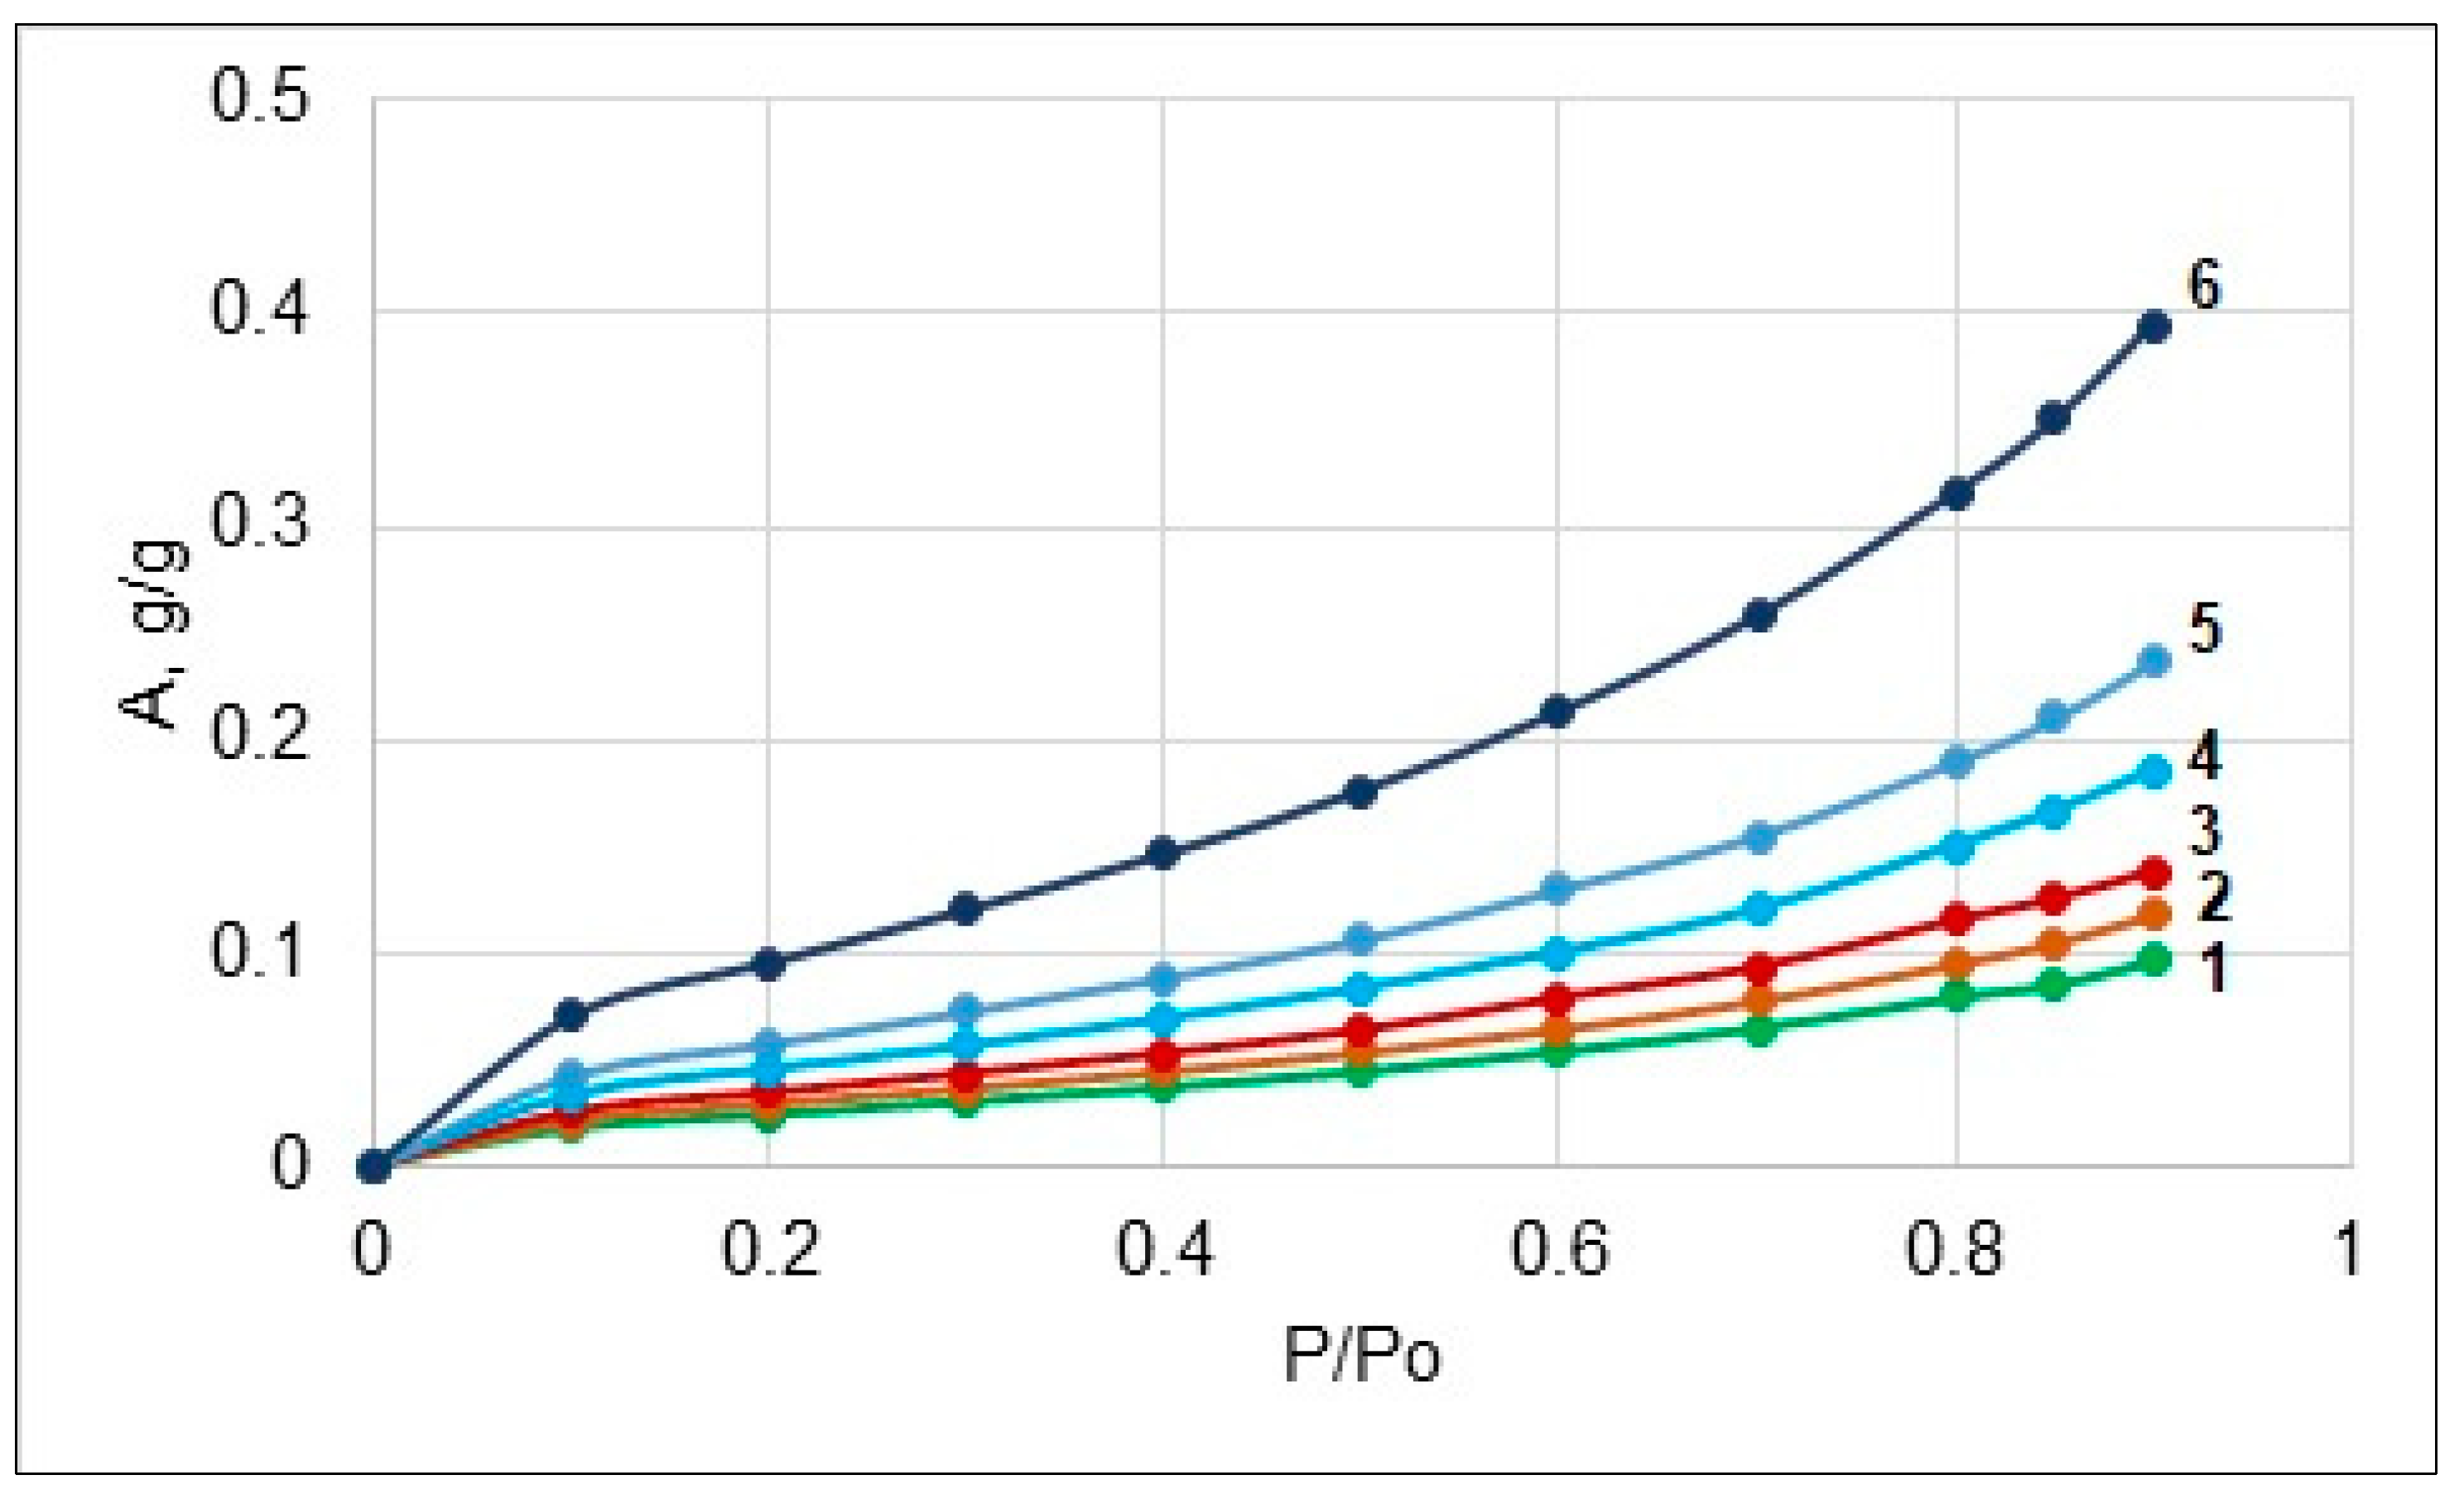
2.2.3. Sorption of Water Vapor

The sorption experiments were carried out at 298 K in a vacuum Mac-Ben apparatus having helical spring quartz scales (accuracy ±0.5 mg). Sorption isotherms were obtained in the range of relative pressure of water vapor from 0 to 0.9. Prior to starting the experiments, the samples were dried at 378 K in a vacuum chamber up to constant weight and additionally dried and degassed in the sorption device. Three of the same samples were tested to calculate an average sorption value and standard deviation.

2.2.4. Enthalpy of Wetting

The enthalpy of cellulose wetting with water (ΔHw) was studied at 298 K using a TAM Precision Solution Calorimeter [29]. Small cellulose samples were used in the form of pieces, fibers, or powders. Prior to starting the experiments, the air-dry sample was weighed into a special glass ampoule and dried in a vacuum at 378 K to a constant weight. The glass ampoule containing the dry sample was sealed and introduced into the calorimetric cell filled with distilled water. The calorimeter was thermostated at 298 K to achieve an equilibrium state. Thereafter, the sealed ampoule with the dry sample was broken to ensure that the cellulose sample was wetted with water. The released exothermic heat effect was measured with accuracy ±0.01 J. Three of the same sample were tested to calculate an average enthalpy value and standard deviation.

3. Results

The X-ray diffraction pattern of the cotton cellulose (CC) was typical of natural cellulose containing a crystalline allomorph of CI with characteristic peaks at 2Θ angles of 14.9, 16.5, 22.7, and 34.7° due to X-ray diffraction from planes of the CI-crystalline lattice with Miller indices of (1 1 ¯ 0), (110), (200), and (004), respectively [30] (Figure 1, X-pattern 1).
The diffraction patterns of the isolated and bleached wood pulps (KP and SP) were similar to those of cotton cellulose, with the difference that the intensity of the peaks was slightly less and their width was somewhat larger. As a result, the samples of wood pulps showed a lesser CrI value than CC (Table 1). On the other hand, acid hydrolysis of cotton cellulose to obtain MCC led to an enhancement in the intensity of the CI peaks and an increase in CrI value due to the partial removal of the amorphous fraction from the original CC during hydrolysis (Figure 2, X-ray pattern 1).
After the mercerization of cotton cellulose or sulfite pulp, the diffraction pattern of CI allomorph turned into a diffraction pattern characteristic of CII allomorph, which contains peaks at 2Θ angles of 12.4, 20.5, 22.0, and also 34.6° [31] (Figure 1, X-pattern 2). In addition, the intensity of these peaks was lower than the peaks of the original CI samples, which is caused by partial decrystallization during mercerization. The least structurally ordered was a sample of viscose rayon fibers, the CII diffraction pattern of which had low intensive and broad peaks (Figure 2, X-ray pattern 2).
Thus, the comparative analysis showed that the MCC sample was the most crystalline and the VF sample was the most amorphous. However, this comparative assessment is not enough to judge the true crystallinity degree of cellulose samples. For this purpose, special studies were carried out, described below.
As is known from chemical thermodynamics, liquid water and equilibrium saturated water vapor have the same chemical potential. This means that such an absorbent as cellulose will absorb the same equilibrium amount of water from the liquid phase as from the saturated vapor phase, having relative vapor pressure P/Po = 1. It is also known that cellulose crystallites are inaccessible to water molecules and their absorption occurs only by amorphous domains of this biopolymer [21,22,23].
Moreover, the interaction of cellulose with liquid water is accompanied by an exothermic thermal effect, such as wetting enthalpy [15,21,22,23]. Thus, the lower the crystallinity degree (X) and the higher the amorphicity degree (Y = 1 X), the greater will be the absorption value (Ao) of saturated water vapor and the higher will be the exothermic wetting enthalpy (ΔHw) of the cellulose sample. This provides a linear correlation, ΔHw = k Ao, from which one can find also the maximum wetting enthalpy value (ΔHw,a) for completely amorphous cellulose. Then, the crystallinity degree (X) expressed in mass fractions for various cellulose samples can be calculated by the equation:
X = 1 − (ΔHw/ΔHw,a)
To implement such an algorithm, it was necessary to determine the Ao value for various cellulose samples. For this purpose, sorption isotherms of water vapor (WV) were studied in a wide range of relative vapor pressures, P/Po. It was found that these isotherms for various cellulose materials have a sigmoid shape and belong to type II (see, e.g., Figure 3). Isotherms of this type have an initial steep stage, after which a gradual and then accelerated increase in sorption is observed, and, finally, at high relative vapor pressures, a sharp rise in the sorption of WV occurs.
Along with the experimental isotherms, Figure 3 shows also the theoretical isotherm 6 for completely amorphous cellulose (AC), calculated by the method of the additive contributions of hydroxyl groups of amorphous polymers to the sorption of water molecules proposed by Van Krevelen [32].
Despite the complex sigmoid shape, such isotherms can be presented in a linear form (Figure 4), using the following equation [33]:
A−1 = Ao−1 − K·ln (P/Po)
Extrapolation of the linear plot A = F{( ln(P/Po)} to ln (P/Po) = 0 gives the value of Ao−1, from which the maximum amount of water, Ao, absorbed by a sample from saturated water vapor at 298 K, can be found (Table 2).
Thermochemical experiments showed that the wetting enthalpy of studied cellulose samples ranged from 42.2 to 104.2 J/g (Table 2). Moreover, the absolute value of wetting enthalpy is directly proportional to the maximum value of moisture absorption (Figure 5).
The obtained results are consistent with the literature data. For example, for cotton cellulose, Ao was in the range of 0.14–0.20 g/g and ΔHw in the range from 45 to 48 J/g, while, for viscose rayon fibers, Ao was in the range of 0.27–0.32 g/g and ΔHw in the range from 100 to 105 J/g [21,22,23].

4. Discussion

From Figure 5, it follows that the wetting enthalpy is a linear function of maximum absorption value:
ΔHw = k·Ao
where coefficient k = 336 J/g.
Then, using the maximum moisture absorption value, Ao,a = 0.5 (g/g), found for completely amorphous cellulose (Table 2), one can calculate the numerical value of the maximum wetting enthalpy, ΔHw,a, for such an amorphous cellulose sample, as follows:
ΔHw,a = k·Ao,a = −336 × 0.5 = − 168 (J/g)
It should be noted that the direct experimental determination of the numerical value of ΔHw,a is impossible due to the crystallization of amorphous cellulose during contact with water [34,35], which distorts the true value of the maximum wetting enthalpy.
Substituting the obtained ΔHw,a value (−168 J/g) into Equation (2), one can calculate the thermochemical degree of crystallinity (X) for any cellulose sample (Table 3). In addition, the degree of cellulose amorphicity (Y) can be also calculated, as follows:
Y = 1 − X = ΔH/ΔHw,a
Using the literature data on the wetting enthalpy of CC and VF samples [21,22,23], it can be calculated by Equation (2) that the X value of these samples is 0.72 ± 0.01 and 0.39 ± 0.01, respectively. These independent studies confirm the X values of the cellulose samples obtained in this research, which indicates the reliability and reproducibility of the thermochemical method.
As can be seen from the results, the thermochemical method provides the determination of the crystallinity degree of cellulose with a standard deviation (SD) of no more than ±0.01. In contrast to the thermochemical method, the existing methods used currently for assessing the cellulose crystallinity by CrI, such as WAXS, solid-state 13C NMR, FTIR, Raman spectroscopy, etc., have 3 to 10 times greater SD values. In addition, the CrI value is poorly reproducible.
A comparison of the determined X values with the CrI values for various cellulose samples showed that the relative deviation (RD) of the CrI value from the real X value is large, from 15% for CC to 42% for VF (Table 3). Ternite and coauthors found [14] that values of CrI for cotton cellulose obtained by means of different measurement techniques of WAXS can vary in the wide range; using these data, it can be calculated that the average relative deviation of CrI from the real degree of crystallinity is 15%. Such large discrepancies indicate that such a parameter as the crystallinity index estimated by different methods and techniques, as a rule, cannot characterize the real content of crystallites in cellulose samples. In some cases, CrI measured by the same method and technique can be used only for a comparative assessment of the crystallinity of cellulose samples.
On the other hand, the obtained degree of crystallinity or amorphicity describes the real supramolecular structure and provides a prediction of various important characteristics of cellulose samples. It is known that many physical, physicochemical, and chemical properties of crystalline and amorphous cellulose differ significantly [2,3,27,36]. For example, the specific volume of amorphous cellulose is higher and the specific gravity is lower than that of crystalline cellulose. The sorption capacity of amorphous cellulose for vapors, molecules, and ions of various substances is relatively high, while that of crystalline cellulose is low and may even be zero. In addition, amorphous cellulose is highly reactive, while the theoretical reactivity of crystalline cellulose should be low. In practice, various cellulose samples are semi-crystalline polymers, so their properties (Z) depend on the degree of crystallinity (X), as follows:
Z = X·Zc + (1 − X) Za = Za − X (Za − Zc)
where Zc and Za are the properties of completely crystalline (X = 1) and completely amorphous (X = 0) cellulose, respectively (Table 4).
Using Equation (7), it is possible to calculate various properties of cellulose materials, such as specific volume, specific gravity, amount of sorbed moisture from the vapor phase, amount of sorbed alkalis from aqueous solutions, accessibility for deuterium, the acidic hydrolysability, as well as amount of sorbed iodine and dyes from aqueous solutions, enzymatic digestibility, coefficient of thermal expansion, specific heat capacity, etc. [2,3,8]. To illustrate the possibility to predict some properties of cellulose materials, two samples, namely cotton cellulose (CC) and viscose rayon fibers (VF) having a high (X = 0.72) and low (X = 0.38) degree of crystallinity, respectively, were chosen. The properties of these samples were calculated (Calc) by Equation (7), after which they were compared with the experimentally obtained properties (Exp).
As can be seen from Table 5, the calculations are in good agreement with the experimental data, which confirms the possibility of predicting the various characteristics of cellulose materials using such a parameter as real crystallinity degree.
It can be noted that the thermochemical method for determining the crystallinity degree of cellulose samples is direct, simple, fast, precise, reliable, and reproducible. To measure the wetting enthalpy, any type of precise calorimeter produced by high-tech companies can be applied, such as adiabatic, isothermal, microcalorimeter, etc. Furthermore, it does not require the use of special models, complex software, and calculations. In this method, there are no special requirements for the shape and size of the samples. They do not need to be pressed or crushed. It is possible to use cellulose samples with different morphology and type of crystalline allomorph (CI, CII, CIII, or CIV) in the form of pieces, fibers, or powders.
There are only two main conditions to prepare cellulose samples for testing, namely, they must be chemically pure and completely dry. For the removal of moisture from samples, a conventional vacuum drying at 378 K to constant weight can be used.

5. Conclusions

In this study, a thermochemical method for determining the real degree of crystallinity (X) of various cellulose samples based on the measurement of their wetting enthalpy (ΔHw) was proposed. For this purpose, the equation for calculating the X value was derived, as follows: X = 1 (ΔHw/ΔHw,a), where ΔHw,a = 168 (J/g) is wetting enthalpy of completely amorphous cellulose. It was found that the sample of viscose rayon fibers has a minimum X = 0.38, while the MCC sample has a maximum X = 0.75.
A comparison of the determined degree of crystallinity (X) with the crystallinity index for (CrI) various cellulose samples showed that the relative deviation of CrI from the real X ranges from 15 to 42%. Such large discrepancies indicate that such an approximate parameter as the CrI cannot characterize the real content of crystallites in cellulose samples. On the other hand, the obtained degree of crystallinity or amorphicity describes the real supramolecular structure of cellulose and can be used for the prediction of important properties of cellulose samples, such as specific volume, specific gravity, amount of sorbed moisture from the vapor phase, amount of sorbed alkalis from aqueous solutions, accessibility for deuterium, acidic hydrolysability, etc.

Funding

This research received no external funding.

Institutional Review Board Statement

Not applicable.

Informed Consent Statement

Not applicable.

Data Availability Statement

Data can be obtained from the corresponding author upon reasonable request.

Conflicts of Interest

The author declares no conflict of interest.

References

  1. Klemm, D.; Heublein, B.; Fink, H.-P.; Bohn, A. Cellulose: Fascinating biopolymer and sustainable raw material. Angew. Chem. 2005, 44, 2–37. [Google Scholar] [CrossRef]
  2. Ioelovich, M. Cellulose: Nanostructured Natural Polymer; LAP: Saarbrücken, Germany, 2014; p. 88. [Google Scholar]
  3. Ioelovich, M. Models of supramolecular structure and properties of cellulose. Polymer Sci. Ser. A 2016, 58, 925–943. [Google Scholar] [CrossRef]
  4. Belgacem, M.N.; Pizzi, A. Lignocellulosic Fibers and Wood Handbook: Renewable Materials for Today’s Environment; Scrivener Publishing LLC: Beverly, MA, USA, 2016; 704p. [Google Scholar]
  5. Jardim, J.M.; Hart, P.W.; Lucia, L.A.; Jameel, H.; Chang, H.M. The effect of the Kraft pulping process, wood species, and pH on lignin recovery from black liquor. Fibers 2022, 10, 16. [Google Scholar] [CrossRef]
  6. Potůček, F.; Gurung, B.; Hájkov, K. Soda pulping of rapeseed straw. Cell. Chem. Technol. 2014, 48, 683–691. [Google Scholar]
  7. Wildschut, J.; Smit, A.T.; Reith, J.H.; Huijgen, W. EtOH-based organosolv fractionation of wheat straw for the production of lignin and enzymatically digestible cellulose. Bioresour. Technol. 2013, 135, 58–66. [Google Scholar] [CrossRef]
  8. Ioelovich, M. Cellulose: Structure and Properties Relationships. In Handbook of Sustainable Polymers: Structure and Chemistry; Thakur, V.K., Thakur, M.K., Eds.; Pan Stanford Publishing: Singapore, 2016; pp. 200–264. [Google Scholar]
  9. Maier, G.; Zipper, P.; Stubičar, M.; Schurz, J. Amorphization of different cellulose samples by ball milling. Cellul. Chem. Technol. 2005, 39, 167–177. [Google Scholar]
  10. Halonen, H.; Larsson, P.T.; Iversen, T. Mercerized cellulose biocomposites: A study of influence of mercerization on cellulose supramolecular structure, water retention value and tensile properties. Cellulose 2013, 20, 57–65. [Google Scholar] [CrossRef]
  11. Mittal, A.; Katahira, R.; Himmel, M.E.; Johnson, D.K. Effects of alkaline or liquid ammonia treatment on crystalline cellulose: Changes in crystalline structure and effects on enzymatic digestibility. Biotechnol. Biofuels 2011, 4, 41–57. [Google Scholar] [CrossRef]
  12. Duchemin, B.; Le Corre, D.; Leray, N.; Dufresne, A.; Staiger, M.P. All-cellulose composites based on microfibrillated cellulose and filter paper via a NaOH-Urea solvent system. Cellulose 2016, 23, 593–609. [Google Scholar] [CrossRef]
  13. Park, S.; Baker, J.O.; Himmel, M.E.; Parilla, P.A.; Johnson, D.K. Cellulose crystallinity index: Measurement techniques and their impact on interpreting cellulase performance. Biotechnol. Biofuels 2010, 3, 1–10. [Google Scholar] [CrossRef] [PubMed]
  14. Terinte, N.; Ibbett, R.; Schuster, K.C. Overview on native cellulose and microcrystalline cellulose I structure studied by X-ray diffraction (WAXD): Comparison between measurement techniques. Lenzing. Ber. 2011, 89, 118–131. [Google Scholar]
  15. Rongpipi, S.; Ye, D.; Gomez, E.D.; Gomez, E.W. Progress and opportunities in the characterization of cellulose—An important regulator of cell wall growth and mechanics. Front. Plant Sci. 2019, 9, 1–28. [Google Scholar] [CrossRef]
  16. Madhushani, W.H.; Priyadarshana, R.W.I.B.; Ranawana, S.R.W.; Senarathna, K.G.C.; Kaliyadasa, P.E. Determining the crystallinity index of cellulose in chemically and mechanically extracted banana fiber for the synthesis of nanocellulose. J. Nat. Fibers 2022, 19, 7973–7981. [Google Scholar] [CrossRef]
  17. Leong, S.L.; Tiong, S.I.X.; Siva, S.P.; Ahamed, F.; Chan, C.H.; Lee, C.L.; Chew, I.M.L.; Ho, Y.K. Morphological control of cellulose nanocrystals via sulfuric acid hydrolysis based on sustainability considerations: An overview of the governing factors and potential challenges. J. Environ. Chem. Eng 2022, 10, 1–20. [Google Scholar]
  18. Li, Y.Y.; Bai, Y.R.; Zhang, X.Q.; Liu, X.; Dai, Z.; Jiang, Y.L.; Yan, Y.B.; Liu, Z.Q.; Ma, M.G. Preparation, properties and mechanism of anionic and cationic cellulose nanocrystals/waterborne polyurethane composite films. Bioresources 2023, 18, 447–464. [Google Scholar] [CrossRef]
  19. Schmidt, L.D. The Heat of Wetting of Cellulose; University Press: Minneapolis, MN, USA, 1936; 57p. [Google Scholar]
  20. Wahba, M.; Nashed, S. Change with temperature of the heat of wetting of dry cellulose in water, and its bearing on the specific heat of the adsorbed water and of the swollen cellulose. Nature 1950, 166, 998–1000. [Google Scholar] [CrossRef]
  21. Varga, K.; Schädel, U.; Nilsson, H.; Persson, O.; Schuster, K. Measuring the heat of wetting of textile fibres by reaction calorimetry. Fibres Text. East. Eur. 2007, 15, 59–63. [Google Scholar]
  22. Prusov, A.N.; Prusova, S.M.; Radugin, M.V.; Zakharov, A.G. Interrelation between the crystallinity of polysaccharides and water absorption. J. Phys. Chemistry 2014, 88, 813–818. [Google Scholar] [CrossRef]
  23. Mizutani, C.; Tsuj, Y.; Bertoniere, N. Effect of fiber structure on heat of wetting of cotton and regenerated cellulosic fibers. Text. Res. J. 1999, 69, 559–564. [Google Scholar] [CrossRef]
  24. Standard TAPPI Method T-203; Alpha-, Beta- and Gamma-Cellulose in Pulp. TAPPI: Peachtree Corners, GA, USA, 2009.
  25. Hindi, S.S. Microcrystalline cellulose: The inexhaustible treasure for pharmaceutical industry. Nanosci. Nanotech. Res. 2017, 4, 17–24. [Google Scholar]
  26. Revol, J.F.; Dietrich, A.; Goring, D.A.I. Effect of mercerization on the crystallite size and crystallinity index in cellulose from different sources. Can. J. Chem. 1987, 65, 1724–1725. [Google Scholar] [CrossRef]
  27. Ioelovich, M.; Leykin, A.; Figovsky, O. Study of cellulose paracrystallinity. Bioresources 2010, 5, 1393–1407. [Google Scholar]
  28. Ioelovich, M.; Aripov, K. Comparative study of supramolecular structure of cellulose in cotton fibers of Gossypium hirsutum and Hossypium barbadense. Cell. Chem. Technol. 2020, 54, 635–641. [Google Scholar]
  29. Harjunen, P.; Lehto, V.P.; Koivisto, M.; Levonen, E.; Paronen, P.; Järvinen, K. Determination of amorphous content of lactose samples by solution calorimetry. Drug Dev. Ind. Pharm. 2004, 30, 809–815. [Google Scholar] [CrossRef] [PubMed]
  30. Simon, M.; Fulchiron, R.; Gouanvé, F. Water sorption and mechanical properties of cellulosic derivative fibers. Polymers 2022, 14, 2836. [Google Scholar] [CrossRef]
  31. Nam, S.; French, A.D.; Condon, B.D.; Concha, M. Segal crystallinity index revisited by the simulation of X-ray diffraction patterns of cotton cellulose Iβ and cellulose II. Carbohydr. Polym. 2016, 135, 1–9. [Google Scholar] [CrossRef]
  32. Van Krevelen, D.W.; Nijenhuis, K. Properties of Polymers: Correlations with Chemical Structure; Elsevier: Amsterdam, The Netherlands, 2009; 1004p. [Google Scholar]
  33. Ioelovich, M. Models of water vapor sorption by hydrophilic polymers. Adv. Res. Org. Inorg. Chem. 2022, 3, 1–5. [Google Scholar] [CrossRef] [PubMed]
  34. Bhama, I.P.; Sreenivasan, S.; Chidambareswaran, P.K.; Patil, N.B. Crystallization of amorphous cellulose. Text. Res. J. 1984, 54, 732–735. [Google Scholar] [CrossRef]
  35. Ago, M.; Endo, T.; Hirotsu, T. Crystalline transformation of native cellulose from cellulose I to cellulose II polymorph by a ball milling method with a specific amount of water. Cellulose 2004, 11, 163–167. [Google Scholar] [CrossRef]
  36. Krässig, H. Cellulose: Structure, Accessibility and Reactivity; Gordon and Breach Publishers: Amsterdam, The Netherlands, 1996; 376p. [Google Scholar]
Figure 1. X-ray patterns of original (1) and mercerized (2) CC.
Applsci 13 02387 g001
Figure 2. X-ray patterns of MCC (1) and VF (2).
Applsci 13 02387 g002
Figure 3. Sorption isotherms of water vapor (WV) for samples of MCC (1), CC (2), SP (3), SPM (4), VF (5), and AC (6).
Applsci 13 02387 g003
Figure 4. Linear form of sorption isotherms for samples of MCC (1), CC (2), SP (3), SPM (4), VF (5), and AC (6).
Applsci 13 02387 g004
Figure 5. Dependence of wetting enthalpy on maximum moisture absorption value for various cellulose samples.
Applsci 13 02387 g005
Table 1. Characteristics of cellulose samples.
Sample*CrAα-Cellulose, %DPCrI
CCCI98 ± 0.32700 ± 1200.83 ± 0.02
MCCCI88 ± 0.5170 ± 300.92 ± 0.01
CCMCII99 ± 0.22100 ± 1100.68 ± 0.02
KPCI97 ± 0.21200 ± 800.78 ± 0.02
SPCI94 ± 0.41100 ± 900.75 ± 0.03
SPMCII98 ± 0.3960 ± 600.66 ± 0.03
VFCII-250 ± 300.54 ± 0.02
*CrA denotes the main type of crystalline allomorph of cellulose sample.
Table 2. Maximum moisture absorption and wetting enthalpy for cellulose samples.
SampleAo, g/g−ΔHw, J/g
CC0.144 ± 0.00246.5 ± 0.2
MCC0.125 ± 0.00342.2 ± 0.2
CCM0.226 ± 0.00575.6 ± 0.5
KP0.174 ± 0.00358.5 ± 0.3
SP0.183 ± 0.00462.1 ± 0.4
SPM0.236 ± 0.00578.9 ± 0.3
VF0.310 ± 0.004104.2 ± 0.5
AC0.500 *168 *
* Calculated values.
Table 3. Degree and index of crystallinity and degree of amorphicity for cellulose samples.
SampleYXCrIRD, %
CC0.28 ± 0.010.72 ± 0.010.83 ± 0.0215
MCC0.25 ± 0.010.75 ± 0.010.92 ± 0.0123
CCM0.45 ± 0.010.55 ± 0.010.68 ± 0.0224
KP0.35 ± 0.010.65 ± 0.010.78 ± 0.0220
SP0.37 ± 0.010.63 ± 0.010.75 ± 0.0319
SPM0.47 ± 0.010.53 ± 0.010.66 ± 0.0324
VF0.62 ± 0.010.38 ± 0.010.54 ± 0.0242
Table 4. Some properties of crystalline and amorphous cellulose [2,3].
PropertiesSymbolZcZa
Specific volume, cm3/gVs0.6170.694
Moisture content (%) at standard RH = 65%Aw023
Accessibility for deuteriumAD0.141.14
Sorption of alkali from 1 M NaOH, mmol/gAA03.1
Hydrolysability (%) after treatment with boiling 2.5 M HCl, 1 hH040
Table 5. Some properties of CC and VF.
PropertiesCCVF
CalcExpCalcExp
Vs, cm3/g0.6380.6400.6650.661
*Gs, g/cm31.571.561.501.51
Aw, %6.46.514.314.1
AD0.420.430.760.75
AA, mmol/g0.870.861.921.94
H, %11102526
*Gs = 1/Vs denotes the specific gravity.
Disclaimer/Publisher’s Note: The statements, opinions and data contained in all publications are solely those of the individual author(s) and contributor(s) and not of MDPI and/or the editor(s). MDPI and/or the editor(s) disclaim responsibility for any injury to people or property resulting from any ideas, methods, instructions or products referred to in the content.

