Article

Comparative Analysis of Phytochemicals and Antioxidant Properties of Borage Oil (Borago officinalis L.) and Milk Thistle (Silybum marianum Gaertn)

1
Department of Machinery Exploitation and Management of Production Processes, Faculty of Production Engineering, University of Life Sciences in Lublin, 20-612 Lublin, Poland
2
Department of Biological Bases of Food and Feed Technologies, Faculty of Production Engineering, University of Life Sciences in Lublin, 20-612 Lublin, Poland
3
Institute of Human Nutrition and Agriculture, State Academy of Applied Sciences in Chełm, 22-100 Chełm, Poland
4
Department of Biophysics, University of Life Sciences in Lublin, Akademicka 13, 20-950 Lublin, Poland
5
ECOTECH-COMPLEX—Analytical and Programme Centre for Advanced Environmentally-Friendly Technologies, Maria Curie-Sklodowska University, Głęboka 39, 20-033 Lublin, Poland
6
Department of Thermal Technology and Food Process Engineering, University of Life Sciences in Lublin, 31 Głęboka St., 20-612 Lublin, Poland
*
Author to whom correspondence should be addressed.
Appl. Sci. 2023, 13(4), 2560; https://doi.org/10.3390/app13042560
Submission received: 31 January 2023 / Revised: 9 February 2023 / Accepted: 14 February 2023 / Published: 16 February 2023

Abstract

:
There is currently a growing interest in oils characterised by specific medicinal, cosmetic, or dietary properties. For this reason, the seeds of two plants, milk thistle (Silybum marianum Gaertn) and borage (Borago officinalis L.), were studied by subjecting them to the process of cold pressing. The extracted oils were then examined in terms of their chemical composition and biological activity, and qualitatively analysed with the use of FTIR spectroscopy. The oils contained linoleic and octadecenoic acids in amounts of 47.84%, 35.31% (milk thistle oil) and 35.43%, 25.18% (borage oil). They were characterised by low water content, roughly 0.088% for thistle and 0.075% for borage, and simultaneously relatively high phosphorus content, reaching, respectively, 47.7 and 33.1 mg·kg−1. The mean peroxide value was 4.22 for milk thistle and 2.83 mmolO2·kg−1 for borage, and the acid number was 5.17 and 3.9 mgKOH·g−1, respectively. FTIR spectroscopy was used to conduct a qualitative analysis, which revealed slight discrepancies in intensity at 3005 cm−1, which confirmed differences in the content of fatty acids and oil pigments between the oils. The obtained results provided information on the applicability of the studied seeds and oils obtained therefrom as basic components of pharmaceutical and cosmetic products with potential health benefits.

1. Introduction

The return to nature and rediscovery of its resources have become a key trend in contemporary industry, science, and consumption. The efforts to reemploy the natural properties of long-forgotten plants (such as milk thistle and borage) aim to popularise such materials in accordance with the European’s environmentally friendly policies. This is important because these plants have valuable properties facilitating the correct functioning of the human body in medicine and biocosmetics [1]. It has been reported that γ-linolenic acid contained in borage oil is effective against atopic dermatitis [2]. The research demonstrated that children who had worn undershirts coated with borage oil for 2 weeks showed improvements in their erythema and itch, which were statistically significant. Transepidermal water loss from the back was decreased. The undershirts coated with borage oil were found to be statistically effective, and had no side effects for children with mild atopic dermatitis [2]. Milk thistle has been used to treat various diseases for years. Many studies suggest a positive role for milk thistle in liver protection and regeneration [3,4,5]. Das and Mukherje [3] showed that the administration of an adequate amount of silybin restores the oxidative–antioxidant balance and reduces inflammation biomarkers and immunomodulation in induced liver oxidative stress in rats. Kwon et al. [4] found that the silymarin in milk thistle promotes hepatic glutathione production, which enhances antioxidant defences in mouse liver models. The health effects of milk thistle have also been proven in human studies. Lucena et al. [5] revealed a statistically significant reduction in lipid peroxidation in patients with alcoholic cirrhosis after the administration of silymarin from the dry extract of the fruit of the Silybum marianum plant [5].
There have been a growing number of dietary, cosmetic, and pharmaceutical breakthroughs relying on the bioactive substances present in plants rich in polyunsaturated fatty acids from the n-3 and n-6 families, as well as γ-linolenic acid (GLA), the prostaglandin precursor, with many tracing back to the two plants mentioned above. In the case of milk thistle and borage, the industrial-grade material consists primarily of seeds and the oils extracted from the same [6]. The most valuable oil is obtained in the process of cold pressing. With such treatment, both borage (Borago officinalis L.) and milk thistle (Silybum marianum L. Gaertn) can be a source of a number of valuable compounds with proven medicinal and cosmetic benefits. Such compounds are necessary ingredients of a healthy human diet that cannot be synthesised, and therefore should or even must be obtained from plant sources [7]. However, milk thistle seed oil is considered one of the most valuable products of natural origin due to its multiple and complex healing properties. Milk thistle seed oil has also been documented as a potential natural source of vitamin E and has often been recommended as a favourable edible oil [8].
Milk thistle has a number of confirmed health benefits, verified by documented research results that list it among alternative medicines facilitating the treatment of liver- and bile-related ailments [9]. Its anti-inflammatory properties allow it to be used as an ointment applied on pruritic, psoriatic, exsiccated, burned, or frostbitten skin [10].
Oils obtained from the two plants are a rich source of lipophilic compounds, tocopherols (vitamin E), counted as some of the most potent natural antioxidants, carotenoids, tocochromanols, phytosterols, and squalene, showing significant health benefits, as well as sterols (cholesterol, campesterol, stigmasterol, and sitosterol) [11], sugars (arabinose, rhamnose, xylose, and glucose), and flavonoids, contributing to protection of the liver against toxins [12].
Given the growing interest in products based on borage and milk thistle oils, it is prudent to expand our knowledge on the chemical composition and biological activity of the plants. Hence, the aim of this study was a comparative analysis of their seeds and the oils extracted from them in terms of selected primary qualitative parameters. To this end, seeds were examined for the content of fat and protein, and the oils were studied in terms of raw fat, protein, water (H2O), phosphorus (P), acid number (AN), peroxide value (PV), and free fatty acid content (FFA). The analysis included the composition of fatty acids, the content of sterols and squalene, tocopherols and tocotrienols, total chlorophyll and carotenoids, oil colour, and total polyphenols, as well as antioxidative activity (DPPH). Moreover, a qualitative analysis was conducted on the two oils using FTIR spectroscopy as a non-invasive, fast, and efficient method of determining general differences in this type of organic sample.

2. Materials and Methods

2.1. Plant Material

The studied material consisted of milk thistle (Silybum marianum L.) and borage (Borago officinalis L.) seeds, as well as oil extracted from the same. The batches of seeds harvested in 2021 were purchased from the “MIŁEX” Trade and Service Company in Lublin (Poland). The cultivars selected for the analysis were ‘Silma’ for milk thistle and ‘Variegata’ for borage. Both plants were grown in Biłgoraj (Voivodeship Lublin, Poland) in the eastern part of Poland.

2.2. Determination of Seed Moisture

The seed moisture content was determined with the drying method using a Radwag max 50/L/WH moisture analyser at 120 °C in accordance with the PN-EN ISO 665:2020 standard [13].

2.3. Determination of Fat Content

The fat content was determined in the seeds using an automatic Soxhlet apparatus (Tecator Soxtec System HT 1043 extraction unit, Gemini, Apeldoorn, Sweden). The analysis was performed in accordance with AN 310 applications [14].

2.4. Determination of Protein Content

The protein content was determined with the Kjeldahl method in accordance with the PN-EN ISO 1871:1975 standard [15]. This method involves the conversion of organic nitrogen compounds into ammonium sulphate by mineralisation with concentrated sulfuric acid in the presence of a catalyst, alkalisation of the solution, distillation with NH3, and titration of ammonia bound to boric acid by using hydrochloric acid.

2.5. Cold Pressing Seed Oil

Four kilograms of seeds from each plant were subjected to the process of cold pressing using a Farmet DUO screw press (Czech Republic). To facilitate more efficient oil extraction, the press was heated to 50 °C. The cold-pressed oil was poured into brown glass bottles and stored for 7 days to allow the natural sedimentation of impurities. Once the impurities had settled, the oil samples were ready for further analysis.

2.6. Qualitative Analysis of Fatty Acids

The analysis of the fatty acid content in the pressed oils was performed in accordance with the PN-EN ISO 12966-2:2011 standard, using the method of gas chromatography, which allows the determination of both the qualitative and quantitative composition of fatty acid ethyl esters [16].

2.7. Determination of FFA, Phosphorus, and Water

The oils were analysed for the content of free fatty acids (FFA) in accordance with the PN-EN ISO 660 standard [17]. The content of phosphorus was determined in accordance with the PN- ISO 10540-1 standard [18], and the content of water in the oils was measured using the Karl Fischer titration method on a TitrolLine 7500 KF apparatus from Donserv and Good Titration Practice™ (GTP) METTLER TOLEDO software (Version 9.0).

2.8. Chlorophyll and Carotenoid Pigment Content

Chlorophyll and carotenoid concentrations in the oil samples were assessed in cyclohexane according to the protocol of Chtourou et al. [19], with minor modifications. The absorbance of each sample was measured at 670 nm for chlorophyll and 470 nm for carotenoids using a spectrophotometer (UV-2600i, Schimadzu, Kioto in Japan). Their concentrations were calculated using formulas for chlorophylls (1) and carotenoids (2). The results are stated as mg·g−1 oil.
Chlorophyll = ( A 640 · 106 ) / ( 613 · 100 · d )
Carotenoids = ( A 470 · 106 ) / ( 2000 · 100 · d )
A: absorbance of the oil at the respective wavelength; d: thickness of the cuvette (1 cm).

2.9. Measurement of Colour Coordinates

Colour measurements were performed with the reflection method using an X-Rite 8200 spheric spectrometer with a measurement opening 12.7 in diameter. A D65 light source was used, coupled with a standard calorimetric observer working in a 10° field of view. Before each measurement, the device was calibrated using a white standard sample.
Colour coordinates were determined in accordance with the CIEL*a*b* system. The system entails colour measurements based on a numeric determination relative to three coordinates L*, a*, and b*, where L* stands for colour lightness within the range of 0 for a perfectly black body to 100 for a perfectly white body. The a* coordinate describes the shift from green (−a*) to red (+a*), and the b* coordinate from blue (−b*) to yellow (+b*). On the basis of the measured colour coordinates, the chroma (c) (3) and hue (h) (4) values were also determined for the dry material samples [20].
c = ( a * ) 2 + ( b * ) 2
h = tan 1 b a

2.10. Total Phenol Content

The total polyphenol content of the oils analysed was determined according to the method described by Singleton and Rossi [21], with slight modifications. Oil (0.5 g) was extracted in methanol (5.0 mL) for 10 min. The methanolic extract (1.0 mL) was mixed with Folin–Ciocalteu reagent (1.5 mL). After 3 min, a 20% Na2CO3 solution (2.5 mL) was added, and the mixture was diluted to 10.0 mL with distilled water. The solution was left at room temperature. After 45 min, the mixture was centrifuged and the absorbance was calculated using a spectrophotometer (UV-2600i, Schimadzu, Kioto in Japan) at 725 nm. Values are given in milligrams of gallic acid per gram of oil.

2.11. Total Flavonoid Content

Total flavonoid content was determined according to the method described by Marinova et al. [22], with slight modifications. In a test tube was mixed 0.5 mL of methanolic extract with 2.5 mL of distilled water, followed by the addition of 0.15 mL of a 5% NaNO2 solution. The mixture was left at room temperature for 10 min. Then, 0.30 mL of 10% AlCl3·6 H2O solution was added and it was left for another 5 min, before adding 1.0 mL of 1.0 M NaOH. The mixture was increased to 5.0 mL with distilled water and mixed well. Absorbance was measured at 510 nm. The result was given as milligram of quercetin per gram of oil recovered.

2.12. Total Antioxidant Capacity DPPH

The evaluation of the antioxidative activity of the analysed oils was performed following the method described by Presch et al. [23], with slight modifications. The spectrophotometric analysis was performed on a UV-2600i spectrophotometer (Shimadzu, Kioto in Japan) using a stable free radical 2,2-diphenyl-1-picrylhydrazyl (DPPH), at the wavelength of 517 nm. The obtained results were expressed as mg of Trolox (Sigma-Aldrich, St. Louis, MO, USA) per 100 g of oil. All the analyses were conducted in triplicate.

2.13. Determination of the Content of Phytosterols and Squalene

The content of phytosterols and squalene was measured with the method described by Szkula et al. [24]. The analysis was performed with the technique of gas chromatography on an Agilent GC 7890 B gas chromatographer coupled with a 7000 D mass spectrometer (Agilent Technologies, Santa Clara, CA, USA). An Elite-17ms capillary column from Elmer (Perkin Elmer, Waltham, MA, USA) was used (column dimensions: 30 m × 0.25 mm × 0.25 µm). The eluent gas used was helium flowing at 1.1 mL∙min−1. The separation was performed in the temperature range from 120 °C (for 1 min) to 290 °C (for 5 min); the temperature was increased at the rate of 5 °C∙min−1. Moreover, 5α-cholestane (Sigma-Aldrich®, St. Louis, MO, USA) was used as the internal standard for the purposes of the quantitative analyses. The results were processed using Agilent ChemStation Rev B.04.02 SP1 and Amdis ver. 2.66 (NIST, Gaithersburg, MD, USA) software. All the analyses were performed in triplicate.

2.14. Determination of the Content of Tocopherols

The content of tocopherols was determined in accordance with the method described by Fromm et al. [25], with slight modifications. The measurements were performed by way of ultra-performance liquid chromatography with a spectrophotometric detector (UPLC-PDA), using an Acquity Waters UPLC PDA system (Waters, Milford, MA, USA). Here, 500 mg samples of the analysed oils were dissolved in 5 mL of isopropyl alcohol and stirred in a vortex (a 30,392,131 mini mixer, OHAUS CORPORATION, Parsippany, NJ, USA). Next, 6 mL of methanol was added and the mixture was further vortexed. Afterwards, 500 μL of the obtained mixture was diluted with 500 μL of methanol. The resulting sample was filtered and placed, in the amount of 5 μL, at the top of an Acquity CSH C18 column (1.7 µm, 100 × 1.0 mm, Waters, Milford, MA, USA). The mobile phase was composed of the following: Solvent A—acetonitrile:water (90:10, v/v); Solvent B—acetonitrile:methanol (50:50, v/v). The flow rate was 0.7 mL·min−1. The tocopherol measurements were performed at the wavelength of 290 nm. Tocopherol standards were purchased from Sigma-Aldrich (St. Louis, MO, United States). All the analyses were carried out in triplicate.

2.15. Acid Number and Peroxide Value Measurements

The acid number (AN) was determined in accordance with PN-EN ISO 660:2009 [17]. The method allows one to measure the content of free fatty acids formed during the hydrolysis of ester bonds. First, 2 g of oil was measured into a conical flask, to which 50 cm3 of a 1:1 mixture of ether and ethyl alcohol was added, as well as several drops of phenolphthalein. The resulting mixture was then titrated with a KOH solution until a pink colour was obtained. The acid value was calculated from the following formula:
A N = V · N · 56.1 m
V: volume of the titrating solution; N: concentration of the titrating solution; m: mass of the sample; 56.1: conversion factor.
The peroxide value (PV) was determined in accordance with PN-EN ISO 3960:2017 [26]. It allows one to measure the content of iodine released from potassium iodide under the influence of peroxides present in the oil sample. First, 2 g of oil was measured into a conical flask. Next, 10 cm3 of chloroform was added, followed by 15 cm3 of ice-cold acetic acid and 1 cm3 of a potassium iodide solution. The content of the flask was stirred for 1 min, and then set aside for 5 min away from light. Afterwards, 75 mL of distilled water was added and the mixture was titrated with a 0.002 N solution of sodium thiosulphate in the presence of several drops of starch as an indicator. A parallel, blank test was also performed. The peroxide value was calculated from the following formula:
L O O = ( V V 1 ) · c · 10 3 m
V: volume of the sodium thiosulphate solution used for sample titration; V1: volume of the sodium thiosulphate solution used for the titration of the reagent blank; c: concentration of the sodium thiosulphate solution; m: mass of the sample.

2.16. Oxidative Stability Measurements

The oxidative stability was measured using a Rancimat 670 apparatus (Metrohm AG, Herisau, Switzerland). Oil samples (2.5 g) were weighed into reaction vessels and heated at 120 °C under a dry air flow of 20 L·h−1. The volatile compounds released during oxidation were collected into a cell containing distilled water, and the increasing water conductivity was continually measured. The time taken to reach the conductivity inflection point was recorded as the induction period (IP), expressed in hours. All determinations were carried out in triplicate.

2.17. FTIR Measurements

FTIR spectra were measured using the background-corrected ATR-FTIR technique (i.e., Attenuated Total Reflectance–Fourier Transform Infrared Spectroscopy) (16 scans per sample), with an HATR Ge crystal attachment (crystal truncated at 45° to allow for 10 internal reflections) in the form of a crystal plate, at room temperature T = 23 °C. All measurements were performed using a 670-Varian Spectrometer IR (Agilent, Santa Clara, CA, USA). Prior to each measurement, the crystal was cleaned using ultrapure solvents (Sigma-Aldrich, St. Louis, MO, USA). The apparatus was constantly purged with argon approximately 60 min prior to and during all measurements. The obtained infrared spectra were measured at the resolution of one 2 cm−1 within the spectral range between 3200 and 800 cm−1. The Fourier-transformed and averaged spectra were analysed and processed using Grams/AI 8.0 software (Thermo Fisher Scientific, Waltham, MA, USA).

2.18. Statistical Analysis

The statistical methods employed included one-way analysis of variance with Tukey’s test to determine the significance of differences observed between the obtained mean values. The analysis was conducted using the Statistica 13.3.1 software from StatSoft. The adopted significance threshold was α = 0.05.

3. Results

Table 1 presents the results of the analysis of the seeds’ basic chemical compositions. They revealed typical, not particularly varied moisture content of 6.55 and 6.61%, respectively, for the milk thistle and borage seeds. The analysis of fat content returned 34.34% in the borage seeds. This was 24.6% higher than the corresponding value for milk thistle seeds (25.90%). Less differentiation was observed in terms of the protein content, with the values recorded as 24.80% (borage seeds) and 29.49% (milk thistle seeds), which corresponded to a difference of 19% between the analysed samples (Table 1).
The table below (Table 2) presents the results recorded in terms of the fatty acid content in the analysed oils. Seven distinct fatty acids were identified in the milk thistle oil, and nine in the borage oil. Both samples were characterised by significant levels of polyunsaturated fatty acids n-6, including linolic acid (18:2n-6) (ALA). However, statistically significant differences were also observed. The content of linolic acid in borage oil was 26% higher than the corresponding value in milk thistle oil. The second most prominent acid identified was oleic acid (C18:1n9c). Its content also varied statistically significantly between the samples, with the value obtained for milk thistle oil exceeding the corresponding result for borage oil by 28%. Furthermore, the borage oil sample contained 19.79% of γ-linolenic acid (C18:3n6) and 2.90% of arachidic acid (C20:0). The latter two acids were not found in the milk thistle oil sample. The content of the remaining acids in the respective oils also varied to a lesser or greater degree.
Values such as the peroxide value (form of primary oxidation products), water content, and acid number (free fatty acids), as significant to the rancidification process, are key parameters considered for the purposes of quality analyses in both industrial and scientific contexts. The parameters determine the durability of the product, and consequently the economic viability of the oil. Table 3 presents some of the most important chemical parameters influencing the quality of oils used in the fuel and oil manufacturing industries. In both analysed samples, most of the measurements returned higher values in the oil extracted from milk thistle seeds. The water content in the milk thistle oil was 14.7% higher as compared to the borage oil. The content of phosphorus was 30% higher, AN 24.5% higher, PV 32.9% higher, and FFA 63.4% higher (5.2 and 1.9%). In terms of the oxidative stability parameter, the measured time was 4.53 and 4.28 h, respectively, which corresponded to a 5.5% higher value for milk thistle oil. In terms of the other parameters, such as PV or NJ, their levels observed for milk thistle oil were lower, respectively, by 32.93 and 13.34% compared to borage oil.
Table 4, Table 5 and Table 6 present the parameters responsible for the characteristic colour of the oils, as well as their antioxidative properties (Table 7). The content of total chlorophyll in borage oil was 26.17% (3.63 mg·kg−1) higher than the value for milk thistle oil. Furthermore, significant differences were observed in terms of carotenoid content as the value recorded for borage oil was 18% lower than that for milk thistle oil (Table 4).
The polyphenol content varied by 71.3% between the respective samples, with the higher level of 7.18 mgGAE·g−1 oil recorded for milk thistle oil. The corresponding value for borage oil was 4.19 mgGAE·g−1 oil.
The content of flavonoids in the analysed oils was 4.45 mg·kg−1 in milk thistle oil, which was significantly higher than in the case of borage oil (by 12.37%).
Tocopherols are important lipophilic compounds with antioxidative properties (Table 5). The concentration of tocochromanols varied by 224.5% between the analysed oils. The content of α-tocopherol (vitamin E), i.e., the most bioactive of the same, was positively verified in milk thistle oil (275.7 mg·kg−1) but was not present in borage oil. β-tocopherol was not detected in either of the samples. The content of γ-tocopherol was significantly higher in borage oil, exceeding the corresponding amount in the other sample by 34.62%. The lowest values were observed for δ-tocopherols and were the same in both samples (14.23 mg·kg−1). The free radical scavenging capacity of the studied oils determined using the common DPPH method was 1.83 and 1.54 mgTrolox·100 g−1, respectively, in milk thistle and borage oil, i.e., the discrepancy between samples amounted to 18.83%.
Table 6 presents the colour parameters of the analysed oils. The value of the L* coordinate for oil obtained from milk thistle seeds was approximately ten units lower relative to borage oil, signifying that the latter was considerably lighter. The values of the a* and b* colour coordinates, as well as the chroma value (c), were all higher for milk thistle oil, signifying that the colour could be described as more “lively”. On the other hand, the hue (h) coordinate was higher for borage oil, i.e., the hues of the respective oils were considerably different.
The table below (Table 7) lists the basic steroid compounds present in plants. The content of total sterols varied between the two analysed oil samples. The level thereof recorded for borage oil (261.33 mg·100 g−1 oil) was 33% lower than in the case of milk thistle oil (347.52 mg·100 g−1 oil). The highest specific content was observed for β-sitosterol, Δ5-campestanol, Δ7-stigmasterol, and Δ5-stigmasterol, with the differences between the two oils estimated at 11.85%, 252%, 88.94%, and 177.30%, respectively. The lowest content or a complete absence of the relevant compounds in the milk thistle sample was recorded for clerosterol, Δ5-avenasterol, brassicasterol (0 mg·100 g−1 oil), and Δ7-avenasterol (0 mg·100 g−1 oil). In the case of borage oil, the presence of campestanol, clerosterol, sitostanol, Δ5-24-stigmastadienol, and cholesterol was not detected.
The content of squalene also varied significantly between the analysed oils. It was 78.23 mg·100 g−1 oil in milk thistle oil, which was 97% higher than the corresponding value for borage oil (39.76 mg·100 g−1 oil).
The conducted analysis of Pearson’s linear correlation coefficient confirmed our expectations and revealed a close dependence between the factors considered for both oils (Table 8). There was a strong, both positive and negative, correlation between the content of phosphorus, C16:0 acid, acid number, peroxide value, iodine number, free fatty acids, and oxidative stability coefficient relative to the content of tocopherols δ, γ, α. Moreover, the same was also observed relative to sterols, polyphenols, DPPH, flavonoids, squalene, carotenoids, and chlorophylls, i.e., the group of antioxidative compounds.
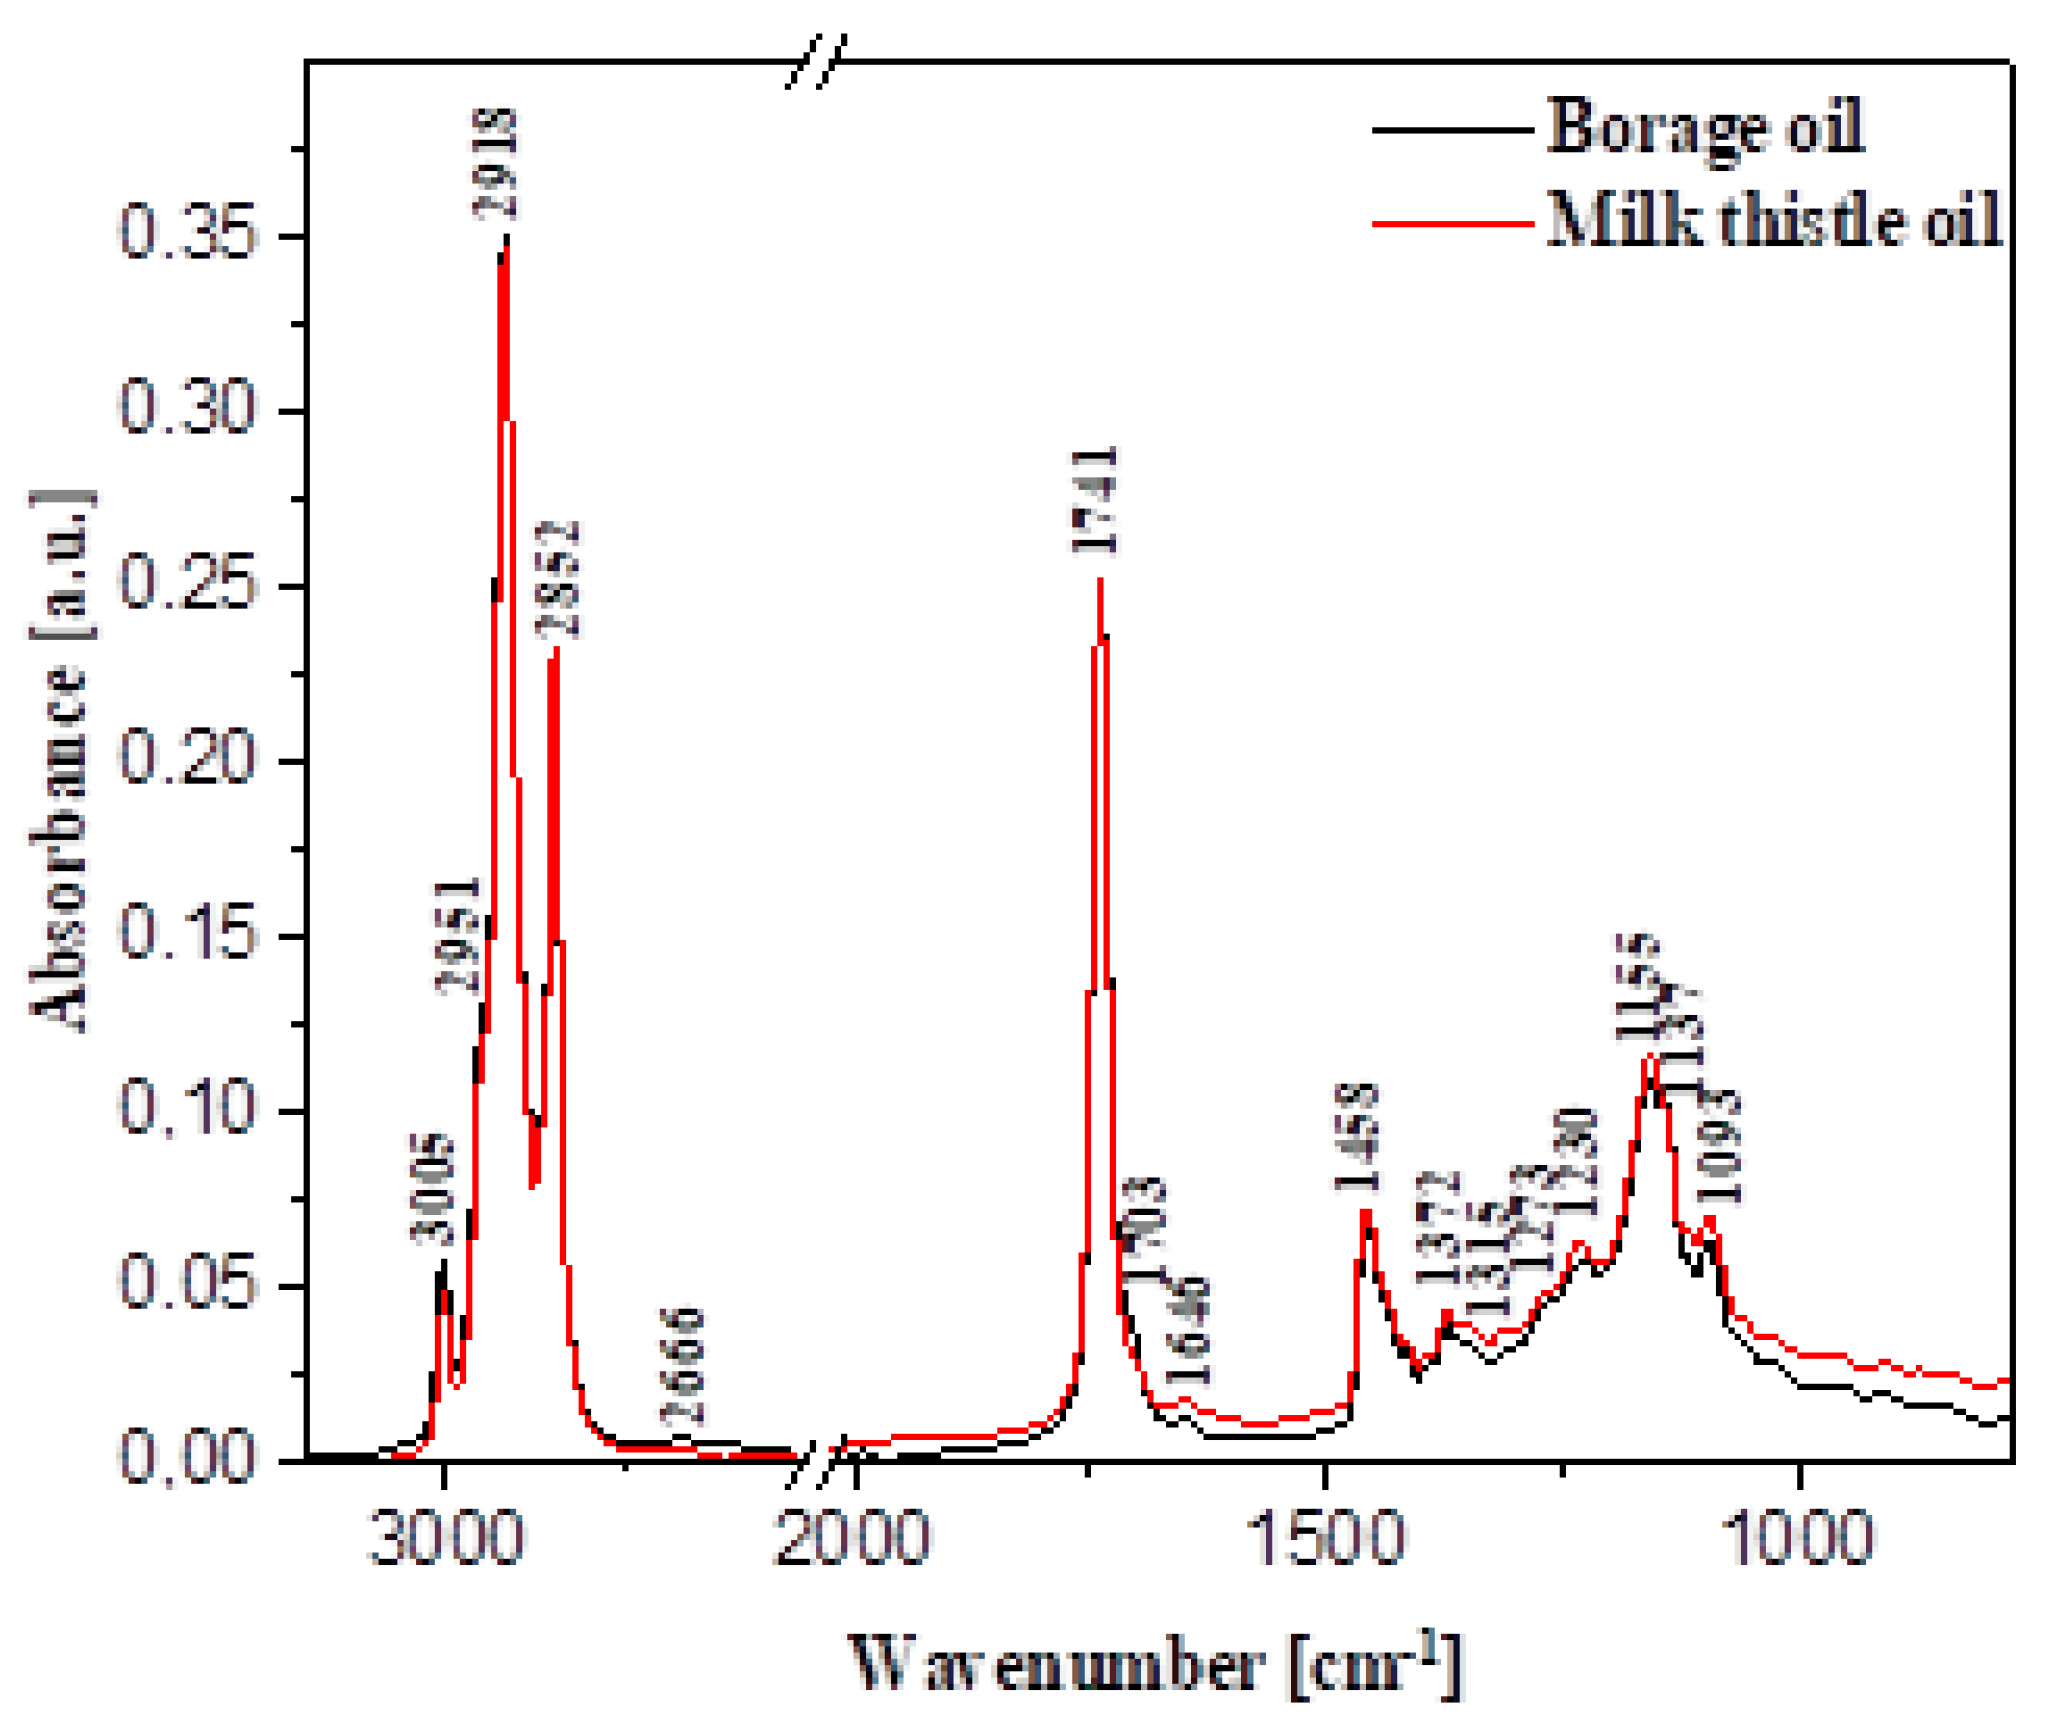
Figure 1 presents the FTIR spectra measured for the respective oil samples obtained from borage (black line) and milk thistle (red line). For the sake of easier analysis and comparison, the spectra were normalised at the same intensity with the maximum at ~1741 cm−1. The samples were placed on the crystal and analysed in a neutral gas atmosphere (as described in the Section 2).
Table 9 below illustrates the characteristic bands observed for the analysed oil samples attributed to the vibrations of specific functional groups based on an extensive literature review. It should be noted that the infrared spectra of the analysed oil samples contained clear bands that could be relatively easily attributed to specific vibrations of particular functional groups characteristic of certain food ingredients. Most edible vegetable oils are composed primarily of a variety of triglyceride fractions. Differences in this respect are primarily related to the degree and form of unsaturation of acyl groups involved, and the lengths of particular chains. There is currently a constantly growing number of worldwide publications reporting studies wherein FTIR spectroscopy was used in the analysis of various vegetable oils, e.g., rape oils. It should be noted, however, that despite the above, some bands prove notoriously difficult to decisively associate with specific groups. Table 9 below provides a fairly detailed breakdown of spectral frequencies with the most important band enhancements, as well as the corresponding functional groups involved. As a general note, it should be mentioned that, in this type of biological sample, many bands tend to overlap, which renders their association with specific vibrations considerably more difficult.
The general characteristics of the presented oil samples reveal rather intensive vibrations of the methylene group, usually located within the spectral range of 1350 to 1175 cm−1. In this case, these correspond to the stretching vibrations of the -C-H bond of the -CH3 group and deformation vibrations occurring in the same group (located at ~1160 cm−1, in our case, as an enhancement of the main band with the maximum at 1372cm−1). The stretching vibrations of the ester bond ν(C-O) include two combined asymmetrical vibrations—in this case, originating from the C-C(=O)-O and O-C-C groups. The intensity of the former is significantly higher, which is typical of most oily samples. The bands are usually located in the region of ~1300 (C-C(=O)-O) and ~1000 cm−1. In our case, the same were located at 1315 and 1093 cm−1. At the same time, the bands corresponding to saturated esters, i.e., C-C(=O)-O are also found between 1240 and 1160 cm−1—in our case, at approximately 1230 cm−1. Meanwhile, vibrations of this type corresponding to unsaturated esters tend to be located at considerably lower frequencies. The characteristic O-C-O band associated with primary alcohols tends to appear within the range from 1090 to 1020 cm−1, and was present in our case at 1093 cm−1. For secondary alcohols, the band is typically found with the maximum at ~1100 cm−1; in the described case, it was present as an enhancement in the band with the light maximum at 1137 cm−1. Both mentioned ester types are present in triglyceride molecules. In turn, the band with the maximum at approximately 1230 cm−1 is often associated exclusively with the out-of-plane deformation vibrations originating from the methylene group. Further regions represented in Table 9 and Figure 1 correspond to other vibrations characteristic of food ingredients. Firstly, there is the region with the maximum at ~1458 cm−1, and, secondly, at ~1315 cm−1 (as band widening, Figure 1). The former vibrations (~1458 cm−1) originate from the methyl groups in the aliphatic chains of the analysed oils. The band with the maximum at ~905 cm−1 present in both oil samples can be attributed to the stretching vibrations of cis-substituted olefin groups, which may be additionally enhanced by the vibrations of the vinyl group.
The infrared spectra of the analysed oil samples were fairly similar, albeit not without certain discrepancies that seem fairly characteristic and therefore analytically useful.
Another characteristic area of vibrations corresponds to the band maximum at ~1741 cm−1 and originates from the stretching vibrations of the C=O group. On the shorter wavelength side, this band is enhanced with the maximum at ~1703 cm−1 corresponding to the vibrations of another carbonyl group, this one present primarily in acid groups. In turn, the band with the maximum at ~1646 cm−1 represents the stretching vibrations of the -C=C- group (cis-transformation). A very characteristic region is also found in the band with the maximum at 1458 cm−1 (already mentioned above), originating from the deformation vibrations of -C-H groupings in -CH2 and -CH3 groups (scissor vibrations).
Moving on to longer-wavelength regions, one should also mention the =C-H stretching vibrations (trans-transformation) with the maximum at ~3066 cm−1 (Table 9), originating from the vibrations of triglyceride fractions. In turn, for the stretching vibrations of =C-H in the cis-configuration, characteristic vibrations are observed with the maximum at ~3005 cm−1 (Figure 1 and Table 9). The bands with the maxima at 2951 and 2852 cm−1 correspond to the stretching vibrations of –C-H in -CH3, CH2, present in the aliphatic groups in triglycerides.
In the case of the stretching vibrations of the C=O and the corresponding spectral band, a slight enhancement is present on the short-wavelength side at ~1703 cm−1, which can be attributed to the formation of a hydrogen bond between C=OH-O- groups.
The observed spectral differences correlate very well with the differences in the fatty acid profile presented in Table 2 and described in the first part of the paper.

4. Discussion

The water content measured in borage seeds (Table 1) was not different from the value reported by Borowy and Kapłan [37] or results obtained for four other oilseeds cultivated in Poland [38]. Considerably higher moisture content was reported by Abdel Samed et al. [39] in their study on seeds originating from 2005 and 2006 harvests in Cairo. The content of lipids (Table 1) and γ-linolenic acid (GLA) and linolic acid (LA) (Table 2) in the seeds was very similar to the values obtained by Borowy and Kapłan [37] in their study on borage seeds harvested in the south-eastern region of Poland in 2017. Similar results were also reported by Zadernowski et al. [6] in a study wherein the research material consisted of borage seeds originating from Northern Poland. As we compared our results with those reported in other countries, we observed that the lipid levels were high relative to the GLA content [40]. Similar conclusions were reached by Galwey and Shirlin [41], who emphasised the negative correlation between the two components. Discrepancies in terms of lipid and GLA content can be related to differences in borage genotypes [42], times of sowing and harvest [43,44], seed maturity [43], or overall growth conditions, such as rainfall or air temperature [44]. As suggested by Berti et al. [43], the content of oil in borage seeds increases under the conditions of physiological seed maturity.
The content of protein in the analysed seeds (Table 1) was slightly higher than corresponding results reported by Abdel Samed et al. [39] and reached 22.8%, which was comparable to the results obtained for borage seeds harvested in South-Eastern Poland [37]. In a study on flax, rape, and sunflower seeds, Budzyński and Zając [38] observed and reported similar protein content, as opposed to soya seeds, where the protein content was significantly lower.
Our results in the study on the chemical properties of milk thistle seeds were consistent with those reported by other researchers. Aziz et al. [45] studied various milk thistle cultivars originating from three cities in Pakistan and were able to demonstrate that samples from Islamabad contained more protein (blue and white cultivars: 30.09 and 27.60%) and moisture (blue and white cultivars: 6.27 and 6.90%) as compared to seeds from other cities. Very low moisture content (approximately 1%) compared to other contemporary results was reported by Malekzadeh et al. [46], likely due to factors related to climate change and the fact that the milk thistle was grown in a sandy area. On the other hand, observations made by Mahmoud et al. [47] coincide with ours in terms of fat content in milk thistle seeds. The researchers studied two Egyptian cultivars (wild and cultivated) and the values that they obtained were within the range of 28.53–29.68%. Moreover, they analysed true protein (25.25%), total carbohydrates (38.16%), and crude fibre (29.95%). The seeds of wild plants acquired greater amounts of lipids and crude fibre and less content of carbohydrates and proteins. The amino acids were similar in both wild and cultivated plants but their content varied [47]. Perez et al. [48] reported the content of oil in seeds of Asteraceae family plants as 25%.
Based on the analyses conducted for the two oils, we were able to identify seven fatty acids in borage oil and nine in milk thistle oil. The former contained the following acids: palmitic (C16:0), palmitoleic (C16:1), stearic (C18:0), oleic (C18:1 n-9), linolic (C18:2 n-6), linolenic (C18:3), and arachidic (C20:0). Other authors identified nine fatty acids in oil obtained from this plant [46,49]. The oil analysed in our study did not contain eicosenoic acid (C20:1), whose presence had been reported in milk thistle oil by Malekzadeh et al. [40]. Similarly to results published by other authors, the content of linolenic acid was dominant in our study at or above 47.84%.
In a study conducted by Tasset-Cuevas et al. [50] on cold-pressed borage oil, the reported content of linolic acid (C18:2) was 36.6%, i.e., less than observed in our study. At the same time, the content of γ-linolenic acid (C18:3) was 21.1% and was higher than measured in our case (0.22%). The results are comparable to those reported by other authors [51].
By comparing our results with those obtained by Zadernowski et al. [6] for oils pressed from borage seeds and oils obtained by means of hexane extraction, it was concluded that the basic physicochemical properties characterising “virgin” oils can vary, but do not exceed the reference values posited in the Codex Alimentarius [52]. The AN values in their pressed oils were significantly lower, while the results obtained for hexane-extracted oil were identical. The oils obtained by the cited authors were characterised by a significantly lower (by approximately 20 gJ2·100 g−1 oil) iodine number, regardless of the method of extraction. At the same time, the peroxide value measured for their oil extracted in a hydraulic press was similar to that recorded in our study. Results in terms of the oxidative stability of borage seed oil were also published by Sensidoni et al. [53]. In their study, they analysed refined, solvent-extracted oil, as well as two carbon-dioxide-extracted oils (pressure 25.3 MPa, temperature 45 °C; and pressure 30.4 MPa, temperature 55 °C). The induction times measured in their study varied within the range of 4.5 h (CO2-extracted oil at 45 °C) to 9.0 h (refined oil). The value reported for oil extracted with carbon dioxide was similar to that observed in our study. A considerably longer raw borage oil induction time of 11.17 h was reported by Szterka et al. [54]. Their conductometric analysis of the total volatile lipid compounds formed during hydroxide degradation was performed using a Methrom Rancimat device (Herisau, Switzerland) by subjecting oil samples to an airflow of 10 L∙h−1 at 100 °C. The discrepancies in terms of the oxidative stability of oils reported by different authors may be due to the methods of oil extraction used or other parameters significant to the Rancimat test.
The results of measurements conducted for the analysed milk thistle oil were partially inconsistent with the literature data. Bryś et al. [55] demonstrated that the acid and peroxide values of cold-pressed oil were 2.44 mgKOH·g−1 and 5.84 mmolO2·kg−1, respectively. In turn, Fathi-Achachlouei and Azadmard-Damirchi [49], in a study on the impact of microwave heating on milk thistle seeds of the Iranian ecotype on the properties of oil extracted therefrom, reported that the acid and peroxide values were within the range of 4.24–2.16 mgKOH·g−1 and 5.11–2.09 meqO2·kg−1, while the iodine number was 107–99 gI2·100 g−1, with the values decreasing as a result of thermal processing. A study conducted on oils from milk thistle seeds harvested in three different regions of Tunisia (Zaghouan, Bizerte, and Sousse) [56] returned results similar to our own in terms of the acid value (oil from Bizerte seeds: 5.48 mgKOH·g−1), peroxide value (oil from Sousse seeds: 4.20 meqO2·kg−1), and iodine number (oil from Zaghouan seeds: 118.32 gI2·100 g−1). The Rancimat test results reported by the authors varied from our value only in one instance, with the reported stability of milk thistle seed oil expressed as an oxidation induction time of 5.83, 8.75, and 4.55 h, respectively, for oils extracted from Bizerte, Zaghouan, and Sousse seeds. The oxidative stability registered in our study was lower than reported by Parry et al. [8] (13.3 h) and Dabbour et al. [57] (55.7 h) for oils obtained from Silybum marianum L. seeds at 80 °C and under an airflow of 7 and 20 l·h−1, respectively. The lower values of oil oxidative stability may be explained by differences in terms of the adopted measurement parameters.
Based on the available literature, differences in terms of surfactant ingredients and oil composition lead to varied responses to water content and the formation of various physical surfactant structures in vegetable oil [58]. The resulting effects may be positive, but, in most cases, the presence of phospholipids in vegetable oils triggers oxidation, negatively affecting the smell and taste of the product [58].
In the course of refining vegetable oil, phosphorus, as well as other active ingredients such as fatty acids, monoglycerides, and diglycerides, are removed in the so-called degumming process [59]. However, in cold-pressed oil, the presence of phosphorus affects oxidation and contributes to the formation of colloidal aggregates and sediments [60]. The eventual content of phosphorus in vegetable oil depends on the type of seeds, conditions of their storage, moisture content, and processing method. As follows from numerous publications, seeds of, e.g., rape or soya contain considerably more phosphorus than the oils analysed in this study. As posited by Rotkiewicz and Konopka [61], the level of this element can range from 132 to 224 mg·kg−1 depending on the initial moisture content in the seeds. In his research, McCormick [62] demonstrated that the content of phosphorus in soybean oil can be within the range of 448–1286 mg·kg−1.
The iodin number indicates the degree of fatty acids’ saturation and the oil’s oxidative stability, which in turn influences the economic viability of such products [63]. The rancidification of oils poses potential health risks, including an increased risk of cancer and inflammation, due to the formation of toxic and reactive oxidation products [64]. The iodine number measured for the analysed oil samples was within the range of typical values for commercially available seed oil products—118–123 g I2·100 g−1 [65].
In the fuel industry, it is accepted that the desirable level of FFA and water content as well as the acid number should be below, respectively, 0.06% wt., 0.5% wt., and 1 mg KOH·g−1 oil [66]. As posited by Ma and Hanna [67], the presence of water in raw oil material can reduce the FAME conversion ratio and cause saponification during transesterification reactions. Depending on the particular biological, meteorological, agricultural, and handling factors, the content of fatty acids (FFA) can vary considerably. As observed by Casas-Cardoso et al. [51], the content of FFA in borage oil can correspond to any value between 2.7 and 10.5% depending on the method of obtaining the oil. One should aim to minimise the presence of free fatty acids in the oil as they reduce the product’s commercial value. The purification of raw borage or milk thistle oil is important not only due to customer preferences but also due to its indisputable impact on the economic viability of production [23,68]. As follows from our results, the analysed oil samples were within the commercial ranges. Specifically, the content of free fatty acids in milk thistle and borage oils was, respectively, 5.2 and 1.9%.
Another parameter analysed in our study pertained to a group of compounds described as antioxidants. They increase the durability of fats by preventing rancidification resulting from the oxidation of unsaturated fatty acids. One group of primary natural antioxidants is composed of tocopherols. Due to their high bioactivity, tocopherols and tocotrienols are usually generally described as vitamin E and associated with the effects of dilating blood vessels and inhibiting blood coagulation. The antioxidative properties of oils are inherited from their chemical components, such as polyunsaturated fatty acids, sterols, tocopherols, and polyphenols [69]. The content of sterols may be influenced by the geographical location of cultivation, differences between cultivars, and the maturity of fruit [70]. In the analysed milk thistle and borage oils, the content of sterols was measured at 347.52 mg·kg−1 oil and 261.33 mg·100 g−1 oil, respectively. The results were similar to those published by other authors [71], who estimated the general content of sterols in vegetable oils as 338.46–340.37 mg·100 g−1 oil. In a study on different cultivars of milk thistle, Fathi-Achachlouei and Azadmard-Damirchi [49] described the level of β-sitosterol in seed oil as ranging from 617.9 to 689.4 mg·100 g−1 oil and for ∆7-sterol from 386.5 to 403.0 mg·100 g−1 oil. In a study on borage oil, Phillips et al. [72] demonstrated that the general content of sterols was 1098 mg·100 g−1 oil, while, in palm oil, it was 58 mg·100 g−1 oil.
Tocopherols are present in oils, in varying quantities, in four primary forms: α, β, γ, δ. Depending on the form, they show varying levels of antioxidative activity. Of all the tocochromanols, α-tocopherol (vit. E) shows 100%, β-tocopherol 50%, and γ-tocopherol 25%. Scientific evidence suggests that the content of tocopherols and phenols varies depending on the process of oil extraction employed [73,74]. Khan and Shahidi [73] observed that borage oil obtained through the process of cold pressing contained over 711 mg·kg−1 of tocopherol. In the cold-pressed borage seed oil analysed in the present study, the content of total tocopherol was 108 mg·kg−1, and in the milk thistle seed oil, it was 3541.45 mg·kg−1. Senanayake and Shahidi [74] analysed borage oil available on the market and reported tocopherol content at the level of 1976 mg·kg−1. As for studies on milk thistle oils conducted by other researchers, the products tended to have higher content of α-tocopherol as compared to other types of tocopherols (275.70 mg·kg−1) [49]. As follows from the literature data, similar amounts of this ingredient are found in sunflower oil [8].
The remaining substances include carotenoids and chlorophylls—both responsible for the characteristic colour of oils. The content of carotenoid and chlorophyll pigments in all vegetable oils depends on the type and maturity of the raw material, as well as the technology used for the extraction and refinement of the oil [75]. Both chlorophylls and carotenoids serve important physiological functions in living plants. Chlorophylls are involved in photosynthesis, while carotenoids protect plants against oxidation. The content of the ingredients may vary depending on the particular type of oil and the method of its production (refined, not refined). As posited by Mahoney et al. [76], the content of chlorophyll in oils can range from 25 mg·kg−1 in sesame oil to 3807 mg·kg−1 in unrefined hemp oil. In refined oils, this ranges from 5mg·kg−1 in rape oil to 58.5 mg·kg−1 in soybean oil. As for the content of carotenoids, in unrefined oils, it ranges from 30 mg·kg−1 in sesame seed oil to 3639 mg·kg−1 in pumpkin seed oil. In analyses conducted by Rokosik et al. [77], some oils, including milk thistle oil, showed chlorophyll content higher than measured in the presently tested oil (2.68 mg·kg−1), namely 4.82 mg·kg−1. In another study, Rahimi et al. [78] demonstrated that weather and environmental conditions influenced the content of chlorophylls and carotenoids in borage oil. At 3.96 mg·kg−1, their result was comparable to our own.
The literature provides very little data on the content of phytosterol oil. However, based on what is available, we know that phytosterols (plant sterols) are secondary components of vegetable oils and constitute a considerable portion of the non-saponifiable substances [49,79]. They contribute to reducing cholesterol levels in human blood serum [75], as well as improving the oxidative and thermal stability and overall durability of vegetable oils [80]. As evidenced by scientific research, the consumption of 1.5–3 g of plant sterols for a period of 2–3 weeks can lower the plasma levels of cholesterol by 7–12.5% [81]. Similarly to other reports, the dominant form was β-sitosterol, followed by ∆7-sterol [49].
Generally speaking, phospholipids, tocopherols, sterols, hydrocarbons (squalene), carotenoids, chlorophylls, and other compounds acting as pigments are very desirable dietarily [82]. Squalene, as the main component of polyunsaturated lipids on the skin’s surface, protects skin cells against oxidative damage caused by free radicals, while also providing moisturising and softening effects.
By comparing the FTIR spectra measured for the analysed borage and milk thistle oil samples, we observed slight discrepancies in a number of spectral regions that primarily reflected differences in the two oils’ compositions. We could clearly identify slight intensity changes at 3005 cm−1, which confirmed differences in terms of fatty acid content between the oils. The differences were also visible in the spectral fingerprint region, particularly between 1380 and 1100 cm−1. Below 1100 cm−1, we also observed discrepancies in terms of spectral intensity, although the bands were not particularly well separated and sharp. Nonetheless, the clear change in intensity may suggest, particularly in this spectral region, certain bridge connection differences between individual structural units in fatty acids. In the fingerprint region, the highest impact on the band intensity discrepancies may be attributed to the different content of fatty acids such as C18:1n9c or C18:2n-6, while, in the longer-wavelength region, the same are primarily associated with C18:3n6 and C16:0. The content of other compounds, e.g., chlorophylls, likely had a lesser impact on the discrepancies observed in the infrared spectra.

5. Conclusions

The study performed a comparative analysis of the chemical composition and antioxidative properties of two oils. Borage and milk thistle seeds were cold-pressed, and the resulting oils were subjected to chemical analyses. Based on the obtained results, the respective samples were thoroughly characterised. The seeds as such showed slightly higher content of fat and protein as compared to standard oleaginous plants, which is reflected by their market price. Both oils contained considerable amounts of nutrients, such as fatty acids, that the human organism requires but is unable to produce itself—omega 6, including arachidic acid (C20:0) and linolenic acid (C18:2n-6). Moreover, the presence of bioactive compounds such as tocopherols, carotenoids, polyphenols, and sterols indicates the viability of the analysed oils in potential cosmetic and pharmaceutical applications due to their confirmed health benefits.

Author Contributions

Conceptualisation, M.K. (Magdalena Kachel) and M.K. (Marta Krajewska); Methodology, M.K. (Magdalena Kachel) and M.K. (Marta Krajewska); Validation, M.S., L.Ś., A.M., S.R. and M.D.; Formal Analysis, M.K. (Magdalena Kachel), M.K. (Marta Krajewska), M.S., L.Ś. and A.M.; Investigation, M.K. (Magdalena Kachel), M.K. (Marta Krajewska), M.S., L.Ś., A.M., S.R. and M.D.; Resources, M.K. (Magdalena Kachel), M.K. (Marta Krajewska) and M.D.; Data Curation, M.K. (Magdalena Kachel) and M.K. (Marta Krajewska); Writing—Original Draft Preparation, M.K. (Magdalena Kachel), M.K. (Marta Krajewska) and A.M.; Writing—Review and Editing, M.K. (Magdalena Kachel), M.K. (Marta Krajewska) and A.M.; Visualisation, M.K. (Magdalena Kachel), M.K. (Marta Krajewska), M.S., L.Ś., A.M., S.R. and M.D.; Supervision, M.K. (Magdalena Kachel) and M.K. (Marta Krajewska). All authors have read and agreed to the published version of the manuscript.

Funding

Publication co-financed by the state budget under the program of the Ministry of Education and Science (Republic of Poland) under the name Excellent Science—Support for Scientific Conferences entitled “XXIII Polish Nationwide Scientific Conference ‘PROGRESS IN PRODUCTION ENGINEERING’ 2023”, project number DNK/SP/546290/2022, amount of funding 162,650.00 PLN, total value of the project 238,650.00 PLN (Poland).

Data Availability Statement

Correspondence and requests for materials should be addressed to M.KR. (Marta Krajewska).

Conflicts of Interest

The authors declare no conflict of interest.

References

  1. Aziz, A.A.; Taher, Z.M.; Muda, R.; Aziz, R. Cosmeceuticals and Natural Cosmetics. In Recent Trends in Research into Malaysian Medicinal Plants Research; Penerbit UTM Press: Skudai, Johor, Malaysia, 2017; pp. 126–175. [Google Scholar]
  2. Kanehara, S.; Ohtani, T.; Uede, K.; Furukawa, F. Clinical effects of undershirts coated with borage oil on children with atopic dermatitis: A double-blind, placebo-controlled clinical trial. J. Dermatol. 2007, 34, 811–815. [Google Scholar] [CrossRef] [PubMed]
  3. Das, S.K.; Mukherjee, M. Biochemical and immunological basis of silymarin effect, a milk thistle (Silybum marianum) against ethanol-induced oxidative damage. Toxicol. Mech. Methods 2012, 22, 409–413. [Google Scholar] [CrossRef] [PubMed]
  4. Kwon, D.Y.; Jung, Y.S.; Kim, S.J.; Kim, Y.; Choi, D.W. Alterations in Sulfur Amino Acid Metabolism in Mice Treated with Silymarin: A Novel Mechanism of Its Action Involved in Enhancement of the Antioxidant Defense in Liver. Planta Medica 2013, 79, 997–1002. [Google Scholar] [CrossRef] [Green Version]
  5. Lucena, M.; Andrade, R.; De La Cruz, J.; Rodriguez-Mendizabal, M.; Blanco, E.; De La Cuesta, F.S. Effects of silymarin MZ-80 on oxidative stress in patients with alcoholic cirrhosis. Results of a randomized, double-blind, placebo-controlled clinical study. Int. J. Clin. Pharmacol. Ther. 2002, 40, 2–8. [Google Scholar] [CrossRef] [PubMed]
  6. Zadernowski, R.; Nowak-Polakowska, H.; Pieńkowska, H.; Czaplicki, S. Effect of the method of fat extraction from seeds of evening primrose and borage on selected physicochemical properties and stability of oils. Oilseed Crop. 2002, 23, 471–480. [Google Scholar]
  7. Valenzuela, A.; Sanhueza, B.J.; Nieto, S. Docosahexaenoic acid (DHA), essentiality and requirements: Why and how to provide supplementation. Grasas Aceites 2006, 57, 229–237. [Google Scholar] [CrossRef] [Green Version]
  8. Parry, J.; Hao, Z.; Luther, M.; Su, L. Characterization of cold-pressed onion, parsley, cardamom, mullein, roasted pumpkin, and milk thistle seed oils. J. Am. Oil Chem. Soc. 2006, 83, 847–854. [Google Scholar] [CrossRef]
  9. Kurkin, V.A. Saint-Mary Thistle: A Source of Medicinals. Pharm. Chem. J. 2003, 37, 189–202. [Google Scholar] [CrossRef]
  10. Rainone, F. Milk thistle. Am. Fam. Physician 2005, 72, 1285–1288. [Google Scholar]
  11. Seraj, R.G.M.; Tohidfar, M.; Irani, M.A.; Esmaeilzadeh-Salestani, K.; Moradian, T.; Ahmadikhah, A.; Behnamian, M. Metabolomics analysis of milk thistle lipids to identify drought-tolerant genes. Sci. Rep. 2022, 12, 1–23. [Google Scholar] [CrossRef]
  12. Polyak, S.J.; Morishima, C.; Lohmann, V.; Pal, S.; Lee, D.Y.W.; Liu, Y.; Graf, T.N.; Oberlies, N.H. Identification of hepatoprotective flavonolignans from silymarin. Proc. Natl. Acad. Sci. USA 2010, 107, 5995–5999. [Google Scholar] [CrossRef] [Green Version]
  13. PN-EN ISO 665:2020 standard; Oilseeds. Determination of Moisture Content and Volatile Content. Polski Komitet Normalizacyjny: Warsaw, Poland, 2020.
  14. Application Note (AN310) Soxtec™ 8000 Extraction System. Extraction of Crude Fat using Soxtec™ 8000. Extraction System. Available online: http://www.kouhing.com/soxtec-8000-extraction-unit/ (accessed on 20 January 2023).
  15. PN-EN ISO 1871:1975 Standard; Agricultural Food Products. Determination of Nitrogen by the Kjeldahl Method and Expressing as Protein. Polski Komitet Normalizacyjny: Warsaw, Poland, 1975.
  16. PN-EN ISO 12966-2:2011; Animal and Vegetable Fats and Oils—Gas Chromatography of Fatty Methyl Esters—Part 2: Preparation of Methyl Esters of Fatty Acids. Polski Komitet Normalizacyjny: Warsaw, Poland, 2011.
  17. PN-EN ISO 660:2009; Animal and Vegetable Fats and Oils. Determination of Acid Value and Acidity. Polski Komitet Normalizacyjny: Warsaw, Poland, 2009.
  18. PN-EN ISO 10540-1:2003; Animal and Vegetable Fats and Oils. Determination of Phosphorus Content. Part 1: Colorimetric Method. 2003. Polski Komitet Normalizacyjny: Warsaw, Poland, 2003.
  19. Chtourou, M.; Gargouri, B.; Jaber, H.; Abdelhedi, R.; Bouaziz, M. Comparative study of olive oil quality from ChemlaliSfax versus Arbequina cultivated in Tunisia. Eur. J. Lipid Sci. Technol. 2013, 115, 631–640. [Google Scholar] [CrossRef]
  20. Mohammadi, A.; Rafiee, S.; Emam-Djomeh, Z.; Keyhani, A. Kinetic models for colour changes in kiwifruit slices during hot air drying. World Agric. Sci. 2008, 4, 376–383. [Google Scholar]
  21. Singleton, Y.I.; Rossi, J.A.J. Colorimetry of total phenolics with phophomolybdic-phosphotunstic acid reagents. Am. J. Enol. Vitic. 1965, 16, 144–158. [Google Scholar]
  22. Marinova, D.; Ribarova, F.; Atanassova, M. Total phenolic and total flavonoids in Bulgarian fruits and vegetables. J. Uni. Chem. Technol. Metal. 2005, 40, 255–260. [Google Scholar]
  23. Prescha, A.; Grajzer, M.; Dedyk, M.; Grajeta, H. The Antioxidant Activity and Oxidative Stability of Cold-Pressed Oils. J. Am. Oil Chem. Soc. 2014, 91, 1291–1301. [Google Scholar] [CrossRef] [PubMed] [Green Version]
  24. Shukla, V.K.S.; Dutta, P.C.; Artz, W.E. Camelina oil and its unusual cholesterol content. J. Am. Oil Chem. Soc. 2002, 79, 965–969. [Google Scholar] [CrossRef]
  25. Fromm, M.; Bayha, S.; Kammerer, D.R.; Carle, R. Identification and Quantitation of Carotenoids and Tocopherols in Seed Oils Recovered from Different Rosaceae Species. J. Agric. Food Chem. 2012, 60, 10733–10742. [Google Scholar] [CrossRef] [PubMed]
  26. PN-EN ISO 3960:2017; Animal and Vegetable Fats and Oils. Determination of Peroxide Value-Iodometric (Visual) Endpoint Determination. Polski Komitet Normalizacyjny: Warsaw, Poland, 2017.
  27. Guillén, M.D.; Cabo, N. Characterization of edible oils and lard by fourier transform infrared spectroscopy. Relationships between composition and frequency of concrete bands in the fingerprint region. J. Am. Oil Chem. Soc. 1997, 74, 1281–1286. [Google Scholar] [CrossRef]
  28. Lerma-García, M.; Ramis-Ramos, G.; Herrero-Martinez, J.M.; Simó-Alfonso, E.F. Authentication of extra virgin olive oils by Fourier-transform infrared spectroscopy. Food Chem. 2010, 118, 78–83. [Google Scholar] [CrossRef]
  29. Kachel, M.; Matwijczuk, A.; Przywara, A.; Kraszkiewicz, A.; Koszel, M. Profile of Fatty Acids and Spectroscopic Characteristics of Selected Vegetable Oils Extracted by Cold Maceration. Agric. Eng. 2018, 22, 61–71. [Google Scholar] [CrossRef] [Green Version]
  30. Rohman, A.; Man, Y.B.C. Fourier transform infrared (FTIR) spectroscopy for analysis of extra virgin olive oil adulterated with palm oil. Food Res. Int. 2010, 43, 886–892. [Google Scholar] [CrossRef]
  31. Yang, H.; Irudayaraj, J.; Paradkar, M.M. Discriminant analysis of edible oils and fats by FTIR, FT-NIR and FT-Raman spectroscopy. Food Chem. 2005, 93, 25–32. [Google Scholar] [CrossRef]
  32. Gurdeniz, G.; Ozen, B. Detection of adulteration of extra-virgin olive oil by chemometric analysis of mid-infrared spectral data. Food Chem. 2009, 116, 519–525. [Google Scholar] [CrossRef] [Green Version]
  33. Kachel, M.; Matwijczuk, A.; Sujak, A.; Czernel, G.; Niemczynowicz, A.; Nowicka, A. The Influence of Copper and Silver Nanocolloids on the Quality of Pressed Spring Rapeseed Oil. Agronomy 2019, 9, 643. [Google Scholar] [CrossRef] [Green Version]
  34. Kachel, M.; Matwijczuk, A.; Niemczynowicz, A.; Koszel, M.; Przywara, A. INFLUENCE OF FERTILISATION TYPE ON THE QUALITY OF VIRGIN RAPESSED OIL. Ital. J. Food Sci. 2019, 31, 593–616. [Google Scholar] [CrossRef]
  35. Matwijczuk, A.; Zając, G.; Kowalski, R.; Kachel-Jakubowska, M.; Gagoś, M. Spectroscopic Studies of the Quality of Fatty Acid Methyl Esters Derived from Waste Cooking Oil. Pol. J. Environ. Stud. 2017, 26, 2643–2650. [Google Scholar] [CrossRef]
  36. Bendini, A.; Cerretani, L.; Di Virgilio, F.; Belloni, P.; Bonoli-Carbognin, M.A.T.T.E.O.; Lercker, G. Preliminary evaluation of the application of the FTIR spectroscopy to control the geographic origin and quality of virgin olive oils. J. Food Qual. 2007, 30, 424–437. [Google Scholar] [CrossRef]
  37. Borowy, A.; Kapłan, M. CHEMICAL COMPOSITION AND ANTIOXIDANT ACTIVITY OF BORAGE (Borago officinalis L.) SEEDS. Acta Sci. Pol. Hortorum Cultus 2020, 19, 79–90. [Google Scholar] [CrossRef]
  38. Budzyński, W.; Zając, T. Oil Plants-Cultivation and Application; PWRiL: Poznań, Poland, 2010. [Google Scholar]
  39. Samed, A.A.; Kobeasy, M.; Alla, H.S.G. CHEMICAL COMPOSITION OF SEEDS AND OIL OF BORAGE (Borago officinalis). J. Soil Sci. Agric. Eng. 2007, 32, 1553–1559. [Google Scholar] [CrossRef]
  40. Mhamdi, B.; Wannes, W.A.; Bourgou, S.; Marzouk, B. Biochemical characterization of borage (Borago officinalis L.) seeds. J. Food Biochem. 2009, 33, 331–341. [Google Scholar] [CrossRef]
  41. Galwey, N.W.; Shirlin, A.J. Selection of borage (Borago officinalis) as a seed crop for pharmaceutical uses. Heredity 1990, 65, 249–257. [Google Scholar] [CrossRef] [Green Version]
  42. De Haro, A.; Domínguez, V.; Del Rio, M. Variability in the Content of Gamma-Linolenic Acid and Other Fatty Acids of the Seed Oil of Germplasm of Wild and Cultivated Borage (Borago officinalis L.). J. Herbs, Spices Med. Plants 2002, 9, 297–304. [Google Scholar] [CrossRef]
  43. Berti, M.T.; Fischer, S.U.; Wilckens, R.L.; Hevia, M.F.; Johnson, B.L. Borage (Borago officinalis L.) Response to N, P, K, and S Fertilization in South Central Chile. Chil. J. Agric. Res. 2010, 70, 228–236. [Google Scholar] [CrossRef]
  44. El Hafid, R.; Blade, S.; Hoyano, Y. Seeding date and nitrogen fertilization effects on the performance of borage (Borago officinalis L.). Ind. Crop. Prod. 2002, 16, 193–199. [Google Scholar] [CrossRef]
  45. Aziz, M.; Saeed, F.; Ahmad, N.; Ahmad, A.; Afzaal, M.; Hussain, S.; Mohamed, A.A.; Alamri, M.S.; Muhammad Anjum, F. Biochemical profile of milk thistle (Silybum Marianum L.) with special reference to silymarin content. Food Sci. Nutr. 2021, 9, 244–250. [Google Scholar] [CrossRef]
  46. Malekzadeh, M.; Mirmazloum, S.I.; Mortazavi, S.N.; Panahi, M.; Angorani, H.R. The physicochemical propertis and oil contituents of milk thistle (Silybum marianum Gaertn. cv. Budakalászi) under drought stress. J. Med. Plant Res. 2011, 5, 1485–1488. [Google Scholar]
  47. Mahmoud, A.E.; Bassim, M.A.; Fatma, F.; Rabo, A. Seed yield and important seed constituents for naturally and cultivated milk thistle (Silybum marianum) plants. Egipt. J. Ekspery. Bio. 2015, 4, 141–146. [Google Scholar]
  48. Perez, E.; Crapiste, G.; Carelli, A. Some Physical and Morphological Properties of Wild Sunflower Seeds. Biosyst. Eng. 2007, 96, 41–45. [Google Scholar] [CrossRef]
  49. Fathi-Achachlouei, B.; Azadmard-Damirchi, S. Milk Thistle Seed Oil Constituents from Different Varieties Grown in Iran. J. Am. Oil Chem. Soc. 2009, 86, 643–649. [Google Scholar] [CrossRef]
  50. Tasset-Cuevas, I.; Fernández-Bedmar, Z.; Lozano-Baena, M.D.; Campos-Sánchez, J.; de Haro-Bailón, A.; Muñoz-Serrano, A.; Alonso-Moraga, A. Protective Effect of Borage Seed Oil and Gamma Linolenic Acid on DNA: In Vivo and In Vitro Studies. PLoS ONE 2013, 8, e56986. [Google Scholar] [CrossRef] [Green Version]
  51. Casas-Cardoso, L.; Mantell, C.; Obregón, S.; Cejudo-Bastante, C.; Alonso-Moraga, Á.; de la Ossa, E.J.M.; de Haro-Bailón, A. Health-Promoting Properties of Borage Seed Oil Fractionated by Supercritical Carbon Dioxide Extraction. Foods 2021, 10, 2471. [Google Scholar] [CrossRef] [PubMed]
  52. General Standard for Food Additives: 2009; Codex Alimentarius-Joint FAO/WHO Food Standards. FAO/WHO: London, ON, Canada, 2009.
  53. Sensidoni, A.; Bortolussi, G.; Orlando, C.; Lognay, G.; Fantozzi, P.; Paquot, M. Composition and oxidative stability of borage (Borago officinalis L.) and borage—Virgin olive oil blends. LWT 1995, 28, 343–346. [Google Scholar] [CrossRef]
  54. Szterk, A.; Roszko, M.; Sosińska, E.; Derewiaka, D.; Lewicki, P.P. Chemical Composition and Oxidative Stability of Selected Plant Oils. J. Am. Oil Chem. Soc. 2010, 87, 637–645. [Google Scholar] [CrossRef]
  55. Bryś, J.; Flores, L.F.V.; Górska, A.; Wirkowska-Wojdyła, M.; Ostrowska-Ligęza, E.; Bryś, A. Use of GC and PDSC methods to characterize human milk fat substitutes obtained from lard and milk thistle oil mixtures. J. Therm. Anal. Calorim. 2017, 130, 319–327. [Google Scholar] [CrossRef]
  56. Meddeb, W.; Rezig, L.; Abderrabba, M.; Lizard, G.; Mejri, M. Tunisian Milk Thistle: An Investigation of the Chemical Composition and the Characterization of Its Cold-Pressed Seed Oils. Int. J. Mol. Sci. 2017, 18, 2582. [Google Scholar] [CrossRef] [PubMed] [Green Version]
  57. Dabbour, I.; Al-Ismail, K.; Takruri, H.; Azzeh, F. Chemical Characteristics and Antioxidant Content Properties of Cold Pressed Seed Oil of Wild Milk Thistle Plant Grown in Jordan. Pak. J. Nutr. 2014, 13, 67–78. [Google Scholar] [CrossRef] [Green Version]
  58. Gupta, R.; Muralidhara, H.S.; Davis, H.T. Structure and Phase Behavior of Phospholipid-Based Micelles in Nonaqueous Media. Langmuir 2001, 17, 5176–5183. [Google Scholar] [CrossRef]
  59. Jiang, X.; Chang, M.; Jin, Q.; Wang, X. Optimization of the degumming process for camellia oil by the use of phospholipase C in pilot-scale system. J. Food Sci. Technol. 2014, 52, 1–11. [Google Scholar] [CrossRef] [Green Version]
  60. Xenakis, A.; Papadimitriou, V.; Sotiroudis, T.G. Colloidal structures in natural oils. Curr. Opin. Colloid Interface Sci. 2010, 15, 55–60. [Google Scholar] [CrossRef]
  61. Rotkiewicz, D.; Konopka, I. Effect of some technological factors on the content of phosphorus compounds in the rapeseed oil. Oilseed Crops 2000, 21, 215–224. [Google Scholar]
  62. McCormick, R.L.; Westbrook, S.R. Biodiesel and Biodiesel Blends. ASTM Stand. News 2007, 35, 28. [Google Scholar]
  63. Kazempour-Samak, M.; Rashidi, L.; Ghavami, M.; Sharifan, A.; Hosseini, F. Sour Cherry (Cerasus vulgaris Miller) Kernel Oil as the Novel Functional Edible Oil: Sensory Evaluation and Antioxidant and Physicochemical Properties. J. Food Qual. 2021, 2021, 1–9. [Google Scholar] [CrossRef]
  64. Mehmood, T.; Ahmad, A.; Ahmed, A.; Khalid, N. Quality evaluation and safety assessment of different cooking oils available in Pakistan. J. Chem. Soc. Pak. 2012, 34, 518–525. [Google Scholar]
  65. Stryjecka, M.; Michalak, M.; Cymerman, J.; Kiełtyka-Dadasiewicz, A. Comparative Assessment of Phytochemical Compounds and Antioxidant Properties of Kernel Oil from Eight Sour Cherry (Prunus cerasus L.) Cultivars. Molecules 2022, 27, 696. [Google Scholar] [CrossRef] [PubMed]
  66. Leung, D.Y.; Wu, X.; Leung, M. A review on biodiesel production using catalyzed transesterification. Appl. Energy 2010, 87, 1083–1095. [Google Scholar] [CrossRef]
  67. Ma, F.; Hanna, M.A. Biodiesel production: A review. Bioresour Technol. 1999, 70, 1–15. [Google Scholar] [CrossRef]
  68. Cong, S.; Dong, W.; Zhao, J.; Hu, R.; Long, Y.; Chi, X. Characterization of the Lipid Oxidation Process of Robusta Green Coffee Beans and Shelf Life Prediction during Accelerated Storage. Molecules 2020, 25, 1157. [Google Scholar] [CrossRef] [Green Version]
  69. Kavousi, A.; Torabi, F.; Chan, C.W.; Shirif, E. Experimental measurement and parametric study of CO2 solubility and molecular diffusivity in heavy crude oil systems. Fluid Phase Equilibria 2014, 371, 57–66. [Google Scholar] [CrossRef]
  70. Harrabi, S.; Sakouhi, F.; St-Amand, A.; Boukhchina, S.; Kallel, H.; Mayer, P.M. Accumulation of phytosterols, triterpene alcohols and phytostanols in developing Zea mays L. kernels. J. Plant Scien. 2007, 2, 260–272. [Google Scholar] [CrossRef] [Green Version]
  71. Verleyen, T.; Forcades, M.; Verhe, R.; Dewettinck, K.; Huyghebaert, A.; De Greyt, W. Analysis of free and esterified sterols in vegetable oils. J. Am. Oil Chem. Soc. 2002, 79, 117–122. [Google Scholar] [CrossRef]
  72. Phillips, K.; Ruggio, D.M.; Toivo, J.I.; Swank, M.A.; Simpkins, A.H. Free and Esterified Sterol Composition of Edible Oils and Fats. J. Food Compos. Anal. 2002, 15, 123–142. [Google Scholar] [CrossRef]
  73. Khan, M.; Shahidi, A.F. Photooxidation stability of stripped and non-stripped borage and evening primrose oil and their emulsions in water. Food Chem. 2002, 79, 47–53. [Google Scholar] [CrossRef]
  74. Senanayake, S.P.J.N.; Shahidi, F. Oxidation stability of structured lipids produced from borage (Borago officinalis L.) and evening primrose (Oenothera biennis L.) oils in the docosahexaenoic acid. J. Am. Oil Chem. Soc. 2002, 79, 1003–1013. [Google Scholar] [CrossRef]
  75. Rotkiewicz, D.; Konopka, I.; Taska, M. Carotenoids and chlorophylls in plant oils and their functions. Oilseed Crops 2002, 23, 561–579. [Google Scholar]
  76. Mahoney, E.; Milewska, M.; Mironczuk-Chodakowska, I.; Terlikowska, K. The influence of carotenoid and chlorophyll content on the oxidative processes in the selected vegetable oils. Prog. Health Sci. 2018, 8, 144–151. [Google Scholar] [CrossRef] [Green Version]
  77. Rokosik, E.; Dwiecki, K.; Siger, A. Nutritional quality and phytochemical contents of cold pressed oil obtained from chia, milk thistle, nigella, and white and black poppy seeds. Grasas y Aceites 2020, 71, 368. [Google Scholar] [CrossRef]
  78. Rahimi, A.; Jahanbin, S.; Salehi, A.; Farajee, H. The effect of mycorrhiza on yield, oil content and water use efficiency of medicinal plant of Borage (Borago officinails L.) under water stress. IJHS 2018, 49, 407–415. [Google Scholar]
  79. Damirchi, S.A.; Savage, G.P.; Dutta, P.C. Sterol fractions in hazelnut and virgin olive oils and 4,4′-dimethylsterols as possible markers for detection of adulteration of virgin olive oil. J. Am. Oil Chem. Soc. 2005, 82, 717–725. [Google Scholar] [CrossRef]
  80. Przybylski, R.; Eskin, N. Minor components and the stability of vegetable oils. Inform 2006, 17, 186–188. [Google Scholar]
  81. Moreau, R.A. Plant sterols in functional foods. In Phytosterols as Functional Food Components and Nutraceuticals; CRC Press: Boca Raton, FL, USA, 2003; pp. 284–286. [Google Scholar]
  82. Gao, P.; Liu, R.; Jin, Q.; Wang, X. Comparative study of chemical compositions and antioxidant capacities of oils obtained from two species of walnut: Juglans regia and Juglans sigillata. Food Chem. 2018, 279, 279–287. [Google Scholar] [CrossRef] [PubMed]
Figure 1. FTIR spectra for the analysed samples of borage oil (black line) and milk thistle oil (red line), measured in the spectral range from 800 to 3200 cm−1. The spectra were measured at room temperature.
Applsci 13 02560 g001
Table 1. Basic chemical composition of seeds (%).
MaterialMoistureFat ContentProtein Content
Milk thistle seeds6.55 ± 0.0925.90 ± 0.06 a29.49 ± 0.10 a
Borage seeds6.61 ± 0.0834.34 ± 0.09 a24.80 ± 0.08 b
Values designated by different small letters in the columns of the table are significantly different (α = 0.05).
Table 2. Content of fatty acids in the analysed oil samples (%).
Fatty Acids Vegetable Oils
Milk ThistleBorage
C16:07.93 ± 0.81 a9.94 ± 0.62 b
C16:10.16 ± 0.08 a0.15 ± 0.04 a
C18:05.25 ± 0.25 a5.8 ± 0.50 a
C18:1n9c35.31 ± 1.06 a25.18 ± 0.16 b
C18:2n-647.84 ± 0.22 a35.43 ± 0.69 b
C18:3n6nd19.79 ± 0.65 b
C18:3 0.22 ± 0.06 a0.54 ± 0.05 a
C20:03.27 ± 0.1 a0.25 ± 0.04 b
C20:1nd2.90 ± 0.22 b
nd—not detected; values designated by different small letters in the columns of the table are significantly different (α = 0.05).
Table 3. Primary physicochemical parameters in industrial oils.
ParameterUnitVegetable Oils
Milk Thistle Borage
H2O%0.088 ± 1.230.075 ± 1.15
P mg·kg−147.7 ± 2.31 a33.1 ± 2.28 b
ANmgKOH·g−15.17 ± 0.21 a3.9 ± 0.05 b
PVmmolO2·kg−14.22 ± 0.02 a2.83 ± 0.01 b
NJg I2·100 g−1 121.47 ± 0.25 a137.67 ± 2.52 b
Induction Timeh4.53 ± 0.034.28 ± 0.03
FFA%5.2 ± 0.51 a1.9 ± 0.17 b
Values designated by different small letters in the columns of the table are significantly different (α = 0.05).
Table 4. Content of total chlorophylls and carotenoids in the oils.
Parameter UnitVegetable Oils
Milk Thistle Borage
Chlorophyll mg·kg−12.68 ± 0.03 a3.63 ± 0.03 b
Carotenoids49.85 ± 0.11 a42.23 ± 0.35 b
Flavonoids 4.45 ± 0.043.96 ± 0.04
Polyphenolsmg GAE·g−1 oil7.18 ± 0.054.19 ± 0.07
Values designated by different small letters in the columns of the table are significantly different (α = 0.05).
Table 5. Phytochemical compounds with antioxidant effects in oils.
Vegetable OilsTocopherols DPPH
αβγδTotal
mg·kg−1mgTrolox·100 g−1
Milk thistle275.70 ± 0.40nd61.50 ± 0.30 a14.23 ± 0.15351.43 a1.83 ± 0.04
Boragendnd94.07 ± 0.25 b14.23 ± 0.42108.3 b1.54 ± 0.03
nd—not detected; values designated by small letters in the columns of the table are significantly different (α = 0.05).
Table 6. Colour coordinates for milk thistle and borage oils.
L* a* b* cH
Milk thistle 51.37 ± 0.594.59 ± 0.4129.26 ± 0.4329.62 ± 0.4381.09 ± 0.80
Borage 60.74 ± 0.350.95 ± 0.3126.20 ± 0.5726.22 ± 0.5787.91 ± 0.70
Table 7. Sterol and squalene content (mg·100 g−1 oil) in oils.
Vegetable Oils
Sterols Milk ThistleBorage
Δ5-Campestanol81.19 ± 0.02 a23.05 ± 0.13 b
Campestanol5.47 ± 0.13nd
Δ5-Stigmasterol21.38 ± 0.07 a7.71 ± 0.03 b
Clerosterol1.69 ± 0.04nd
β-Sitosterol148.78 ± 0.50 a133.02 ± 1.14 b
Sitostanol4.24 ± 0.02nd
Δ5-Avenasterol1.45 ± 0.01 a73.94 ± 0.03 b
Δ5-24-Stigmastadienol3.9 ± 0.02nd
Δ7-Stigmasterol41.19 ± 0.04 a21.8 ± 0.04 b
Cholesterol 38.23 ± 0.03nd
Brassicasterolnd0.33 ± 0.02
Δ7-Avenasterolnd1.48 ± 0.02
Total347.52 a261.33 b
Squalene78.23 ± 0.07 a39.76 ± 0.05 b
nd—not detected; values designated by different small letters in the columns of the table are significantly different (α = 0.05).
Table 8. Results of Pearson’s linear correlation coefficient analysis at the p < 0.05 significance level.
FactorsPhosphorusC16:0Oxidative StabilityANPVNJFFA
Tocopherol α−0.9090.8630.9860.999−0.999−0.984−0.998
Tocopherol γ0.913−0.857−0.986−0.9990.9990.9840.998
Tocopherol δ0.909−0.863−0.986−0.9990.9990.9840.998
Sterols −0.9510.7730.9760.982−0.982−0.959−0.980
Polyphenols −0.9040.8770.9870.999−0.999−0.980−0.997
DPPH−0.9510.7700.9760.982−0.982−0.959−0.980
Flavonoids−0.9250.8310.9840.995−0.993−0.989−0.995
Squalene−0.9090.8630.9860.999−0.999−0.984−0.998
Carotenoids−0.9050.8780.9910.998−0.999−0.977−0.995
Chlorophyll 0.919−0.866−0.989−0.9990.9990.9780.996
Table 9. Locations of FTIR absorption band maxima and assignment of particular vibrations to the respective samples, borage oil and milk thistle oil, registered within the spectral range of 800–3200 cm−1 [24,27,28,29,30,31,32,33,34,35,36].
FTIRType and Origin of Vibrations
Band Location (cm−1)
Borage OilMilk Thistle Oil
30053005ν(=C-Hm, cis-)
29512950νas(-CH2) and νs(-CH2) (aliphatic groups in triglycerides)
29182918
28522852
17411741ν(-C=Ovst) in esters
ν(-C=Ovw) in acids
17031704
16461646νvw(-C=C-, cis-)
14581458δvw(-C-H) in CH2 and CH3 groups, deformation (scissor) and νvw(-C-H, cis-) deformation (wagging)
13721372νw, m, vw(-C-H, -CH3) and deformation
13151315δm(-C-H, -CH3)
12731273νm(-C-O) or δm(-CH2-)
12301230
11551155νst(-C-O) or δst(-CH2-)
11371137
10931093νm,vw(-C-O)
1050–9001050–900δw(-HC=CH-, trans-) out-of-plane deformation or δ(-(CH2)n- and –HC=CH- (cis-) deformation (scissor)
ν—stretching vibrations, δ—deformation vibrations, s—symmetric, as—asymmetric, st—strong, w—weak.
Disclaimer/Publisher’s Note: The statements, opinions and data contained in all publications are solely those of the individual author(s) and contributor(s) and not of MDPI and/or the editor(s). MDPI and/or the editor(s) disclaim responsibility for any injury to people or property resulting from any ideas, methods, instructions or products referred to in the content.

