Article

Application of Thermoelectric Generators for Low-Temperature-Gradient Energy Harvesting

1
Electrical and Electronics Engineering Departments, Universitat Politècnica de Catalunya, Rambla Sant Nebridi 22, 08222 Terrassa, Spain
2
SBI Connectors, Sant Esteve Sesrovires, Albert Einstein, 5, 08635 Sant Esteve Sesrovires, Spain
*
Author to whom correspondence should be addressed.
Appl. Sci. 2023, 13(4), 2603; https://doi.org/10.3390/app13042603
Submission received: 14 December 2022 / Revised: 15 February 2023 / Accepted: 16 February 2023 / Published: 17 February 2023
(This article belongs to the Section Energy Science and Technology)

Abstract

:
Thermoelectric generators (TEGs) convert a temperature difference into useful direct current (DC) power. TEGs are solid-state semiconductor devices that are generating a lot of interest for energy harvesting purposes in Internet of Things (IoT) applications. This paper analyzes the behavior of state-of-the-art TEGs designed for low temperature gradient operation, with special emphasis on IoT systems for health monitoring for high-voltage alternating current (AC) and DC applications. In such applications, the energy harvesting unit plays a leading role in supplying wireless sensors (WSs). An application example is also presented with the aim to monitor the health condition of devices installed in the tubular busbars found in electrical substations. Since substation busbars heat up due to the Joule effect, there is a small thermal gradient between the busbar and the ambient, so the TEG can convert this heat flow into useful DC energy to supply low-power WSs. This paper assesses the performance of different TEG devices for this application, where very low temperature gradients are expected. The results presented show that with temperature gradients as low as 5 °C it is possible to supply WSs.

1. Introduction

Transmission and distribution lines are the highways of today’s electrical systems, so it is vital to maximize their reliability, efficiency, and stability, due to the enormous economic and social impacts they have. Transmission lines are found in semi-urban areas but also in remote regions, where regular inspections can be expensive and complex. These inspections are necessary to minimize the risk of transmission line failures due to the impact of different environmental factors such as ice, rain, wind or extreme temperatures on their operational performance. Therefore, self-powered wireless sensors can be of great help for real-time monitoring of transmission lines [1]. To supply these sensors, an energy harvesting unit is required, that is, a device for converting energy from the environment or other sources into electrical energy [2]. Energy harvesters allow extending the lifetime of battery-powered sensors because in many applications they minimize or avoid battery replacement and maximize the duration of their use [3]. In some cases, such as in battery-less autonomous systems, energy harvesters allow battery usage to be eliminated [4]. Therefore, energy harvesters minimize or eliminate battery replacement and associated maintenance costs [5].
In the case of overhead power lines, the temperature gradient between the ambient and conductor is limited, because overhead line conductors (OHLC) rating is typically 75 °C for conventional aluminum-conductor steel-reinforced conductors [6], while the maximum allowable temperature is about 90 °C [7]. The operating temperature and thus thermal stress of OHLCs are restricted to limit vertical sag clearance, elongation and creep, tensile loss, and maximize conductors’ lifespan [6]. Instead of conductors, the substations use aluminum tubular busbars, whose maximum operating temperature is lower than that of OHLCs [8,9]. Therefore, temperature gradients in the conductors and busbars of transmission systems are reduced.
IoT devices allow us to monitor different devices [10,11], thus facilitating the determination of their health condition. Today, there is an urgent need to have a better control of high-voltage transmission and distribution systems. It is accepted that by introducing low-cost wireless sensors (WSs) in this field, we can increase their stability, availability and reliability while allowing predictive maintenance strategies to be applied. Furthermore, transmission systems are found in remote areas [12], where human intervention is very difficult and expensive, so IoT-based solutions can be very useful. Thus, there is an increasing demand to monitor the health condition of such systems [13]. WSs found in IoT solutions typically include an energy harvesting unit, dedicated sensors and a communication module. It makes it possible to acquire the key parameters and send the information wirelessly to the cloud, where it can be monitored and analyzed in real time to facilitate the application of predictive maintenance plans [14]. A key element in WSs for IoT applications is the energy harvesting unit, which allows reduction of the carbon footprint by minimizing battery replacement and enabling the deployment of electronic sensors in inaccessible or hostile places [15]. Due to the lack of a time-varying magnetic or electric field, the development of energy harvesting systems for DC systems is more challenging, making the use of TEGs a necessity.
Due to the ohmic resistance, conductors are heated by the action of an electric current, which generates a temperature difference between the conductor and the environment [16]. This temperature gradient produces a heat flow that allows energy to be harvested [17]. When applied to power conductors or substation busbars, TEGs convert the temperature gradient between the environment and the conductor into electric energy, which can be used to supply autonomous sensors [18]. It is a recognized fact that due to the lack of a time-varying magnetic or electric field, in direct current (DC) systems it is more difficult to develop energy harvesting systems. However, due to their nature, TEGs allow us to bypass this difficulty, since heat is generated by the Joule effect in both DC and AC systems. Therefore, TEGs allow the design of energy harvesting units compatible with both DC and AC systems. Most commercial transmission line products are supplied by batteries and/or electromagnetic energy harvesters, so there are several works using TEGs for such applications. In [16], the possibility of using a TEG wrapped around the conductor to harvest the energy of the heat flux between the conductor and the environment is described. However, a heat exchanger connected to the cold side of the TEG is required to maximize the temperature gradient between the hot and cold ends. A similar approach was applied in [12] to power a wireless system mounted on a substation cylindrical busbar, which was composed of different sensors (voltage drop, current and temperature).
When applied to power lines, the intensity of the current has a profound impact on the temperature of the conductor. As in the case of other energy harvesting approaches, i.e., solar or wind, thermoelectric energy harvesting depends on environmental variables. Therefore, it is difficult to generate a stable supply of electrical power [19], as it is necessary to apply specific energy management strategies to ensure a stable and reliable generation of electrical energy [20].
This paper presents an experimental study of the generated power and the efficiency of TEG devices installed in tubular busbars, which are characteristic of electrical substations. Due to their large diameters, there is very little temperature gradient between the ambient and the busbar, generally a few degrees Celsius. This is a challenging application that has hardly been analyzed in the technical literature, since most TEG applications are focused on high temperature gradients [21]. Under such unfavorable conditions, the TEGs generate very low voltage, so a suitable DC/DC converter is required to supply the sensors and communications module. This work analyzes four different combinations of TEG–DC/DC converters, which are tested under realistic operating conditions and their efficiencies are analyzed.
This article is organized as follows. Section 2 reviews the basic principles of thermoelectric generators including aspects such as efficiency or their use in energy harvesting systems for transmission lines. Section 3 selects the most suitable TEG + DC/DC converter combination for this application from among four candidate options. Section 4 analyzes in depth the experimental behavior of the most appropriate TEG + DC/DC combination. Finally, Section 5 develops the conclusions of this work.

2. Basic Principles of Thermoelectric Generators

Thermoelectric energy harvesting is typically based on thermoelectric generators (TEGs), which, based on the Seebeck effect, directly convert a temperature gradient between their hot and cold ends into electrical energy [4,22]. As will be detailed in the next subsection, due to the inherent limitations of the thermoelectric conversion process, the efficiency of TEGs is always low, usually below 8–9%, and much less for small temperature gradients, since the efficiency is governed by the Carnot cycle [17].

2.1. The Seebeck Effect

Seebeck generators or thermoelectric generators (TEGs) are semiconductor devices designed to convert heat flow or a temperature gradient directly into DC electrical energy through the Seebeck effect. The Seebeck effect, which is due to the motion of charge carriers within semiconductors, produces an electromotive force (emf) across two points of a conductive material when there is a temperature gradient between these points.
Semiconductors are particularly appropriate for thermoelectric applications because the concentration of charge carriers can be changed by doping the material. In an n-type doped semiconductor, the charge carriers are mostly free electrons, while in a p-type doped semiconductor, the charge carriers are free holes, i.e., missing electrons in the valence band. The thermocouple (consisting of a p-type and an n-type semiconductor connected in series by a metal strip) is the basic building block of a TEG. Due to the temperature gradient, the charge carriers of the hot side have higher kinetic energy, so they diffuse from the hot to the cold side of the semiconductor. Eventually, the cold end of the TEG becomes positively (p-type semiconductor) or negatively (n-type semiconductor) charged, and the hot end negatively (p-type semiconductor) or positively (n-type semiconductor) charged [23]. Charges build-up at the cold end, creating an electromotive force (∆V or Seebeck voltage) [24] between the n-type and p-type hot ends of the semiconductors that is directly proportional to the temperature difference ∆T = ThotTcold between the hot and cold ends of the semiconductors, as shown in Figure 1. To boost the voltage and current generated, commercial TEGs include many pairs of n-type and p-type couples [21] connected in series and/or parallel to generate the desired electrical voltage and current. The couples are typically placed between two parallel ceramic plates, which provide a flat surface, structural rigidity, and an insulating layer to prevent short circuits.
TEGs offer several advantages, including reliability and quiet operation, since they are solid-state devices with no moving parts, are compact, do not emit greenhouse gases, can be mounted in any orientation, are scalable from μW to kW, and directly convert heat into electrical energy.

2.2. The Seebeck Coefficient

The Seebeck coefficient S is defined from the voltage ∆V produced due to a small temperature gradient (∆T = ThotTcold, between the two sides of the TEG) between the two semiconductor materials at the junction under open circuit conditions [21,27,28] as,
S = −ΔVT = −(VhotVcold)/(Thot − Tcold)
The voltage difference ∆V is due to the difference in the electrochemical potentials of the two semiconductor materials in contact [28]. Therefore, the Seebeck coefficient measures the magnitude of the thermoelectric voltage induced due to a temperature difference between the two materials. In general, the Seebeck coefficient depends on the molecular structure of the materials and on the absolute temperature.
For most semiconductor materials, the voltage ∆V generated due to the Seebeck effect is very low, on the order of a few tens or hundreds of μV/K. For example, for the commonly used Bi2Te3 semiconductor, the Seebeck coefficient S is 160 μV/K for p-type material and −170 μV/K for n-type material [29].
TEG materials must have high electrical conductivity to minimize the Joule effect, a large Seebeck coefficient for maximum conversion of heat to electrical energy, and low thermal conductivity to minimize thermal conduction through the material [21]. These properties are combined into a z-metric, the figure of merit, which quantifies the overall output of the TEG, and is defined as [30],
z = S2ρ−1κ−1 [K−1]
where ρ is the electrical resistivity and κ the thermal conductivity. The Seebeck coefficient S is typically determined over a 5–10 K range, so the figure of merit z is valid only for a small temperature difference [31]. The dimensionless figure of merit zT is commonly used to characterize TEG’s behavior [30],
zT = S2ρ−1κ−1T [−]
where T = (Thot + Tcold)/2 is the average temperature.
When assuming a one-dimensional steady state heat transfer process and no heat loss through the heat exchanger wall [32], uniform temperature distribution across each surface of the material [31], a rough estimation of the maximum thermo-electrical conversion efficiency of the TEG is determined by [30,31,33,34,35],
η T E G , m a x = T h o t T c o l d T h o t × 1 + z T 1 / 2 1 1 + z T 1 / 2 + T c o l d T h o t
where the term (ThotTcold)/ Thot is the Carnot efficiency.
According to (4), the efficiency of a TEG depends on the hot and cold junction temperatures and on the thermoelectric properties of the material through the merit factor zT. However, (4) only predicts ηmax accurately for small temperature differences ∆T = ThotTcold, or for materials with zT almost constant over a wide temperature range [36]. In practical scenarios, the efficiency of a TEG can be more complex when considering the thermal and electrical resistances, heat leakage, Thompson effect, and the temperature gradient in the heat sinks at the hot and cold ends of the TEG [37].
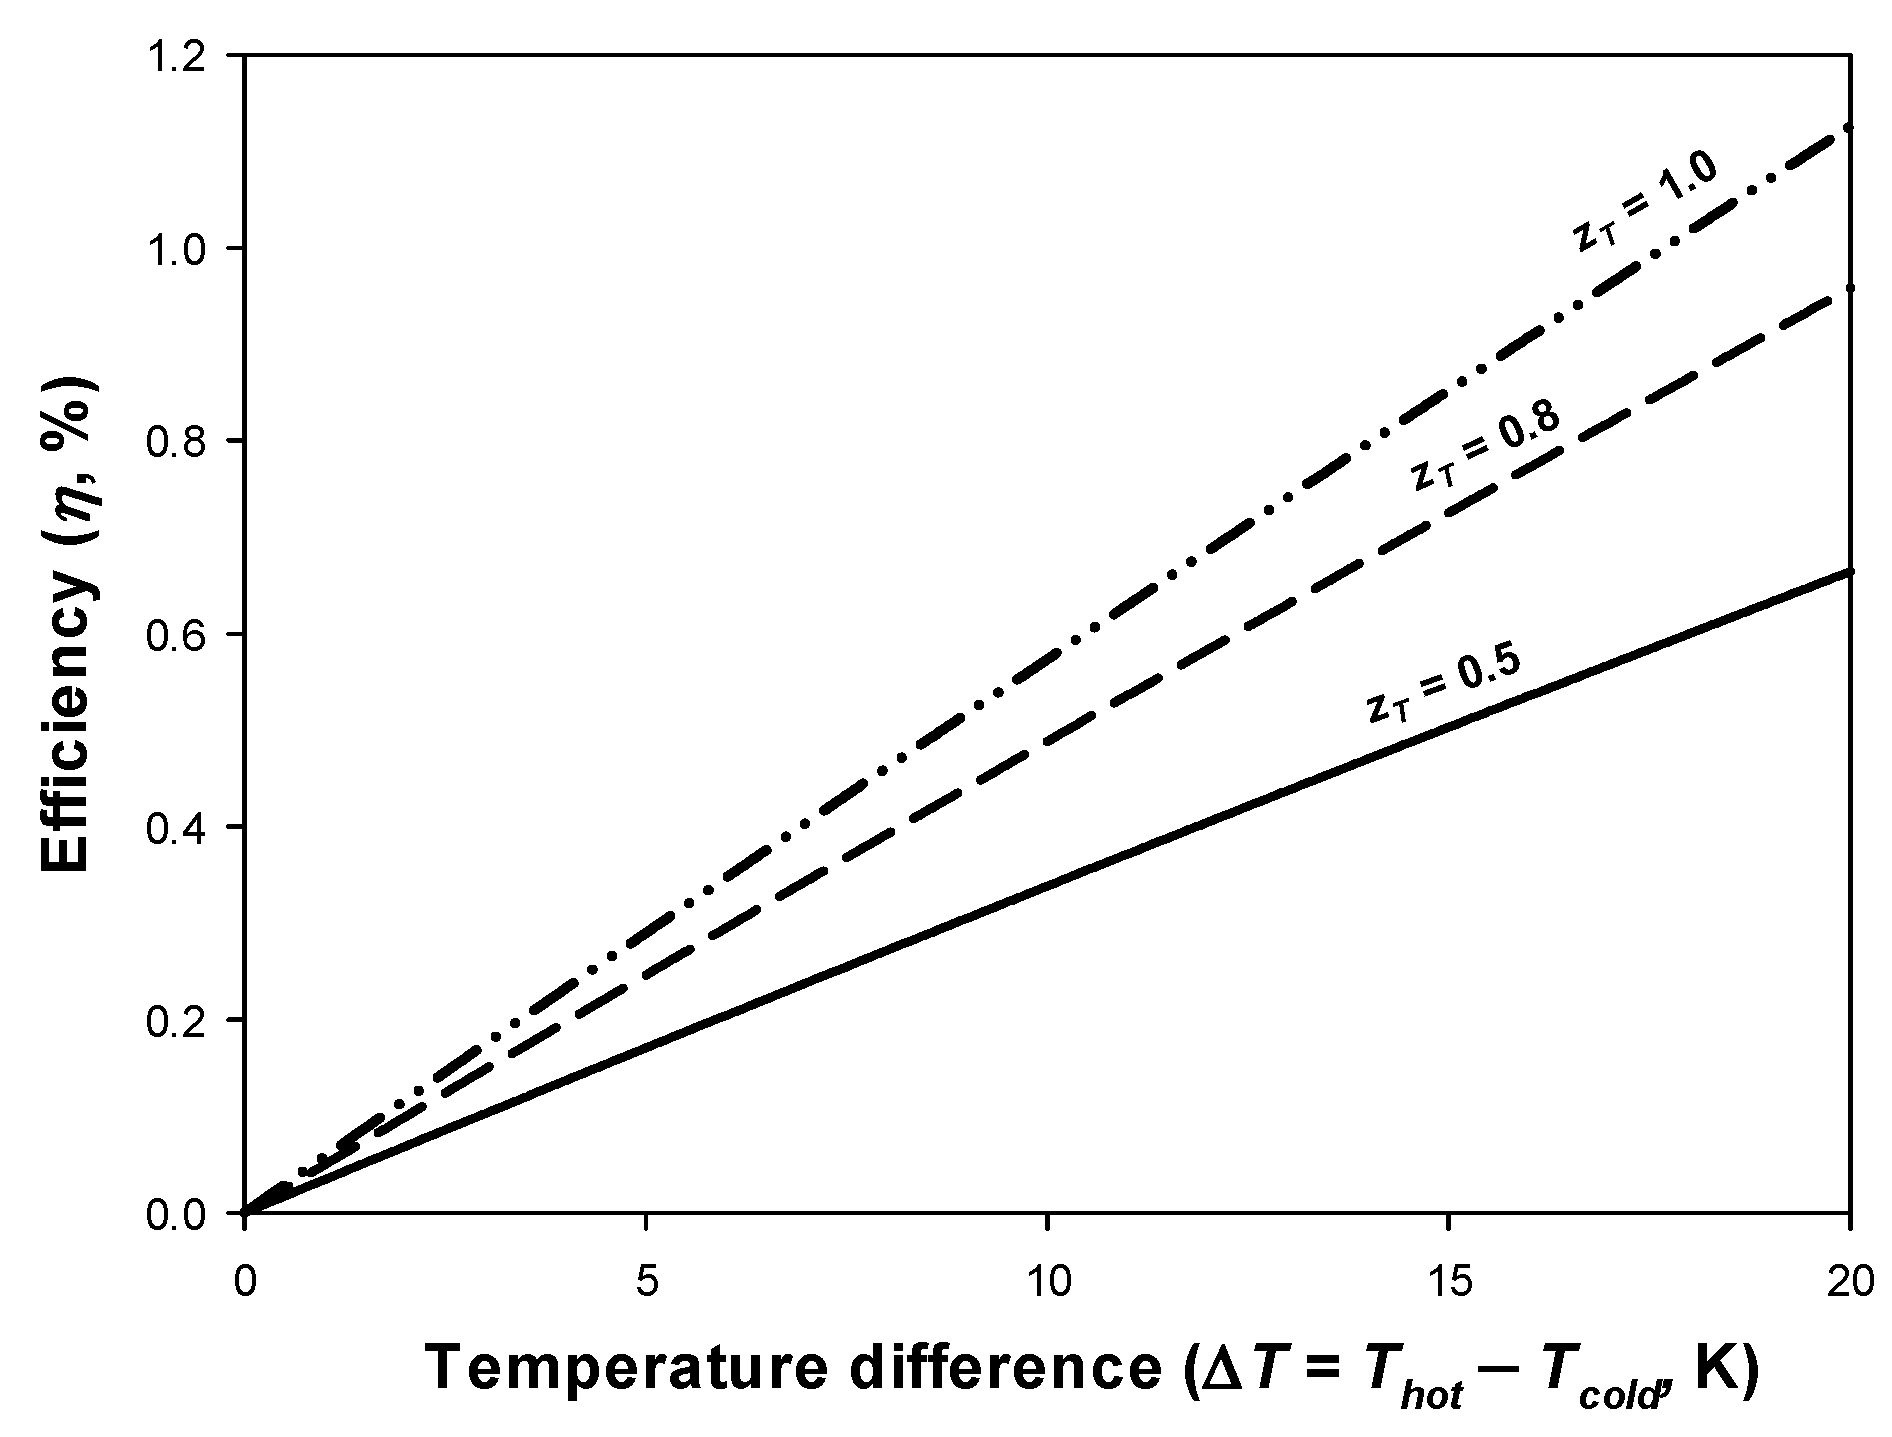
From (3) and (4), it is evident that the efficiency of TEGs depends on the properties of the internal semiconductor materials through the figure of merit and the temperature, so to improve the efficiency, materials with a high figure of merit are required. TEGs are mostly based on three semiconductor materials, i.e., Bi2Te3, PbTe and SiGe. The election of the material depends on the heat source characteristics, cold sink and TEG design. According to [38], the zT of most currently available thermoelectric materials is at most 1, although the bulk alloy of bismuth–antimony–telluride yields a p-type zT = 1.4 at 100 °C [31]. For example, in the case of Bi2Te3, the most used thermoelectric material, zT is in the range of 0.5–0.8. According to (3), the efficiency at ∆T = 300 K is 6.6–9.4%, for zT = 0.5 and zT = 0.8, respectively, whereas at ∆T = 10 K, the efficiency reduces to 0.34–0.49%, respectively, as shown in Figure 2. It should be noted that both tellurium and bismuth are relatively plentiful in the Earth’s crust [39]. Different solid-state thermoelectric materials are still being investigated to increase TEG efficiency, but have not been commercialized.
The power generated by the TEG can be calculated as [21],
P T E G = P t r a n s f e r × η T E G  
where Ptransfer [W] is the rate of heat transfer between the two sides of the TEG, which can be expressed as [35],
P t r a n s f e r = T h o t T c o l d R T E G  
where RTEG [°C/W] is the thermal resistance of the TEG.
According to [35], the maximum power that the TEG can generate corresponds to the point with half the short circuit current Isc and half the open circuit voltage Voc, thus resulting in,
P T E G , m a x = V o c 2 × I s c 2
Equation (7) is demonstrated in Figure 6.

3. Selection of the Best TEG + DC/DC Converter Combination

As explained, TEGs generate very low voltage under small temperature gradients, so a suitable DC/DC converter is required to supply the sensors and communications module in WSs. This section analyzes two TEGs specially designed for low temperature gradients and two DC/DC converters designed for very low input voltage. The performance of the four possible combinations between the selected TEGs and the DC/DC converters summarized in Table 1 under very low temperature gradients is also studied. The results obtained will allow selection of the most appropriate combination to supply the low power WSs electronics.

3.1. Experimental Setup

After a careful literature review, two commercial low-temperature TEGs and two commercial DC/DC converters were selected, which are compared in this paper. As the output voltage generated by the TEGs is in the range of some mV, two DC/DC converters with extreme low startup voltage were selected to amplify the voltage from the millivolt range to the volt range to supply WSs.
Table 2 and Table 3 present the main characteristics of the TEGs and DC/DC converters.
To compare the behavior of the different TEGs, they were placed on the top of a flat aluminum busbar, which was exposed to heat cycle tests. To this end, six resistances (HS50 1R F from ARCOL,1 Ω, 50 W) connected in series to a BK9205 power supply (BK Electronics, Southend On Sea, England) were used, jointly with two TEGs connected in series, as shown in Figure 3. A rechargeable BM2000C1450AA2S1PATP Nickel battery from GlobTek (GlobalTek, Miami, FL, USA) was also used to store the energy generated by the TEGs and converted by the DC/DC converter.
To study the performance and efficiency of thermoelectric energy harvesting systems, it is necessary to determine the input/output power of TEG modules and DC/DC converters. Two Fluke 289 data-logger multimeters (Fluke, Everett, WA, USA) were used in ammeter mode to measure the value of the small currents generated by the TEGs (microamp to milliamp range) due to the low temperature gradients analyzed. An NI USB-6210 data acquisition system (National Instruments, Austin, TX, USA) was used to acquire the voltages from the output terminals of the TEG module and the DC/DC converter. Three T-type thermocouples together with an NI-9211 thermocouple acquisition module (National Instruments, Austin, TX, USA) were used to measure the ambient temperature and the temperatures of the hot and cold sides of the TEGs. To ensure a simultaneous acquisition, the Fluke multimeters, the NI USB-6210 and NI-9211 modules were synchronized using a Python code programmed by the authors of this work.
A thermal joint compound (120-SA, Wakefield-Vette, NH, USA) was used to ensure good thermal contact between the heat source, TEG and heat sink. This compound fills the tiny air gap between mating surfaces with a grease-like paste containing zinc oxide in a silicone oil carrier. It is used for several reasons such as its ability to fill the air gap between different surfaces, its high thermal conductivity and its adhesive ability.

3.2. Experimental Tests

The tests were carried out indoors at an ambient temperature of about 20 °C. The TEGs were mounted on a flat rectangular aluminum busbar that was heated from room temperature to approximately 50 °C using a power supply and heating resistors, as shown in Figure 3. Next, to determine the performance of the devices during the cooling phase, the power supply was disconnected, whereby the aluminum bar cooled by natural convection. The electrical output power of the TEGs and DC/DC converters was determined by multiplying the respective voltages and currents.
Figure 4 shows the performance of TEG #1 combined with DC/DC converter #1. According to Figure 4b,c, with the same temperature difference between the busbar and the ambient, more power is generated during the heating cycle than during the cooling cycle. This hysteresis response is mainly due to the delayed thermal diffusion from the ceramic plate to the hot junction of the TEGs [40].
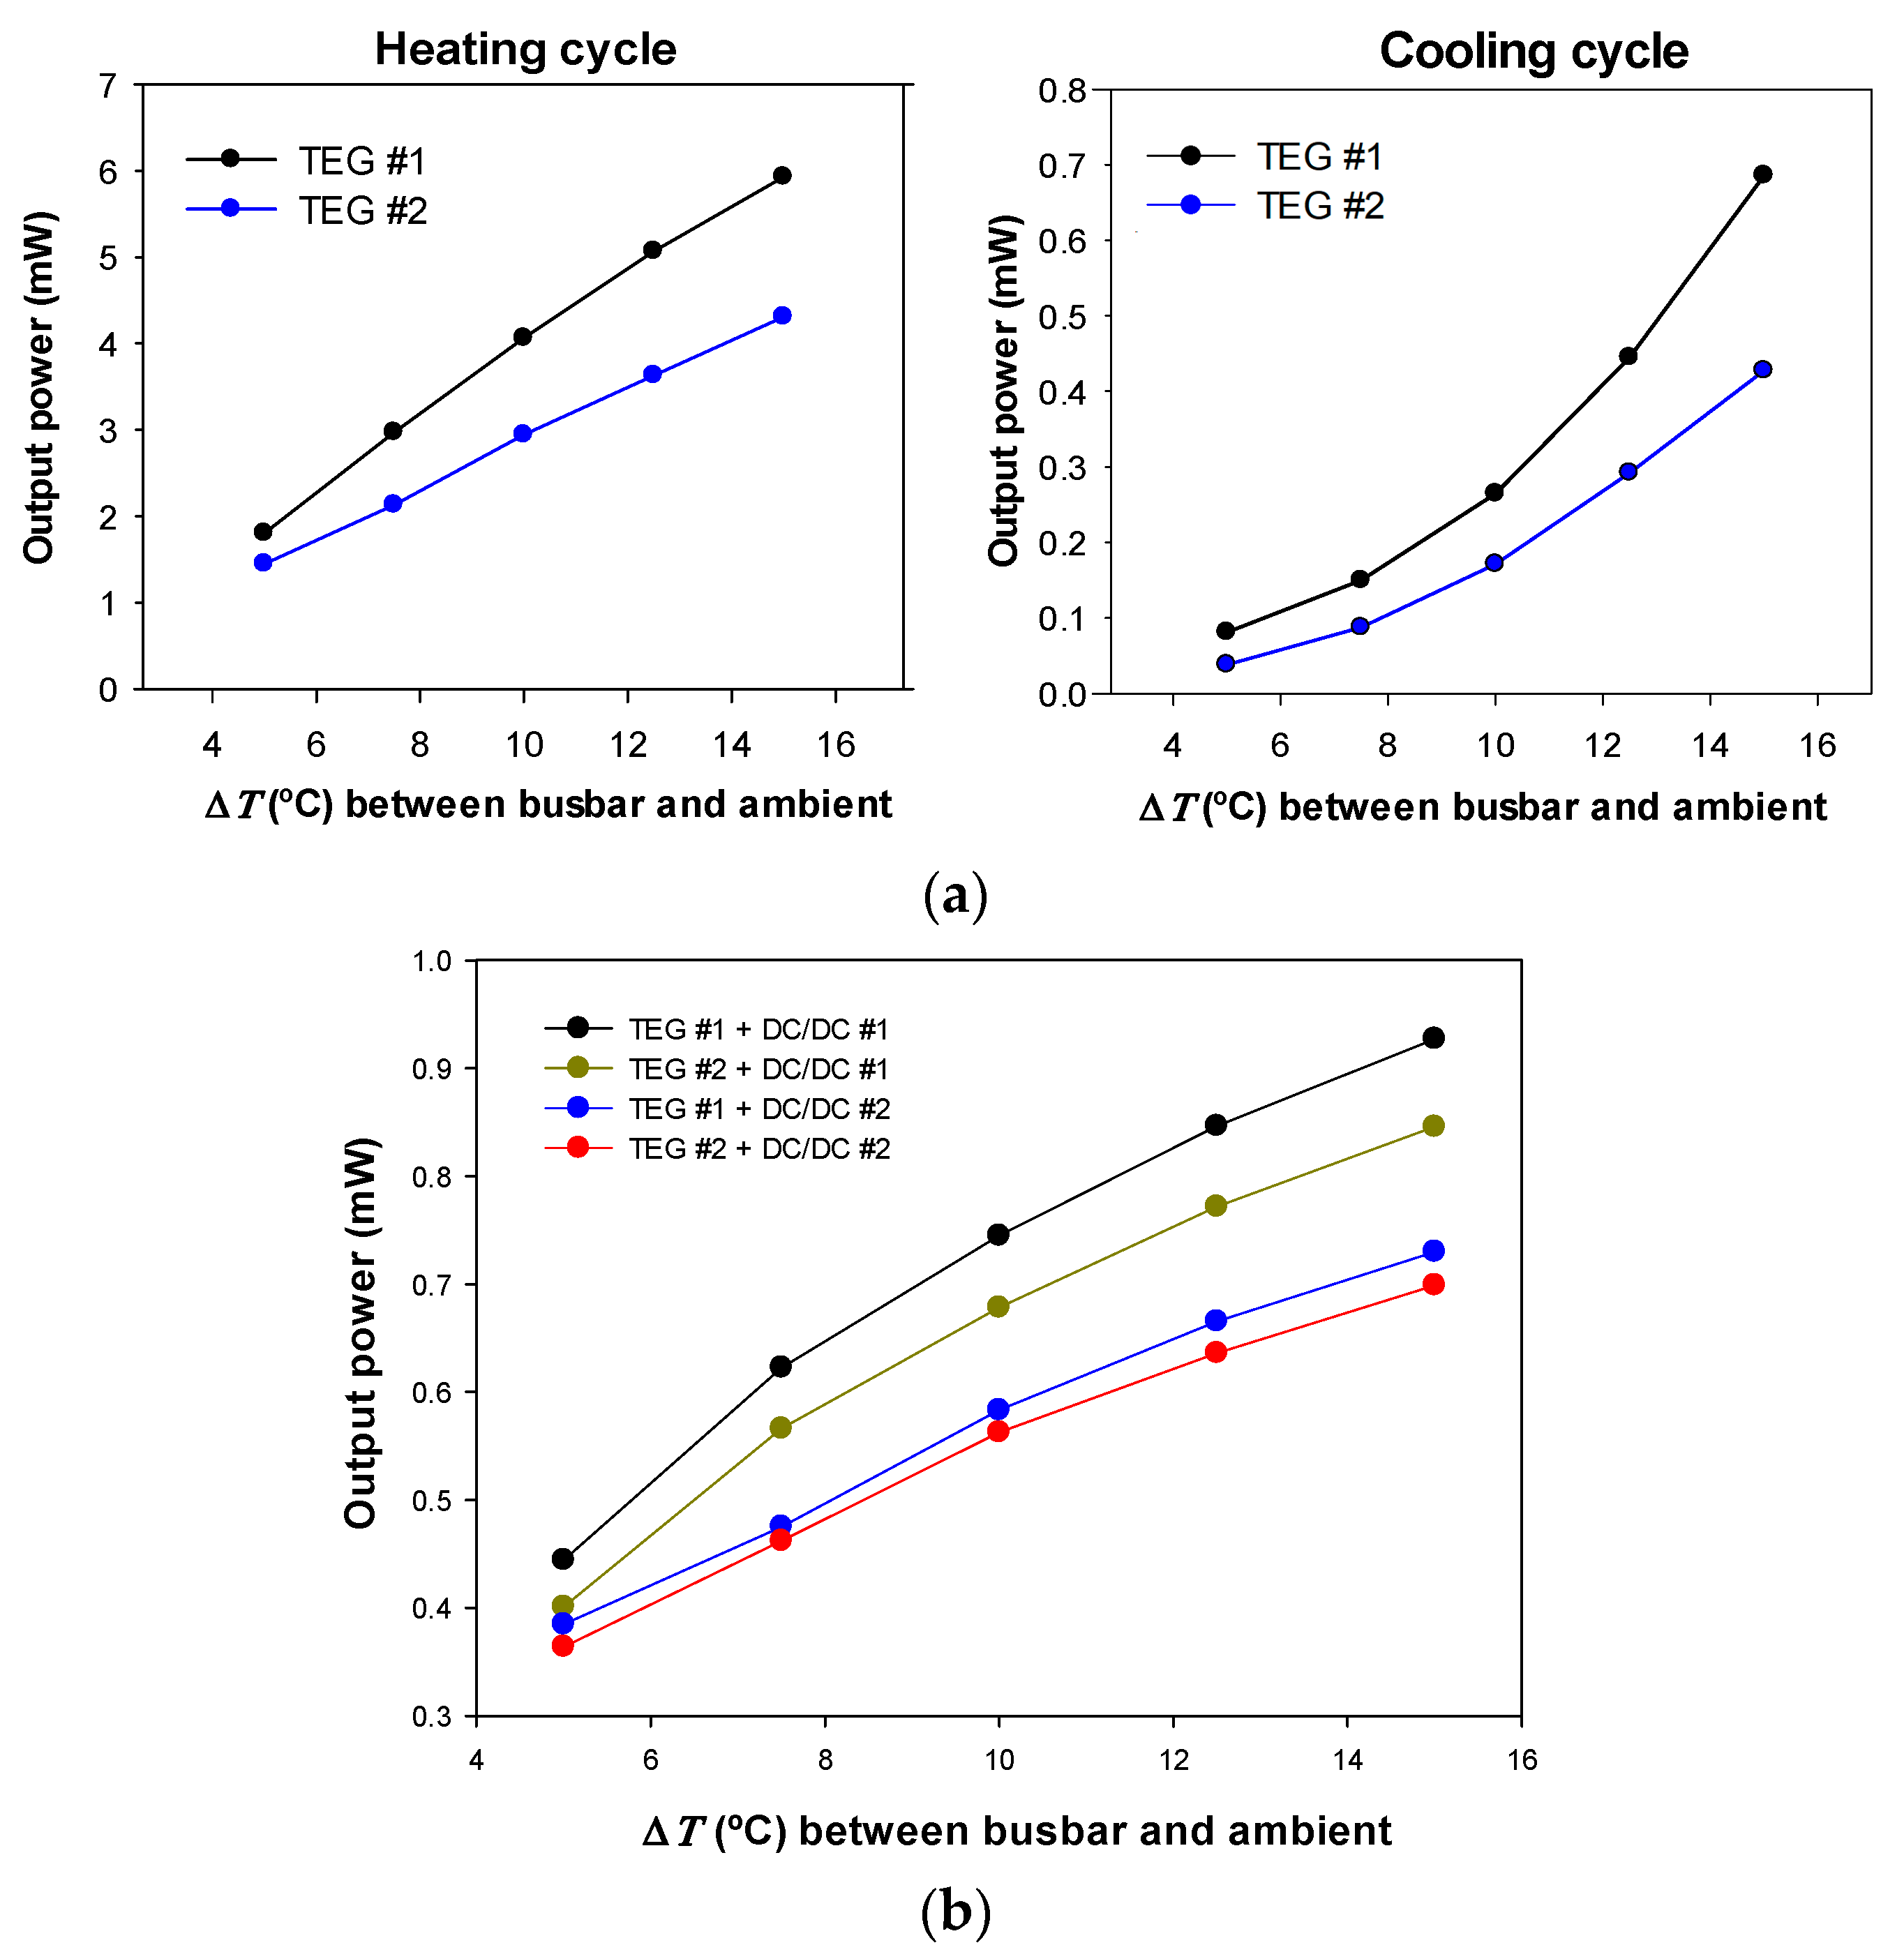
Figure 5 shows the experimental performance of each TEG, DC/DC converter and the different combinations of TEG + DC/DC converter. It is noted that the TEG #1 + DC/DC converter #1 combination has a better performance than the others, this being the most suitable combination for applications with very low temperature gradients. Therefore, the next sections take a closer look at the TEG #1 + DC/DC converter #1 combination.

3.3. Characterization of TEG #1

First, the characteristic voltage—current and power—current curves of TEG #1 were obtained by heating the busbar. The hot and cold side temperatures of the TEG were 67.7 °C and 57.8 °C, respectively, with an ambient temperature of 21.5 °C. This corresponds to a temperature gradient ∆T = ThotTcold ≈ 10 °C between the hot and cold sides of the TEG. During the tests, a variable resistor was connected between the terminals of TEG #1, and the voltage V and current I flowing through its terminals were measured. These values are shown in Figure 6 together with the PI fit, where P = V·I.
Table 4 summarizes the main parameters of the test performed to determine the VI and P − I characteristics of TEG #1.
The results presented in Figure 6 and Table 4 show that the power that can be drawn from the TEG is highly dependent on the resistance of the load, so the use of a DC/DC converter that includes a maximum power point tracker (MPPT) could be beneficial.

4. Efficiency Determination of the Best Combination of TEG + DC/DC Converter

This section discusses in detail the efficiency of the best combination of TEG + DC/DC converter, that is, TEG #1 + DC/DC converter #1. For this, the assembly shown in Figure 7 is analyzed, which corresponds to a realistic situation. The TEG #1 + DC/DC converter #1 combination is mounted on a stainless steel tubular hollow conductor with an inner diameter of 120 mm and a wall thickness of 0.4 mm. Using this configuration, the steady-state performance of TEG #1 + DC/DC converter # 1 is studied.
To calculate the efficiency of the entire TEG #1 + DC/DC converter #1 system ηTEG+DC/DC, the individual efficiencies of the TEG ηTEG and the DC/DC converter η DC/DC are required. According to IEEE Std. 605 [41] describing the design of busbars in air insulated substations, indoors and under steady state conditions, the heat gain per unit length due to Joule losses must compensate the terms of heat loss per unit length due to convective and radiative cooling as,
I R M S 2 r a c ( T ) = p c + p r   [ W / m ]
where IRMS (A) is the current through the busbar, rac(T) [Ω/m] is the ac resistance of the conductor per unit length at the operating temperature T, and pc [W/m] and pr [W/m] are, respectively, the losses due to natural convection and radiation.
The ac resistance per unit length of the conductor, rac [Ω/m], was measured according to the method described in [7,13]. This method requires measuring the voltage drop ∆V1m [V] between two points of the conductor surface separated by 1 m, the ac current I [A] flowing through the conductor, the phase shift φ [rad] between the voltage drop and the current, and the conductor temperature T [°C],
r a c ( T ) = Δ V 1 m I × cos φ   [ Ω / m ]
To calculate the efficiency of entire system, including the TEG and the DC/DC converter, ηTEG+DC/DC, the individual efficiencies of the TEG, ηTEG, and the DC/DC converter, ηDC/DC, are needed. The efficiency of the TEG ηTEG can be calculated as the ratio between the electrical power generated by the TEG, Pelectric,TEG [W], and the Joule heat generated by the conductor in the area of the TEG (80 mm × 40 mm), PJoule,TEG-area [W], as,
η T E G = P e l e c t r i c , T E G P J o u l e , T E G a r e a
PJoule,TEG-area can be calculated as,
P J o u l e , T E G a r e a = P J o u l e , c o n d u c t o r × A T E G A C o n d u c t o r       [ W ]
where ATEG [m2] and AConductor [m2] are the area of the outer surfaces of the TEG and conductor, respectively, while PJoule,conductor [W] is the heat generated in the conductor.
The efficiency of the DC/DC converter can be calculated as,
η D C / D C = V o u t × I o u t V i n p × I i n p       [ - ]
where Vout, Iout, Vinp, and Iinp are, respectively, the output and input voltages and currents of the DC/DC converter.
Figure 7 also shows the heat sinks (height = 25 mm, base length = 38 mm, top fin field length = 65 mm, and width = 40 mm) attached to each TEG.

4.1. Steady State Performance of TEG #1

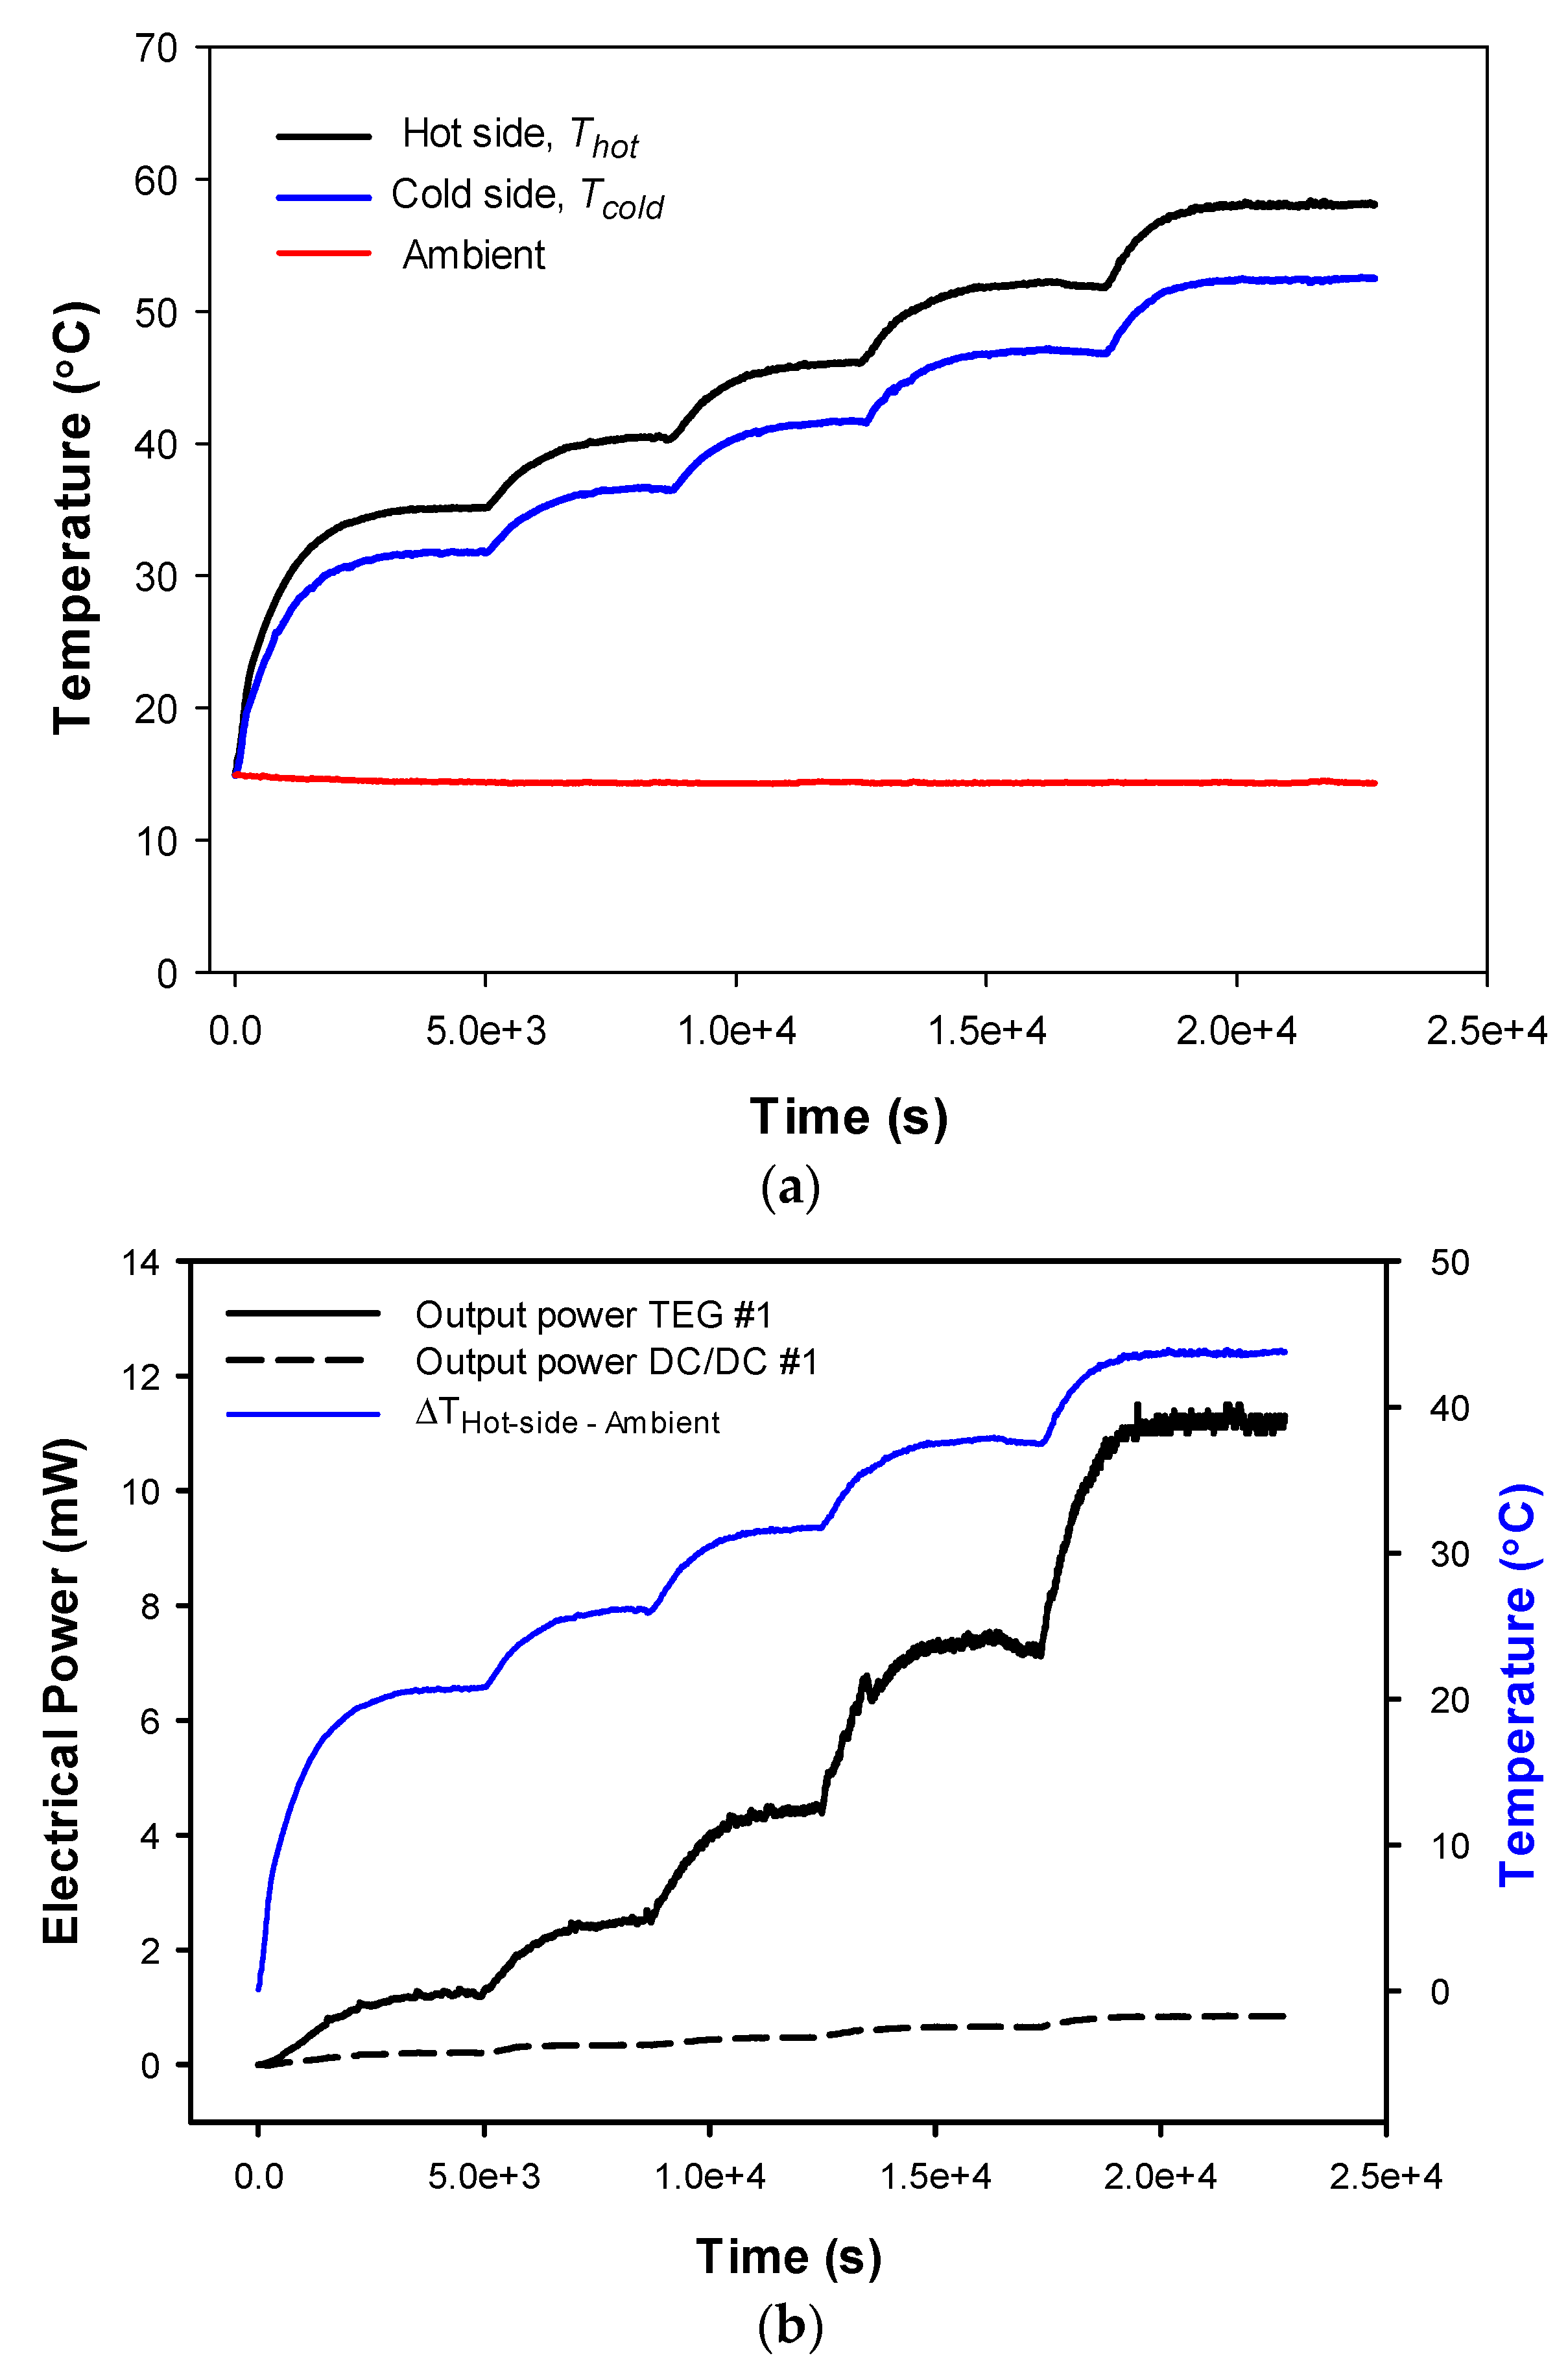
Using the setup shown in Figure 7, a second experiment was carried out on the 120 mm diameter tubular conductor to characterize the steady state performance of TEG #1. Five levels of current (136 A, 169 A, 194 A, 226 A and 254 A) were injected to heat the tubular conductor to steady state.
Figure 8a shows the evolution of the temperature with time of the hot side and the cold sides of TEG #1, while Figure 8b shows the evolution with time of the output electrical power of TEG # 1 and DC/DC converter #1.
To determine the I R M S 2 r a c ( T ) Joule heating in (8), rac as a function of temperature is required. For this purpose, an offline experiment was carried out, measuring the voltage drop, the current flowing throng the tubular conductor, the conductor temperature and cosφ. The results obtained are summarized in Table 5.
Table 6 summarizes the results obtained with the entire system, including the tubular bus bar, TEG #1 and DC/DC converter #1. It shows that when current applied is, for example, I = 254 Arms, the steady state temperature difference between the hot side of TEG #1 and the ambient is ∆THot-Ambient = 43.7 °C, while the temperature difference between the hot and cold sides of TEG #1 is ∆THot-Cold = 5.67 °C. In this steady-state condition, the output power of TEG #1 and DC/DC converter#1 are, respectively, Pelectric,TEG = 11.2 mW and PDC/DC= 0.84 mW. They correspond to efficiencies of TEG #1, ηTEG, and TEG#1 + DC/DC #1, ηTEG+DC/DC, of 0.36% and 0.027%, respectively. Although the overall efficiency is quite low, the output power of the whole system, which is in the order of 0.84 mW for ∆THot-Cold = 5.67 °C, is enough to supply low power WSs. According to a previous study [12], and supposing a communication cycle of 5 s using a Bluetooth low energy module and three sensors (temperature, current and voltage), on average, each communication cycle consumes an energy of 0.16 J. Therefore, according to Table 6, when ∆T = 5.05 °C, PDC/DC = 0.66 mW, so in 1 h, about 2.4 J are harvested, so, this energy is enough for 10–15 communication cycles per hour. This is not a problem in many applications, because WSs typically operate in an intermittent on–off pattern [42].

4.2. Cold Starting

Conventional circuits are based on active circuits that require some level of energy to operate. In the cold start scenario, there is not enough stored energy to supply the circuit components, so the system cannot harvest energy and is stuck in a shutdown state. Circuits with cold starting capability allow scavenging energy in these critical situations, when the storage element is completely depleted. Cold start situations can occur after manufacturing, when the circuit has never been powered on, or when the storage element is completely depleted after prolonged periods of power shortage.
This paper also analyzes the cold start capability of the proposed energy harvesting solution by charging a battery pack with two NiMH cells in series (BM2000C1450AA2S1PATP nickel battery, GlobTek) that were discharged during a previous experiment. The initial voltage between the terminals of the two cells was 1.85 V, or 0.925 V per cell, which corresponds to a discharged condition, since NiMH batteries are considered discharged below 1 V per cell [43]. Figure 9 shows the output voltage generated by TEG #1 and the battery voltage during a cold start situation, where it can be seen that the system is capable of charging the batteries.

5. Conclusions

IoT devices with data acquisition and processing capabilities offer solutions for health condition monitoring, which require on-line data monitoring. However, in high-voltage substations applications, as they are often in remote locations and due to harsh environments, the application of these smart devices remains a challenging task. Therefore, a proper and maintenance-free energy harvesting system is required. Thermal energy harvesting has become a hot topic due to the minimal maintenance required, compactness, and solid-state nature. This research work has analyzed different thermal energy harvesting systems and has conducted several experiments to characterize the behavior of each system for high-voltage transmission applications characterized by very low temperature gradients. This work has analyzed the performance of state-of-the-art of TEGs designed to operate with low temperature gradients intended for IoT systems to be applied in AC and DC tubular busbars found in high-voltage substations. Since the tubular busbars are heated by the Joule effect, there is a small temperature difference between the busbar and the ambient, so the TEG converts this heat flow into useful energy, which is used to supply low-power WSs by means of a DC/DC converter. The results presented in this paper have shown that if a temperature difference of around 5 K can be maintained between the hot and cold sides of the thermoelectric power generation modules, it will drive WSs using two 40 mm × 40 mm modules.

Author Contributions

Conceptualization, Y.L., M.M.-E. and J.-R.R.; methodology, J.-R.R.; software, Y.L.; validation, Y.L. and J.S.; formal analysis, M.M.-E. and J.-R.R.; investigation, Y.L., M.M.-E. and J.-R.R.; resources, J.S., M.M.-E. and J.-R.R.; writing—original draft preparation, Y.L. and J.-R.R.; writing—review and editing, M.M.-E.; supervision, J.S. and M.M.-E.; All authors have read and agreed to the published version of the manuscript.

Funding

This research was funded by Generalitat de Catalunya, grant numbers 2021 SGR 00392 and 2020 DI 007.

Institutional Review Board Statement

Not applicable.

Informed Consent Statement

Not applicable.

Data Availability Statement

Not applicable.

Conflicts of Interest

The authors declare no conflict of interest.

References

  1. Chen, X.; Sun, L.; Zhu, H.; Zhen, Y.; Chen, H. Application of Internet of Things in Power-Line Monitoring. In Proceedings of the 2012 International Conference on Cyber-Enabled Distributed Computing and Knowledge Discovery, Sanya, China, 10–12 October 2012; pp. 423–426. [Google Scholar] [CrossRef]
  2. Eunice Akin-Ponnle, A.; Borges Carvalho, N.; Poniszewska-Maranda, A.; Maranda, W. Energy Harvesting Mechanisms in a Smart City—A Review. Smart Cities 2021, 4, 476–498. [Google Scholar] [CrossRef]
  3. Liu, Y.; Khanbareh, H.; Halim, M.A.; Feeney, A.; Zhang, X.; Heidari, H.; Ghannam, R.; Correspondence, R.; Ghannam, J. Piezoelectric energy harvesting for self-powered wearable upper limb applications. Nano Sel. 2021, 2, 1459–1479. [Google Scholar] [CrossRef]
  4. Prajwal, K.T.; Manickavasagam, K.; Suresh, R. A review on vibration energy harvesting technologies: Analysis and technologies. Eur. Phys. J. Spéc. Top. 2022, 231, 1359–1371. [Google Scholar] [CrossRef]
  5. Verma, G.; Sharma, V. A Novel RF Energy Harvester for Event-Based Environmental Monitoring in Wireless Sensor Networks. IEEE Internet Things J. 2022, 9, 3189–3203. [Google Scholar] [CrossRef]
  6. Mohd Zainuddin, N.; Abd Rahman, M.S.; Ab Kadir, M.Z.A.; Nik Ali, N.H.; Ali, Z.; Osman, M.; Mansor, M.; Mohd Ariffin, A.; Syahmi, M.; Nor, S.F.M.; et al. Review of Thermal Stress and Condition Monitoring Technologies for Overhead Transmission Lines: Issues and Challenges. IEEE Access 2020, 8, 120053–120081. [Google Scholar] [CrossRef]
  7. Liu, Y.; Riba, J.-R.; Moreno-Eguilaz, M.; Sanllehí, J. Analysis of a Smart Sensor Based Solution for Smart Grids Real-Time Dynamic Thermal Line Rating. Sensors 2021, 21, 7388. [Google Scholar] [CrossRef]
  8. Risdiyanto, A.; Arifin, M.; Khayam, U. Suwarno Study on temperature distribution at busbar connection based on contact resistance of different plating contact surface. In Proceedings of the 2013 Joint International Conference on Rural Information & Communication Technology and Electric-Vehicle Technology (rICT & ICeV-T), Bandung, Indonesia, 26–28 November 2013. [Google Scholar] [CrossRef]
  9. Kadechkar, A.; Capelli, F.; Riba, J.-R.; Moreno-Eguilaz, M. Feasibility Study on Thermal Energy Harvesting for Low Powered Electronics in High-Voltage Substations. In Proceedings of the IECON 2018—44th Annual Conference of the IEEE Industrial Electronics Society, Washington, DC, USA, 21–23 October 2018; pp. 4224–4229. [Google Scholar] [CrossRef]
  10. Bellini, P.; Nesi, P.; Pantaleo, G. IoT-Enabled Smart Cities: A Review of Concepts, Frameworks and Key Technologies. Appl. Sci. 2022, 12, 1607. [Google Scholar] [CrossRef]
  11. Al Mamun, A.; Yuce, M.R. Sensors and Systems for Wearable Environmental Monitoring Toward IoT-Enabled Applications: A Review. IEEE Sens. J. 2019, 19, 7771–7788. [Google Scholar] [CrossRef]
  12. Kadechkar, A.; Riba, J.-R.; Moreno-Eguilaz, M.; Perez, J. SmartConnector: A Self-Powered IoT Solution to Ease Predictive Maintenance in Substations. IEEE Sens. J. 2020, 20, 11632–11641. [Google Scholar] [CrossRef]
  13. Kadechkar, A.; Moreno-Eguilaz, M.; Riba, J.-R.; Capelli, F. Low-Cost Online Contact Resistance Measurement of Power Connectors to Ease Predictive Maintenance. IEEE Trans. Instrum. Meas. 2019, 68, 4825–4833. [Google Scholar] [CrossRef] [Green Version]
  14. Vitolo, P.; De Vita, A.; Di Benedetto, L.; Pau, D.; Licciardo, G.D. Low-Power Detection and Classification for In-Sensor Predictive Maintenance Based on Vibration Monitoring. IEEE Sens. J. 2022, 22, 6942–6951. [Google Scholar] [CrossRef]
  15. Riba, J.-R.; Moreno-Eguilaz, M.; Bogarra, S. Energy Harvesting Methods for Transmission Lines: A Comprehensive Review. Appl. Sci. 2022, 12, 10699. [Google Scholar] [CrossRef]
  16. Schlechter, T. Energy Harvesting Approaches for Wireless Sensor Nodes In High Voltage Direct Current Systems. In Proceedings of the 2019 IEEE 5th World Forum on Internet of Things (WF-IoT), Limerick, Ireland, 15–18 April 2019; pp. 243–246. [Google Scholar] [CrossRef]
  17. Moghe, R.; Yang, Y.; Lambert, F.; Divan, D. A scoping study of electric and magnetic field energy harvesting for wireless sensor networks in power system applications. In Proceedings of the 2009 IEEE Energy Conversion Congress and Exposition, San Jose, CA, USA, 20–24 September 2009; pp. 3550–3557. [Google Scholar]
  18. Sudevalayam, S.; Kulkarni, P. Energy Harvesting Sensor Nodes: Survey and Implications. IEEE Commun. Surv. Tutorials 2011, 13, 443–461. [Google Scholar] [CrossRef] [Green Version]
  19. Cetinkaya, O.; Akan, O.B. Electric-Field Energy Harvesting in Wireless Networks. IEEE Wirel. Commun. 2017, 24, 34–41. [Google Scholar] [CrossRef] [Green Version]
  20. Guo, F.; Hayat, H.; Wang, J. Energy harvesting devices for high voltage transmission line monitoring. In Proceedings of the 2011 IEEE Power and Energy Society General Meeting, Detroit, MI, USA, 24–28 July 2011; Volume 43210, pp. 1–8. [Google Scholar] [CrossRef]
  21. Jouhara, H.; Żabnieńska-Góra, A.; Khordehgah, N.; Doraghi, Q.; Ahmad, L.; Norman, L.; Axcell, B.; Wrobel, L.; Dai, S. Thermoelectric generator (TEG) technologies and applications. Int. J. Thermofluids 2021, 9, 100063. [Google Scholar] [CrossRef]
  22. Becker, T.; Kluge, M.; Schalk, J.; Otterpohl, T.; Hilleringmann, U. Power management for thermal energy harvesting in aircrafts. In Proceedings of the IEEE Sensors Conference, IEEE, Lecce, IT, USA, 26–29 October 2008; pp. 681–684. [Google Scholar] [CrossRef]
  23. Jouhara, H.; Khordehgah, N.; Almahmoud, S.; Delpech, B.; Chauhan, A.; Tassou, S.A. Waste heat recovery technologies and applications. Therm. Sci. Eng. Prog. 2018, 6, 268–289. [Google Scholar] [CrossRef]
  24. Moultif, N.; Divay, A.; Joubert, E.; Latry, O. Reliability Study of High-Power Mechatronic Components by Spectral Photoemission Microscopy. In Reliability of High-Power Mechatronic Systems 2; Elsevier: Amsterdam, The Netherlands, 2017; pp. 241–271. [Google Scholar] [CrossRef]
  25. How Thermoelectric Generators Work—Applied Thermoelectric Solutions LLC. Available online: https://thermoelectricsolutions.com/how-thermoelectric-generators-work/ (accessed on 5 October 2022).
  26. Thermoelectricity Using Semiconductor Thermocouples. Available online: https://www.mpoweruk.com/thermoelectricity.htm (accessed on 5 October 2022).
  27. Di Stefano, V.; Muscato, O. Seebeck Effect in Silicon Semiconductors. Acta Appl. Math. 2012, 122, 225–238. [Google Scholar] [CrossRef]
  28. Cai, J.; Mahan, G.D. Effective Seebeck coefficient for semiconductors. Phys. Rev. B—Condens. Matter Mater. Phys. 2006, 74, 075201. [Google Scholar] [CrossRef]
  29. Goldsmid, H.J. Bismuth Telluride and Its Alloys as Materials for Thermoelectric Generation. Materials 2014, 7, 2577–2592. [Google Scholar] [CrossRef] [Green Version]
  30. Kim, H.S.; Liu, W.; Chen, G.; Chu, C.-W.; Ren, Z. Relationship between thermoelectric figure of merit and energy conversion efficiency. Proc. Natl. Acad. Sci. USA 2015, 112, 8205–8210. [Google Scholar] [CrossRef] [Green Version]
  31. Stobart, R.; Milner, D. The Potential for Thermo-Electric Regeneration of Energy in Vehicles. SAE Tech. Pap. 2009, 14. [Google Scholar] [CrossRef]
  32. Remeli, M.F.; Date, A.; Orr, B.; Ding, L.C.; Singh, B.; Affandi, N.D.N.; Akbarzadeh, A. Experimental investigation of combined heat recovery and power generation using a heat pipe assisted thermoelectric generator system. Energy Convers. Manag. 2016, 111, 147–157. [Google Scholar] [CrossRef]
  33. Angrist, S.W. Direct Energy Conversion; Allyn and Bacon: Boston, MA, USA, 1982; ISBN 0205077587. [Google Scholar]
  34. Orr, B.; Singh, B.; Tan, L.; Akbarzadeh, A. Electricity generation from an exhaust heat recovery system utilising thermoelectric cells and heat pipes. Appl. Therm. Eng. 2014, 73, 588–597. [Google Scholar] [CrossRef]
  35. Orr, B.; Taglieri, J.; Ding, L.C.; Akbarzadeh, A. Validating an alternative method to predict thermoelectric generator performance. Energy Convers. Manag. 2016, 116, 134–141. [Google Scholar] [CrossRef]
  36. Shuai, J.; Kim, H.S.; Lan, Y.; Chen, S.; Liu, Y.; Zhao, H.; Sui, J.; Ren, Z. Study on thermoelectric performance by Na doping in nanostructured Mg1-Na Ag0.97Sb0.99. Nano Energy 2015, 11, 640–646. [Google Scholar] [CrossRef] [Green Version]
  37. Wu, Y.; Zuo, L.; Chen, J.; Klein, J.A. A model to analyze the device level performance of thermoelectric generator. Energy 2016, 115, 591–603. [Google Scholar] [CrossRef] [Green Version]
  38. Champier, D. Thermoelectric generators: A review of applications. Energy Convers. Manag. 2017, 140, 167–181. [Google Scholar] [CrossRef]
  39. Rare Earth Elements—Critical Resources for High Technology|USGS Fact Sheet 087-02. Available online: https://pubs.usgs.gov/fs/2002/fs087-02/ (accessed on 5 October 2022).
  40. Meng, J.-H.; Zhang, X.-X.; Wang, X.-D. Dynamic response characteristics of thermoelectric generator predicted by a three-dimensional heat-electricity coupled model. J. Power Sources 2014, 245, 262–269. [Google Scholar] [CrossRef]
  41. IEEE. IEEE Std 605-2008 Guide for Bus Design in Air Insulated Substations; IEEE: Piscataway, NJ, USA, 2010; ISBN 9780738158570. [Google Scholar]
  42. Sabovic, A.; Delgado, C.; Subotic, D.; Jooris, B.; De Poorter, E.; Famaey, J. Energy-Aware Sensing on Battery-Less LoRaWAN Devices with Energy Harvesting. Electronics 2020, 9, 904. [Google Scholar] [CrossRef]
  43. Kang, J.; Yan, F.; Zhang, P.; Du, C. Comparison of comprehensive properties of Ni-MH (nickel-metal hydride) and Li-ion (lithium-ion) batteries in terms of energy efficiency. Energy 2014, 70, 618–625. [Google Scholar] [CrossRef]
Figure 1. (a) Schematics of a thermoelectric generator indicating the charge carriers, adapted from [25]. (b) Series connections of different thermoelectric couples, adapted from [26].
Applsci 13 02603 g001
Figure 2. Efficiencies calculated from (4) for different figures of merit zT versus the temperature difference between the hot and cold sides of the TEG, assuming Tcold = 20 °C and Thot = Tcold + ∆T.
Applsci 13 02603 g002
Figure 3. Experimental setup to compare the performance of TEGs and DC/DC converters.
Applsci 13 02603 g003
Figure 4. TEG #1 combined with DC/DC converter #1. (a) Ambient, hot and cold side temperatures measured by T-type thermocouples. (b) Output power of TEG #1 and DC/DC converter #1 versus the temperature difference between the hot and cold sides of TEG #1. (c) Output power of the analyzed TEGs and DC/DC converter versus the temperature difference between the hot and cold sides of the TEG #1.
Applsci 13 02603 g004
Figure 5. Combined performance of TEGs #1 and #2 combined with DC/DC converters #1 and #2. (a) Power generated by the analyzed TEG modules versus the temperature difference between the busbar and the ambient during the heating and cooling cycles. (b) Output power of the different combinations of TEG + DC/DC converter versus the temperature difference between the busbar and the ambient during the heating cycle.
Applsci 13 02603 g005
Figure 6. Characteristic TEG curves, VI and P − I. The quadratic fit obtained is P (mW) = −0.008014·I2 + 0.7995·I − 0.1176. The parameters related to goodness of fit are R2 = 0.9992, SSE = 0.676, and RMSE = 0.2373.
Applsci 13 02603 g006
Figure 7. Experimental setup to characterize the performance of TEG #1 + DC/DC converter #1 mounted on a tubular conductor.
Applsci 13 02603 g007
Figure 8. (a) Hot side, heat sink and ambient temperatures measured by T-type thermocouples. (b) Electrical output power of TEG and DC/DC converter, and temperature difference between hot side and ambient.
Applsci 13 02603 g008
Figure 9. Voltage generated by TEG #1 and the voltage across the battery during a cold start situation using the TEG #1 + DC/DC converter #1 combination.
Applsci 13 02603 g009
Table 1. Combinations of TEGs and DC/DC converters.
CombinationDevices Involved
1TEG #1 + DC/DC converter #1
2TEG #1 + DC/DC converter #2
3TEG #2 + DC/DC converter #1
4TEG #2 + DC/DC converter #2
Table 2. Analyzed TEG modules.
TEG ModulesTEG #1TEG #2
ModelGM250-157-14-16TG12-8
ManufacturerEuropean ThermodynamicsMarlow Industries
Dimensions (mm)40 × 4040 × 40
Thickness (mm)4.13.6
Matched load resistance (Ω)3.653.46
Hot side temperature (℃)250230
Cold side temperature (℃)3050
Optimum output voltage (V)5.05 5.25
Optimum output power (W)6.997.95
Table 3. Analyzed DC/DC converters.
DC/DC ConvertersDC/DC #1DC/DC #2
ModelLTC3108LTC3109
Manufacturer Analog devicesAnalog devices
Harvesting boardAdaptive ADEHDemo circuit 1664 A
Input voltage range50−400 mV30−500 mV
Voltage regulation2.35−5.00 V2.30−5.10 V
MPPT technology *YesNo
* MPPT stands for maximum power point tracking.
Table 4. Parameters of the analyzed TEG module.
ParametersMeasured Values
Ambient temperature (°C)21.5
Cold side temperature (°C)57.8
Hot side temperature (°C)67.7
Open circuit voltage (V)0.79
Short-circuit current (mA)99.56
Maximum power point voltage (V)0.40
Maximum power point current (mA)50.39
Resistance at the maximum power point (Ω)6.00
Maximum power (mW)20.25
Table 5. Dependence of rac with the temperature of the tubular conductor.
T (°C)V1m (VRMS)Current (ARMS)cosφrac (µΩ/m)
251.47352800.99975267
301.48452790.99975319
351.49132770.99975378
401.50852770.99975441
451.51482750.99975501
501.52002740.99975545
551.52902730.99975591
601.53132710.99975635
651.53532710.99975657
Table 6. Steady-state performance results of the entire system.
Current
(Arms)
rac
(µΩ/m)
THot-Ambient
(°C)
THot-Cold
(°C)
pJoule,conductor
(W/m)
PJoule,TEG-area
(W)
Pelectric,TEG
(mW)
PDC/DC
(mW)
RTEG
(°C/W)
ηTEG
(%)
ηTEG+DC/DC
(%)
136538020.73.499.50.851.240.213.9640.150.025
169544826.13.9155.61.322.500.342.9140.190.026
194551231.74.5207.51.764.470.482.5340.250.027
226556037.75.1284.02.417.340.662.0950.300.027
254562243.75.7362.73.0811.20.841.8410.360.027
Disclaimer/Publisher’s Note: The statements, opinions and data contained in all publications are solely those of the individual author(s) and contributor(s) and not of MDPI and/or the editor(s). MDPI and/or the editor(s) disclaim responsibility for any injury to people or property resulting from any ideas, methods, instructions or products referred to in the content.