Article

Reducing the Power Consumption of VR Displays with a Field Sequential Color LCD

1
College of Optics and Photonics, University of Central Florida, Orlando, FL 32816, USA
2
Department of Electrical Engineering, National Cheng Kung University, Tainan 701, Taiwan
*
Author to whom correspondence should be addressed.
Appl. Sci. 2023, 13(4), 2635; https://doi.org/10.3390/app13042635
Submission received: 5 January 2023 / Revised: 13 February 2023 / Accepted: 16 February 2023 / Published: 18 February 2023
(This article belongs to the Special Issue Novel Liquid Crystal Materials and Applications)

Abstract

:
To achieve 60 pixels per degree (PPD) and 100° field of view (FoV) while keeping a reasonably high aperture ratio for active-matrix liquid crystal displays (LCDs), field sequential color (FSC) is a promising approach. We evaluate the physical properties of a high birefringence nematic LC mixture and then use these data to simulate the performance of a fringe-field switching (FFS) LCD. Such an FFS LCD exhibits a fast average gray-to-gray response time (~1.5 ms) to enable FSC operation. By removing the spatial color filters, FSC operation triples the resolution density and optical efficiency, which are critical to high-resolution density and low power consumption virtual reality applications. Wide color gamut (96.2% of the DCI-P3 standard) and superior color uniformity are also demonstrated using such an FSC LCD.

1. Introduction

Display engines play a vital role affecting the performance of virtual reality (VR) headsets [1,2,3]. Recently, JDI and Innolux independently demonstrated a 2.27” 2016 pixels per inch (PPI) active-matrix liquid-crystal display (AMLCD) with subpixel rendering for VR displays. Such a light engine offers 32 pixels per degree (PPD) and 100° field of view (FoV), but its aperture ratio is lower than 10%, implying a high-power consumption. To leapfrog LCD, recently eMagin introduced a 2.1” 4K OLED-on-silicon with 2645 PPI and 42 PPD. However, for an 8” silicon wafer, only ~20 such panels can be fabricated, resulting in a high cost.
To achieve 60 PPD and 100° FoV with a 2.27” subpixel rendering AMLCD, the required PPI should increase to 3780. Under such a high-resolution density, the extrapolated aperture ratio would be <1% if subpixel rendering is not employed [4], which implies a high-power consumption. To enlarge the aperture ratio, field sequential color (FSC) is a viable approach. By eliminating the spatial color filters, both resolution density and optical efficiency are tripled. Thus, the required resolution density can be reduced from 3780 to 1260 PPI, which will enable AMLCD to leapfrog OLED-on-silicon again while keeping a reasonably large aperture ratio (>20%) for reducing the power consumption. One critical requirement for FSC operation is that the LC response time must be fast enough to avoid color breakup. One approach is to use ferroelectric liquid crystal (FLC) because of its microsecond response time [5,6,7]. However, the driving circuits for realizing gray levels are complicated. For example, a 3T1C (three transistors and one capacitor) pixel circuit and DC compensation driving frame are adopted to generate 8-bit gray levels for electrically suppressed helix FLC [7]. The increased space for multiple transistors would undoubtedly lower the resolution density, while the DC compensation would reduce the frame rate; both are undesirable for VR displays. In contrast, nematic LCD is easy to drive just using 1T1C (one transistor and one capacitor), but its response time is usually slower. Other approaches include polymer-stabilized blue-phase LCs and the composites of nematic LCs with nanomaterials. Polymer-stabilized blue-phase LCs can exhibit submillisecond response times, but the operation voltage is still high and slow capacitor charging requires the pre-charging method [8]. The composites of nematic LCs with nanomaterials also help reduce response time, but the stability of such composites remains to be tested [9]. Uniform dispersion of nanomaterials such as carbon nanomaterials into the LC material is also challenging [10].
To achieve fast response time, here we evaluate a high birefringence and low viscosity nematic LC mixture. High birefringence enables a thin cell gap to be used, which helps decrease response time and crosstalk. In a pancake-lens-based VR headset, the housing temperature can easily reach 50–60 °C because of the thermal effect from the light engine and imaging optics. On the positive side, such an elevated temperature helps to lower the LC viscosity dramatically. A single-domain fringe-field switching (FFS) LCD [11,12] is selected for this study because of its wide viewing angle and weak color shift. Based on these measured parameters, our simulation results show the average gray-to-gray response time is about 1.5 ms with 1.5-µm electrode width, 1.5-µm electrode gap, and 0° rubbing angle, which can support a color subframe rate of up to 360 Hz. If overdrive and undershoot voltages are applied [13], the response time can be reduced to submillisecond.

2. Experiment

As the technology keeps evolving, several compact LCD light engines for VR headsets have been developed. For example, TCL presented a 1.77″ ultracompact LCD at Display Week 2022. Such a small panel size enables a cell gap as thin as 2 µm to be fabricated. In contrast, a typical cell gap for the small LCoS panels is around 1 µm. Such a thin cell gap helps to decrease response time and crosstalk, but a high birefringence LC is needed. To prove the concept, we use a new LC mixture formulated by JNC, designated as ZHX-5134, for thin cell FFS LCDs. The optimized LC mixture features a high clearing temperature, high birefringence, large dielectric anisotropy, and relatively low viscosity. High clearing point helps the LCD to withstand a high operating temperature, which is urgently needed in next generation high-dynamic-range VR headsets where an ultrahigh brightness is needed [14].

2.1. Temperature-Dependent Physical Properties

A pancake optical system [15,16,17] dominates VR headsets because of its compactness; however, its optical efficiency is reduced by 4× because of the employed half mirror. A lower optical efficiency requires a brighter light engine to achieve the same brightness. Thus, the working temperature of the light engine can easily reach 50–60 °C by the thermal effect. The LCD light engine using an LC mixture with high clearing point is desirable. Therefore, it is necessary to systematically measure the temperature-dependent birefringence, visco-elastic constant, and figure of merit (FoM), which greatly impact the transmittance and response time of the AMLCD light engines.
To measure the temperature-dependent birefringence, we filled a commercial homogeneous cell with a cell gap of 5.37 µm with the LC mixture. Next, we used a Linkam heating stage (Linkam TMS94) to control the operating temperature. The test cell was sandwiched between two crossed polarizers. The probing beam was a He-Ne laser (λ = 633 nm). The temperature-dependent birefringence can be calculated from the measured voltage-dependent transmittance at each temperature. Results are shown as the black dots in Figure 1. The solid line represents Haller’s semi-empirical equation [18]:
Δ n ( T ) = Δ n 0 S = Δ n 0 ( 1 T / T c ) β ,
where Tc is the clearing temperature, β is the material constant, S is the order parameter, and Δn0 is the extrapolated birefringence at T = 0. Using Equation (1) to fit the experimental data, we obtained Δn0 = 0.277 and β = 0.237. As Figure 1 depicts, the experimental data agree well with the fitting curve. As the temperature (T) approaches Tc (~96 °C), Δn decreases rapidly. High clearing temperature plays an important role in maintaining a high birefringence for the AMLCD to operate at an elevated temperature (50–60 °C) while the viscosity is reduced substantially.
The temperature-dependent visco-elastic constant directly impacts the LC response time. The visco-elastic constant ( γ 1 / Κ 11 ) can be extracted from the measured time-dependent relaxation process of a homogenous cell. As the temperature increases, γ 1 / Κ 11 decreases rapidly and then saturates, as described below [19]:
γ 1 K 11 = A exp ( E a / k B T ) ( 1 T / T c ) β ,
where A is the proportionality constant, Ea is the activation energy, and kB is the Boltzmann constant. Using Equation (2) to fit the experimental data indicated by black squares in Figure 2, we found A = 1.54 × 10⁻⁵ ms/μm2 and Ea = 334 meV.
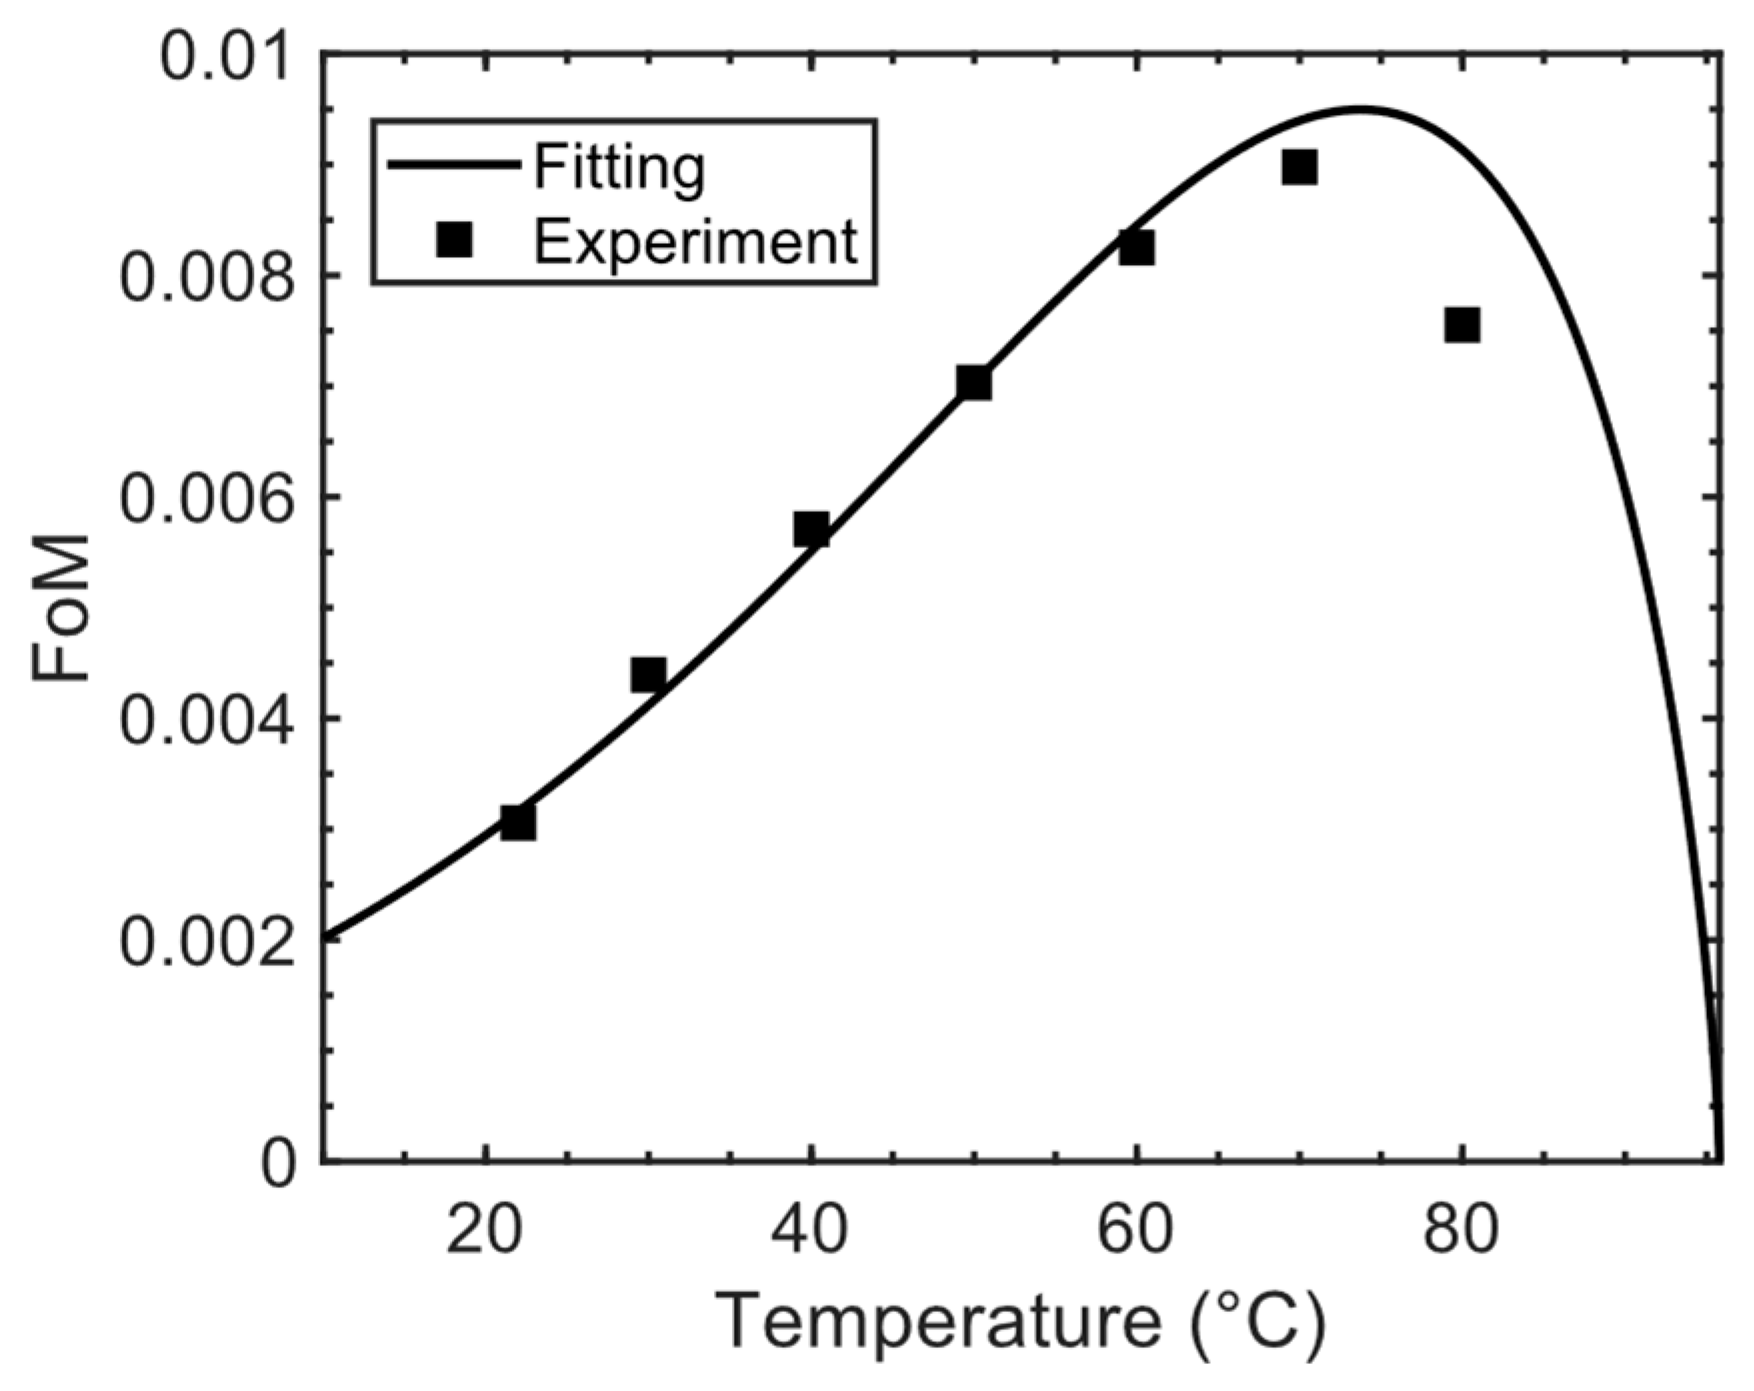
As shown in Figure 1 and Figure 2, both birefringence and visco-elastic constant vary with temperature but at different rates. To find an optimal operating temperature, a figure of merit is defined as FoM = Δn2/( γ 1 / K 11 ) to take both factors into account [20]. According to Figure 3, the optimal operating temperature occurs at ~70 °C, and the FoM at T = 50 °C is 2.3× higher than that at T = 22 °C. A more comprehensive FoM also includes the effect of dielectric anisotropy Δε. A larger Δε enables a lower threshold voltage and operating voltage, but the viscosity may inevitably increase. For this LC mixture, there is a good balance between viscosity and dielectric anisotropy. Δε = 6.9 at T = 25 ° C and f = 1 kHz. As the temperature increases, the dielectric anisotropy decreases. At T = 50 ° C and f = 1 kHz, Δε is decreased from 6.9 to 6.1. Compared to previously reported low viscosity materials used in FFS cells [21,22], this LC mixture can exhibit a lower operating voltage.

2.2. Wavelength-Dependent Birefringence

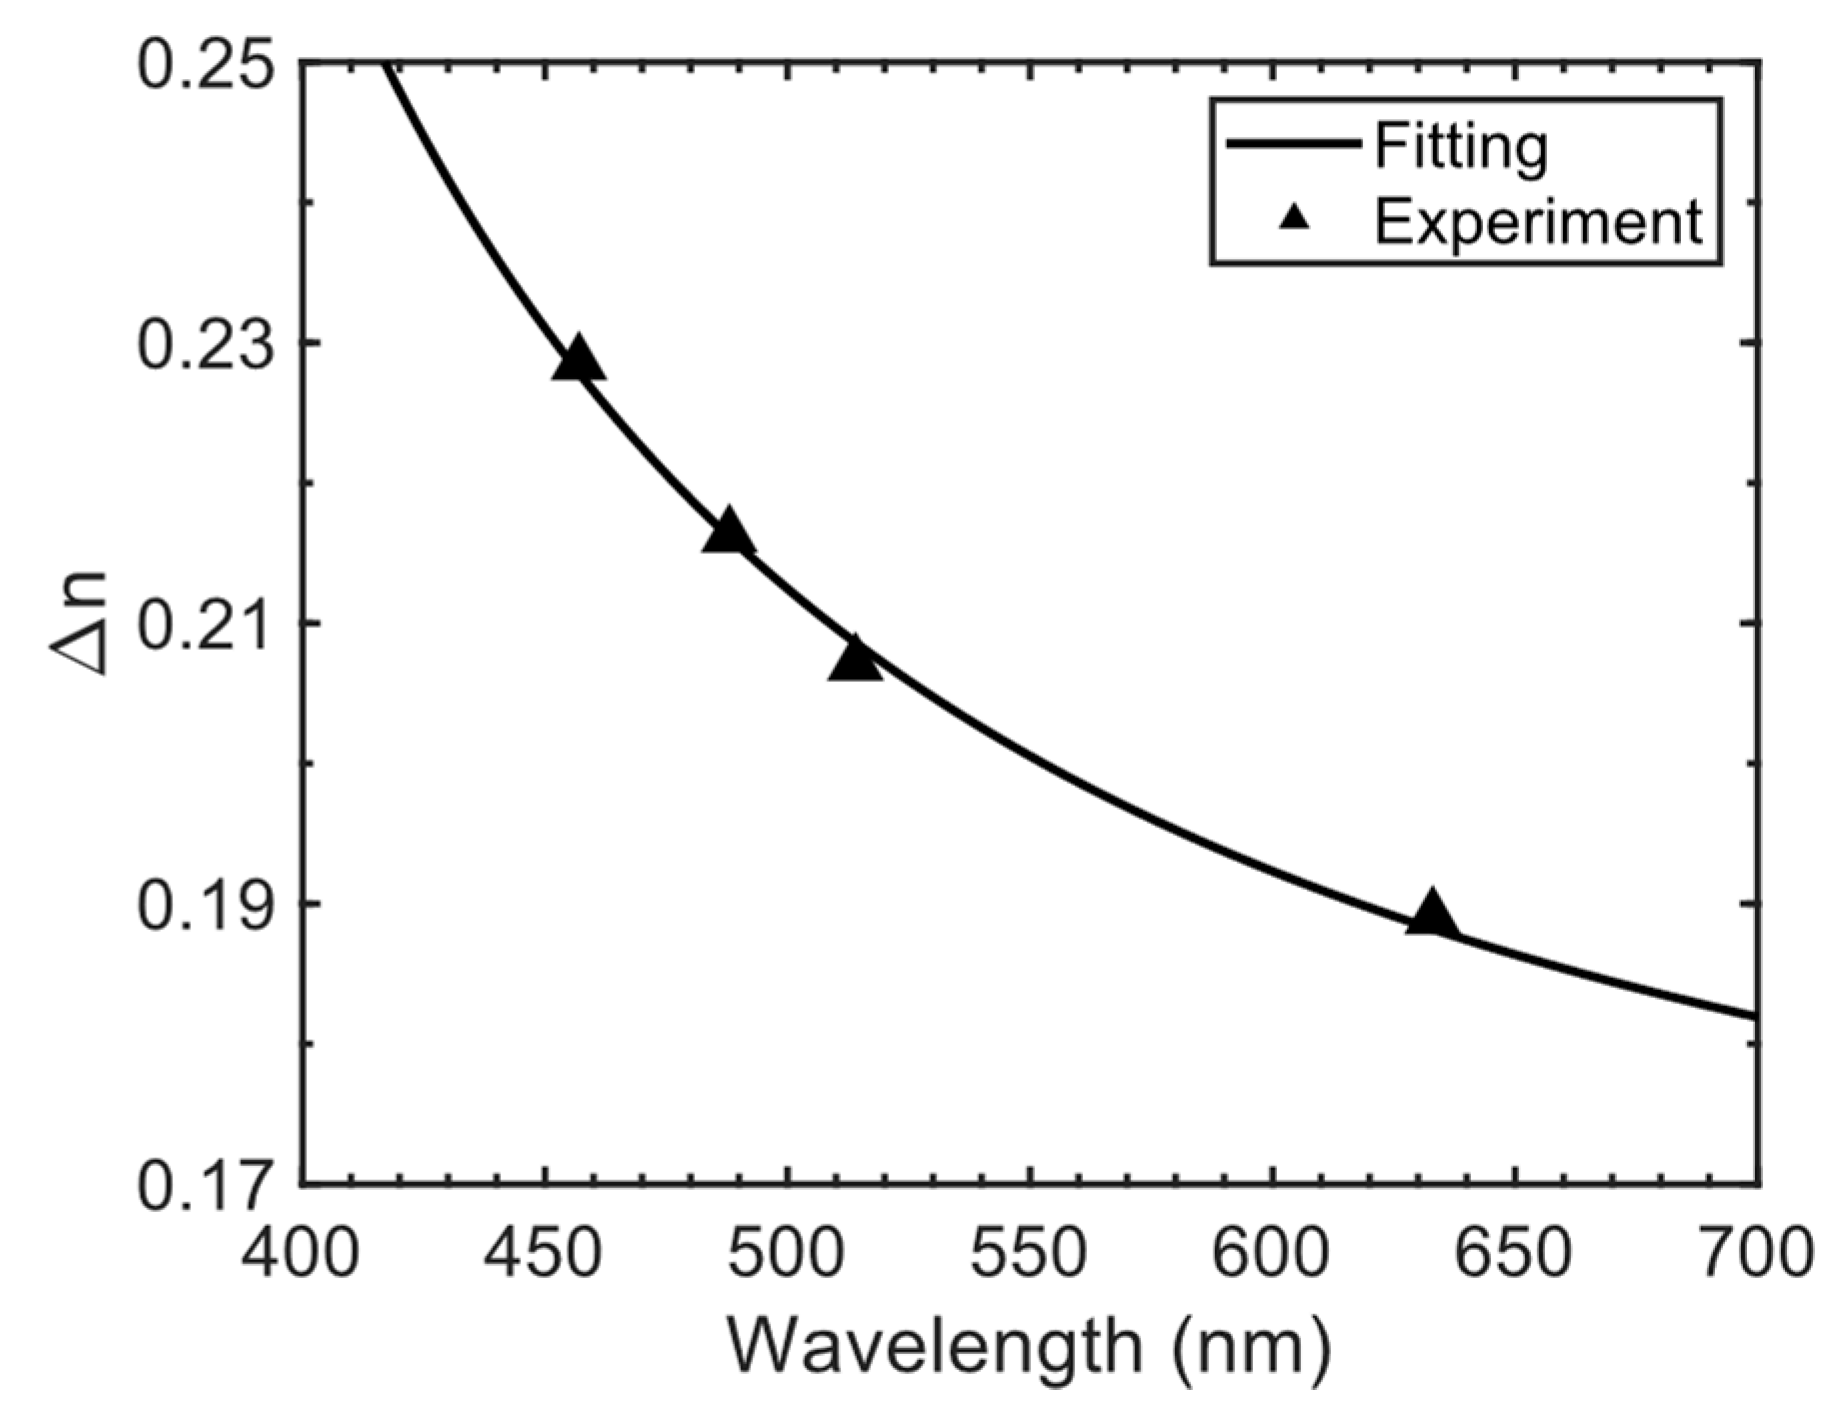
Birefringence dispersion is also an important factor for full-color VR displays. To measure birefringence dispersion, a tunable argon ion laser (457 nm, 488 nm, and 514 nm) and a He-Ne laser (633 nm) were employed as probing beams. Results are shown as black triangles in Figure 4. To calculate the birefringence at other wavelengths (especially at 450 nm, 550 nm, and 650 nm), we refer to the single-band birefringence dispersion equation [23]:
Δ n = G λ 2 λ 2 λ 2 λ 2 ,
where λ* is the mean resonance wavelength and G is the proportional constant. Using Equation (3) to fit the experimental data, we found λ* = 0.252 µm, and G = 2.48 µm−2. According to the fitting curve (black solid line) in Figure 4, the birefringence at λ = (450 nm, 550 nm, 650 nm) and T = 22 °C is (0.231, 0.200, 0.186), respectively.

3. Simulation Results

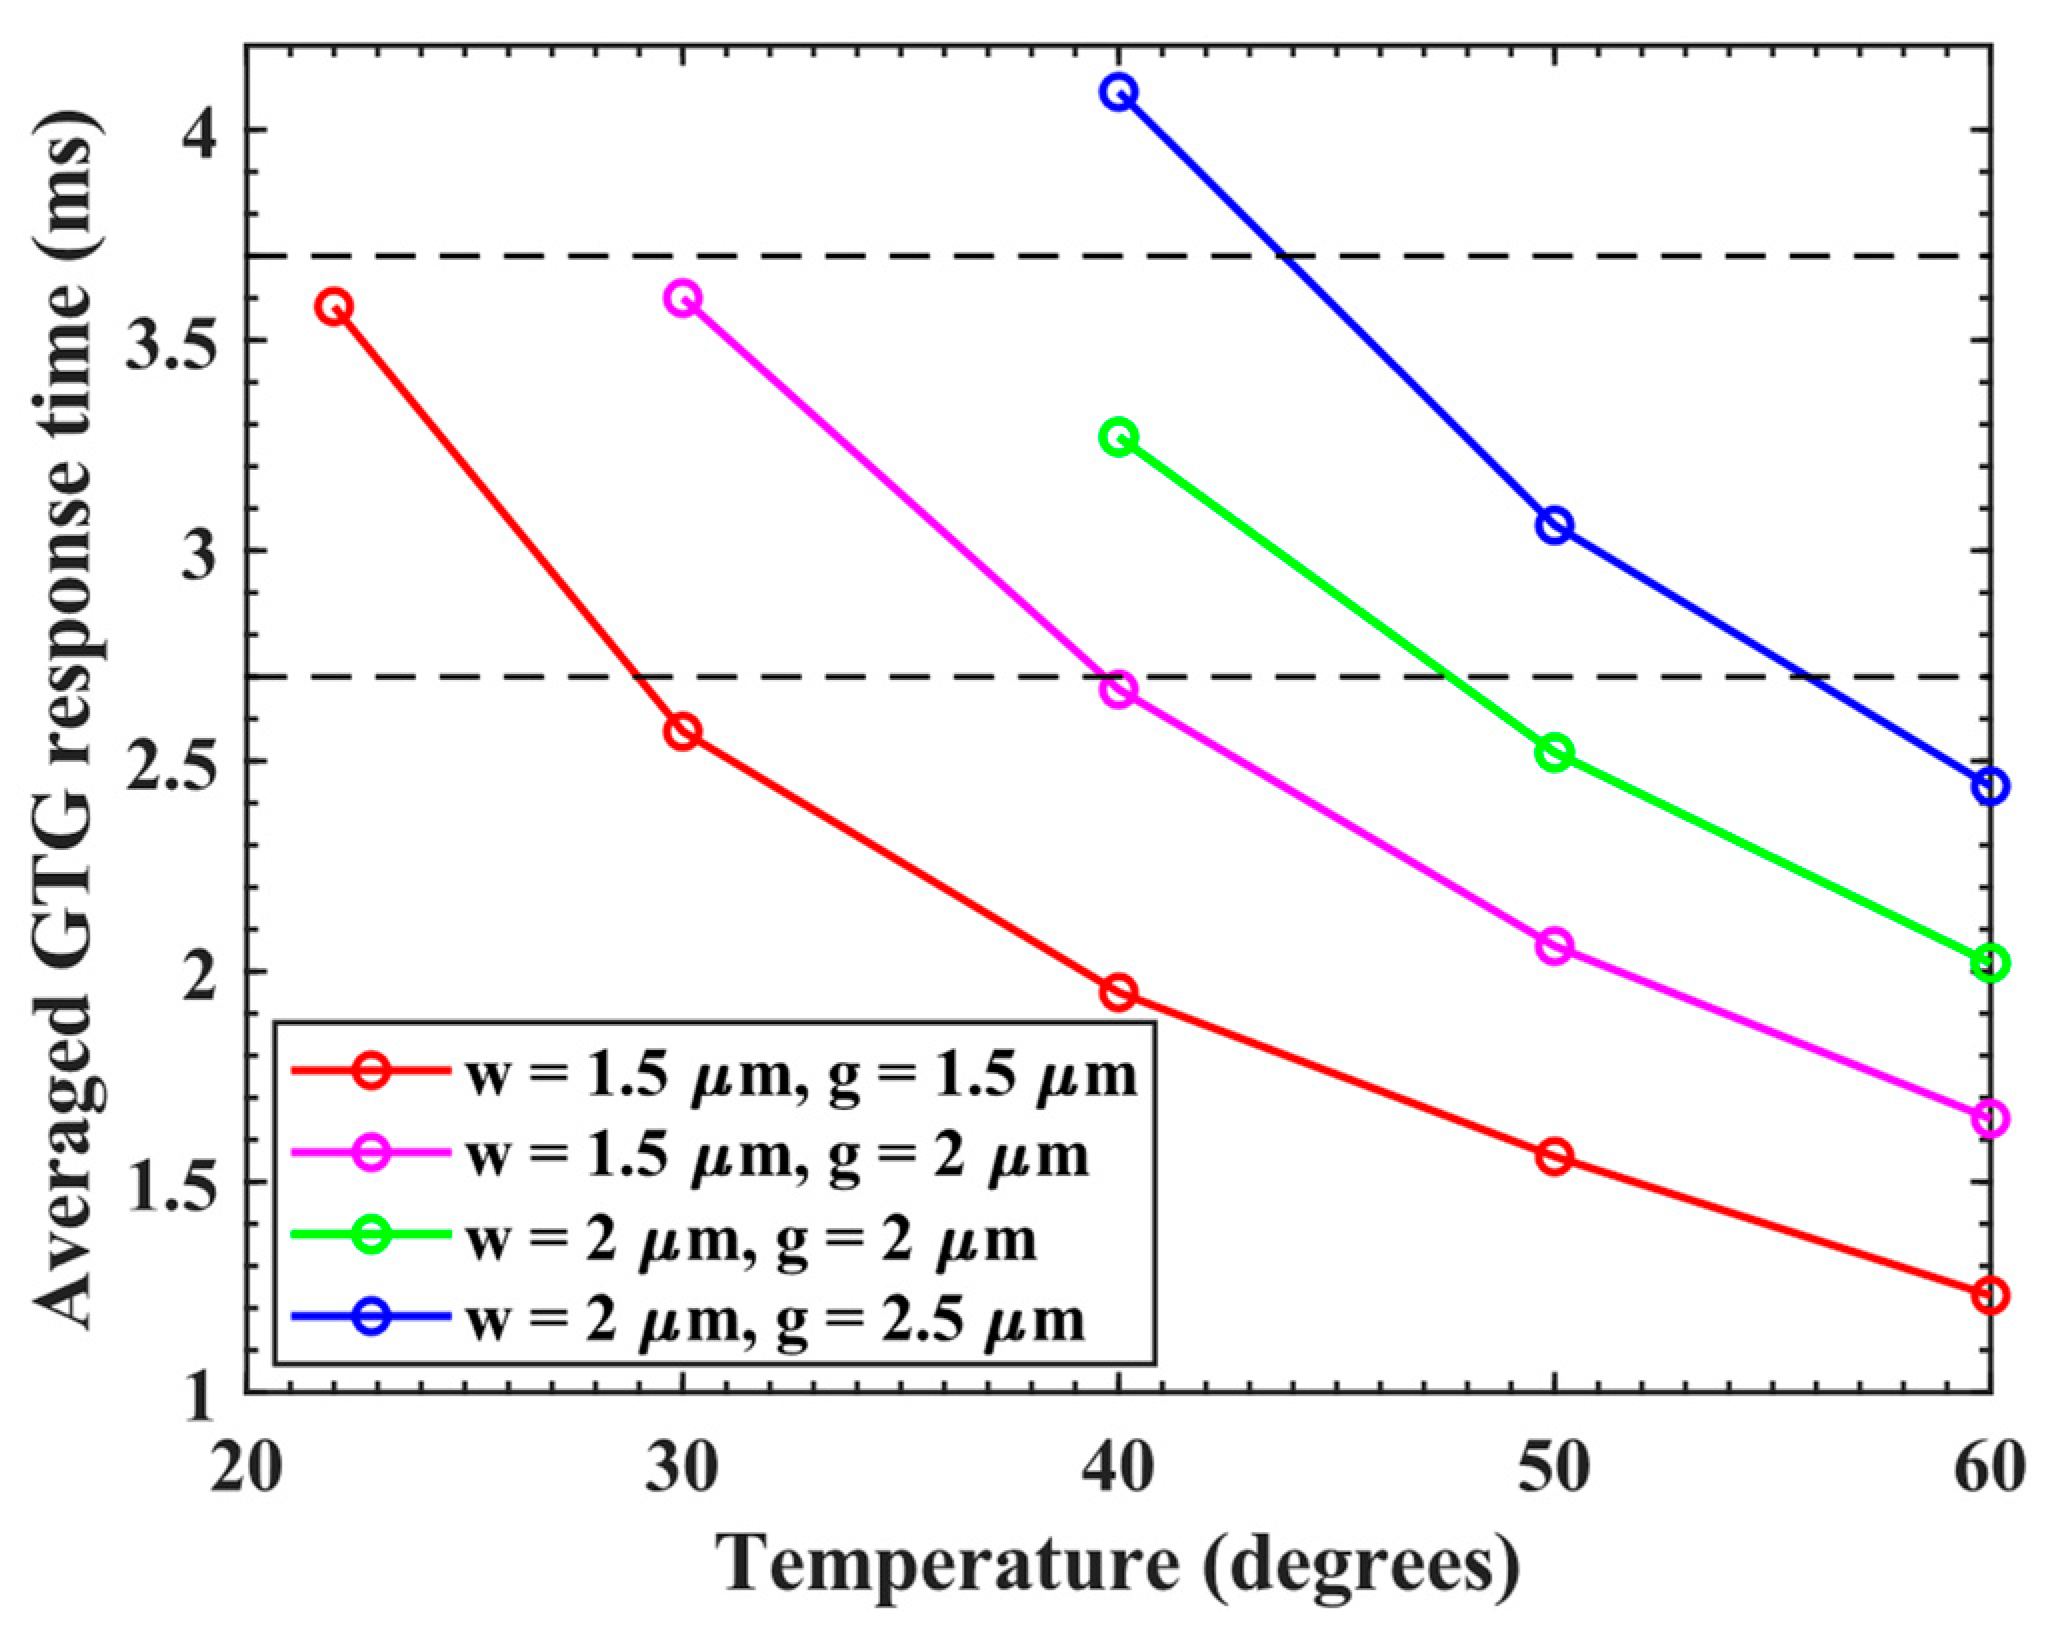
For VR displays, single domain LCDs may be sufficient because of the narrow collection cone (~20°) limitation of human eyes. Therefore, we chose a single domain FFS LCD because of its wide viewing angle and weak color shift. Color sequential display relies on the human vision system to integrate three successive (RGB) images into a color image. For this reason, the LC response time should be fast enough, depending on the required frame rate. Variable frame rates are employed for different tasks. For example, the Meta Quest Pro features a 90 Hz maximum refresh rate (72 Hz mode available) targeted for office tasks. Games and videos may require a higher frame rate, e.g., 120 Hz. For this reason, the virtual wall [24,25] is employed to further decrease the response time and achieve a color subframe of 270 Hz or 360 Hz. To determine the appropriate electrode width and gap, we employed TechWiz LCD 3D (Sanayi, Korea) to simulate the voltage-dependent transmittance and average gray-to-gray (GTG) response time, corresponding to a series of different electrode widths and gaps. The simulation conditions include a 2° pretilt angle and 0° rubbing angle. The cell gap is 2 µm, which helps decrease response time and crosstalk while maintaining a good manufacturing yield. The pixel pitch L = 6 µm, has recently been realized [26]. Figure 5 shows that finer electrode widths (w) or gaps (g) help decrease the response time. For example, w = 1.5 µm and g = 1.5 µm can achieve an average GTG response time less than 3.7 ms (top horizontal dashed lines) at T > 22 °C and 2.7 ms (bottom horizontal dashed lines) at T > 30 °C; the latter can support 72 Hz framerate (or 216 Hz color subframes). As T increases, the average GTG response time decreases rapidly because of the decreased viscosity.
Table 1 lists the rise time and decay time corresponding to different gray levels at 50 °C. To calculate the GTG response time, the voltage-dependent transmittance curve is uniformly divided into 256 gray levels. The response time between 0, 64, 128, 192, and 255 gray levels is then obtained by calculating the transition time between 10% and 90% transmittance change. The fastest GTG response time is 0.62 ms and the average GTG response time is 1.5 ms, which leaves more time for the thin film transistor (TFT) gate lines to be scanned (~1 ms corresponding to 360 Hz color subframe or ~2 ms corresponding to 270 Hz color subframe). The remaining time (~0.3–0.5 ms) is used for turning on the backlight and obtaining low motion picture response time. According to the time slots assigned for pixel addressing, LC response, and backlight flashing, the duty cycle is calculated to be ~10%. It is noted that faster scanning time can be achieved using multiple integrated circuits (ICs) that simultaneously scan the gate lines [27]. To write data for several (n) gate lines in different blocks synchronously, the number of data lines is inevitably increased by n times. Fortunately, the data lines can be reduced by 3× because of the color sequential display. In this manner, the time for pixel addressing can be greatly reduced by n times. Overdrive and undershoot can be further employed to achieve sub-millisecond response times for LCs, alleviating the time for pixel addressing and enabling a fast response time for lower temperature operation, but the driving circuitries are more complicated.
Despite a fine electrode pitch, Figure 6 shows that a relatively low threshold voltage of ~1.6 Vrms is obtained, arising from a decent dielectric anisotropy. The normalized transmittance for red, green, and blue (RGB) wavelengths almost saturates at 6 Vrms, where the transmittance of 52% is achieved at λ = 450 nm.
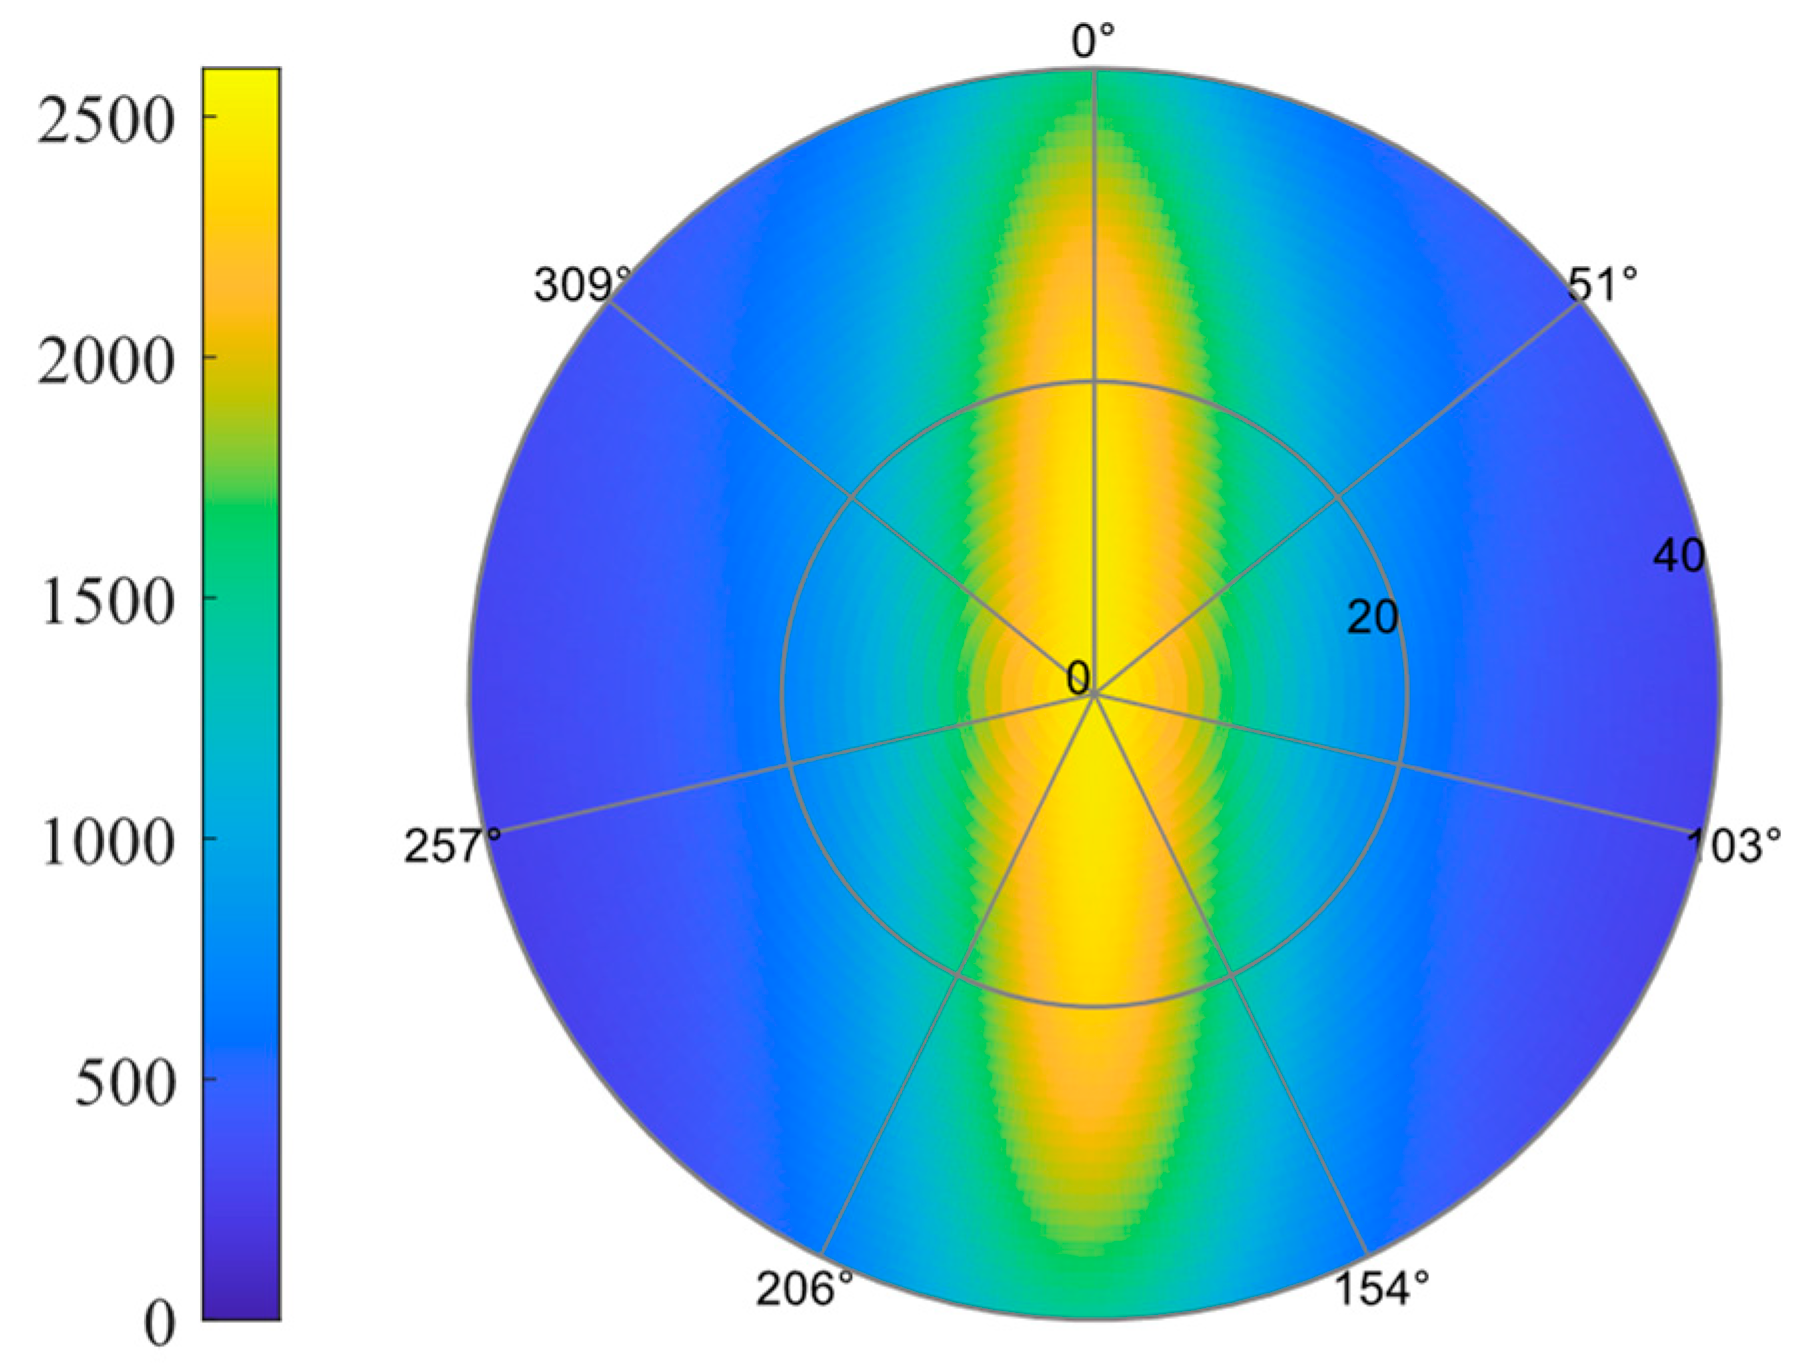
To characterize the FSC LCD, contrast ratio, color gamut, and color shift are sequentially simulated. Light engines play a significant role in determining the system contrast ratio. Because of the depolarization from TFT circuits, LCs, and color filters, the contrast ratio of the FFS mode is limited to ~2500:1. For this reason, the FSC LCD can exhibit a higher contrast ratio by eliminating color filters. We use a positive A-plate and negative A-plate as compensation films [28]. Figure 7 depicts the simulated isocontrast contour at λ = 550 nm. A high contrast ratio (~1000:1) region expands to ~20° viewing cone, which is usually adequate for VR applications. Color gamut and color uniformity are also critical to the performance of light engines. In the Meta Quest Pro, quantum dots (QDs) are used in the LCD’s backlight module. Therefore, we compare the FSC LCD using RGB LEDs [29] with the LCD using a QD color conversion layer and pigment color filters [30] in terms of color gamut and color shift. Besides pigment color filters, the color can also be generated by the band gap shifting of a cholesteric liquid crystal [31].
Figure 8a shows the spectra of RGB LEDs used in the FSC LCD; while Figure 8b depicts the spectra of a blue LED, green QDs, and red QDs employed in the backlight module of the LCD. The color gamut of FSC LCD is mainly limited by the broader emission spectrum of the green LED, as shown in Figure 8a. For an InGaN-based LED, its spectral bandwidth increases as the peak emission wavelength increases because of the increased indium concentration [32]. In contrast, the red-color III-phosphides LEDs exhibit a relatively narrow spectral bandwidth and high efficiency. For the LCD using color filters, the crosstalk caused by the overlap between the backlight’s spectrum in Figure 8b and color filters hinders a wider color gamut [33]. Therefore, their color gamut is comparable: the FSC LCD can cover 96.2% DCI-P3 while the LCD using color filters can cover 96.4% DCI-P3. The color gamut of the FSC LCD can be further enlarged using a green LED with a narrower emission spectrum. Incomplete switching of the LC can cause shrinkage of the color gamut; thus, a larger color gamut also helps mitigate the demanding requirement of LC response time.
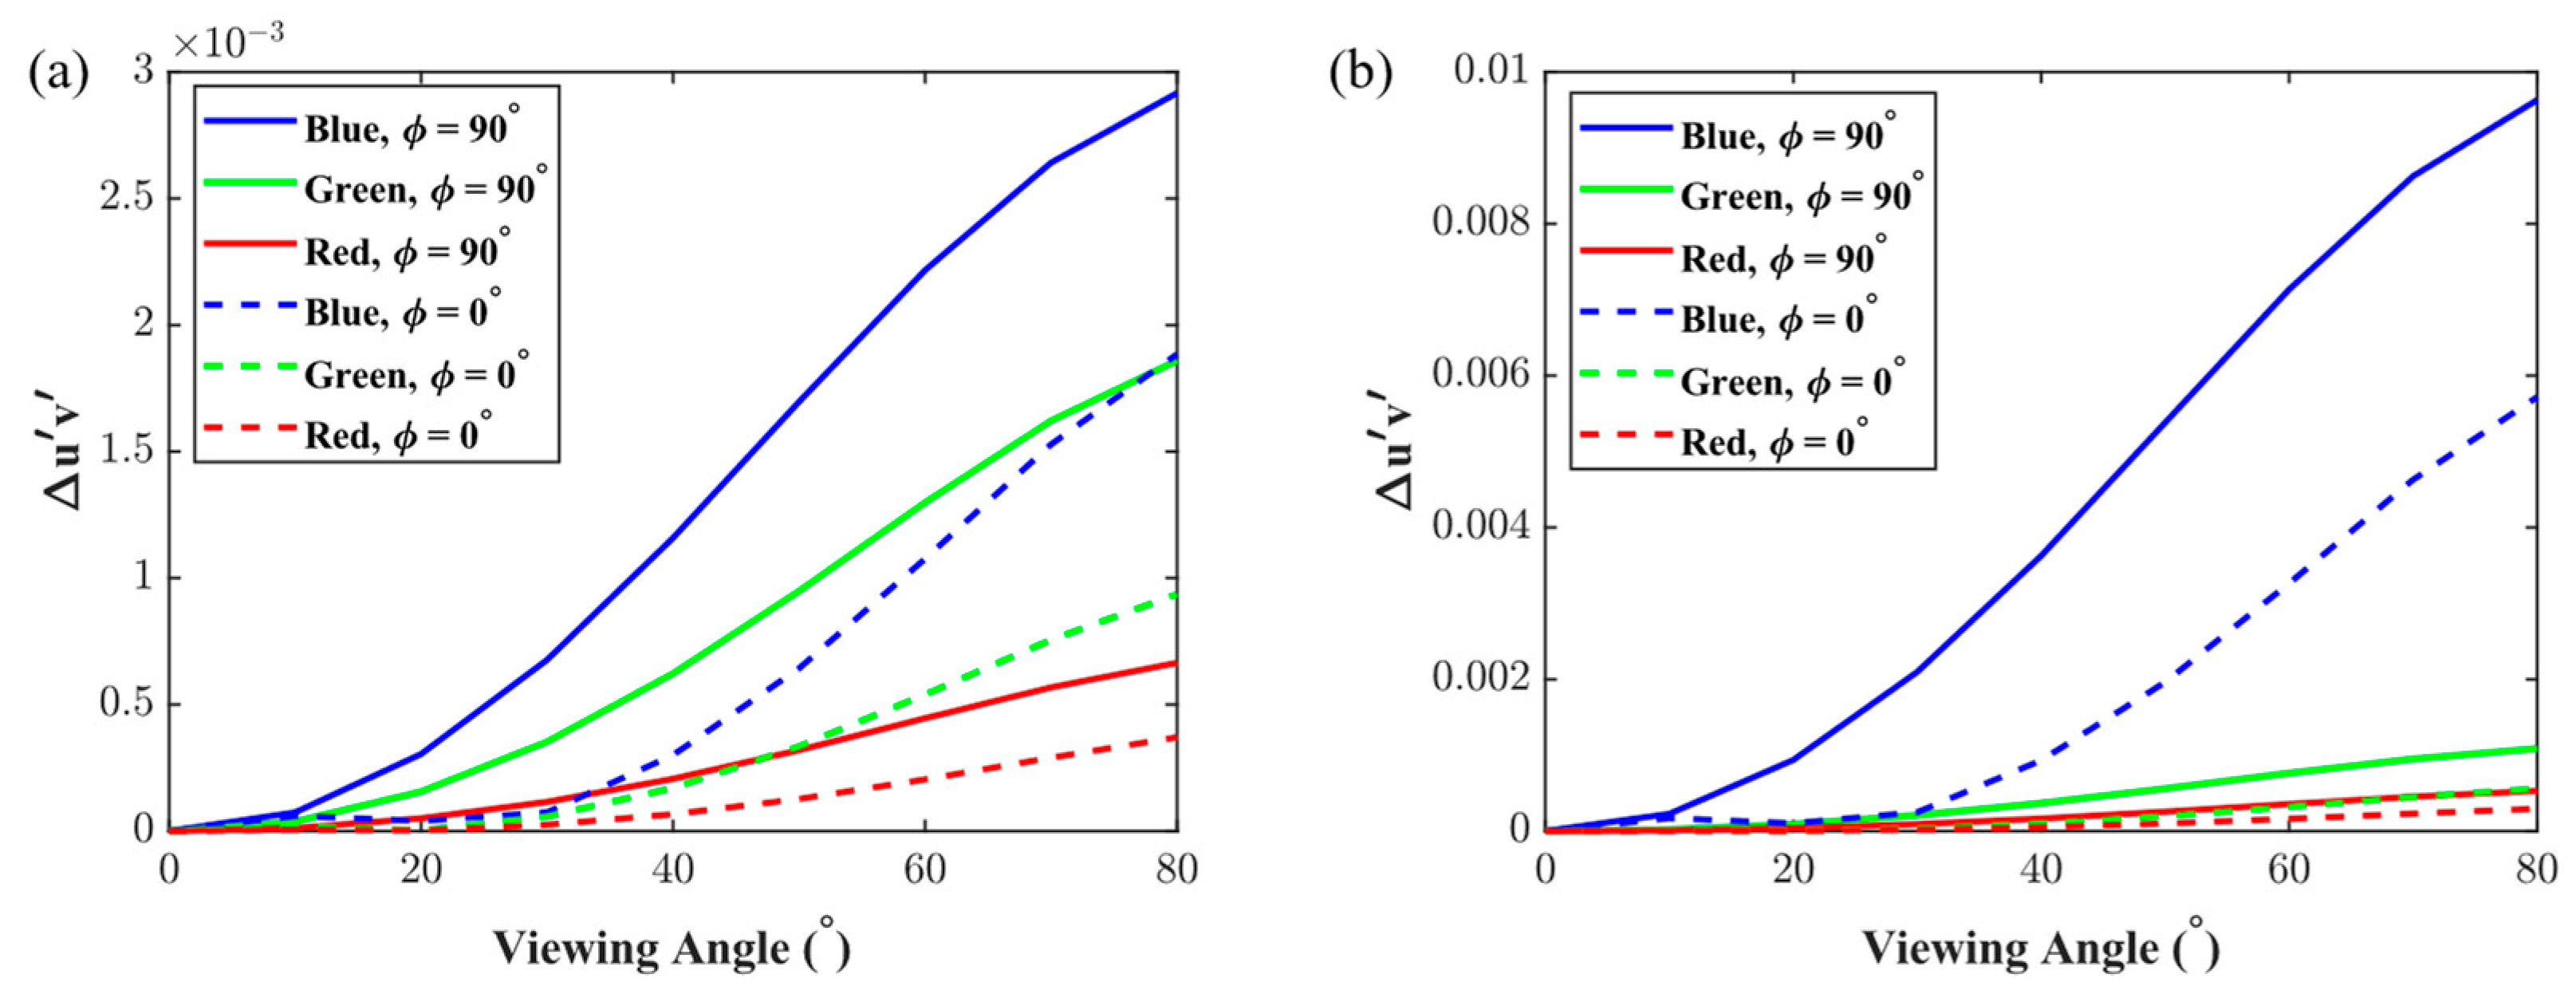
For color shift, the horizontal (ϕ = 0°) and vertical (ϕ = 90°) viewing directions are usually reported experimentally. To calculate color shift, we first extracted wavelength- and angle-dependent transmittance from TechWiz and then multiplied it by the backlight’s spectrum and the transmittance spectra of the color filters. Figure 9a,b shows the simulated color shift for FSC LCD and LCD with color filters, respectively. In both types of LCDs, blue colors in the vertical direction have the largest color shift (∆u’v’), followed by green and red. We also find that the FSC LCD exhibits a ~3× smaller color shift than the LCD with color filters. To summarize, by our calculations, the FSC LCD is proven to exhibit a wide color gamut and superior color uniformity than the LCD with QDs and color filters. It is noted that when ∆u’v’ is smaller than 0.02, the color shift is indistinguishable to human eyes. Therefore, both types of LCDs are fine in terms of color shift.

4. Power Consumption

Power consumption is an important performance metric for VR displays. To evaluate the power consumption of the FSC LCD, both optical and electrical parts must be considered. In the optical part, the power consumption of the LCD originates from the backlight which can be estimated by the following equations:
P optical = L backlight / η LED
L display = L backlight × η m i x i n g × D C × A R × T L C
where Lbacklight is the brightness of the backlight, ηLED is the efficiency of LEDs with the unit of nits/W, Ldisplay is the required brightness of FSC LCD, ηmixing is the efficiency of mixing light in the backlight, DC is the duty cycle of backlight emission, AR is the aperture ratio of the 1T1C pixel circuit, and TLC is the LC transmittance after passing through two polarizers. For ηLED, different efficiencies of RGB LEDs need to be considered. In the electrical part, the power consumption can be divided into dynamic and static parts. The dynamic power consumption of the 1T1C pixel circuit is described as follows:
P dynamic = N × f × C P × V SCAN 2 + N × f × ( C S + C L + C P ) × V DATA 2
where N is the total number of pixels, f is the refresh rate of the FSC display, VSCAN is the voltage difference of the scan line, VDATA is the voltage difference of the data line, CP is the parasitic capacitor of the TFT, CS is the storage capacitor, and CL is liquid crystal capacitor in a pixel circuit. The parasitic capacitors include the gate-to-source capacitor and the gate-to-drain capacitor of the TFT in the pixel. The origins of dynamic power consumption for a pixel are explained as follows. When the scan signal turns the TFT on or off, the parasitic capacitors of the TFT are charged or discharged. Moreover, the storage, liquid crystal, and parasitic capacitors are charged or discharged to the data voltage as the TFT in a pixel is turned on. In the electrical part, the static power consumption is also shown in the following equation:
P static = N × Δ V × I leakage
where ∆V and Ileakage represent the voltage difference of the capacitor and the leakage currents of the TFT in a pixel, respectively. When the TFT in a pixel is turned off, the leakage current of the TFT changes the voltage stored in the capacitors, thus causing static power consumption. Finally, the electrical power consumption can be calculated by summing the dynamic and static power consumptions.
Based on the above model, the power consumption of the FSC LCD and conventional color filter-based LCD can be thoroughly compared. For the electrical power consumption, they are almost the same if the capacitance and operating voltage are assumed to be the same. Although the frame rate for FSC LCD is tripled, the number of pixels is reduced by 3×, leading to the same value for the product of N and f. On the other hand, the major difference of optical power consumption depends on the absorption of color filters, the aperture ratio (AR), and the efficiency of LEDs (ηLED). For the color filter-based LCD, the absorption of color filters can reduce the luminance by approximately 3×, but the optical power consumption can be partially mitigated by white LEDs because of their higher efficiencies than RGB LEDs. For this reason, the aperture ratio plays a key role in comparing their power consumptions. To achieve 60 PPD and 100° FoV, the required resolution density for the color filter based TFT LCD and FSC TFT LCD is 3780 PPI and 1260 PPI, respectively. The aperture ratio of the color-filter-based 3780-PPI LCD is nearly zero, while the 1260 PPI LCD can be maintained at about 20%, which implies that FSC LCDs consume much less power than color filter-based LCDs. It is noted that for color filters and FSC, their aperture ratios in reflective liquid-crystal-on-silicon (LCoS) [34] are approximately the same. Therefore, the major difference between color filters based on LCoS and FSC LCoS is solely determined by the absorption of color filters and the efficiencies of white or RGB LEDs.

5. Discussions

Through eliminating color filters, both spatial resolution and optical efficiency can be tripled, but the shorter capacitor charging time needs to be considered as well. Because of the reduced turn-on time (~0.3 ms), LED backlights should be optimized to generate the required peak brightness. A multistring LED backlight driving system [35] was proposed to alleviate the requirement for a higher peak power and reduce power consumption. On the other hand, the shorter capacitor charging time will slightly lower the transmittance, but the ~3× optical gain may compensate for the decreased transmittance. Furthermore, using multiple ICs to scan the gate lines simultaneously can restore it to an original charge time without FSC. The increased cost will still be much cheaper than micro-OLEDs using a whole silicon wafer. Another strategy is to employ TFTs with a higher mobility and thereby reduce the time constant of the capacitor.
As for contrast ratio, the mini-LEDs can be employed to increase the contrast ratio of the LCD [36,37]. With the help of mini-LEDs, the vertical alignment (VA) mode will not outperform the FFS mode in terms of contrast ratio. Furthermore, it is challenging to obtain such a fast response time using VA mode. For a fair comparison, we used a high-performance negative dielectric anisotropic LC mixture [38] in simulations. The LC mixture features a high birefringence (Δn = 0.191 at λ = 550 nm), and low viscosity ( γ 1 / K 33 = 6.7 ms/μm2 at 50 ° C ). Other simulation conditions are as follows: cell gap is 2 μm, on-state voltage is 5.2 Vrms, and operating temperature is 50 ° C . The simulated results are listed in Table 2. The average GTG response time is 3.8 ms, which is much slower than that of FFS LCDs at the same temperature. To further decrease the response time of VA mode, a slightly thinner cell gap of 1.8 μm and a higher on-state voltage of 6 Vrms are employed. The average GTG response time is decreased to 3.1 ms, which is still slower than that of FFS LCDs.
In a conventional VA cell, a negative dielectric anisotropy (Δε) LC is usually used and the electric field is in the longitudinal direction. However, if a lateral field is applied to activate the VA cell, then a positive Δε LC can also be considered, as reported in [39], where an additional longitudinal field is applied to accelerate the LC director’s restoring time. As a result, both fast turn-on and turn-off processes can be achieved, even at a low temperature [39]. Bidirectional field switching (BFS) has also been demonstrated to achieve fast response time [40]. Here, a BFS controller is used to switch between the vertical field and the twisted-planar field. Both approaches can achieve fast response time, but the driving circuits are complicated, and the optical transmittance is reduced.
Besides response time, viewing angle is another concern for VA mode. Negative c-plate compensation films may be introduced to widen the viewing cone of VA mode. On the positive side, the VA mode with incident circularly-polarized light can exhibit a much higher transmittance than the FFS mode using zero rubbing angle. Micro-OLED is another type of light engine that exhibits ultrahigh contrast ratio and small form factor. However, when the cavity effect of a micro-OLED panel is weak, the broad angular distribution will cause more stray light in the pancake system, which in turn degrades the system contrast ratio. Overall, the FFS FSC-LCD using a locally dimmable mini-LED backlight is a strong contender for VR displays.

6. Conclusions

One of the biggest hurdles for immersive VR is screen-door effect, which arises from inadequate resolution density of the microdisplays. In other words, the pixel structure including black matrices may be noticeable because of the large magnification from the lens if the resolution density is not high enough. To solve this tough problem, we propose an FSC LCD to achieve 60 PPD and 100° FoV while maintaining a low power consumption for compact VR displays. To prove the concept, in the experiment we reported and evaluated a new high birefringence nematic LC mixture. Our simulation results show that the average GTG response time can be as fast as ~1.5 ms to avoid color breakup. The FSC LCD also exhibits a high contrast ratio, superior color uniformity, and wide color gamut.

Author Contributions

Methodology, Z.Y.; experiments, Z.Y., Y.Q. and J.Z.; simulations, Z.Y. and Y.Q.; power consumption, Z.Y. and C.-L.L. (Chia-Lun Lee); writing—original draft preparation, Z.Y.; writing—review and editing, S.-T.W.; supervision, C.-L.L. (Chih-Lung Lin) and S.-T.W. All authors have read and agreed to the published version of the manuscript.

Funding

This research is supported by the Meta distinguished faculty award.

Institutional Review Board Statement

Not applicable.

Informed Consent Statement

Not applicable.

Data Availability Statement

The data presented in this study are available from the authors upon reasonable request.

Acknowledgments

The authors would like to thank JNC for providing the LC mixture.

Conflicts of Interest

The authors declare no conflict of interest.

References

  1. Hsiang, E.L.; Yang, Z.; Yang, Q.; Lai, P.C.; Lin, C.L.; Wu, S.T. AR/VR light engines: Perspectives and challenges. Adv. Opt. Photonics 2022, 14, 783–861. [Google Scholar] [CrossRef]
  2. Yin, K.; Hsiang, E.L.; Zou, J.; Li, Y.; Yang, Z.; Yang, Q.; Lai, P.C.; Lin, C.L.; Wu, S.T. Advanced liquid crystal devices for augmented reality and virtual reality displays: Principles and applications. Light Sci. Appl. 2022, 11, 161. [Google Scholar] [CrossRef]
  3. Hsiang, E.L.; Yang, Z.; Zhan, T.; Zou, J.; Akimoto, H.; Wu, S.T. Optimizing the display performance for virtual reality systems. OSA Contin. 2021, 4, 3052–3067. [Google Scholar] [CrossRef]
  4. Matsushima, T.; Kimura, S.; Komura, S. Fast response in-plane switching liquid crystal display mode optimized for high-resolution virtual-reality head-mounted display. J. Soc. Inf. Disp. 2021, 29, 221–229. [Google Scholar] [CrossRef]
  5. Yoshihara, T.; Makino, T.; Inoue, H. 52.1: Invited Paper: A 254-ppi Full-color Video Rate TFT-LCD Based on Field Sequential Color and FLC Display. SID Symp. Dig. Tech. Pap. 2000, 31, 1176–1179. [Google Scholar] [CrossRef]
  6. Guo, Q.; Yan, K.; Chigrinov, V.; Zhao, H.; Tribelsky, M. Ferroelectric liquid crystals: Physics and applications. Crystals 2019, 9, 470. [Google Scholar] [CrossRef] [Green Version]
  7. Shi, L.; Srivastava, A.K.; Cheung, A.; Hsieh, C.T.; Hung, C.L.; Lin, C.H.; Lin, C.H.; Sugiura, N.; Kuo, C.W.; Chigrinov, V.G.; et al. Active matrix field sequential color electrically suppressed helix ferroelectric liquid crystal for high resolution displays. J. Soc. Inf. Disp. 2018, 26, 325–332. [Google Scholar] [CrossRef]
  8. Huang, Y.; Chen, H.; Tan, G.; Tobata, H.; Yamamoto, S.I.; Okabe, E.; Lan, Y.-F.; Tsai, C.-Y.; Wu, S.T. Optimized blue-phase liquid crystal for field-sequential-color displays. Opt. Mater. Express 2017, 7, 641–650. [Google Scholar] [CrossRef] [Green Version]
  9. Singh, G. Recent advances on cadmium free quantum dots-liquid crystal nanocomposites. Appl. Mater. Today 2020, 21, 100840. [Google Scholar]
  10. Kumar, A.; Singh, D.P.; Singh, G. Recent progress and future perspectives on carbon-nanomaterial-dispersed liquid crystal composites. J. Phys. D Appl. Phys. 2021, 55, 083002. [Google Scholar] [CrossRef]
  11. Lee, S.H.; Lee, S.L.; Kim, H.Y. Electro-optic characteristics and switching principle of a nematic liquid crystal cell controlled by fringe-field switching. Appl. Phys. Lett. 1998, 73, 2881–2883. [Google Scholar] [CrossRef]
  12. Kim, D.H.; Lim, Y.J.; Kim, D.E.; Ren, H.; Ahn, S.H.; Lee, S.H. Past, present, and future of fringe-field switching-liquid crystal display. J. Inf. Disp. 2014, 15, 99–106. [Google Scholar] [CrossRef] [Green Version]
  13. Wu, S.T. A nematic liquid crystal modulator with response time less than 100 µs at room temperature. Appl. Phys. Lett. 1990, 57, 986–988. [Google Scholar] [CrossRef]
  14. HDR, VR. Available online: https://research.facebook.com/file/397914259053513/HDR-VR.pdf (accessed on 30 August 2022).
  15. Narasimhan, B.A. Ultra-Compact pancake optics based on ThinEyes super-resolution technology for virtual reality headsets. Proc. SPIE 2018, 10676, 359–366. [Google Scholar]
  16. Maimone, A.; Wang, J.R. Holographic optics for thin and lightweight virtual reality. ACM Trans. Graph. 2020, 39, 67. [Google Scholar] [CrossRef]
  17. Li, Y.; Zhan, T.; Yang, Z.; Xu, C.; LiKamWa, P.L.; Li, K.; Wu, S.T. Broadband cholesteric liquid crystal lens for chromatic aberration correction in catadioptric virtual reality optics. Opt. Express 2021, 29, 6011–6020. [Google Scholar] [CrossRef]
  18. Haller, I. Thermodynamic and static properties of liquid crystals. Prog. Solid State Chem. 1975, 10, 103–118. [Google Scholar] [CrossRef]
  19. Wu, S.T.; Wu, C.S. Rotational viscosity of nematic liquid crystals A critical examination of existing models. Liq. Cryst. 1990, 8, 171–182. [Google Scholar] [CrossRef]
  20. Wu, S.T.; Lackner, A.M.; Efron, U. Optimal operation temperature of liquid crystal modulators. Appl. Opt. 1987, 26, 3441–3445. [Google Scholar] [CrossRef]
  21. Talukder, J.R.; Huang, Y.; Wu, S.T. High performance LCD for augmented reality and virtual reality displays. Liq. Cryst. 2019, 46, 920–929. [Google Scholar] [CrossRef]
  22. Chen, H.; Peng, F.; Luo, Z.; Xu, D.; Wu, S.T.; Li, M.C.; Lee, S.L.; Tsai, W.C. High performance liquid crystal displays with a low dielectric constant material. Opt. Mater. Express 2014, 4, 2262–2273. [Google Scholar] [CrossRef] [Green Version]
  23. Wu, S.T. Birefringence dispersions of liquid crystals. Phys. Rev. A 1986, 33, 1270–1274. [Google Scholar] [CrossRef]
  24. Choi, T.H.; Oh, S.W.; Park, Y.J.; Choi, Y.; Yoon, T.H. Fast fringe-field switching of a liquid crystal cell by two-dimensional confinement with virtual walls. Sci. Rep. 2016, 6, 27936. [Google Scholar] [CrossRef] [PubMed]
  25. Choi, T.H.; Woo, J.H.; Choi, Y.; Yoon, T.H. Interdigitated pixel electrodes with alternating tilts for fast fringe-field switching of liquid crystals. Opt. Express 2016, 24, 27569–27576. [Google Scholar] [CrossRef] [PubMed]
  26. Yang, C.L.; Wu, Y.H.; Yao, I.A.; Tsou, Y.S.; Tsai, C.H.; Lin, J.S. 47-1: Invited Paper: High Resolution HDR VR display using Mini-LED. SID Symp. Dig. Tech. Pap. 2021, 52, 636–639. [Google Scholar] [CrossRef]
  27. Yamada, F.; Nakamura, H.; Sakaguchi, Y.; Taira, Y. Sequential-color LCD based on OCB with an LED backlight. J. Soc. Inf. Disp. 2002, 10, 81–85. [Google Scholar] [CrossRef]
  28. Zhu, X.; Ge, Z.; Wu, S.T. Analytical solutions for uniaxial-film-compensated wide-view liquid crystal displays. J. Disp. Technol. 2006, 2, 2–20. [Google Scholar] [CrossRef]
  29. Harbers, G.; Hoelen, C. LP-2: High Performance LCD Backlighting using High Intensity Red, Green and Blue Light Emitting Diodes. SID Symp. Dig. Tech. Pap. 2001, 32, 702–705. [Google Scholar] [CrossRef] [Green Version]
  30. Hsiang, E.L.; Yang, Z.; Yang, Q.; Lan, Y.F.; Wu, S.T. Prospects and challenges of mini-LED, OLED, and micro-LED displays. J. Soc. Inf. Disp. 2021, 29, 446–465. [Google Scholar] [CrossRef]
  31. Ma, L.; Li, C.; Sun, L.; Song, Z.; Lu, Y.; Li, B. Submicrosecond electro-optical switching of one-dimensional soft photonic crystals. Photonics Res. 2022, 10, 786–792. [Google Scholar] [CrossRef]
  32. Bulashevich, K.A.; Kulik, A.V.; Karpov, S.Y. Optimal ways of colour mixing for high-quality white-light LED sources. Phys. Status Solidi A 2015, 212, 914–919. [Google Scholar] [CrossRef]
  33. Chen, H.; Zhu, R.; He, J.; Duan, W.; Hu, W.; Lu, Y.Q.; Li, M.C.; Lee, S.L.; Dong, Y.; Wu, S.T. Going beyond the limit of an LCD’s color gamut. Light Sci. Appl. 2017, 6, e17043. [Google Scholar] [CrossRef] [PubMed] [Green Version]
  34. Chen, H.; Gou, F.; Wu, S.T. Submillisecond-response nematic liquid crystals for augmented reality displays. Opt. Mater. Express 2017, 7, 195–201. [Google Scholar] [CrossRef] [Green Version]
  35. Wu, C.Y.; Wu, T.F.; Tsai, J.R.; Chen, Y.M.; Chen, C.C. Multistring LED backlight driving system for LCD panels with color sequential display and area control. IEEE Trans. Ind. Electron. 2008, 55, 3791–3800. [Google Scholar]
  36. Hsiang, E.L.; Yang, Q.; He, Z.; Zou, J.; Wu, S.T. Halo effect in high-dynamic-range mini-LED backlit LCDs. Opt. Express 2020, 28, 36822–36837. [Google Scholar] [CrossRef] [PubMed]
  37. Yang, Z.; Hsiang, E.L.; Qian, Y.; Wu, S.T. Performance comparison between mini-LED backlit LCD and OLED display for 15.6-inch notebook computers. Appl. Sci. 2022, 12, 1239. [Google Scholar] [CrossRef]
  38. Chen, Y.; Peng, F.; Wu, S.T. Submillisecond-response vertical-aligned liquid crystal for color sequential projection displays. J. Disp. Technol. 2013, 9, 78–81. [Google Scholar] [CrossRef]
  39. Iwata, Y.; Murata, M.; Tanaka, K.; Ohtake, T.; Yoshida, H.; Miyachi, K. Novel super fast response vertical alignment-liquid crystal display with extremely wide temperature range. J. Soc. Inf. Disp. 2014, 22, 35–42. [Google Scholar] [CrossRef]
  40. Palto, S.P.; Barnik, M.I.; Geivandov, A.R.; Kasyanova, I.V.; Palto, V.S. Submillisecond inverse TN bidirectional field switching mode. J. Disp. Technol. 2016, 12, 992–999. [Google Scholar] [CrossRef]
Figure 1. Temperature-dependent birefringence at λ = 633 nm and f = 1 kHz (the frequency of driving voltage applied on the LC cell). Dots are measured data and the solid line is the fitting curve with Equation (1).
Applsci 13 02635 g001
Figure 2. Temperature-dependent visco-elastic constant. Squares are measured data and the solid line is the fitting curve with Equation (2).
Applsci 13 02635 g002
Figure 3. Temperature-dependent figure of merit. Squares are measured data and the solid line is the fitting curve with the definition of FoM.
Applsci 13 02635 g003
Figure 4. Wavelength-dependent birefringence at 22 °C. Triangles are measured data and the solid line is the fitting curve with Equation (3).
Applsci 13 02635 g004
Figure 5. Simulated temperature-dependent average GTG response times at different electrode widths and gaps.
Applsci 13 02635 g005
Figure 6. Simulated voltage-dependent transmittance at w = 1.5 μm, g = 1.5 μm, and T = 50 °C.
Applsci 13 02635 g006
Figure 7. Simulated isocontrast contour for single-domain FFS mode using TechWiz software. The operating temperature is 50 °C.
Applsci 13 02635 g007
Figure 8. The spectra of (a) RGB LEDs used in the FSC LCD, and (b) a blue LED, green QDs, and red QDs in the backlight module of the LCD.
Applsci 13 02635 g008
Figure 9. Simulated color shift versus viewing angles for RGB wavelengths at horizontal (dashed lines) and vertical directions (solid line), respectively, for (a) FSC LCD with RGB LEDs, and (b) LCD with QDs and color filters.
Applsci 13 02635 g009
Table 1. Simulated response time of FFS mode between different gray levels without overdrive and undershoot. The operating temperature is 50 °C.
Rise Time (ms)
Decay time (ms)Gray level064128192255
0\2.171.971.771.74
640.62\1.751.641.84
1280.651.65\1.602.07
1920.691.581.61\2.50
2550.751.511.571.60\
Table 2. Simulated response time of VA mode between different gray levels without overdrive and undershoot. The operating temperature is 50 °C.
Rise Time (ms)
Decay time (ms)Gray level064128192255
0\10.186.664.621.50
641.79\5.233.811.15
1281.935.51\3.651.02
1922.085.364.65\0.96
2552.355.374.884.14\
Disclaimer/Publisher’s Note: The statements, opinions and data contained in all publications are solely those of the individual author(s) and contributor(s) and not of MDPI and/or the editor(s). MDPI and/or the editor(s) disclaim responsibility for any injury to people or property resulting from any ideas, methods, instructions or products referred to in the content.