Article

New Contributions for Damping Assessment on Filler-Beam Railway Bridges Framed on In2Track EU Projects

1
CONSTRUCT—LESE, Faculty of Engineering, University of Porto, 4200-465 Porto, Portugal
2
CONSTRUCT—LESE, School of Engineering, Polytechnic of Porto, 4249-015 Porto, Portugal
3
Division of Structural Engineering and Bridges, KTH Royal Institute of Technology, SE-100 44 Stockholm, Sweden
*
Author to whom correspondence should be addressed.
Appl. Sci. 2023, 13(4), 2636; https://doi.org/10.3390/app13042636
Submission received: 14 January 2023 / Revised: 12 February 2023 / Accepted: 16 February 2023 / Published: 18 February 2023
(This article belongs to the Special Issue Intelligent Systems for Railway Infrastructure)

Abstract

:
Structural damping is an important characteristic in railway bridges, which affects the performance of the structure, especially for bridges with train speeds higher than 200 km/h. The accurate evaluation of damping must be performed properly to correctly assess the structural performance of the bridge under dynamic loading conditions. The present article introduces an alternative methodology that contributes to the assessment of damping coefficients with application to railway bridges. The methodology is based in the Prony method with an energy-sorting technique for the identification of dominant frequencies of a free vibration signal of a passing train. The numerical validation of the method is based on a sensitivity analysis of the free vibration periods of signals through the evaluation of influence lines of displacement and numerically simulated receptance tests, and in the estimation of the damping coefficient from the free vibration period obtained in a train-bridge interaction dynamic analysis with a known imposed value. Finally, and in the scope of the In2Track2 and In2Track3 projects, the experimental assessment of damping coefficients using this methodology was carried out, considering four filler-beam bridges from the Portuguese Railway Network. The ambient vibration tests allowed the evaluation of the main frequencies and damping in these bridges, and the dynamic tests under railway traffic allowed the definition of the dynamic response of these bridges and subsequent application of the Prony method for two types of trains. The results of this work allow a new update of the database for damping coefficients of filler-beam railway bridges, contributing to future revisions of EN1991-2.

1. Introduction

Railway bridges are structures in which the dynamic effects induced by traffic loads can reach significant values, especially for speeds higher than 200 km/h [1,2]. The magnitude of the dynamic effects largely depends on the characteristics of the train–track–bridge system and their interfaces [3]. From the track–bridge system, the stiffness, mass, and damping properties are particularly relevant, both from the bridge and track, while from the train subsystem, the speed, the loading scheme (i.e., number of axles, axles spacing, and loads values), as well as the values of the sprung and unsprung masses, are important parameters [4,5]. Regarding the wheel–rail interface, the characterization of the track irregularities profiles and wheel defects (e.g., wheel flats and polygonization) are also relevant [6,7].
In what specifically concerns damping in railway bridges, its accurate evaluation is crucial since this parameter strongly influences the maximum dynamic response under railway traffic, particularly in resonance or near resonance scenarios [8]. However, most of the conventional and high-speed traffic operates at speeds that are not susceptible to causing the resonance phenomena.
Stollwitzer et al. [9] state that during bridge crossing by trains, several damping mechanisms, more specifically, energy dissipation mechanisms, occur with different levels of complexity and importance. Furthermore, these energy dissipation mechanisms are derived from the different subsystems and their interfaces, mainly at the: (i) bridge, (ii) track–bridge interface, (iii) bridge–soil interfaces, and iv) train–bridge interface.
At the bridge, the energy dissipation is associated with the material damping closely associated with the amplitude of the deflections of the bridge deck. Additionally, the dissipation of energy within materials is usually relevant in the case of composite bridges, as well as the materials deterioration due to ageing mostly associated with relative movements at cracks [1]. Brunetti et al. [10] state that several non-structural components can increase the damping capacity, such as the bridge and rail expansion joints, the bearings, and handrails [11]. In the case of friction bearings, due to rotation of the deck and the bearing eccentricity in relation to the deck axis, the damping is derived from the cyclic longitudinal displacements on the supports. More recently, in the retrofitting of existing railway bridges, the use of fluid viscous dampers to reduce the vertical acceleration levels allowed an additional energy dissipation effect, through hysteresis cycles, during the train passages [12,13,14].
Concerning the track–bridge interface, the damping is mainly associated with the longitudinal relative displacements occurring between the rail and deck through the ballast layer, allowing the transmission of longitudinal stresses between these two elements. The nonlinear behaviour of the track–deck interface is responsible for a very important energy dissipation mechanism, mainly at short/medium span bridges [11,15]. Inclusively, this effect can be responsible for the existence of non-proportional damping, increased complexity of the bridge mode shapes, and damping ratios [16,17]. Additionally, Reiterer et al. [18], Stollwitzer et al. [19] and Ülker-Kaustell & Karoumi [20] showed that the damping is influenced by the seasonal (summer/winter) weather conditions due to freezing of the ballast layer, especially in railway lines not heavily trafficked.
At the bridge–soil interfaces, due to the soil–structure interaction (SSI) phenomena, there is an important energy dissipation by irradiation to the underground and adjacent terrain, particularly at the foundations and abutments [1,21,22].
Regarding the train–bridge dynamic interaction, there is an energy dissipation due to track-induced vertical relative displacements caused by the moving train [23]. This type of energy dissipation occurs both in the embankment and in the ballasted track on the bridge. EN1991-2 [2] defines specific values for this additional damping of the bridge as a function of the bridge span length which some authors considered to be non-conservative [23]. Inclusively, Stoura & Dimitrakopoulos [24] shows that the additional damping can assume negative values, which implies influx instead of dissipation of energy. This situation occurs when the mass of the wheels cannot be neglected in comparison to the bridge mass, and for specific locations of the vehicle over the bridge.
In relation to the experimental damping estimation, several strategies are available depending on the type of test adopted, namely, the ambient vibration tests [25,26], the forced vibration tests [18,27], and the dynamic test under traffic actions [28,29]. In many works, the damping estimations are performed under ambient vibration conditions [30,31]. However, this scenario of low vibration amplitude is not representative of the real loading conditions of a train crossing a bridge, particularly in terms of amplitude of vibration, as well as considering the train–bridge interaction and eventual non-linear incursions at the bearings and track–deck interface. Thus, the use of forced vibration tests, resorting to an external controlled excitation by means of dedicated equipment, constitutes a partial solution, since, even in these circumstances, the vibration amplitude is not necessarily representative of the amplitudes induced by real traffic loads [18]. In addition, the test setups are usually complex, time consuming and costly, and in some situations may require the temporary occupation of the track corridor. Therefore, the most used strategy to estimate the damping ratios is based on dynamic tests under traffic actions, particularly using time records collected during or after the train passage [1,16]. Stollwitzer et al. [9,19] used a large-scale test facility to simulate a dynamic test under traffic loads and quantified the ballasted track’s damping properties under vertical excitations. These authors proved that in a ballasted track, the damping values are frequency-dependent and approximately linear amplitude-dependent. Based on the results of a dynamic test under traffic loads on a steel–concrete composite bridge, Ülker-Kaustell & Karoumi [32] also verified that the damping ratios increased with increasing amplitude of vibration.
Focusing on the dynamic tests under traffic actions, there are several methodologies to calculate the damping ratios, mostly based on the free vibration response after the train passage [26,28,29,33], as well as during the train passage [1]. Considering the free vibration responses, the mostly used techniques resort to the Logarithmic Decrement (LD) method [26], Autoregressive models [1], Prony–Pisarenko method [34], Hilbert transform [35], Kalman filters [36], and Continuous Wavelet Transforms (CWT) [32].
The LD method is particularly efficient in situations where the free vibration records are predominantly influenced by non-coupled modes of vibration, where the application of pass-band filters can efficiently separate the contribute from one mode in relation to the others [25,37]. Brunetti et al. [10] performed an extensive damping measurement campaign in a multi-girder RC simply supported viaduct using the free vibration parts of the vertical acceleration records for the passage of ETR500/1000 high-speed trains. The authors used the LD method resulting in damping ratios for the vertical bending mode between 2.76% and 3.70%. These values were considerable higher in comparison to the damping ratio of 1% provided by EN1991-2 [2], which confirms the conservative lower bound damping ratios provided by the norm and depicted by several other authors [16,18,25,26,28,29,33]. Malveiro et al. [26] applied the LD method to estimate the damping coefficients of local modes of vibration of the upper slab of a RC box-girder viaduct. The authors used the free vibration response of a deck slab considering the time lapse between the successive groups of axles, revealed as sufficient to have several free vibration responses periods.
ERRI D214/RP3 [1] proposed a specific procedure to estimate the damping in railway bridges. First, isolate the free vibration part of the record based on the exact identification of the time when the train leaves the bridge using the so-called multiple-impulse method. Second, estimate the damping using one of the reference methods, which are Prony–Pisarenko or Auto-Regressive methods. Additionally, this Committee proposed to evaluate the non-linearity of the damping ratio using a strategy consisting of, first, evaluating the damping based on the initial four cycles in free vibration, and then, moving forward one cycle and calculating again the damping. This would allow one to show the eventual dependency of the damping with the variation of the amplitude of vibration.
More recent methods propose evaluating the damping during the train passage, which are revealed to be particularly efficient in situations close to resonance. ERRI D214/RP3 [1] adopted the ARX method (Auto Regressive with eXogenous inputs) which is a non-linear time series model able to reproduce the dynamic response of the bridge based on previous responses (outputs) and previous forces (inputs). The application of the method requires the reconstitution of the excitation model of the moving train based on multiple-impulse decomposition and application of perceptual filters [1]. However, this method proposed by the ERRI D214 Committee has not yet a widespread use and requires new enhancements in further studies.
Thus, this study aims to give clear contributions in relation to some aspects that presently, according to the authors’ knowledge, are not sufficiently addressed in the existent literature, particularly:
-
To provide reliable estimates for the damping ratios of railway bridges, which typologies are not sufficiently covered by EN1991-2 [2] and previous studies of Committee D214 from ERRI [1], particularly the filler-beam type. For this purpose, a set of dedicated experimental campaigns were performed in a significant number of filler-beam bridges belonging to the Portuguese railway network. The information derived from this study, framed in the Shift2Rail EU Projects In2track2 [38] and In2track3 [39], can be certainly valuable for the future revisions of the norm EN1991-2 [2].
-
To propose a consistent methodology for estimation of the damping ratios envisaging the short/medium span filler-beam railway bridges, in which, mostly, exists coupling between the bending and torsion fundamental modes, and therefore, the classical LD method presents limitations.
-
Application of the Prony method as the reference method to efficiently estimate the damping ratios in filler-beam railway bridges with coupled and closely spaced fundamental modes of vibration. Since the precursors studies of the Committee ERRI D214, at the end of the 1990s, this method has been very rarely used in studies involving railway bridges. In most situations, the authors insistently remain using the LD method. Additionally, a numerical validation of the Prony method is performed based on a 3D Finite element (FE) model of a filler-beam bridge, in which a set of predefined damping ratio values were defined, and, posteriorly, based on the free vibration responses under traffic actions, the damping estimates were confirmed.
-
To propose a simple methodology to precisely estimate the exact time step when the last train axle no longer influences the dynamic response of the bridge, and therefore, it initiates the free vibration movement. This is particularly relevant for two reasons: First, the methodology proposed by ERRI D214/RP3 [1], based on the multiple-impulse method, is not very straightforward, which makes the computational implementation difficult; Second, the adequate removal of parts of the bridge vibration record that are still influenced by the train excitation will considerably enhance the ability to provide more robust damping estimates.

2. Methodology for Estimation of Damping on Bridges Based on Dynamic Tests under Railway Traffic

2.1. Initial Considerations

This section describes the Prony method used to estimate damping coefficients using the free vibration acceleration records from passing trains. This method comprises an initial formulation of the transfer functions of the records to achieve its coefficients, then, using a partial-fraction expansion of the transfer functions, thus obtaining the residues and poles that will help to get the different parameters of each record. An energy sorted Prony method will be used to identify the dominant frequencies of each free vibration record.
The Prony method was initially developed by Gaspard Richie de Prony in 1795 [40] to explain the expansion of various gases. This method showed itself to be a great technique to model a linear sum of damped complex exponential sinusoids to data signals that are uniformly spaced [40,41,42,43]. The Prony method has the advantage of estimating damping coefficients apart from frequency, phase, and amplitude. In addition, it best fits a reduced-order model to a high-order system in the time and frequency domain [42,43]. On the other hand, the Prony method is known to have poor behaviour when a signal is subjected to a high amplitude of noise [42]. This is because the method is very sensitive to noise, making it not suitable to separate the noise from the real data signal, thus failing to accurately fit the exponential sinusoids to the signal. When this occurs, the estimated damping and frequencies of the signal are miss-estimated, leading usually to much higher values than the actual ones [42]. A good way to bypass this situation is to apply a lowpass filter to the original data signal to eliminate as much noise as possible associated with higher frequencies. Qi et al. [44] and Johnson et al. [45] show that the application of the Prony method to signals that are too short or excessively long may cause inaccuracies. Marple & Carey [42] recommend that the length of the Prony method analysis window should be at least one and a half periods associated with the lowest frequency of the data signal.

2.2. Methodology Overview

The proposed methodology to estimate damping coefficients on bridges based on the Prony method is an alternative methodology to the classical LD method, which allows the estimates of damping coefficients in railway bridges with coupled and closely spaced fundamental modes of vibration. This methodology uses the acceleration responses of the train’s passage, obtained from the tests under railway traffic. More details about the tests under railway traffic are presented in Section 4.3.2. From the acceleration responses from the trains, it is fundamental to identify the free vibration period of each response. It may be necessary to apply a lowpass filter to the original acceleration record in order to eliminate as much noise as possible, associated with higher frequencies. The free vibration records are the ones that will be inputs for the Prony method. The application of the method will fit a sum of damped sinusoids (predicted record) to the original free vibration record, thus extracting from the predicted signal the main parameters of the record, such as the frequency and the damping of each sinusoid that compose the original record. An explanation of the Prony method is described in Section 2.3. Ambient vibration tests, explained in Section 4.3.1, are also necessary to compare the obtained frequencies from the Prony method to those obtained from the tests, to identify the eigenfrequencies of the bridges in the records from the Prony method. A summary of the methodology is presented in Figure 1.

2.3. Prony Method Analysis for Damping Estimation

The Prony method analysis directly estimates the parameters of the free vibration data, y t , by fitting, in the time domain, a sum of damped sinusoids to evenly spaced sample values of the form given by [34]:
y ^ t = i = 1 N A i · e 2 π f i · ξ i · t · cos 2 π f i · t + ϕ i
where y ^ t is the estimate of the free vibration data y t consisting of L samples evenly spaced; y t = y t 1 , y t 2 , , y t k in which k = 0 ,   1 ,   2 ,   3 ,   ,   L 1 ; N is the total number of damped exponential sinusoids; A i , f i , ξ i , and ϕ i are the amplitude, frequency, damping coefficient, and phase angle, respectively, of the i th sinusoid.
The methodology to perform the Prony method analysis is based on the MATLAB’s Signal Processing Toolbox [46] function called prony. This function uses the Prony method analysis for an Infinite Impulse Response (IIR) digital filter for time-domain responses [47] to model a signal using a specified number of poles and zeros for a given data sequence and numerator and denominator orders. This methodology uses a variation of the covariance method of autoregressive modelling to find the denominator coefficients a and then to find the numerator coefficients b for which the resulting filter’s impulse response matches exactly the first L 1 samples of y t k [46]. The coefficients can be found using the transfer function of an IIR that is given by [47]:
H z = B z A z = b 0 + b 1 z 1 + b 2 z 2 + + b q z q 1 + a 1 z 1 + a 2 z 2 + + a p z p = k = 0 k = q b k z k l = 1 l = p a l z l
where q and p are the numerator and denominator orders of the transfer function, respectively; b k and a k are the numerator and denominator coefficients of the transfer function, respectively; and H z is the Z-transform of the impulse response h n given by
H z = n = h n z n
where z is a complex number and n is the samples of the impulse response function. More details about the calculation of the coefficients of the transfer function and about IIR digital filters can be found in Parks and Burrus [47].
The estimation of the amplitude, frequency, damping and phase angle of each sinusoid is obtained using the residuez function from the MATLAB Signal Processing Toolbox [46]. This function converts transfer functions to the partial fraction expansion form using the Z-transform, thus obtaining the residues r , the poles p , and the direct terms k . These terms are obtained considering the coefficients a and b from the transfer functions shown above. Each transfer function has a corresponding partial fraction expansion representation, expressed as [46]:
b z a z = r 1 1 p 1 z 1 + + r n 1 p n z 1 + k 1 + k 2 z 1 + + k m n + 1 z m n
where n and m are the numerator and denominator orders of the transfer function, respectively. The partial fraction expansion arises in signal processing as one method of finding the inverse Z-transform of a transfer function.
With the residues and poles, r and p , respectively, it is possible to calculate the parameters of each complex exponential sinusoid estimate [48]. These two parameters are in the form of a complex value a + b i . The amplitude A i , the frequency f i , the damping coefficient ξ i and the phase angle ϕ i from each sinusoid are given by Equations (5)–(8), respectively:
A i = m a g n i t u d e   o f   r i = a i 2 + b i 2
f i = 1 2 π Δ t i m a g ln p i
ξ i = 1 2 π f i Δ t r e a l ln p i
i = p h a s e   a n g l e   o f   r i = arctan b a
After calculating the different parameters for each sinusoid, it is possible to construct the estimated data y ^ t given by Equation (1). To compare the estimated data y ^ t with the original free vibration data y t , the Mean Squared Error ( M S E ) statistical estimator is used. This estimator measures the average squared difference between the original and predicted values, and is given by
M S E n = i = 0 L 1 y t i n y ^ t i n 2 L
where n is the order number of the model which comes from Equation (4) and indicates the degree of the denominator polynomial of the rational transfer function b z / a z , and L is the length of the signals. The ideal order number of the model is the one with the lowest M S E value.
Despite the Prony method’s capabilities for damping estimation, due to the high number of frequencies estimated, the accuracy of the method can be compromised, since it is prone to false detect frequency modes that are not related to the structure. Typically, most of these frequencies present very low or negative damping and may wrongly be interpreted as dominant modes. This problem could be overpassed with the energy sorting technique [48] presented in Section 2.4, where the modes are sorted according to their energy content.

2.4. Energy-Sorting Technique for Dominant Frequencies Identification

The energy-sorting technique sorts the energy content of each frequency of the complex exponential sinusoid model to identify the dominant frequencies of each model. The frequencies with higher energy content are treated as dominant frequencies, while the frequencies with lower energy content will be treated as trivial ones. The energy for each frequency E i can be expressed by
E i = j = 1 L r e a l r i p i j 2
where L is the length of the estimate y ^ t ; r i and p i are the residue complex value and the pole complex value, respectively, corresponding to the i th frequency. After this step, the energies can be sorted in a descending order to see which are the dominant frequencies of the signal. This method overcomes the aforementioned disadvantages of the Prony method, by reducing the chance of false frequency estimations, thus increasing the method’s accuracy.

3. Numerical Validation of the Damping Estimation Methodology

3.1. Initial Considerations

The present section aims to show the validation of the damping estimation methodology presented before in Section 2 based on a controlled numerical example. The validation, which is presented in detail in Section 3.3, consists of the estimation of pre-imposed damping coefficients using numerically simulated responses under railway traffic of a filler-beam type bridge belonging to the Portuguese railway network, the Cascalheira bridge. The 3D numerical model of this bridge has been developed, calibrated, and validated in a previous publication from the authors [28], while the dynamic analyses were performed with a train–track–bridge interaction methodology developed by Montenegro et al. [49]. To guarantee a comprehensive validation, several scenarios have been tested, including train passages at different speeds and considering different track irregularities. Since the accuracy of the damping estimation based on railway traffic induced vibrations is strongly dependent on the correct evaluation of the free vibration period of the bridge, a sensitivity analysis has been performed and presented in Section 3.2 to estimate the moment in which the free vibration actually starts after the train leaves the bridge.

3.2. Sensitivity Analysis in Relation to the Free Vibration Period

Due to the continuity effect provided by the track, the free vibration period does not start immediately after the train leaves the bridge, which may affect the accuracy of the damping estimation. To analyse this effect, two analyses, one static and another dynamic, were carried out: (i) evaluation of the static influence line of the displacements at midspan to analyse the distance for which the load starts to lose influence in the bridge’s response and (ii) evaluation of the receptance, also in relation to the midspan displacement, considering dynamic impact loads at different distances away from the bridge. To guarantee a comprehensive conclusion, these analyses were performed considering four different simply supported bridges with different spans based on existing bridges from the Portuguese network, some of them presented later in Section 4 and studied within the In2Track2 and InTrack3 EU projects. With this sensitivity analysis, it was possible to estimate the time for which the free vibration period starts after the train leaves the bridge.

3.2.1. Numerical Models

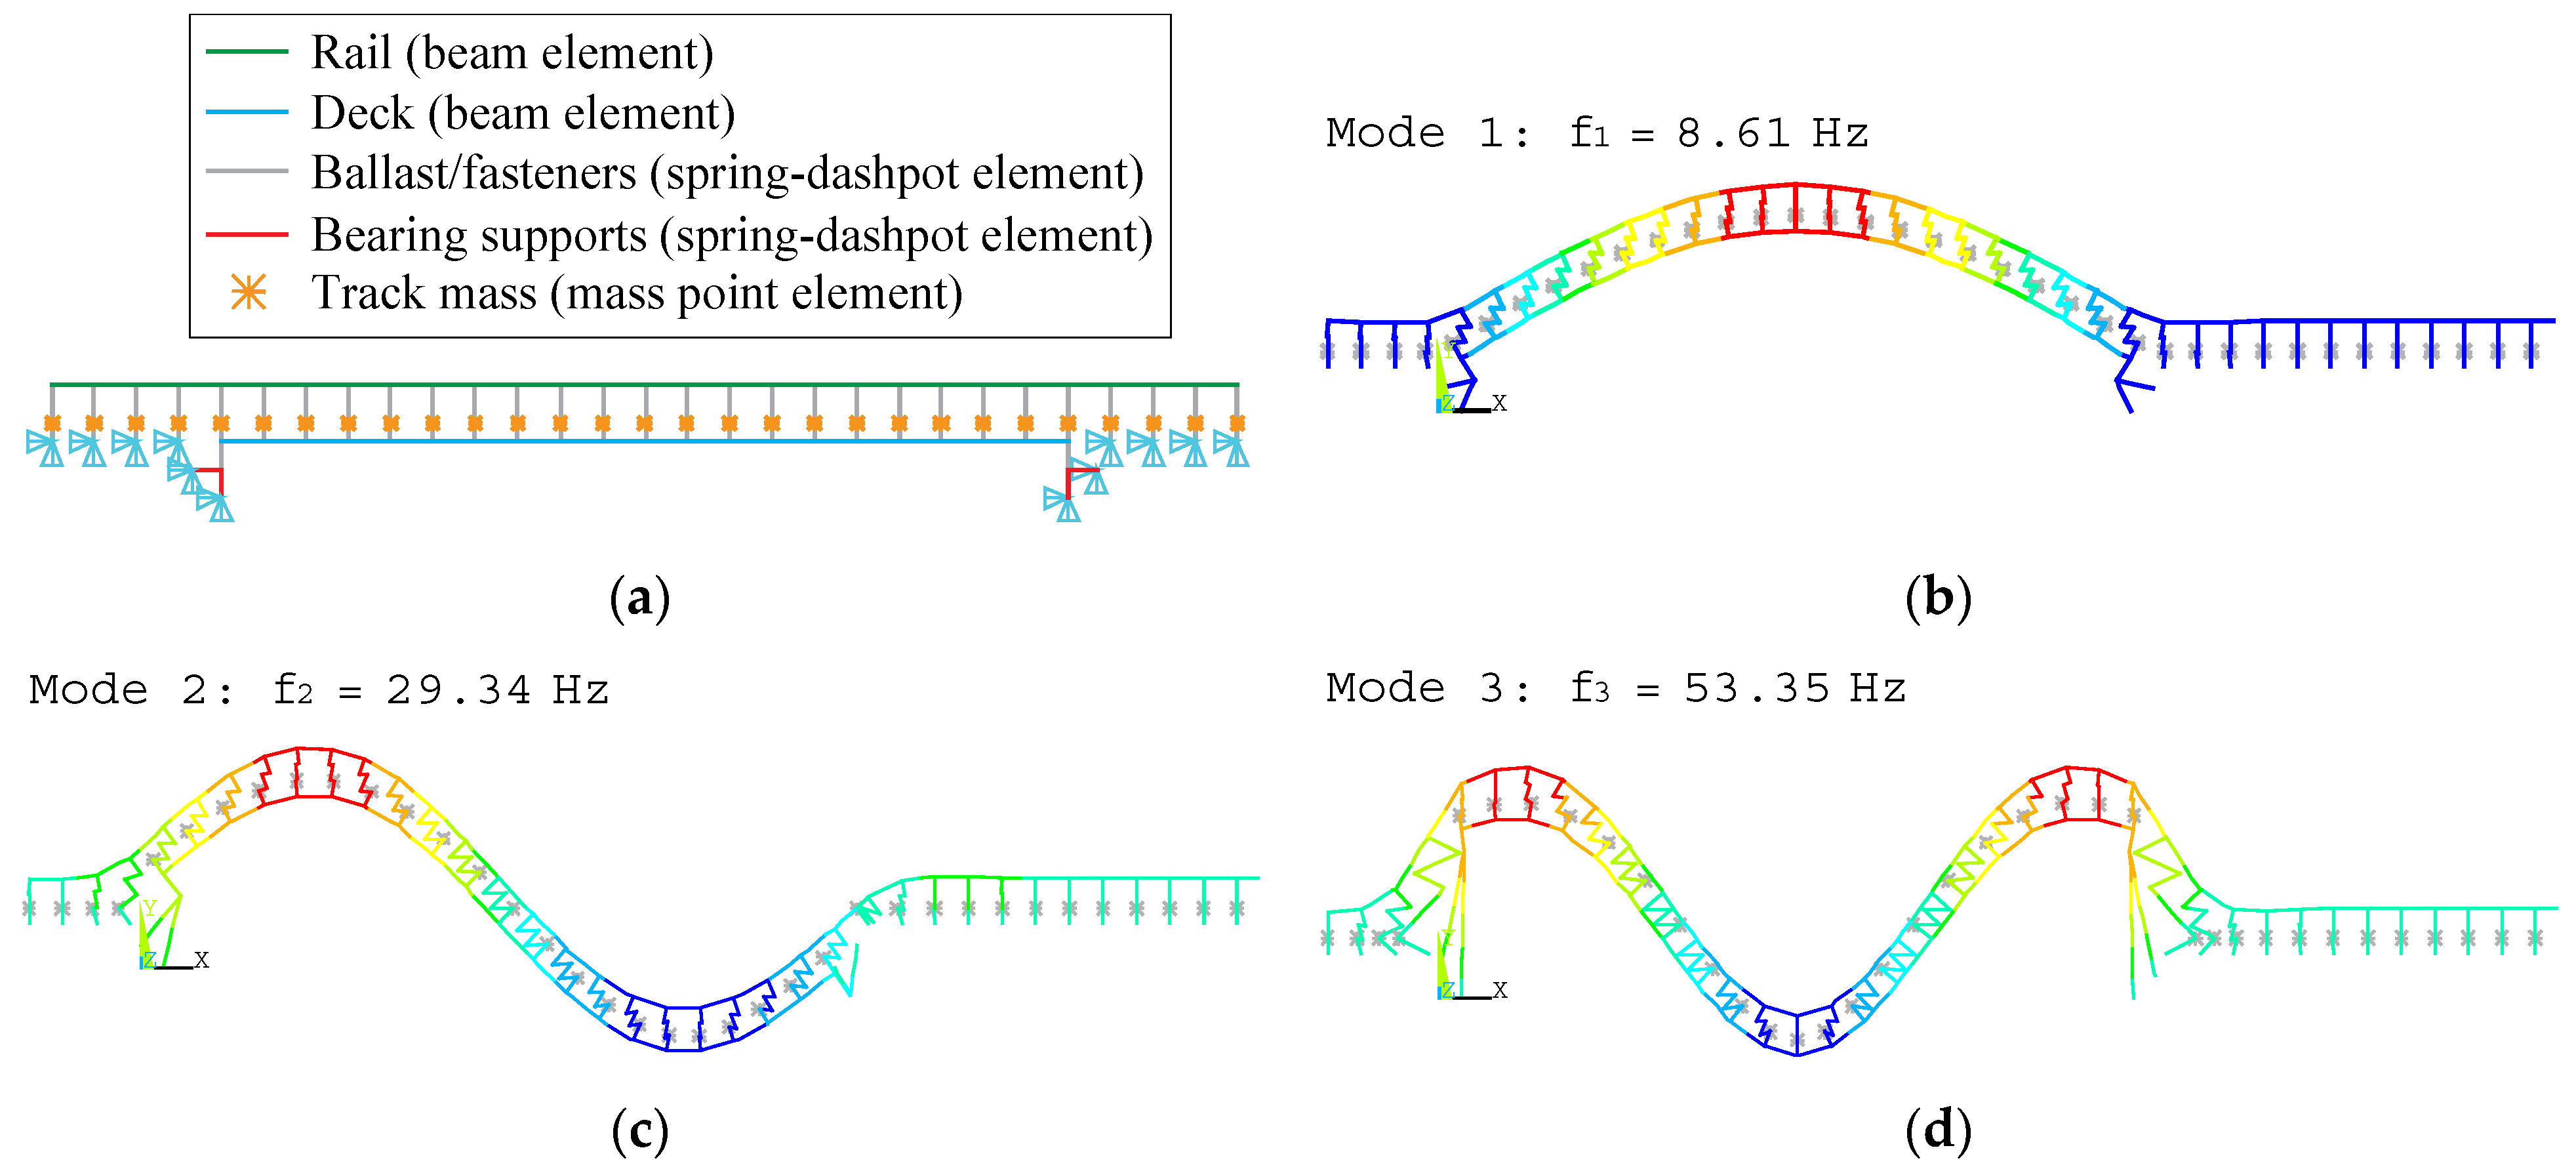
The analyses were performed with 2D numerical models of four different bridges with spans of, approximately, 7.00 m, 11.00 m, 11.50 m, and 23.50 m. The models were developed with ANSYS® [50] using beam elements to model the deck and rails (BEAM 188), spring-dashpot elements (COMBIN14) to simulate the ballast and railpads’ horizontal and vertical stiffness and damping, as well as the flexibility of the bearing supports, and mass point elements (MASS21) to consider the track mass (ballast and sleepers). Track extensions have been modelled on both extremities of the bridge to take into consideration the continuity provided by the track-deck coupling. Table 1 show the main parameters used in the numerical models. Figure 2 illustrates the numerical model of the 11.50 m span bridge for exemplification purposes, as well as the first three global modes of vibration and respective frequencies, while Table 2 presents the first three modal frequencies of all the analysed bridges.

3.2.2. Influence Line of the Midspan Displacements

As mentioned before, the objective of evaluating the influence line at the deck’s midspan is to estimate the distance from the bridge’s extremity for which the load starts to lose influence in the bridge’s response. To achieve this goal, the influence line was obtained through a static analysis in which a 147 kN load (equivalent to a typical train axle load) was applied in successive positions throughout the bridge deck and in the track extension. For each position of the load, the midspan displacement of the bridge was obtained and plotted to form the influence lines presented in Figure 3 for each bridge. In this Figure, it is possible to observe the position where the load enters and leaves the bridge, as well as the longitudinal position for which the load does not affect the bridge’s responses anymore. As can be observed, when the load is acting already outside the bridge in the track extension, the midspan displacements are not null, meaning that the continuity provided by the track still influences the bridge response. Depending on the deck size, the distance for which the load has a negligible effect in the response is different, but it is always between 2.4 and 2.8 m. Therefore, it can be concluded that the free vibration of the bridge starts only when the last load is already 2.4–2.8 m away from the bridge’s extremity. These results will be compared with those obtained in the dynamic receptance analysis presented in the next subsection.

3.2.3. Receptance at the Midspan

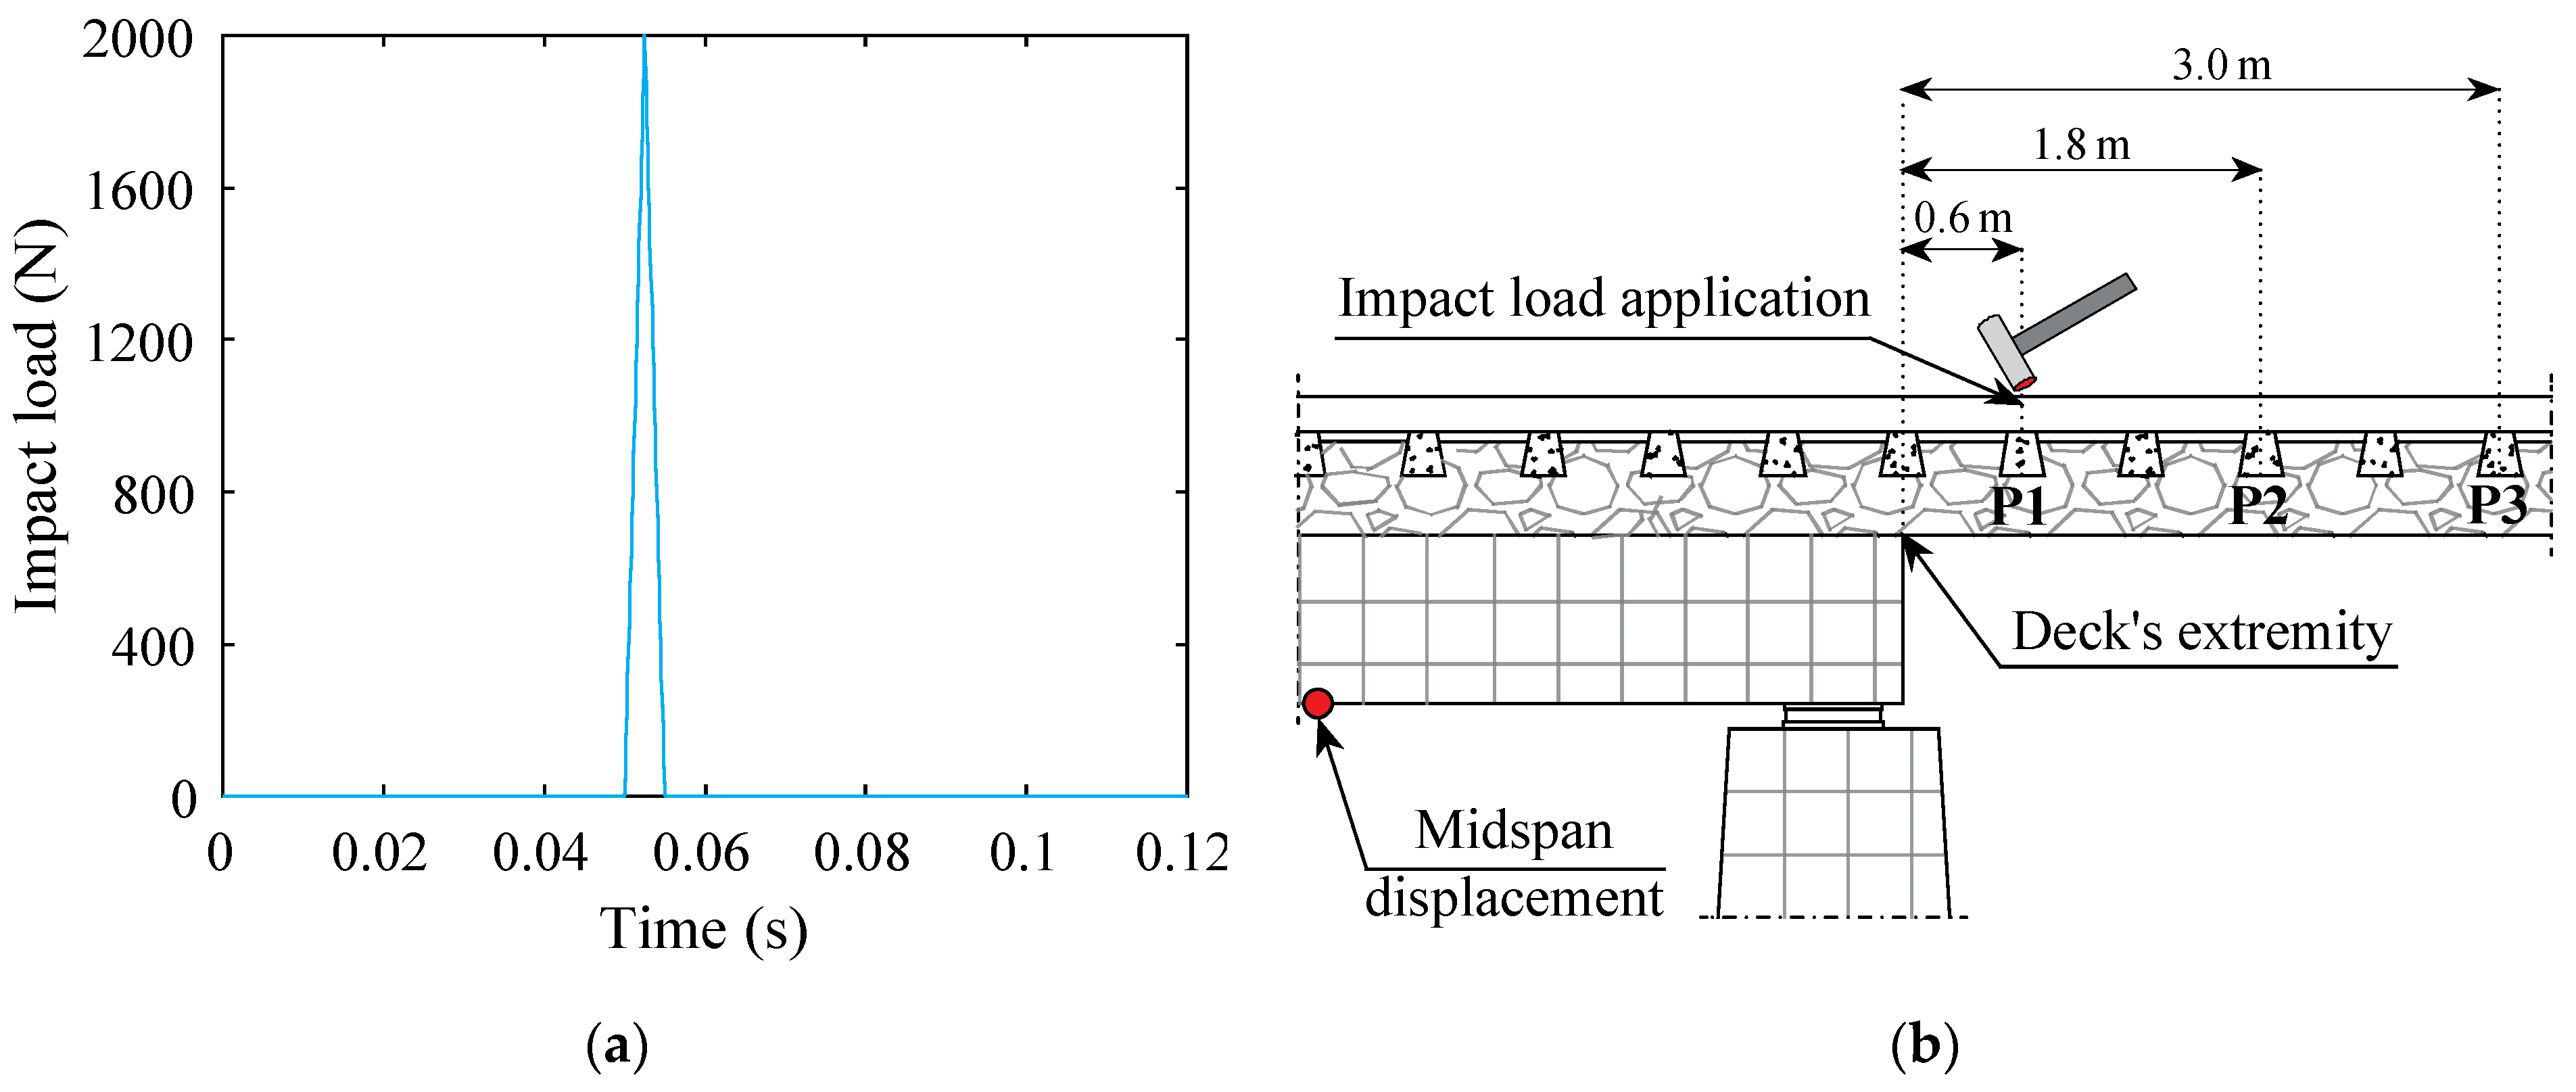
Although the results shown in the previous section clearly demonstrate that the bridge response is still affected by the train loads even when they leave it, the analyses were purely static. To obtain a more comprehensive conclusion which also includes the dynamic effects, receptance tests were numerically simulated to understand to which extent the dynamic response of the bridge can be affected by loads that already left it due to the continuity effects provided by the track. To achieve this, impact excitations have been applied on the rail at different distances from the deck’s extremity (see in Figure 4 the load application points P1 to P3 distanced 0.6 m, 1.8 m, and 3.0 m away from the deck’s extremity) and the receptance functions were obtained based on the displacements at the midspan. The excitation consisted of a typical hammer impact load of 2000 N, as shown in Figure 4.
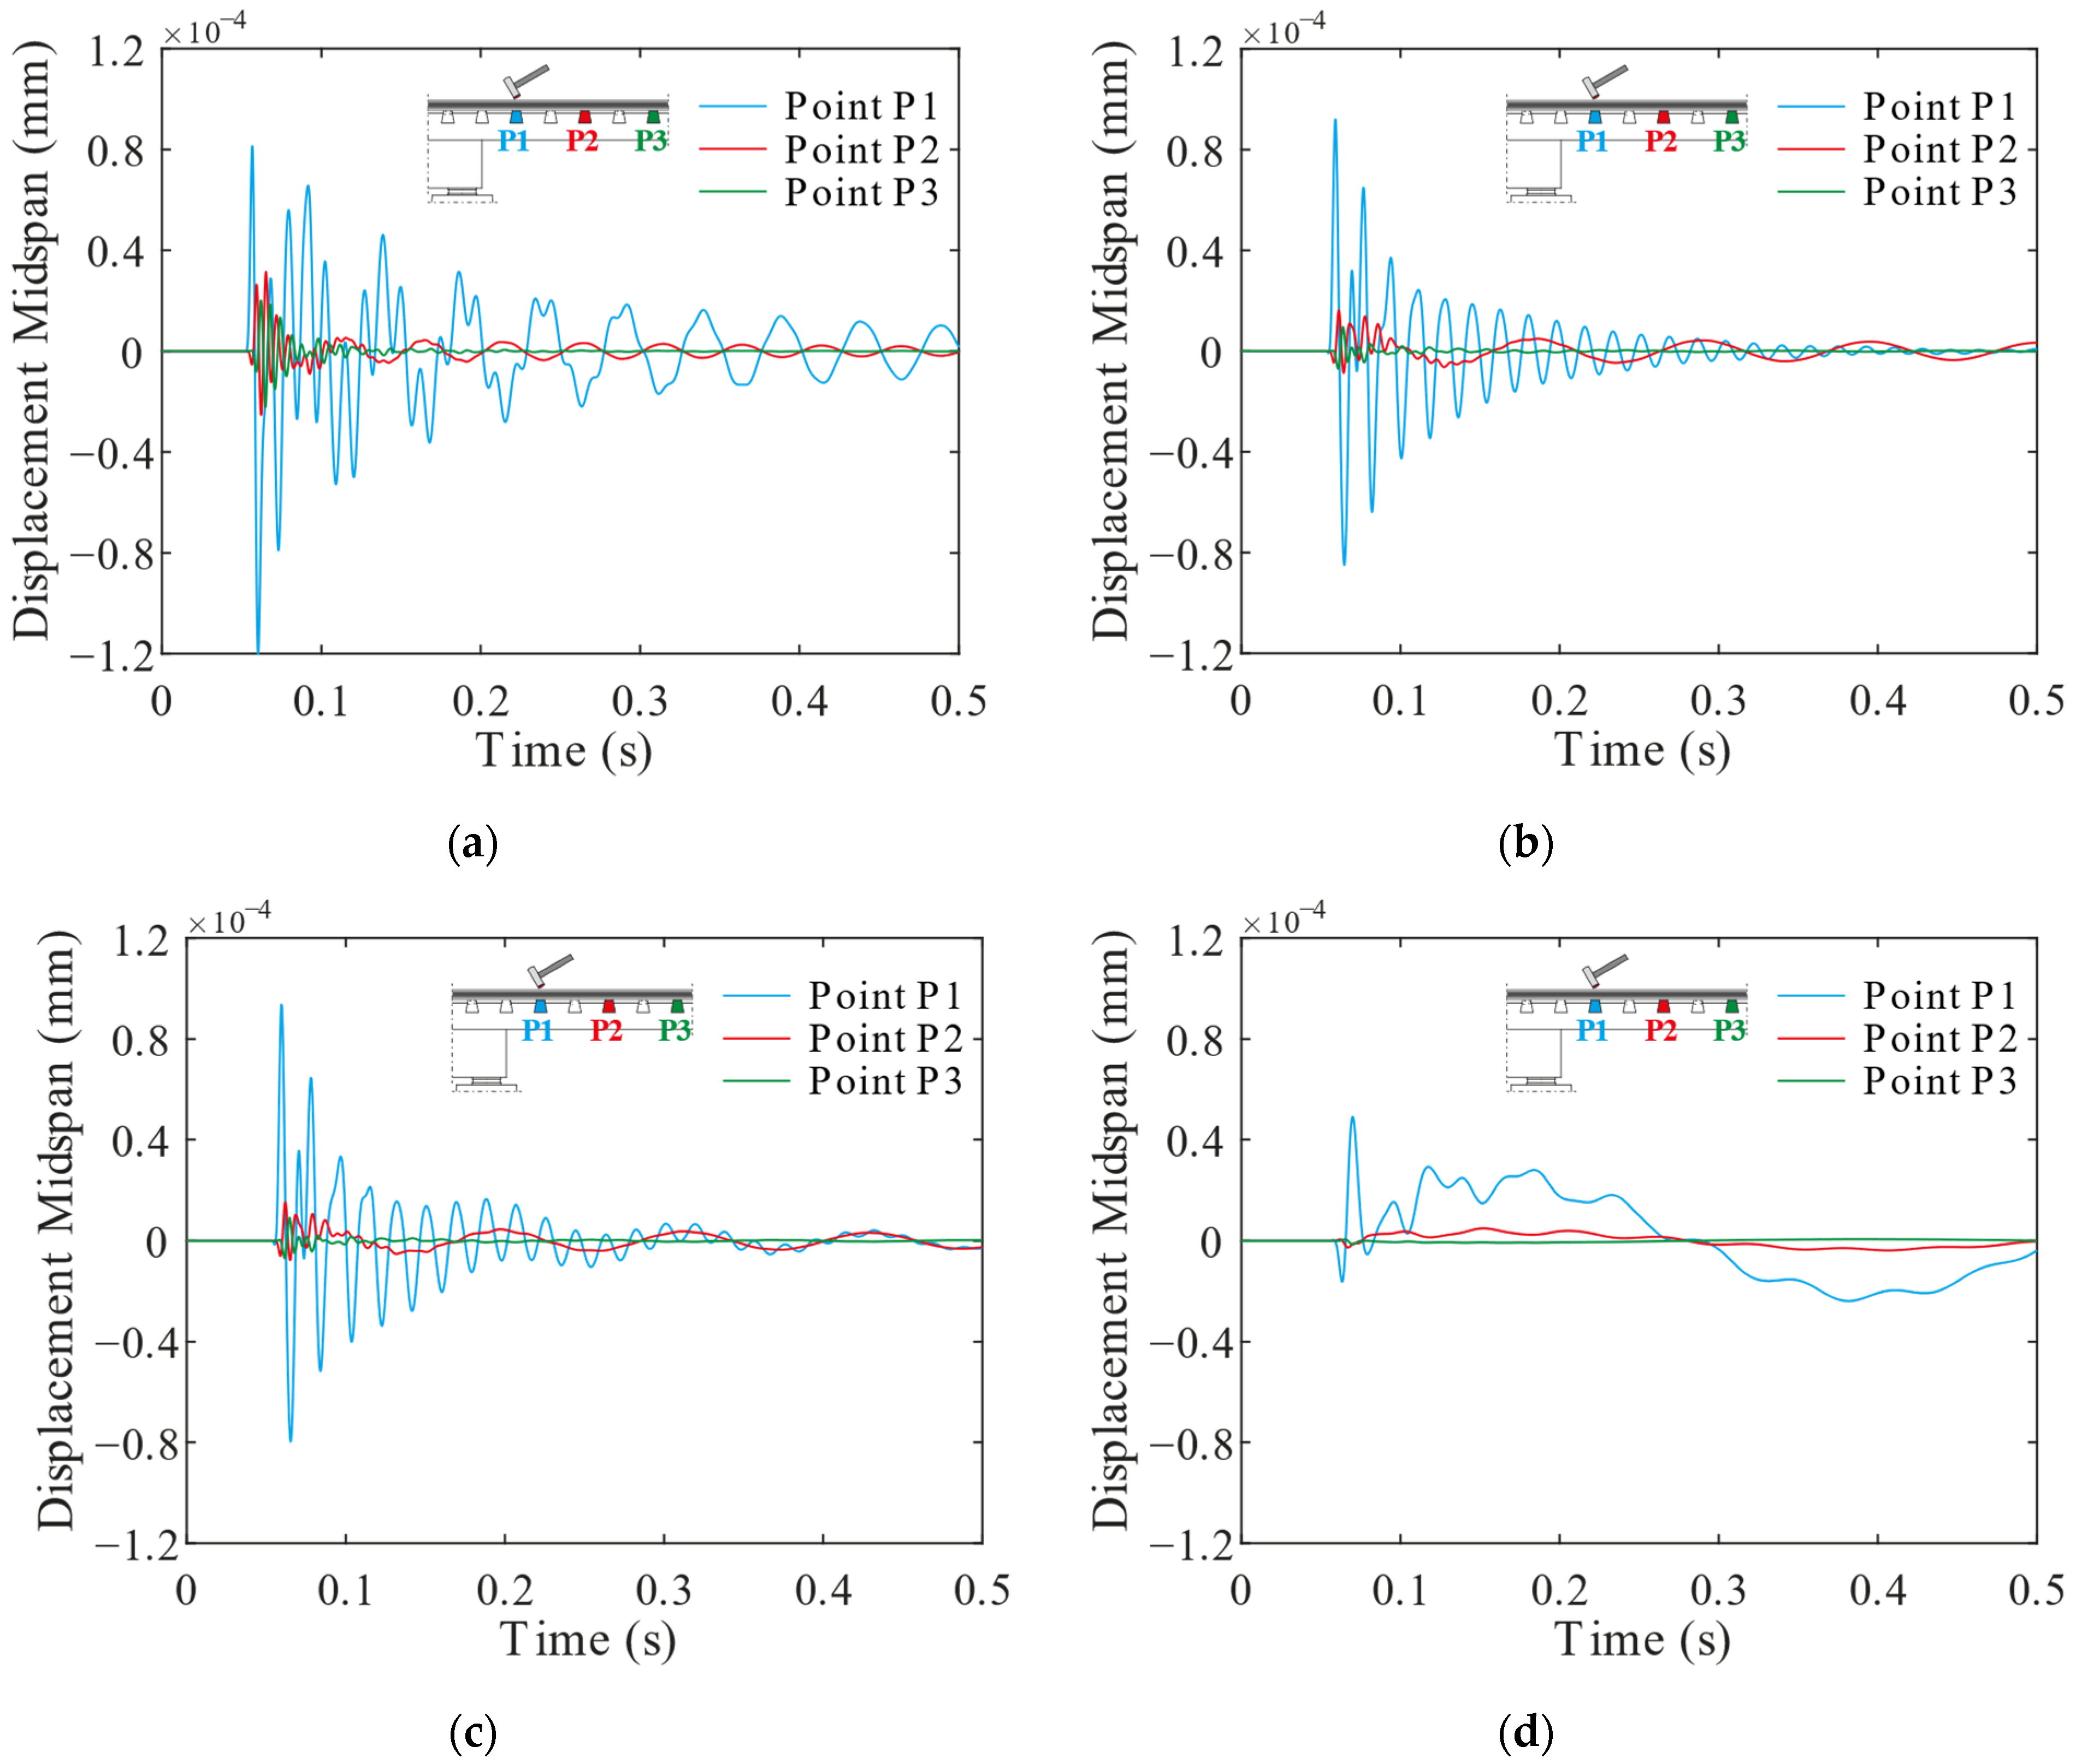
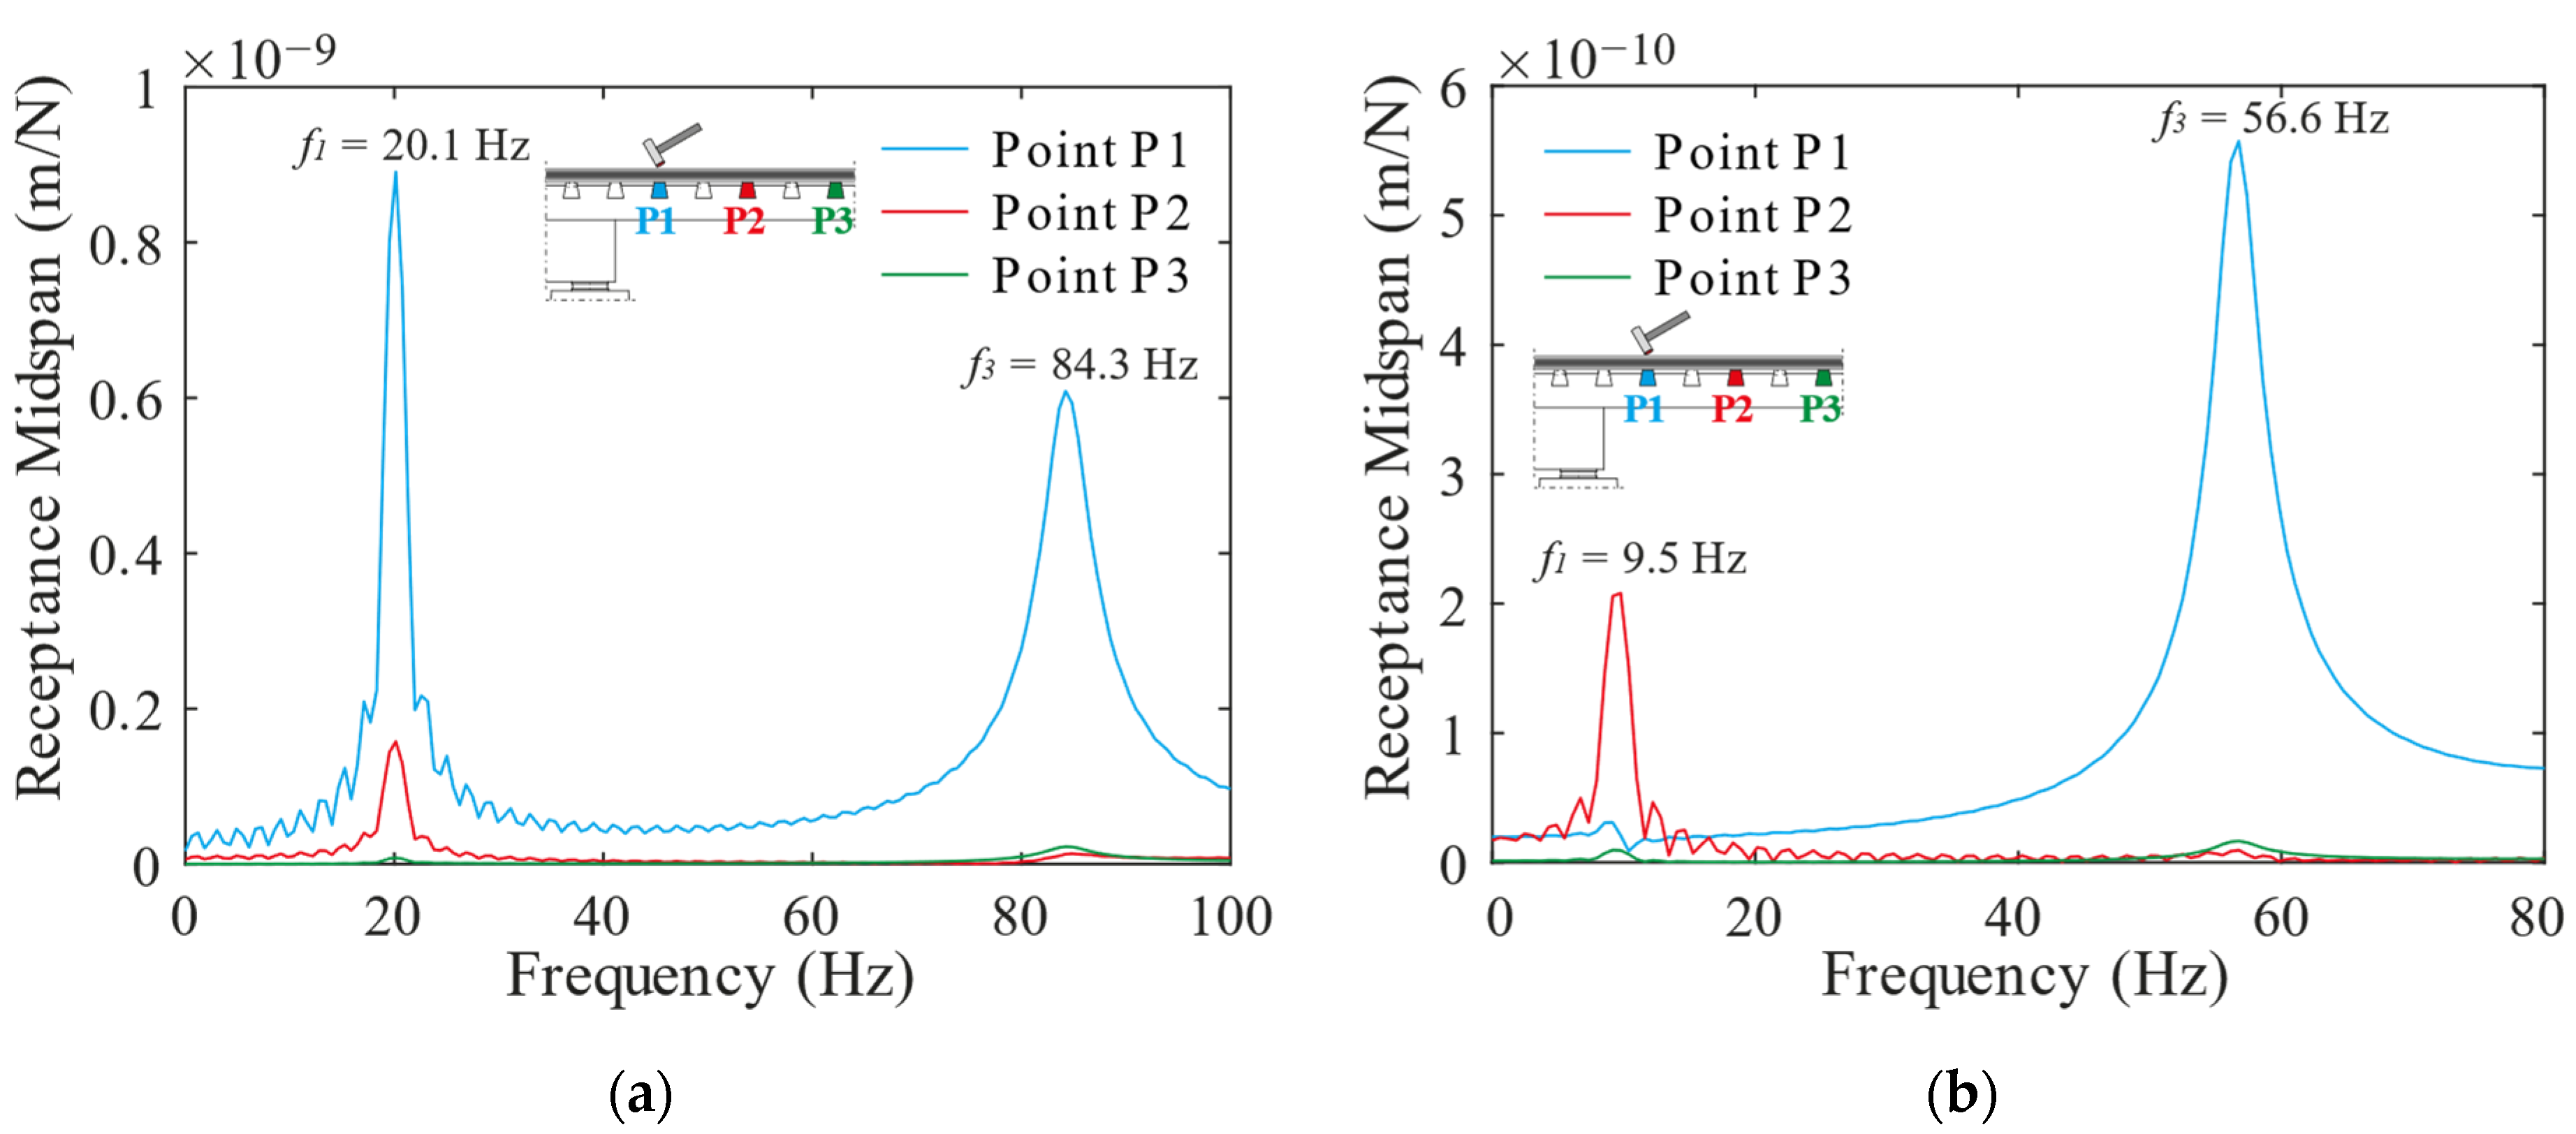
The receptance functions, which consist of the ratio between the displacements obtained at the midspan (see Figure 5) and the impact load, both in the frequency domain, for the different impact locations and for the four analyzed bridges are plotted in Figure 6. The figure also shows the identification of the main peaks, which are consistent with the frequency values shown in Table 2 for first and third global vertical vibration modes (the second mode is not visible because the midspan modal coordinate is null). As can be observed, for all the bridges, the receptance function is practically null when the impact is applied at the point P3 located 3.0 m away from the deck’s extremity, which is coherent with the results obtained through the influence line analysis. Thus, it can be admitted that the free vibration period does not starts immediately when the last train axle leaves the bridge, but only when it is already distanced approximately 3.0 m away from the bridge extremity. Such an assumption will be used in this work in the next sections for damping estimation purposes based on railway traffic forced vibration responses.

3.3. Validation of the Application of the Prony Method

As described in Section 2, the Prony method is a methodology that allows the decomposition of a signal in a set of exponential decaying sinusoids that are representative of each frequency of interest, to accurately estimate the damping coefficients. In this section, a numerical validation of this methodology will be performed through the simulation of a train passage over the Cascalheira Bridge using a train–track–bridge interaction methodology developed by Montenegro et al. [49]. The 3D FE model of this bridge and the Alfa Pendular model have been recently developed by the authors and presented in a previous publication [28]. The validation was carried out considering two different train speed scenarios and four different types of irregularities.

3.3.1. Cascalheira Bridge 3D Numerical Model

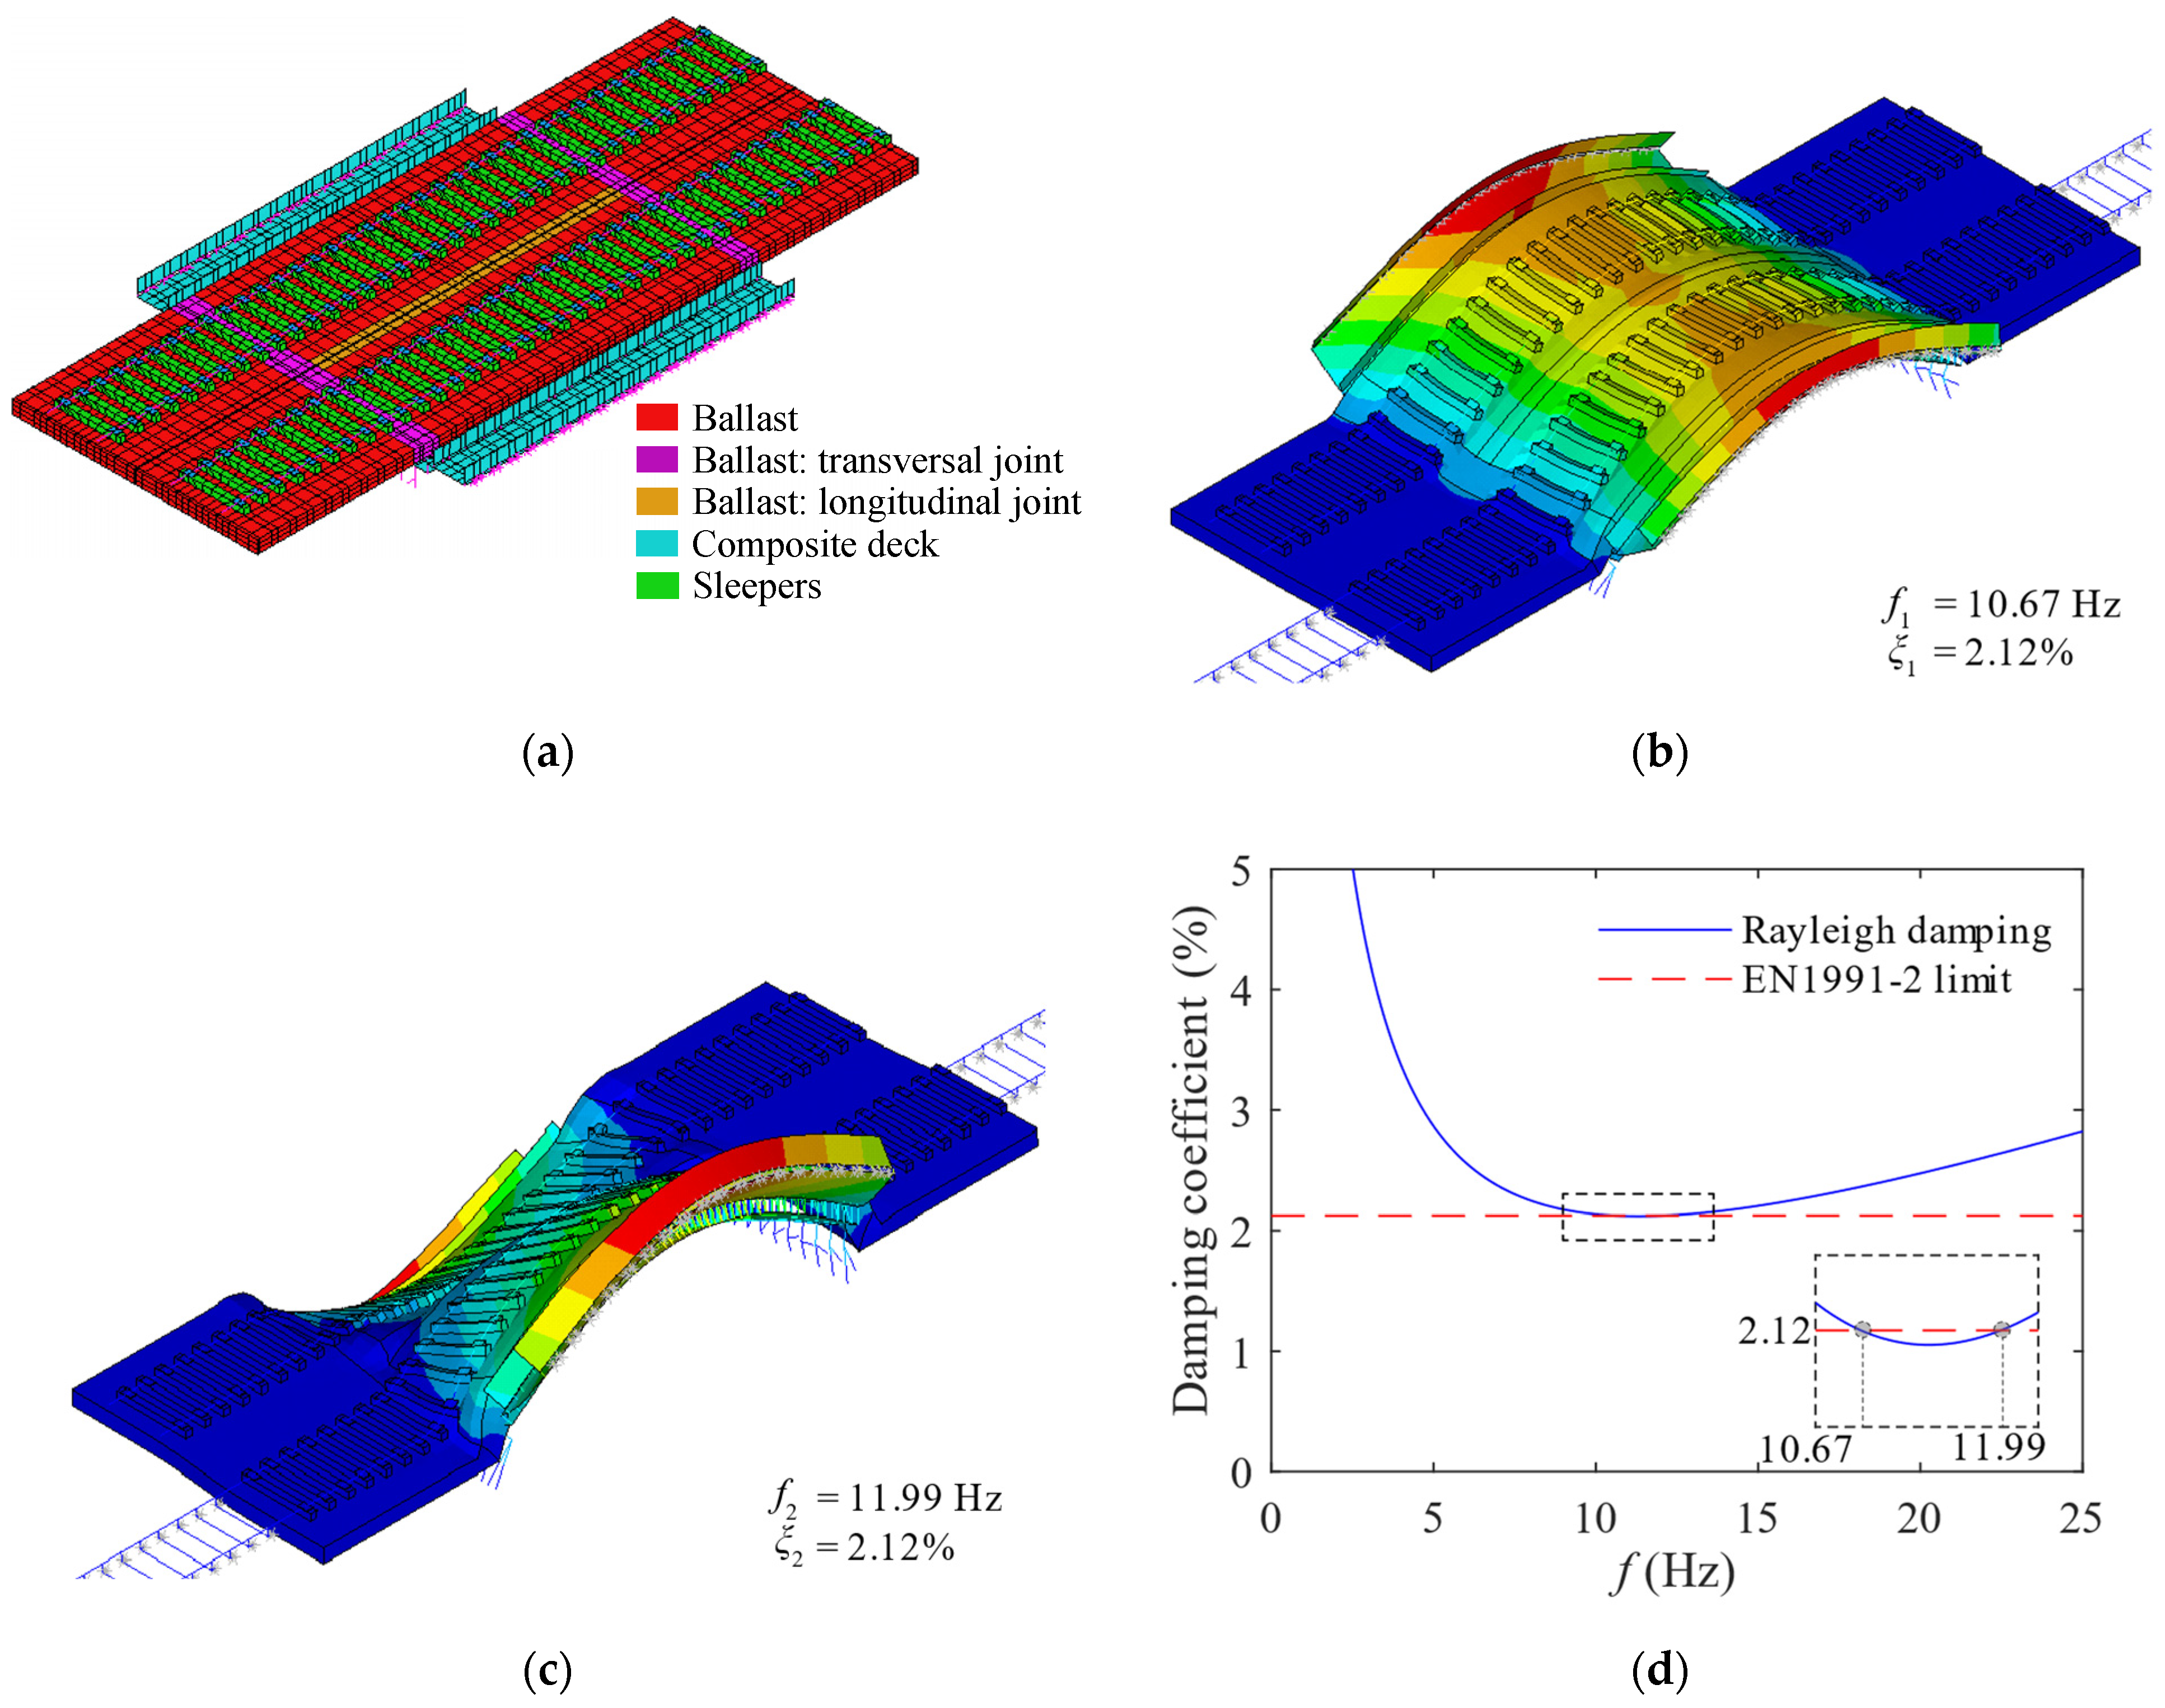
The Cascalheira bridge is located at km 100.269 of the Northern Line of the Portuguese Railways that connects Porto and Lisbon. It is a filler-beam bridge with a span of 11.10 m length, whose structural details may be found in Saramago et al. [28]. The numerical model of this bridge was developed in the finite element software ANSYS® [50]. The elements used for the development of the model were: shell elements (SHELL63) to represent the concrete slabs, cantilevers, and the retaining walls; beam elements (BEAM44) to represent the embedded steel girders and the rails; and solid elements (SOLID45) to model the ballast and the sleepers and rail pads. The non-structural elements were modelled with concentrated mass elements (MASS21) and the bearing supports were simulated through spring-dashpot elements (COMBIN14) to consider the vertical and longitudinal stiffness of the pot bearings. Rigid beam elements (MPC184) were used to connect the deck to the ballast, and for the connection between the slabs of the deck and the cantilevers and retaining walls. The model is shown in Figure 7a, while a detailed description of the 3D FE numerical model can be found in [28]. Figure 7b,c depict the modal configurations of the first two modes of vibration and its correspondent natural frequencies and damping coefficients imposed to the model according to the lower limit bound for this type of bridge stipulated in [2]. The damping coefficient was imposed for the two main global modes of the model according to the Rayleigh damping curve, as shown in Figure 7d.

3.3.2. Dynamic Analyses with Train-Track-Bridge Interaction Methodology

The numerical analyses were carried out though a train–track–bridge interaction methodology developed and validated in [49], in which the Alfa Pendular train crossed the Cascalheira bridge under different speed and track condition scenarios. Details from the Alfa Pendular model can be found in Saramago et al. [28]. The scenarios consisted of two speeds, 135 km/h and 165 km/h, and four different types of vertical irregularities measured by the inspection vehicle EM120 from the Portuguese infrastructure manager corresponding to measurements carried out between 2018 and 2020, as depicted in Figure 8 (location of the bridge highlighted by the grey area).

3.3.3. Application of the Prony Method

The results presented in this section refer to the scenarios described above and correspond to the responses obtained at the bridge deck midspan, at the track centre. A summary table for all the scenarios is presented later at the end of this section. The goal is to achieve modal parameters for the train passage similar to those imposed to the numerical model using the Prony method.
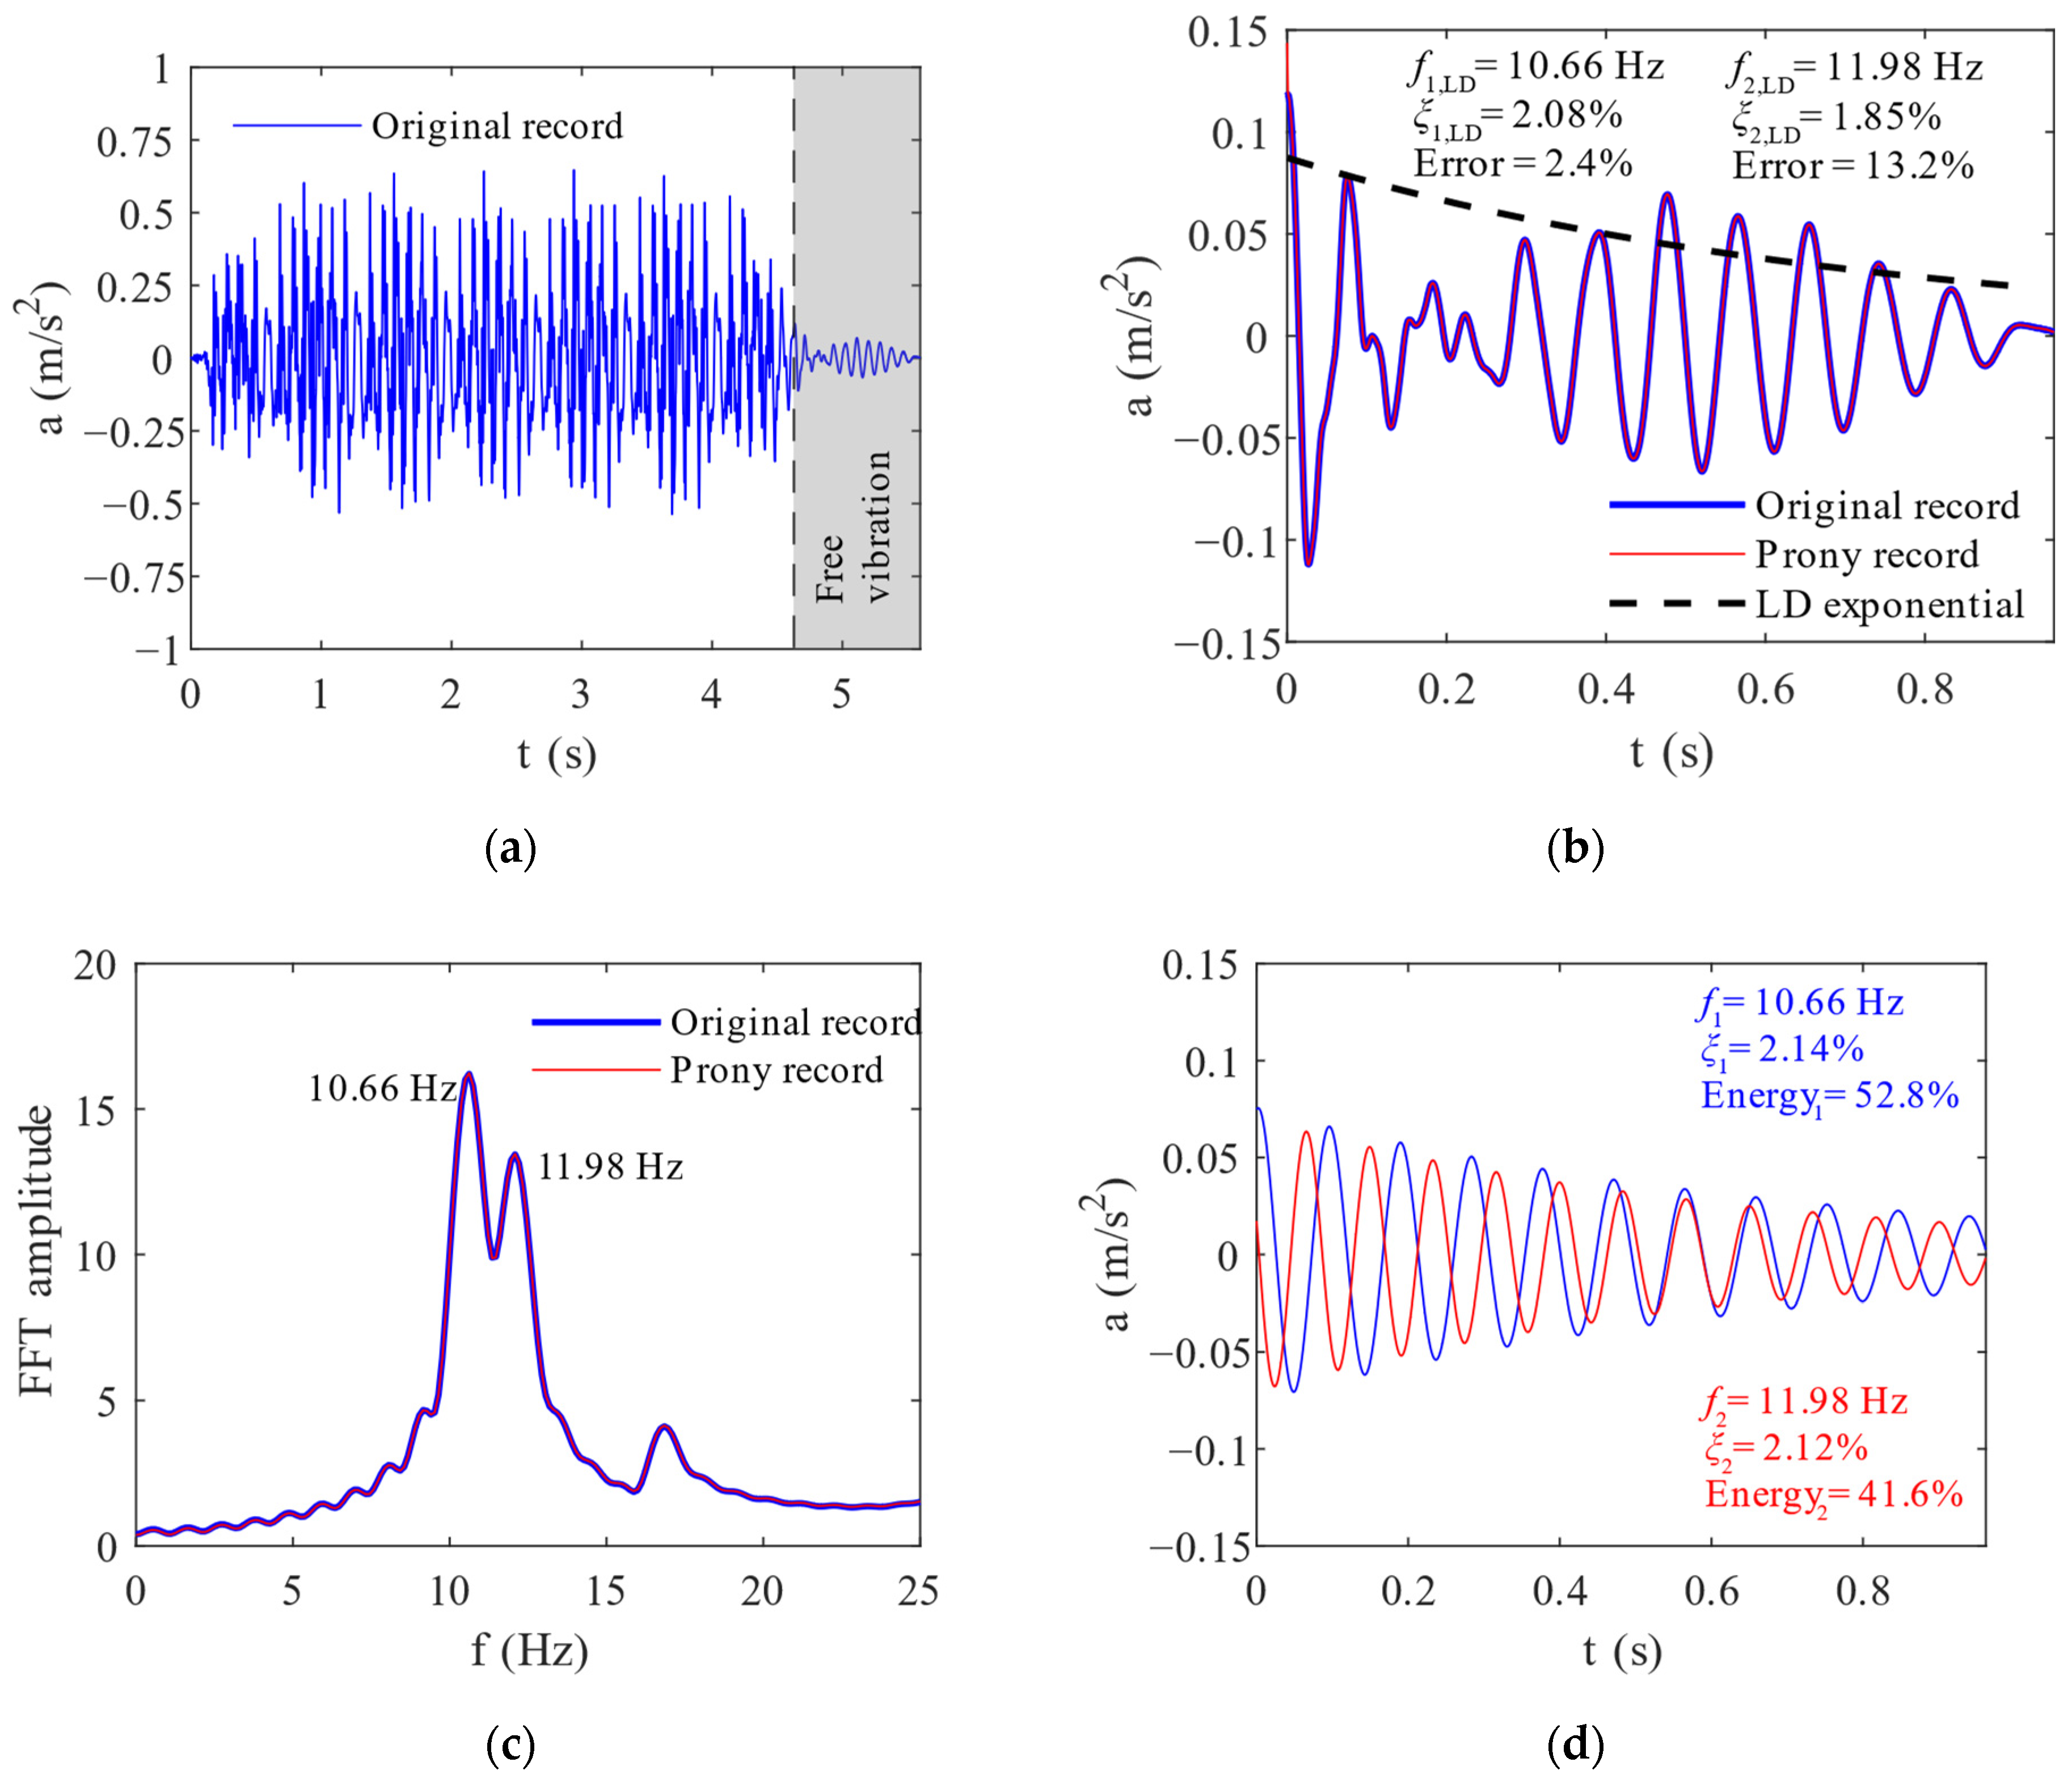
Figure 9a presents the record for the Alfa Pendular train at a speed of 135 km/h, and the irregularity of September 2019, in which the free vibration period for which the train loads start to lose influence in the bridge response, as described in Section 3.2, is highlighted in grey and isolated in Figure 9b, along a comparison with the LD method. The perfect overlapping between the original record and that obtained with the Prony method shows the accuracy of the method in representing the free vibration response. It can be seen in Figure 9b that the LD method is inefficient to fit an exponential decay to the original record. In this case, the estimates of the damping coefficient are not accurate in comparison to the Prony method, with errors of 2.4% in relation to the first fundamental frequency, and 13.2% in relation to the second fundament frequency. Moreover, it is interesting to observe a “breathing effect” induced by the presence of the two fundamental frequencies of the bridge, which can clearly be detected in the Fast Fourier Transform (FFT) spectrum depicted in Figure 9c. Finally, Figure 9d presents the decomposition of the Prony record obtained before, illustrated by the two main sinusoid records that compose the original Prony record. For these sinusoids, it can be seen that the frequencies that were obtained by the Prony method are identical to the main frequencies of the numerical model, as well as the damping coefficients that are very similar to those imposed in the model, ξ = 2.12% (see Figure 7d).
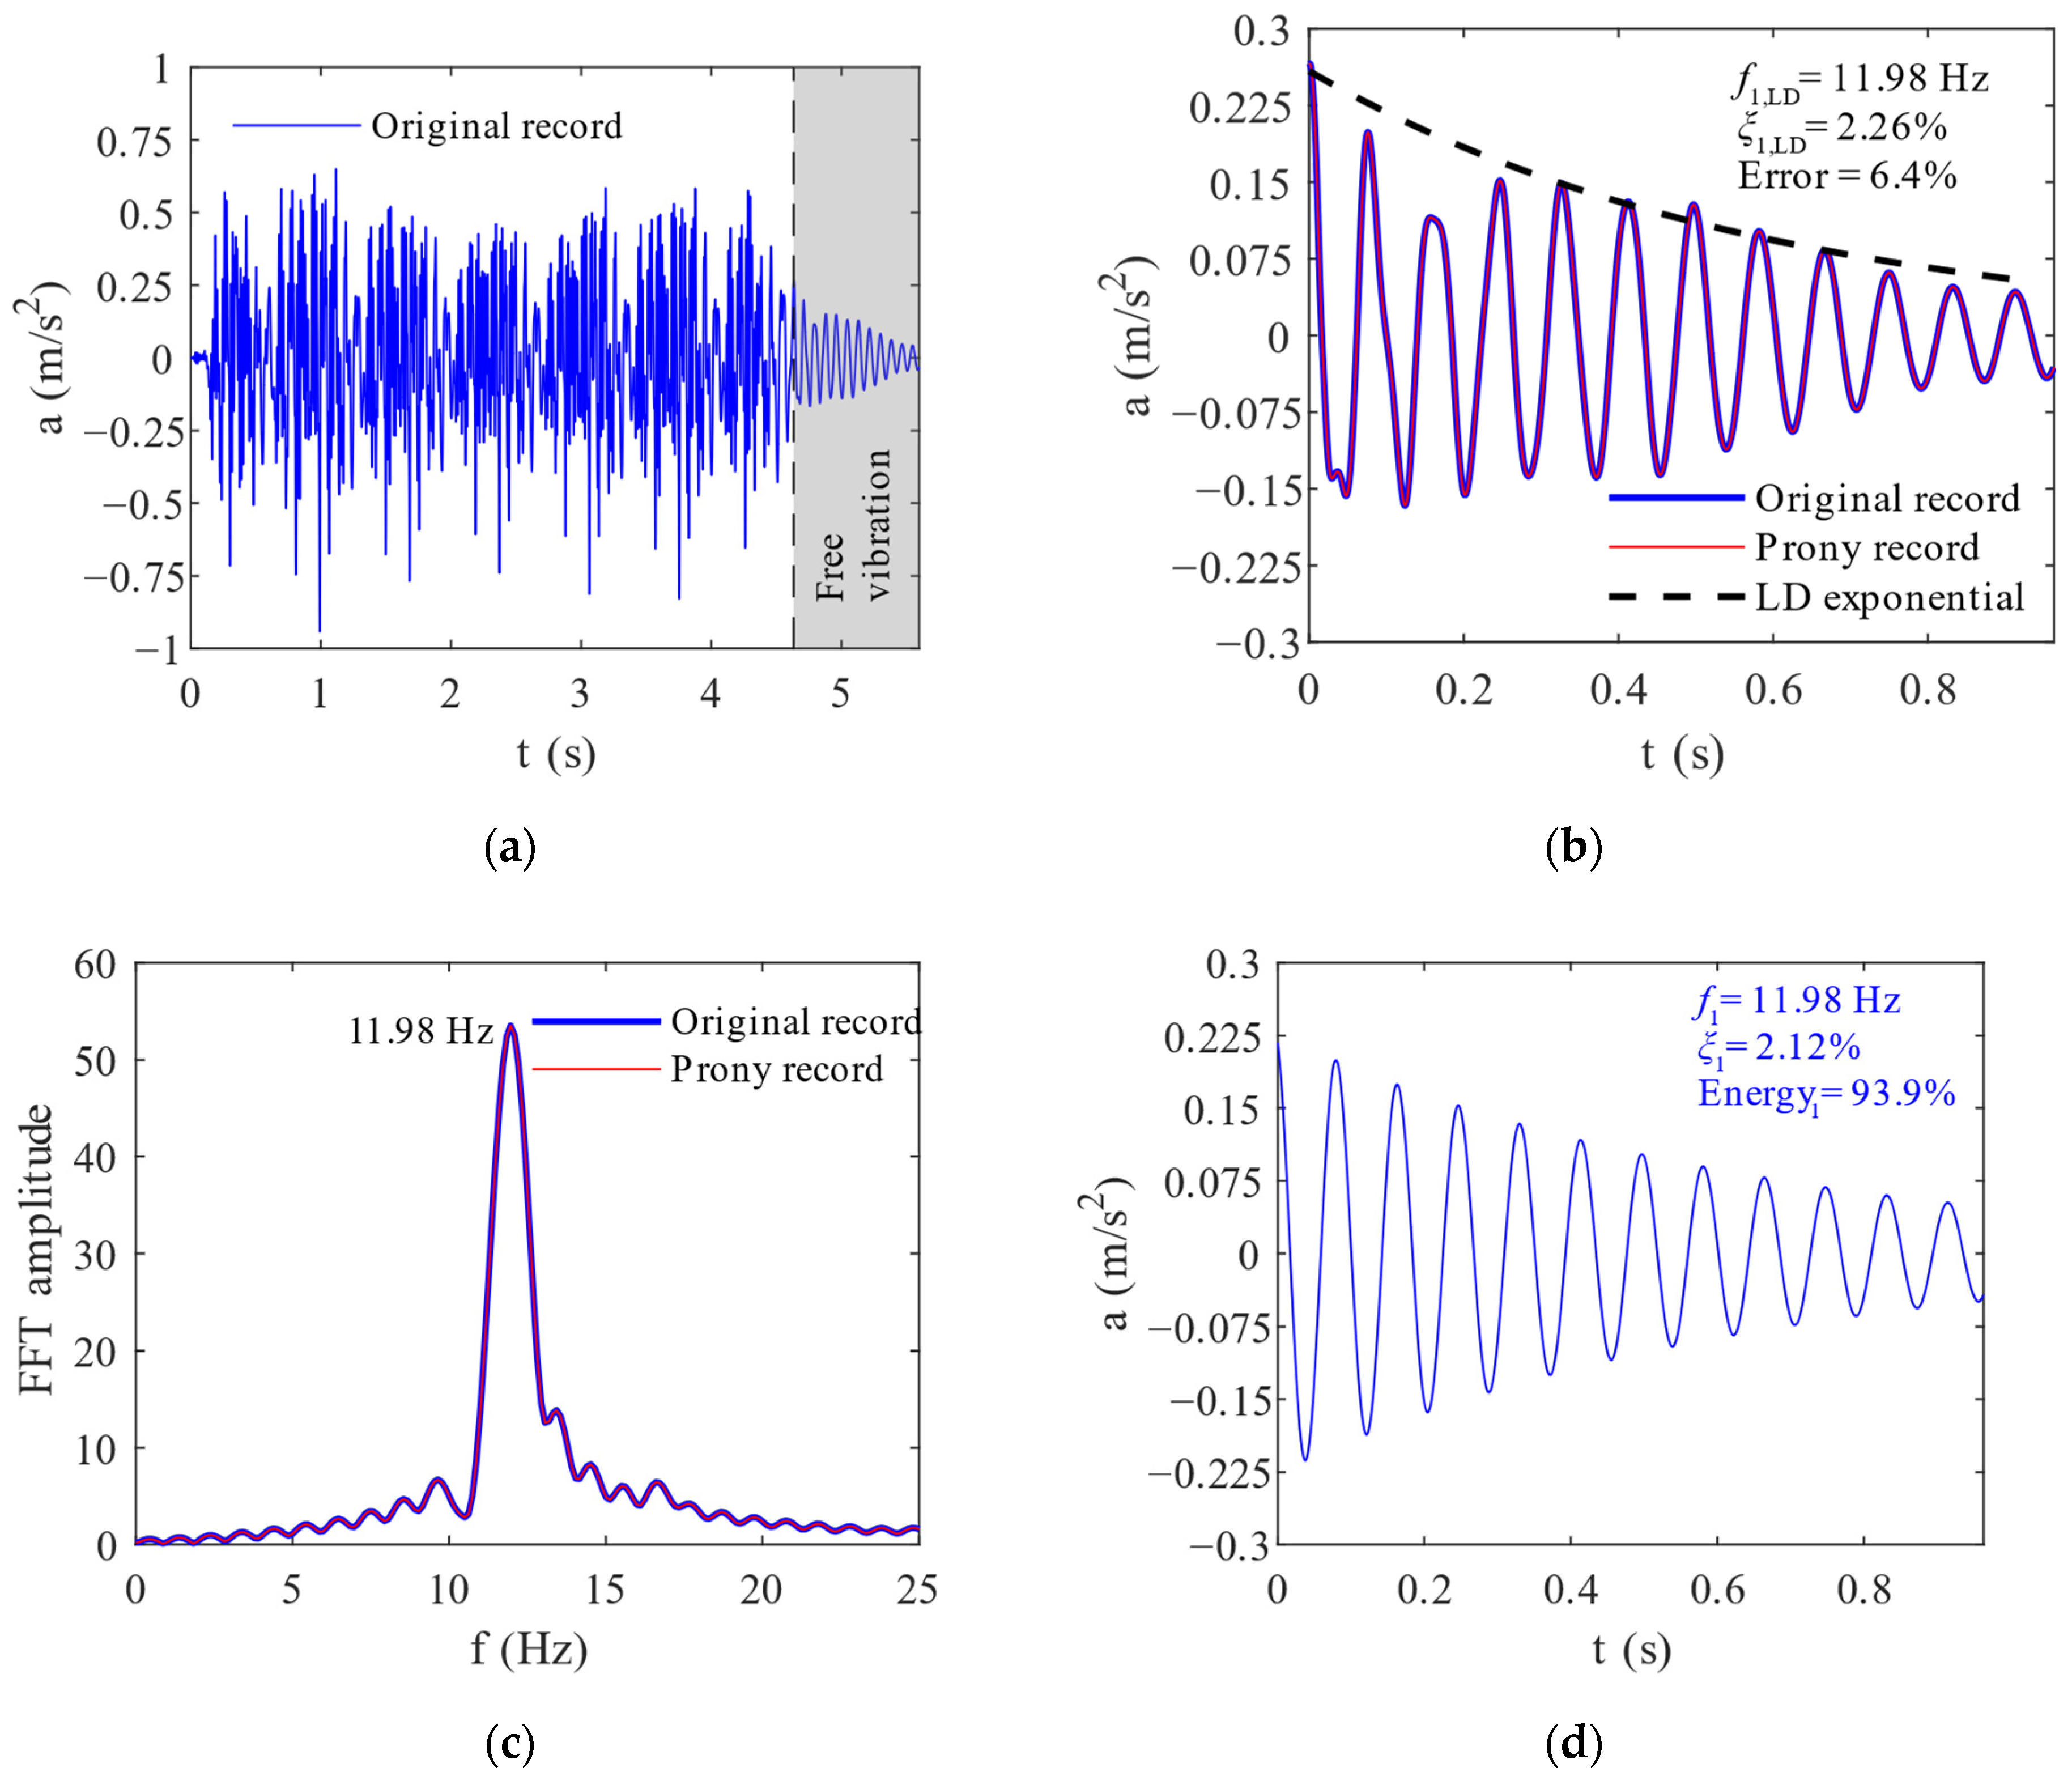
A second example is presented in Figure 10a for the same speed of 135 km/h, but this time for a more recent irregularity measured on October 2020. The free vibration period considered for the application of the Prony method is also highlighted. As well as the previous case, the Prony method performed with high accuracy, overlapping the original record, as can be seen in Figure 10b, along the comparison with the LD method. In this case, the free vibration record is controlled by only one main frequency, as illustrated in the FFT spectrum in Figure 10c, and the LD method has a better performance in comparison to the previous case; however, the damping coefficient estimates present damping coefficient values with an error of 6.4%, in comparison to the Prony method and to that imposed in the numerical model. Despite having only one main frequency that is controlling the record, the free vibration record does not present a clearly damped sinusoid because of minor interferences of other frequencies in the record, which are also represented in the FFT spectrum. The main frequency that composes the Prony record is illustrated in Figure 10d, and, once again, it can be seen that the method estimates the damping coefficient corresponding to the second fundamental frequency with great accuracy (see imposed damping of ξ = 2.12% in Figure 7d).
A summary table with all the results corresponding to all the scenarios used to validate the method is presented in Table 3. For all of them, and independently of the number of controlling modes in each scenario (one or two), the damping coefficients and main frequencies obtained with the Prony method are in a very good agreement with those imposed in the numerical model, which confirms the accuracy and validation of the method.

4. Experimental Assessment of Damping Coefficients

4.1. Background

The present work has been performed within the scope of the European Projects In2Track2 [38] and recently extended in In2Track3 [39], funded by the Shift2Rail Joint Undertaking [51], and whose objective consisted of estimating damping coefficients in different types of bridges based on vibrations under railway traffic. Currently, EN1991-2 [2] stipulates lower bound values for damping but may be very conservative in some cases, as reported by the ERRI D214 committee [1]. Therefore, it is of the most importance to give steps forward to a revision in the damping definitions, both for designing less expensive railway bridges and to avoid unnecessary retrofitting measures in existing railway bridges to support new traffic at higher speeds. The present section aims to present part of the findings obtained within these two projects, in particular, those related with the filler-beam type bridges tested in Portugal. It starts with a structural description of the tested bridges, followed by a description of the ambient vibration tests, from which the main modal properties of the bridges were identified, and by the presentation of the tests under railway traffic, which were used to estimate the damping through the method described in Section 2 and validated in Section 3.

4.2. Bridge Description

The field tests in Portugal were performed on 4 bridges along the Northern Line of the Portuguese Railways Network, which establishes the rail connection between Porto and Lisbon. The selected set of structures, located in the Aveiro and Santarém districts, represents 4 filler-beam bridges (simply supported concrete slabs, cast on embedded steel profiles). The location of the bridges along the line is presented in Figure 11, where the numbers refer to Table 4.
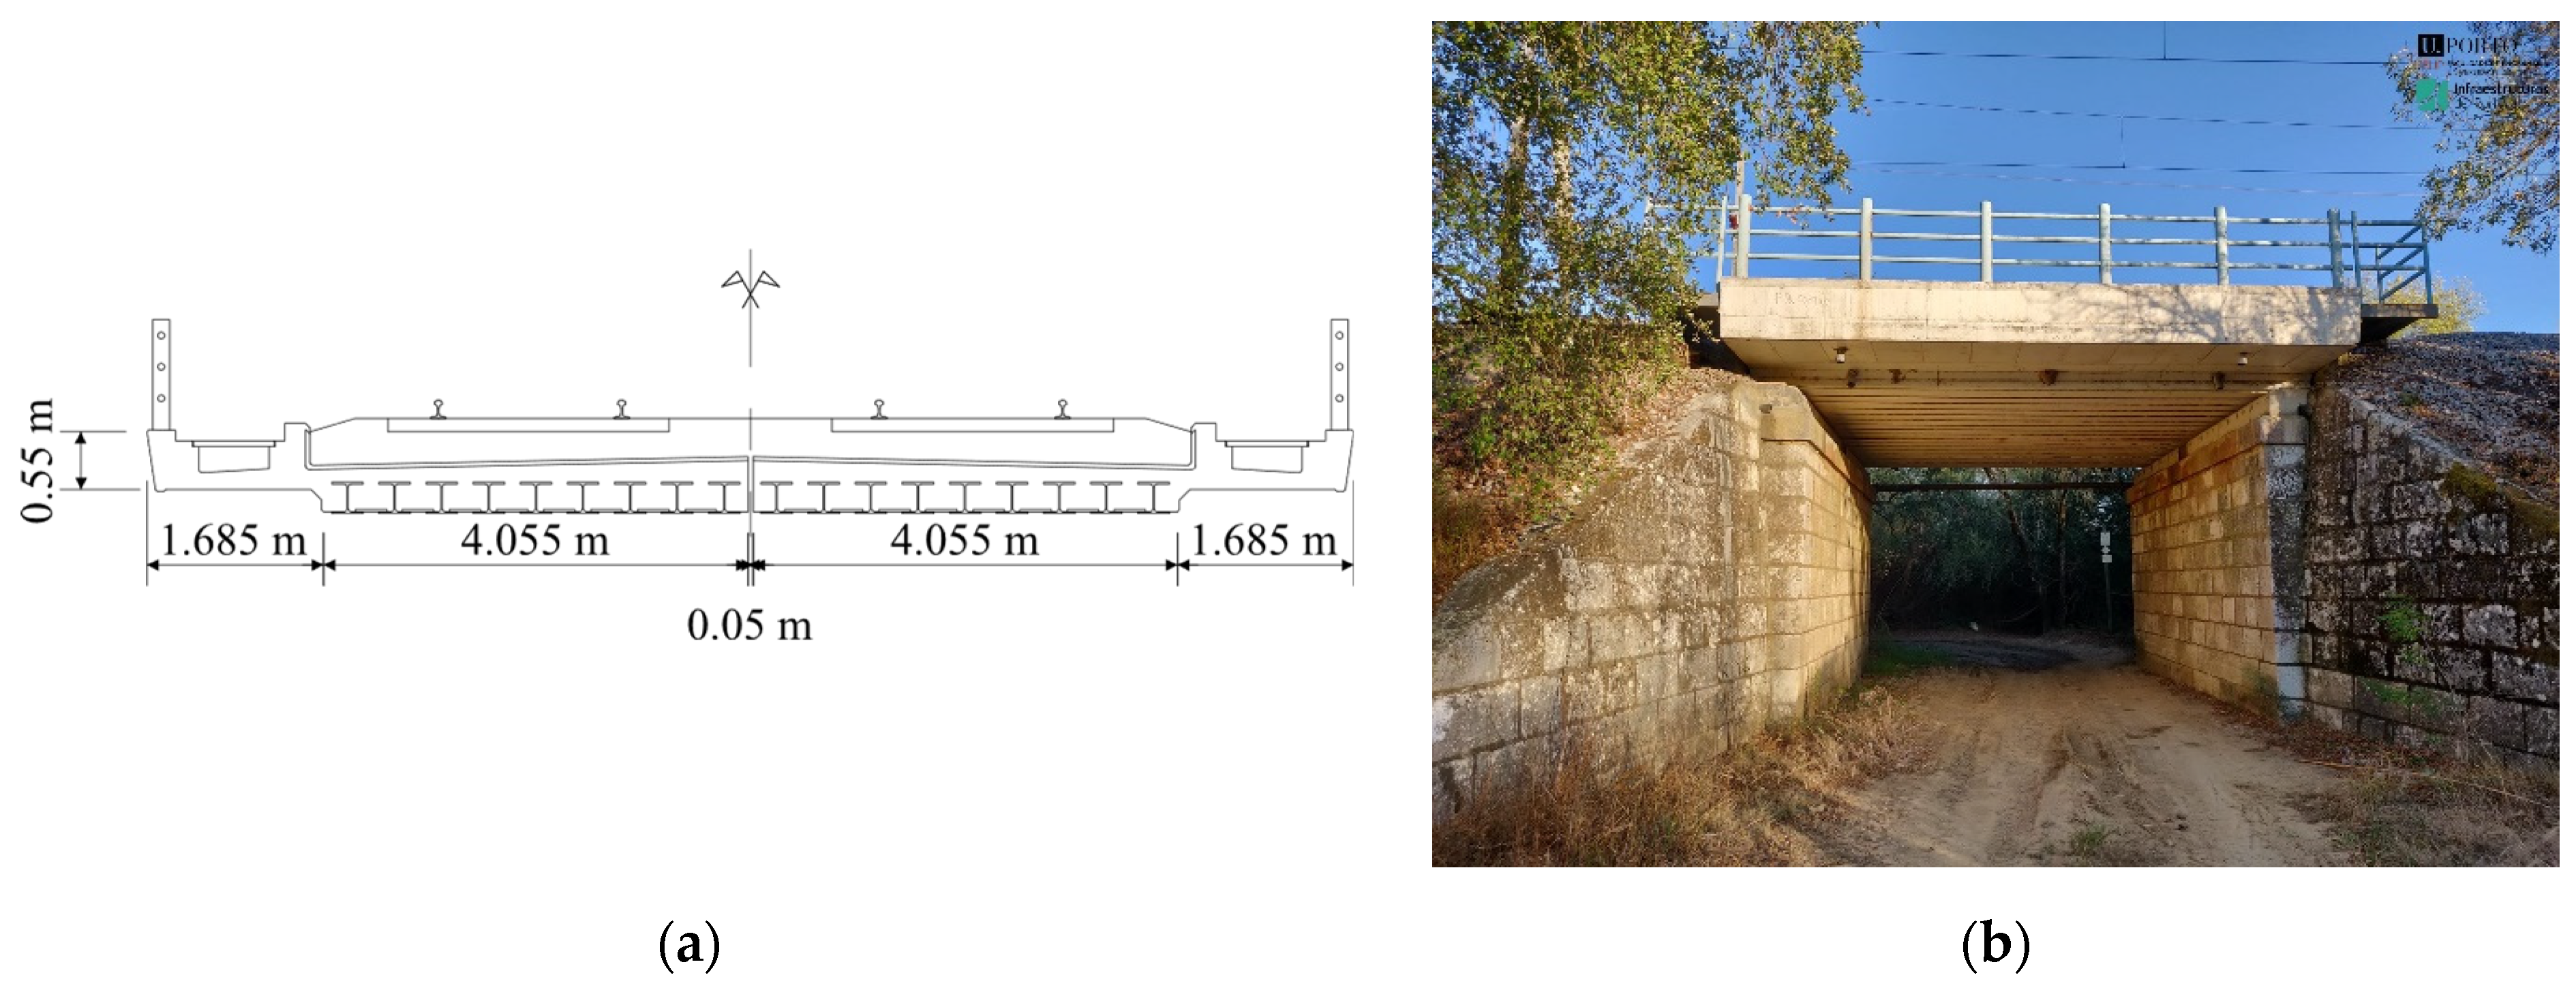
The four tested filler-beam bridges present similar construction solutions. Each of them is comprised of a single simply supported deck (except for the Canelas bridge, whose six decks are nevertheless independent), consisting of two half concrete slab decks, each one with nine embedded rolled steel profiles (HEB500, except for the HEB300 profiles in the Vale da Negra underpass). The bridges have two ballasted tracks, each one supported by a single half deck due to the existence of longitudinal expansion joints. Despite the independent decks, the ballast layer is continuous over both half decks. These filler-beam bridges have spans L ranging between 7.02 m and 12.00 m, as presented in Table 4, alongside other characteristics of the bridges. Schematic representations of the cross sections, as well as pictures of the bridges, can be seen in Figure 12.

4.3. Results of the Experimental Campaigns

The bridges described in Section 4.2 were subjected to two types of experimental tests: ambient vibration tests and tests under railway traffic. The ambient vibration tests were performed to evaluate the modal parameters of each bridge, such as the modal shapes, natural frequencies and damping coefficients, while the tests under railway traffic were used to identify the dynamic response in terms of accelerations of each bridge deck due to the passage of trains. The outcomes of these tests are required to estimate the frequency of each bridge due to the trains passage and to obtain the bridge damping using the Prony method described in Section 2.

4.3.1. Ambient Vibration Tests

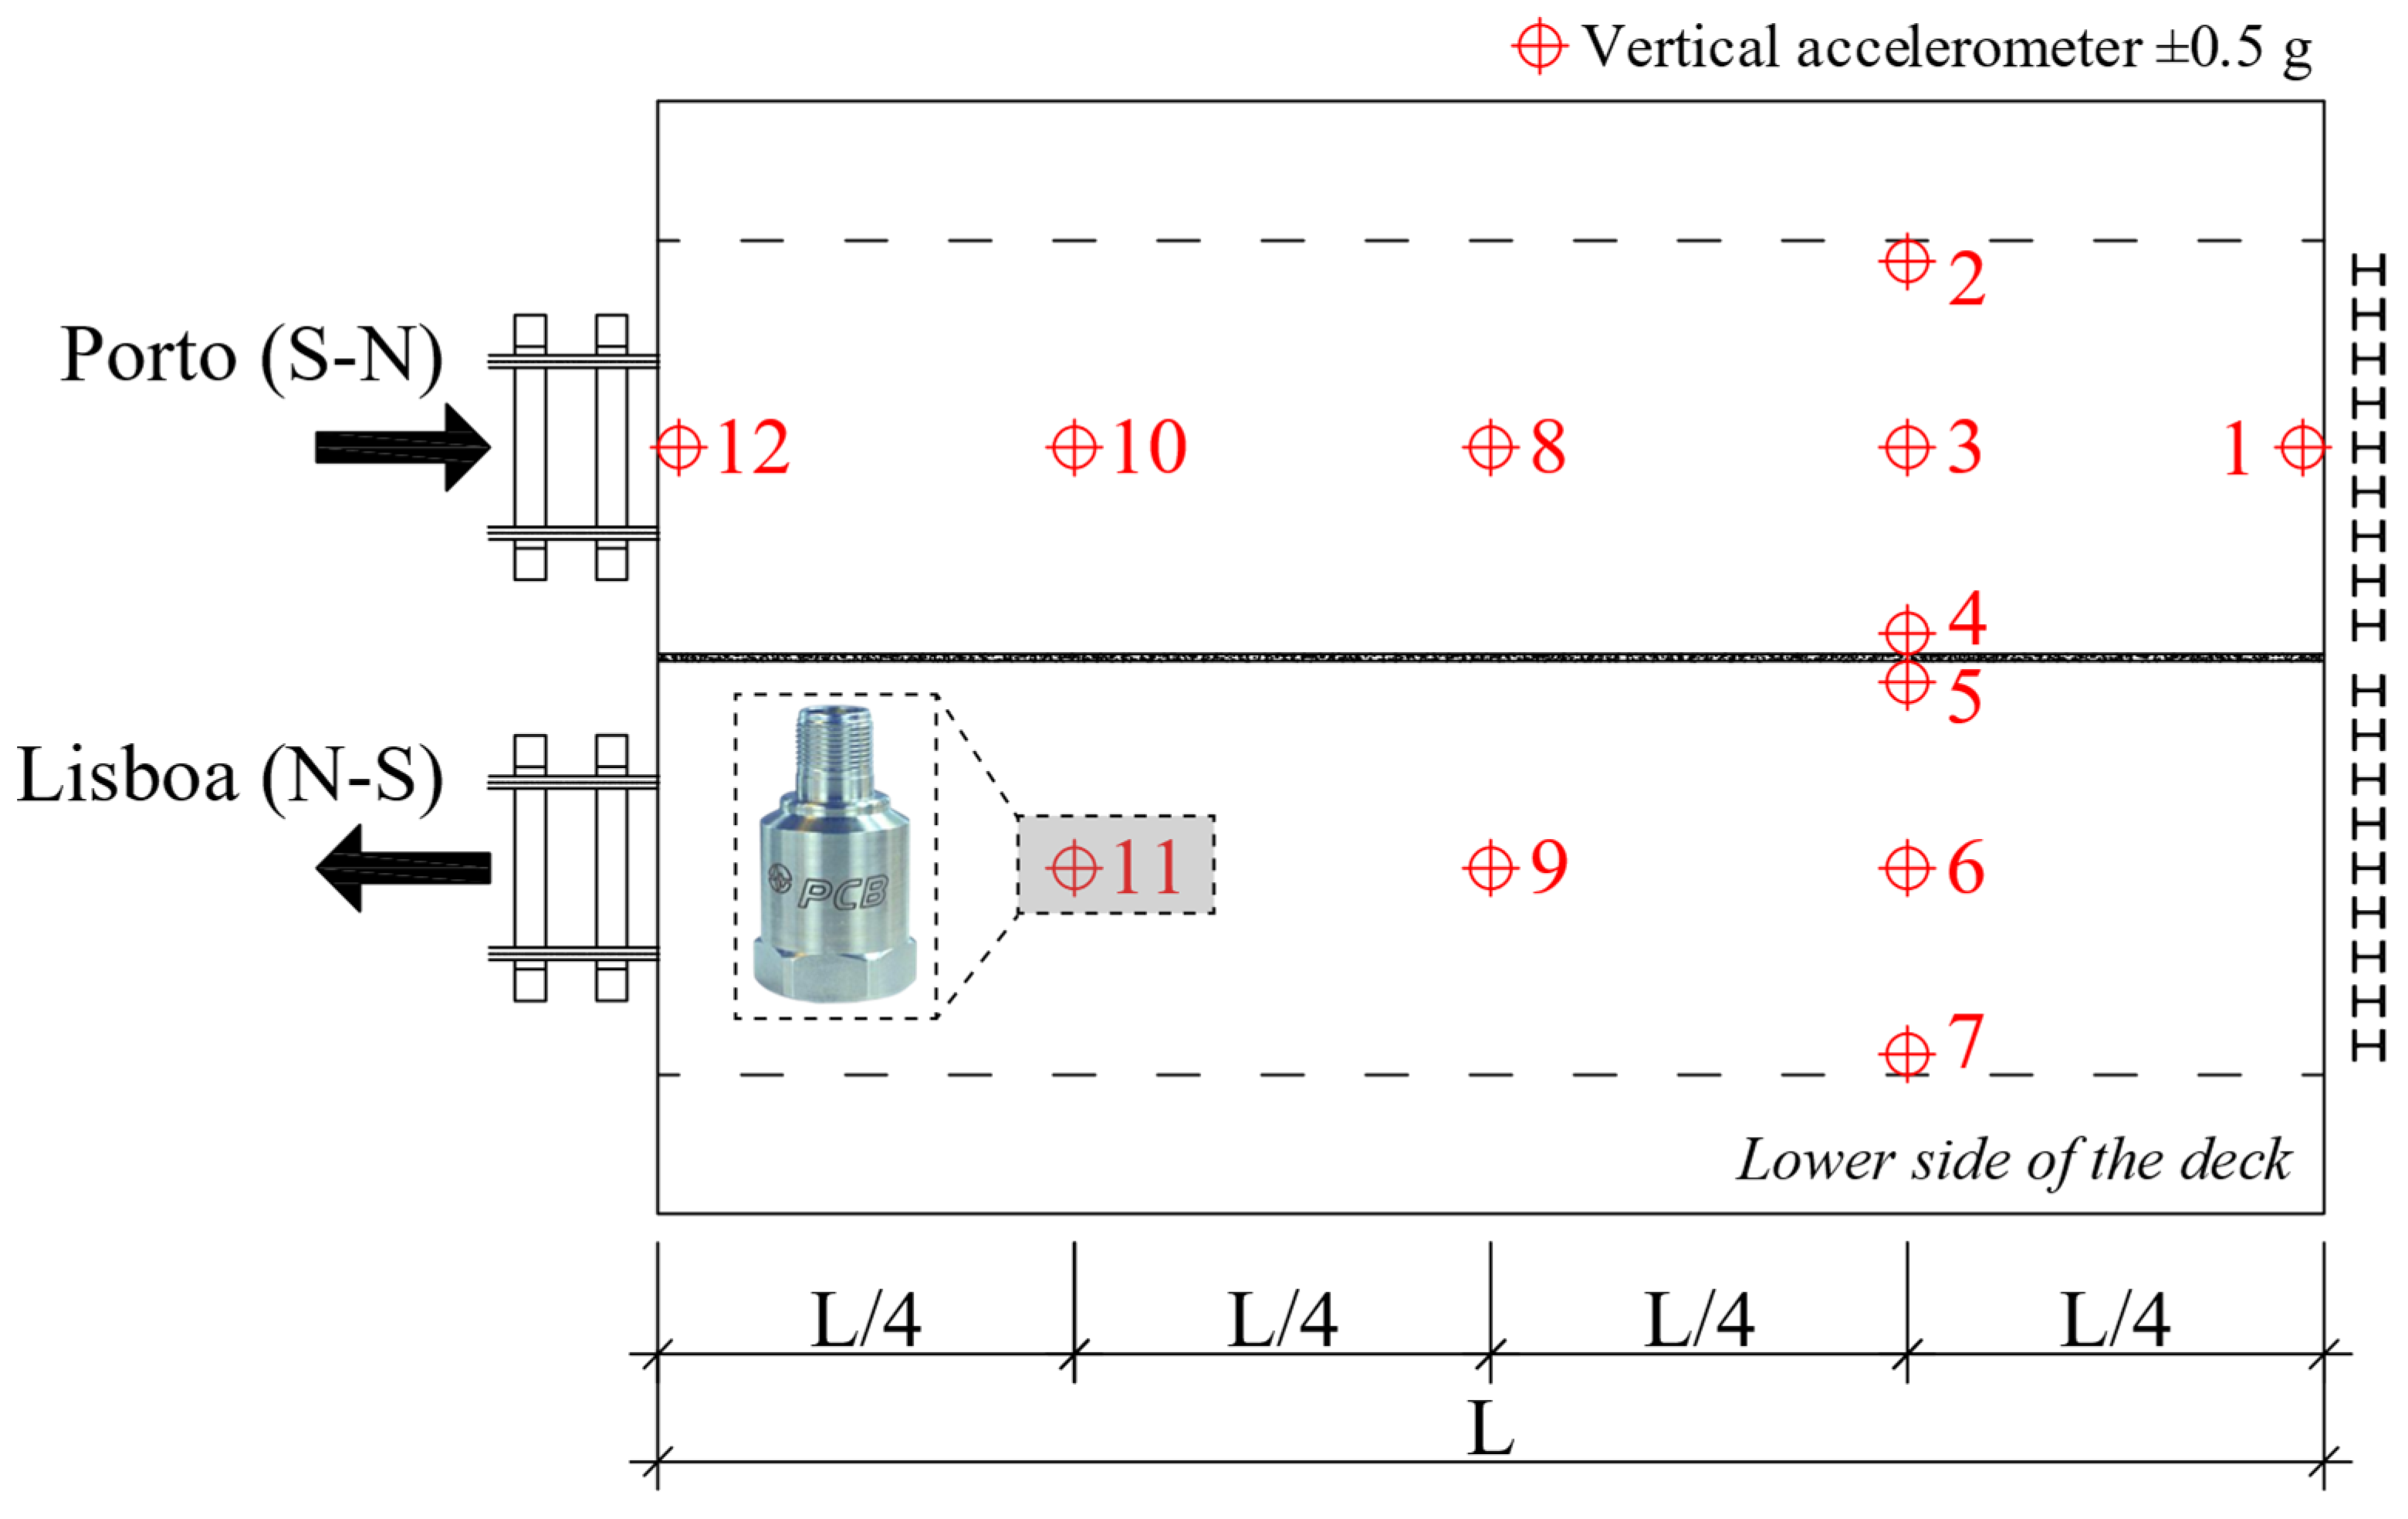
The ambient vibration tests were performed in the four filler-beam bridges of the Northern Line of the Portuguese Railways Network, described in Section 4.2. For all bridges, these tests were performed using a typical and normalized layout for the sensors used in the ambient vibration tests, making it easier to compare the results between the bridges. Due to the bridge length and the fact that it is a six-span bridge, the Canelas bridge adopted a slightly different layout for this kind of test. These tests have the objective of evaluating the vibration modes of the bridges and achieving its modal parameters, namely, frequencies and damping. The typical experimental layout consists of 12 points of measurement, as shown in Figure 13, to guarantee a clear representation of the vibration modes.
The equipment used for these tests consisted of piezoelectric accelerometers to measure very low levels of vibration (in some cases, less than 1 mg), PCB model 393B12 (Figure 13), with a sensitivity of 10 V/g and a measurement range of ±0.5 g. The sensors were installed on the bridge deck’s lower side to evaluate the responses in the vertical direction. In some situations, additional excitation at the lower side of the deck, provided by a non-instrumental hammer, was useful to increase the amplitude of movement of the deck. The accelerometers were distributed along the span in the centre of each track, and considering four more additional accelerometers, two in each external extremity of each deck, and other two in the internal extremity of each half-deck, between the longitudinal expansion joint. All the accelerometers were placed along the embedded steel beams from the deck.
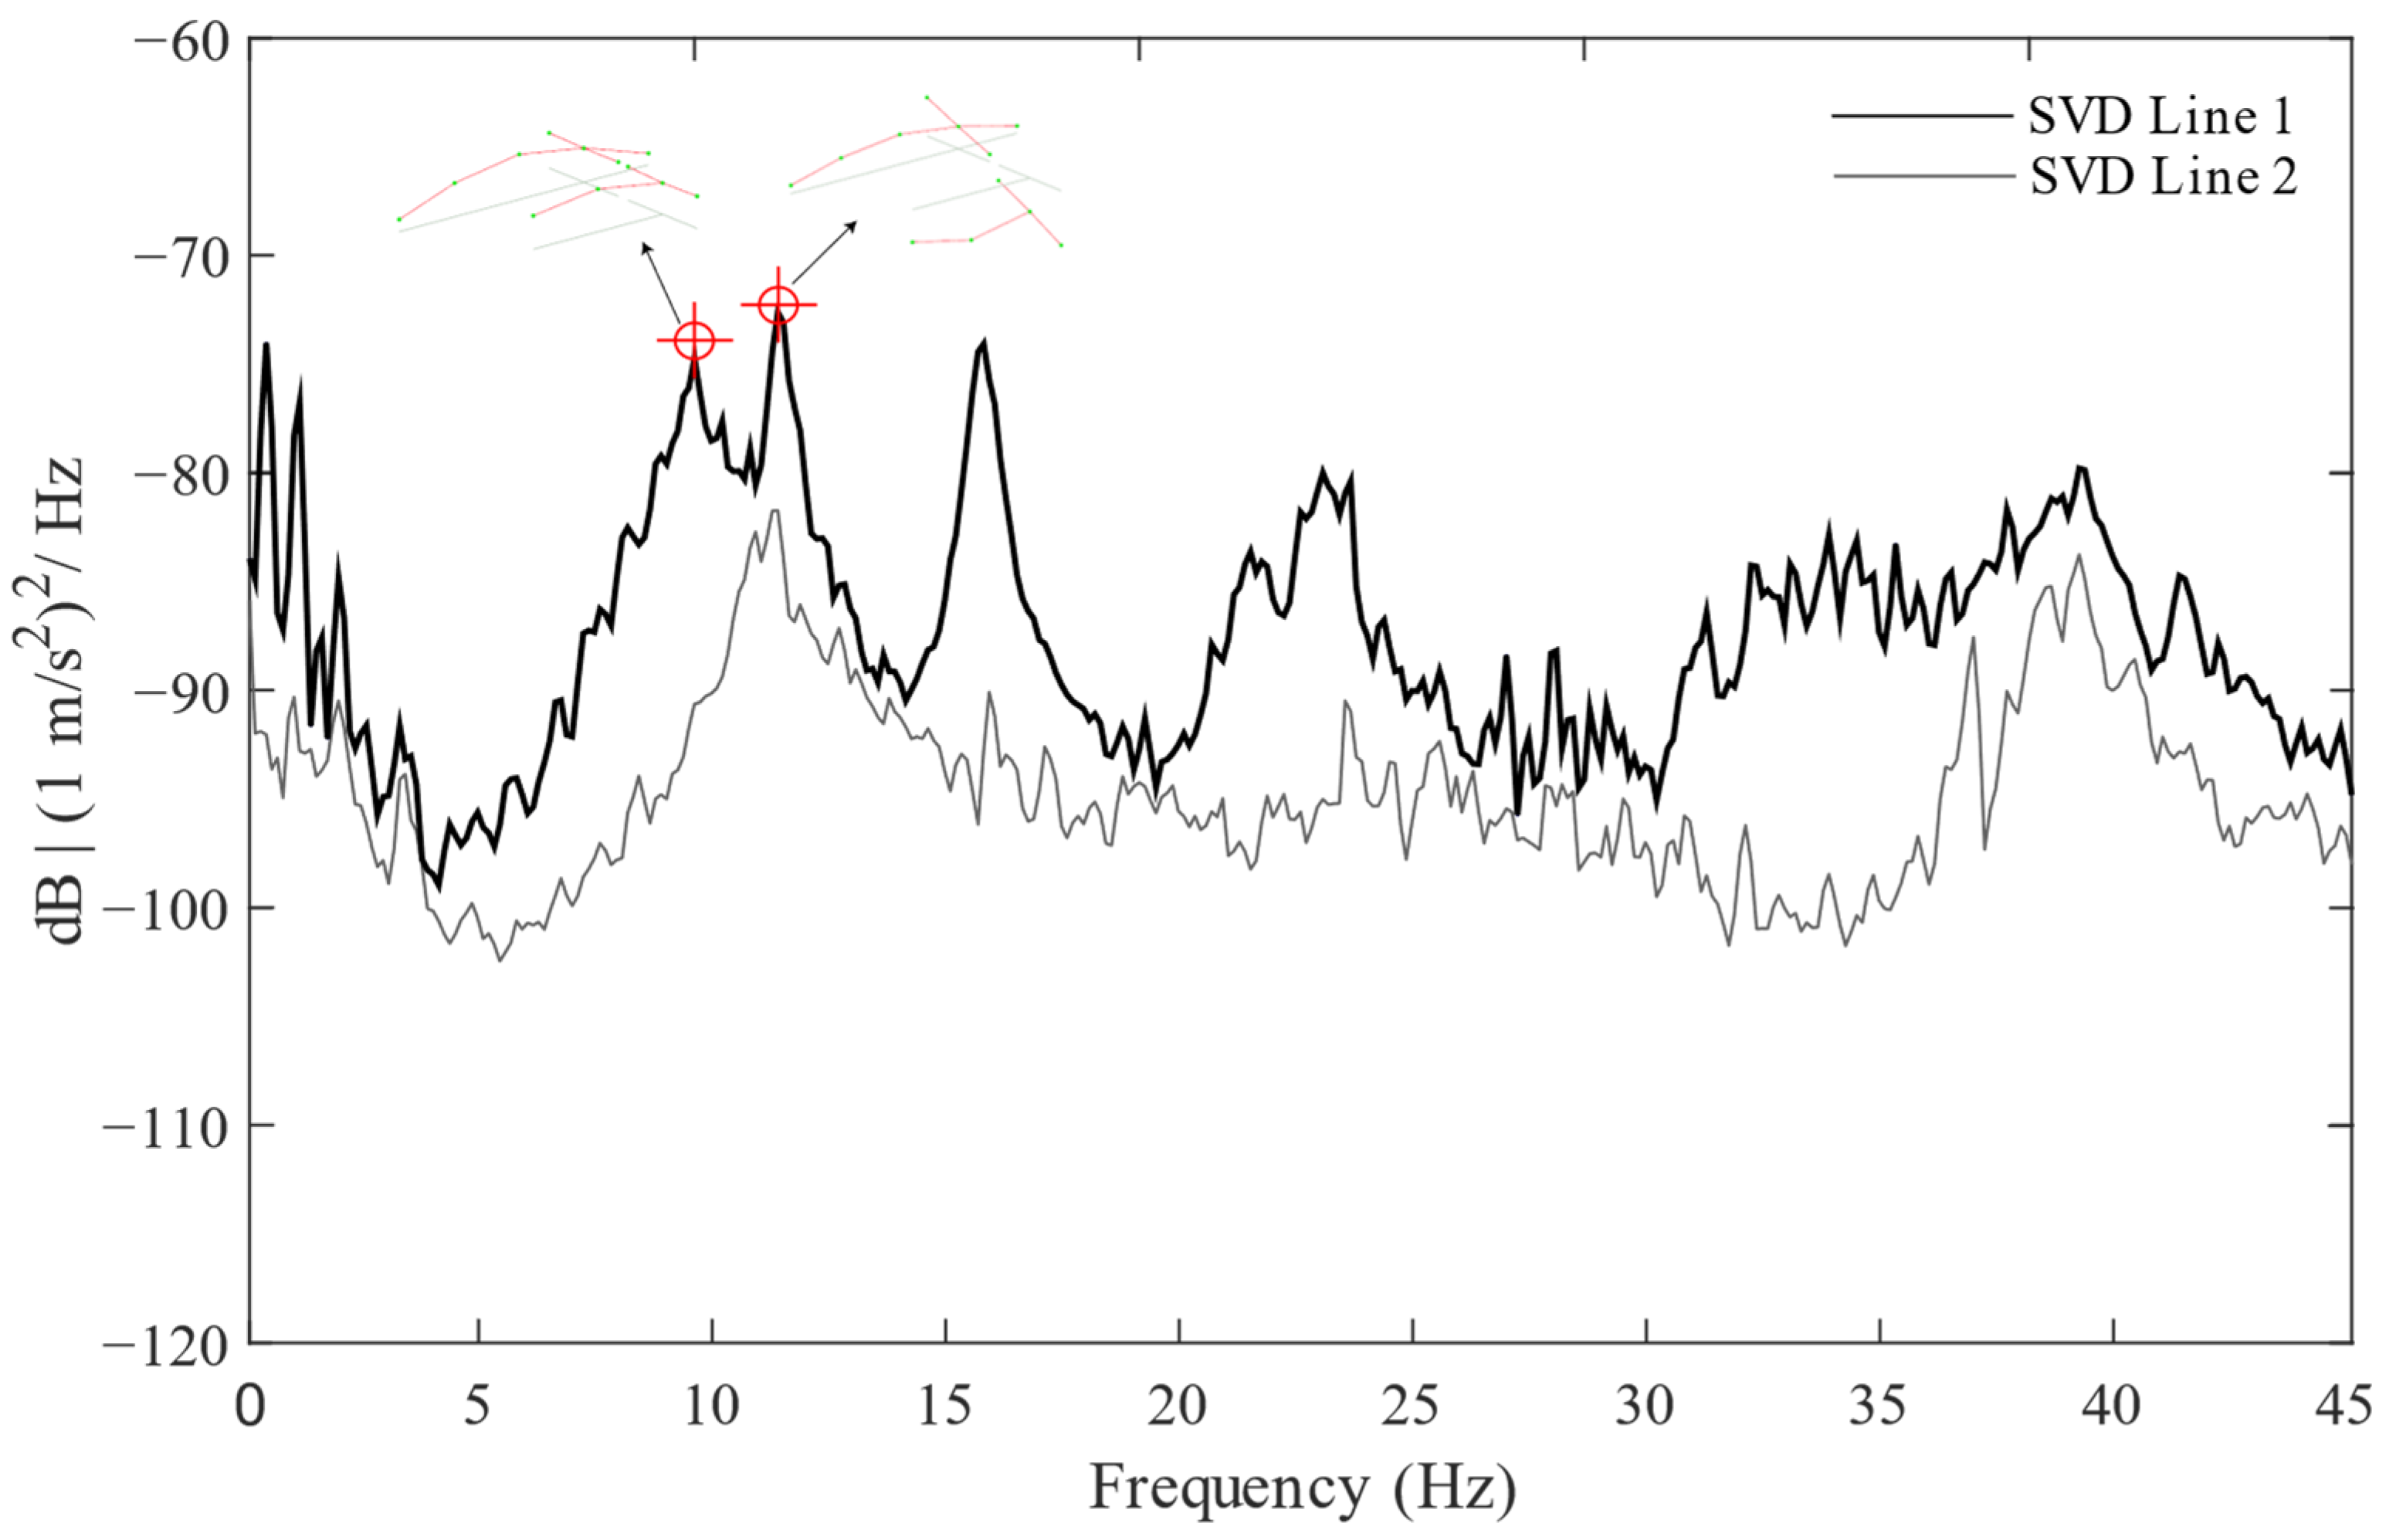
The post-processing of the results of these ambient vibration tests was performed using the Enhanced Frequency Domain Decomposition method (EFDD). This method, which is available in the ARTeMIS® software [52], allowed the estimation of the modal parameters of the bridges, particularly, natural frequencies, mode shapes, and damping coefficients, taking into account the peaks of the curves of the average normalized singular values decomposition of the spectral density matrices of the method, which correspond to the vibration modes, as shown in Figure 14.
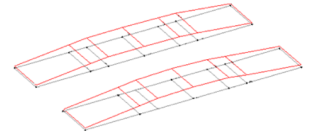
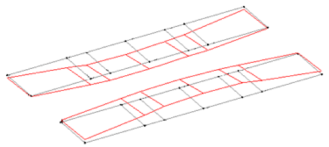
Table 5 presents the results for all the tested bridges, namely, the mode shapes of each vibration mode for all bridges and the corresponding natural frequencies f and damping coefficients ξ. In some bridges, the EFDD method allowed the detection of three vibration modes, while on other bridges, the method only allowed the detection of two vibration modes.

4.3.2. Tests under Railway Traffic

The tests under railway traffic were also performed in the same four filler-beam bridges of the Northern Line of the Portuguese Railways Network. This type of testing is conducted to a measurement of the dynamic response of the bridge, in terms of accelerations caused by the passing trains. The responses were useful to estimate the damping of the bridges through the Prony method described and validated before in Section 2 and Section 3, respectively.
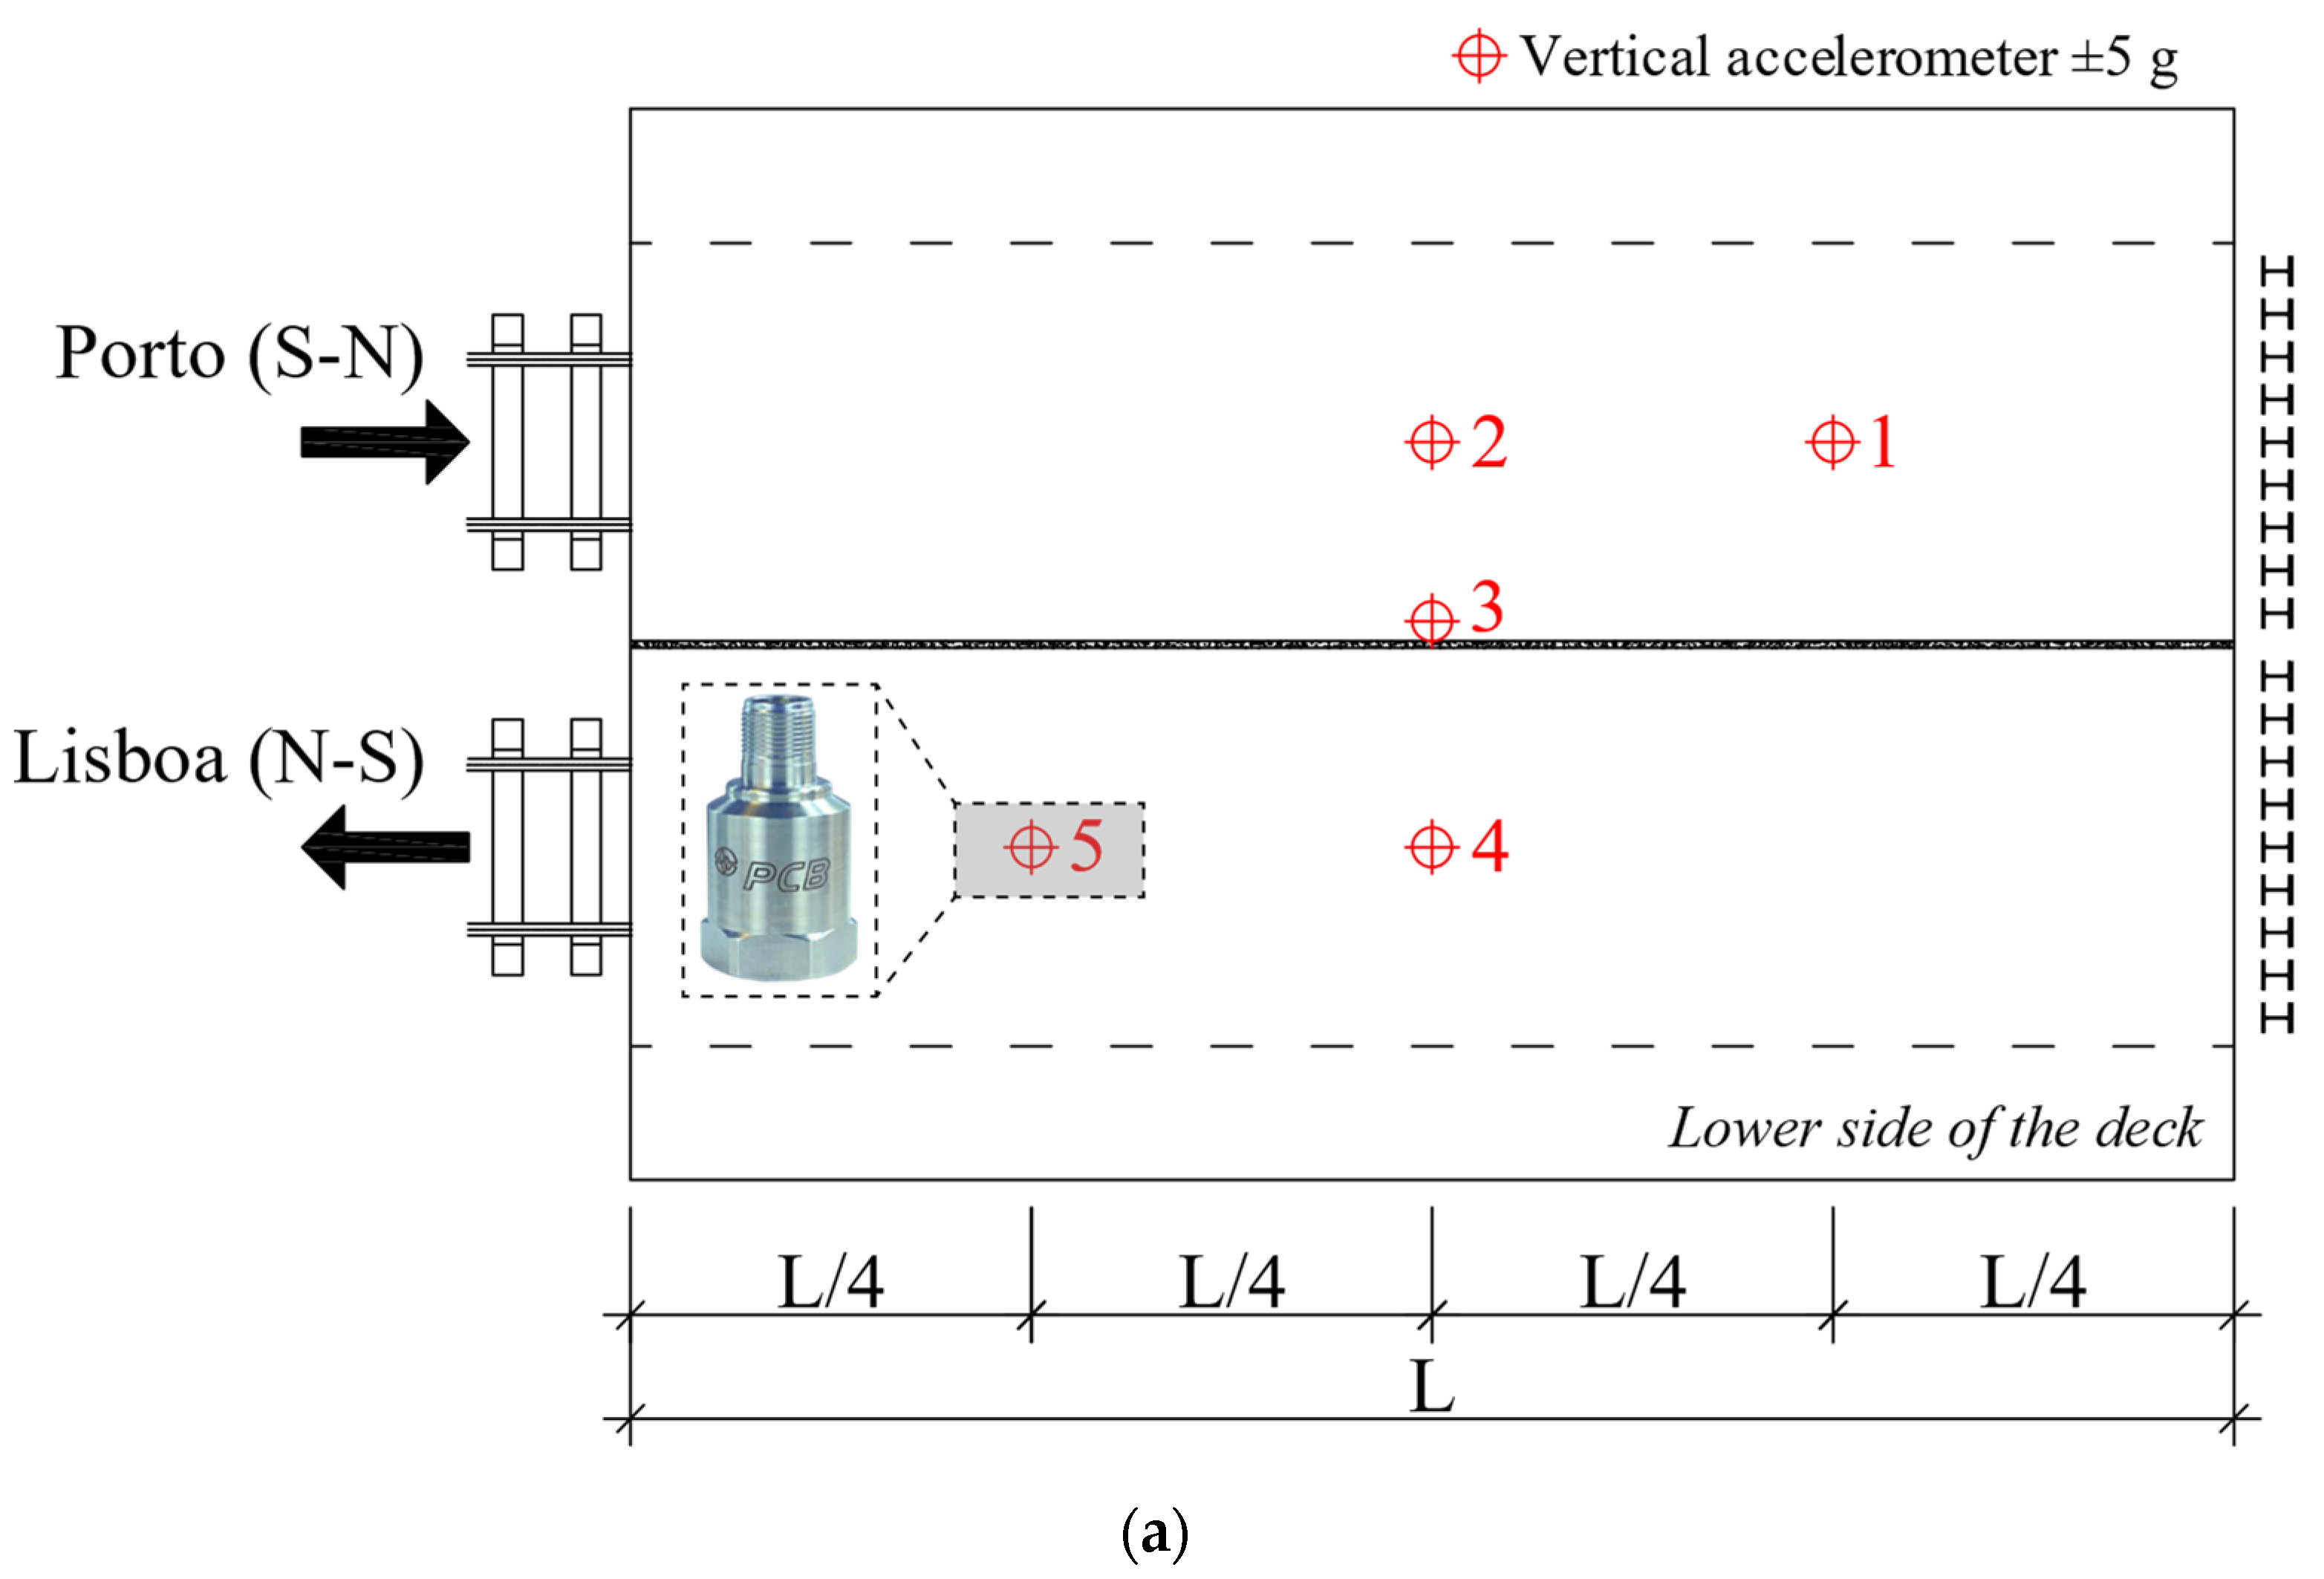
As for the ambient vibration tests, these were also performed using a typical layout for the sensors consisting of 5 measurement points, as illustrated in Figure 15a, to guarantee a full representation of the passing trains in both railway tracks of the bridge deck.
The equipment used for the testing consisted of piezoelectric accelerometers to measure the vertical acceleration due to trains’ passage, PCB model 393A03 (Figure 15a) with a sensitivity of 1 V/g and a measurement range of ±5 g, installed on the bridge deck’s lower side. In these tests, accelerometers were used with a higher measurement range, due to the higher acceleration levels imposed by the passing trains. The accelerometers were distributed along the span in the centre of each track, and an additional one (number 3 in Figure 15a) near the joint between the two half-decks. All the accelerometers were placed along the embedded steel beams from the deck. For the detection of the train axles, four optical sensors were installed in the track sleepers, two in each track. These sensors were useful to detect the train axles envisaging the speed estimation and axles spacing, allowing the detection of the precise time instant that the last train axle leaves the bridge, which is decisive to estimate the beginning of the free vibration movement of the bridge (see Section 3.2). Figure 15b represents the location of these sensors in the deck’s upper side, with an overview of its installation.
The time series of the trains were acquired with a sampling frequency of 2048 Hz and the data acquisition was performed using the cDAQ-9188 system from National Instruments (NI), equipped with IEPE analog input modules with 24-bit resolution (NI-9234).
The post processing of the results was performed using the free vibration responses after the train passage, using the Prony method, explained in Section 2, taking into account the sensitivity analysis in relation to the free vibration period and the validation of the Prony method presented in Section 3.2 and Section 3.3, respectively. The Prony method is, in some cases, more efficient to estimate the structural parameters of the bridges, especially when the free vibration period after the trains passage is not controlled by the first vibration mode but by coupled modes.
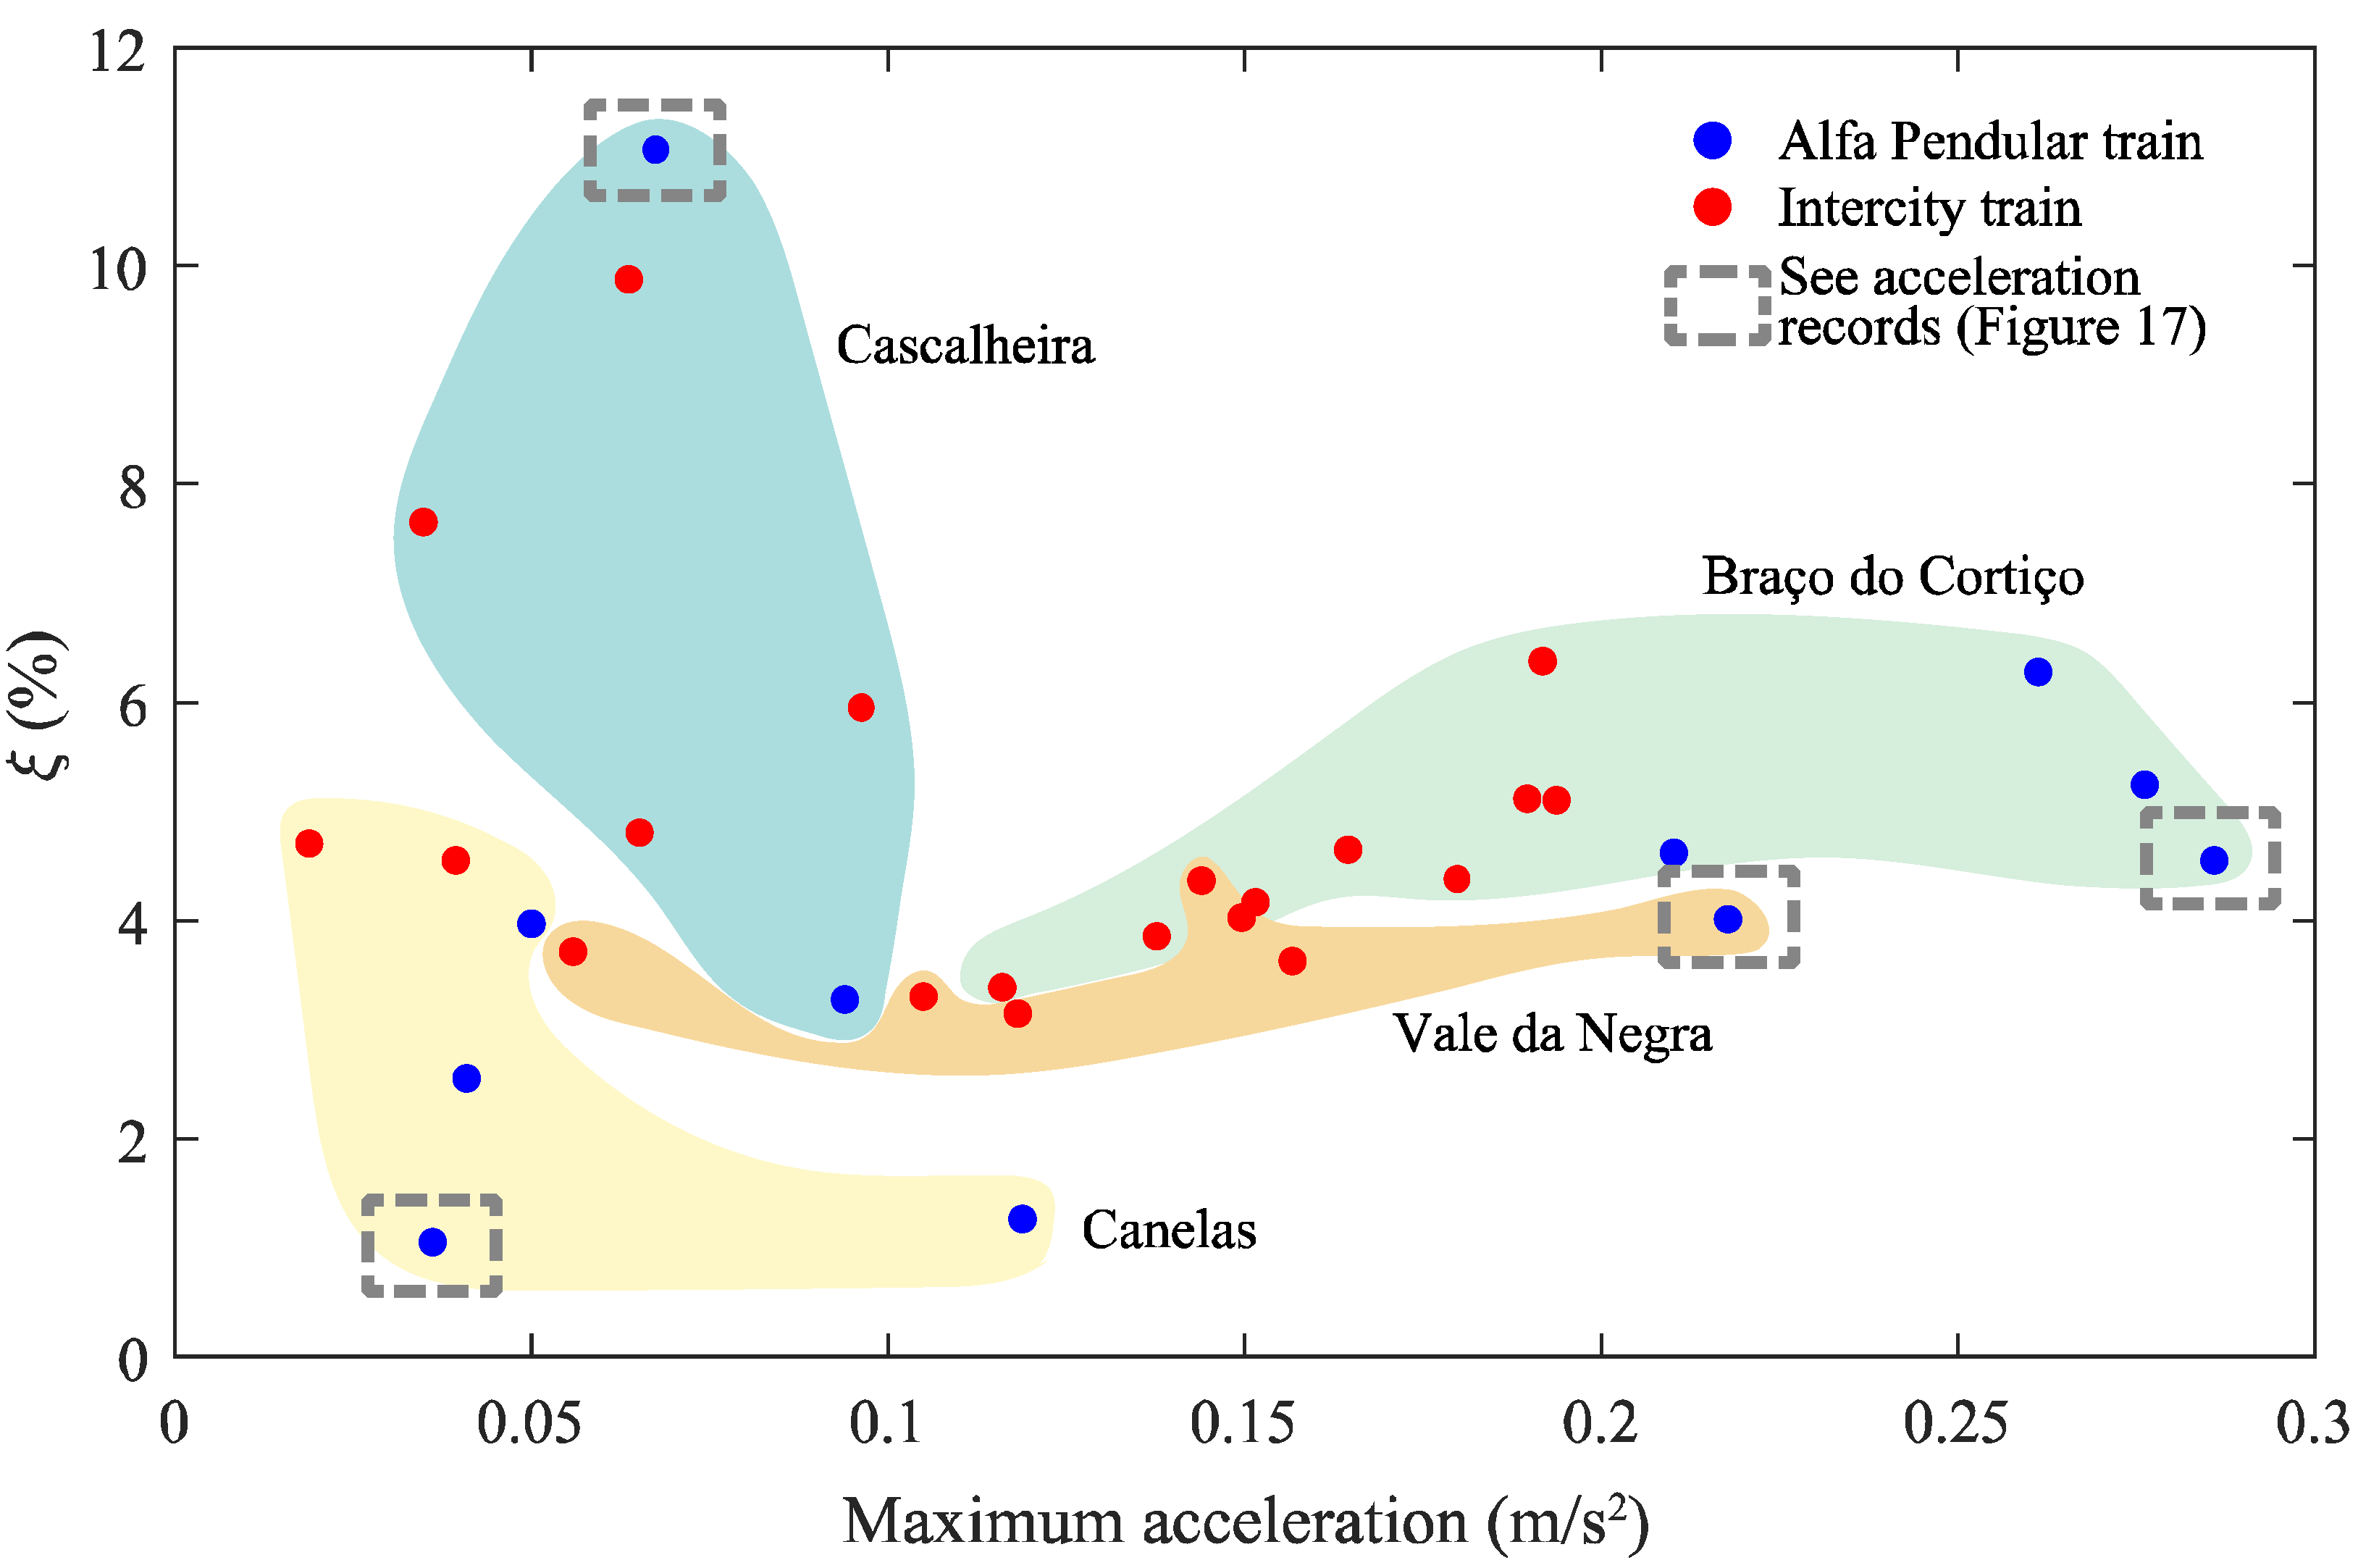
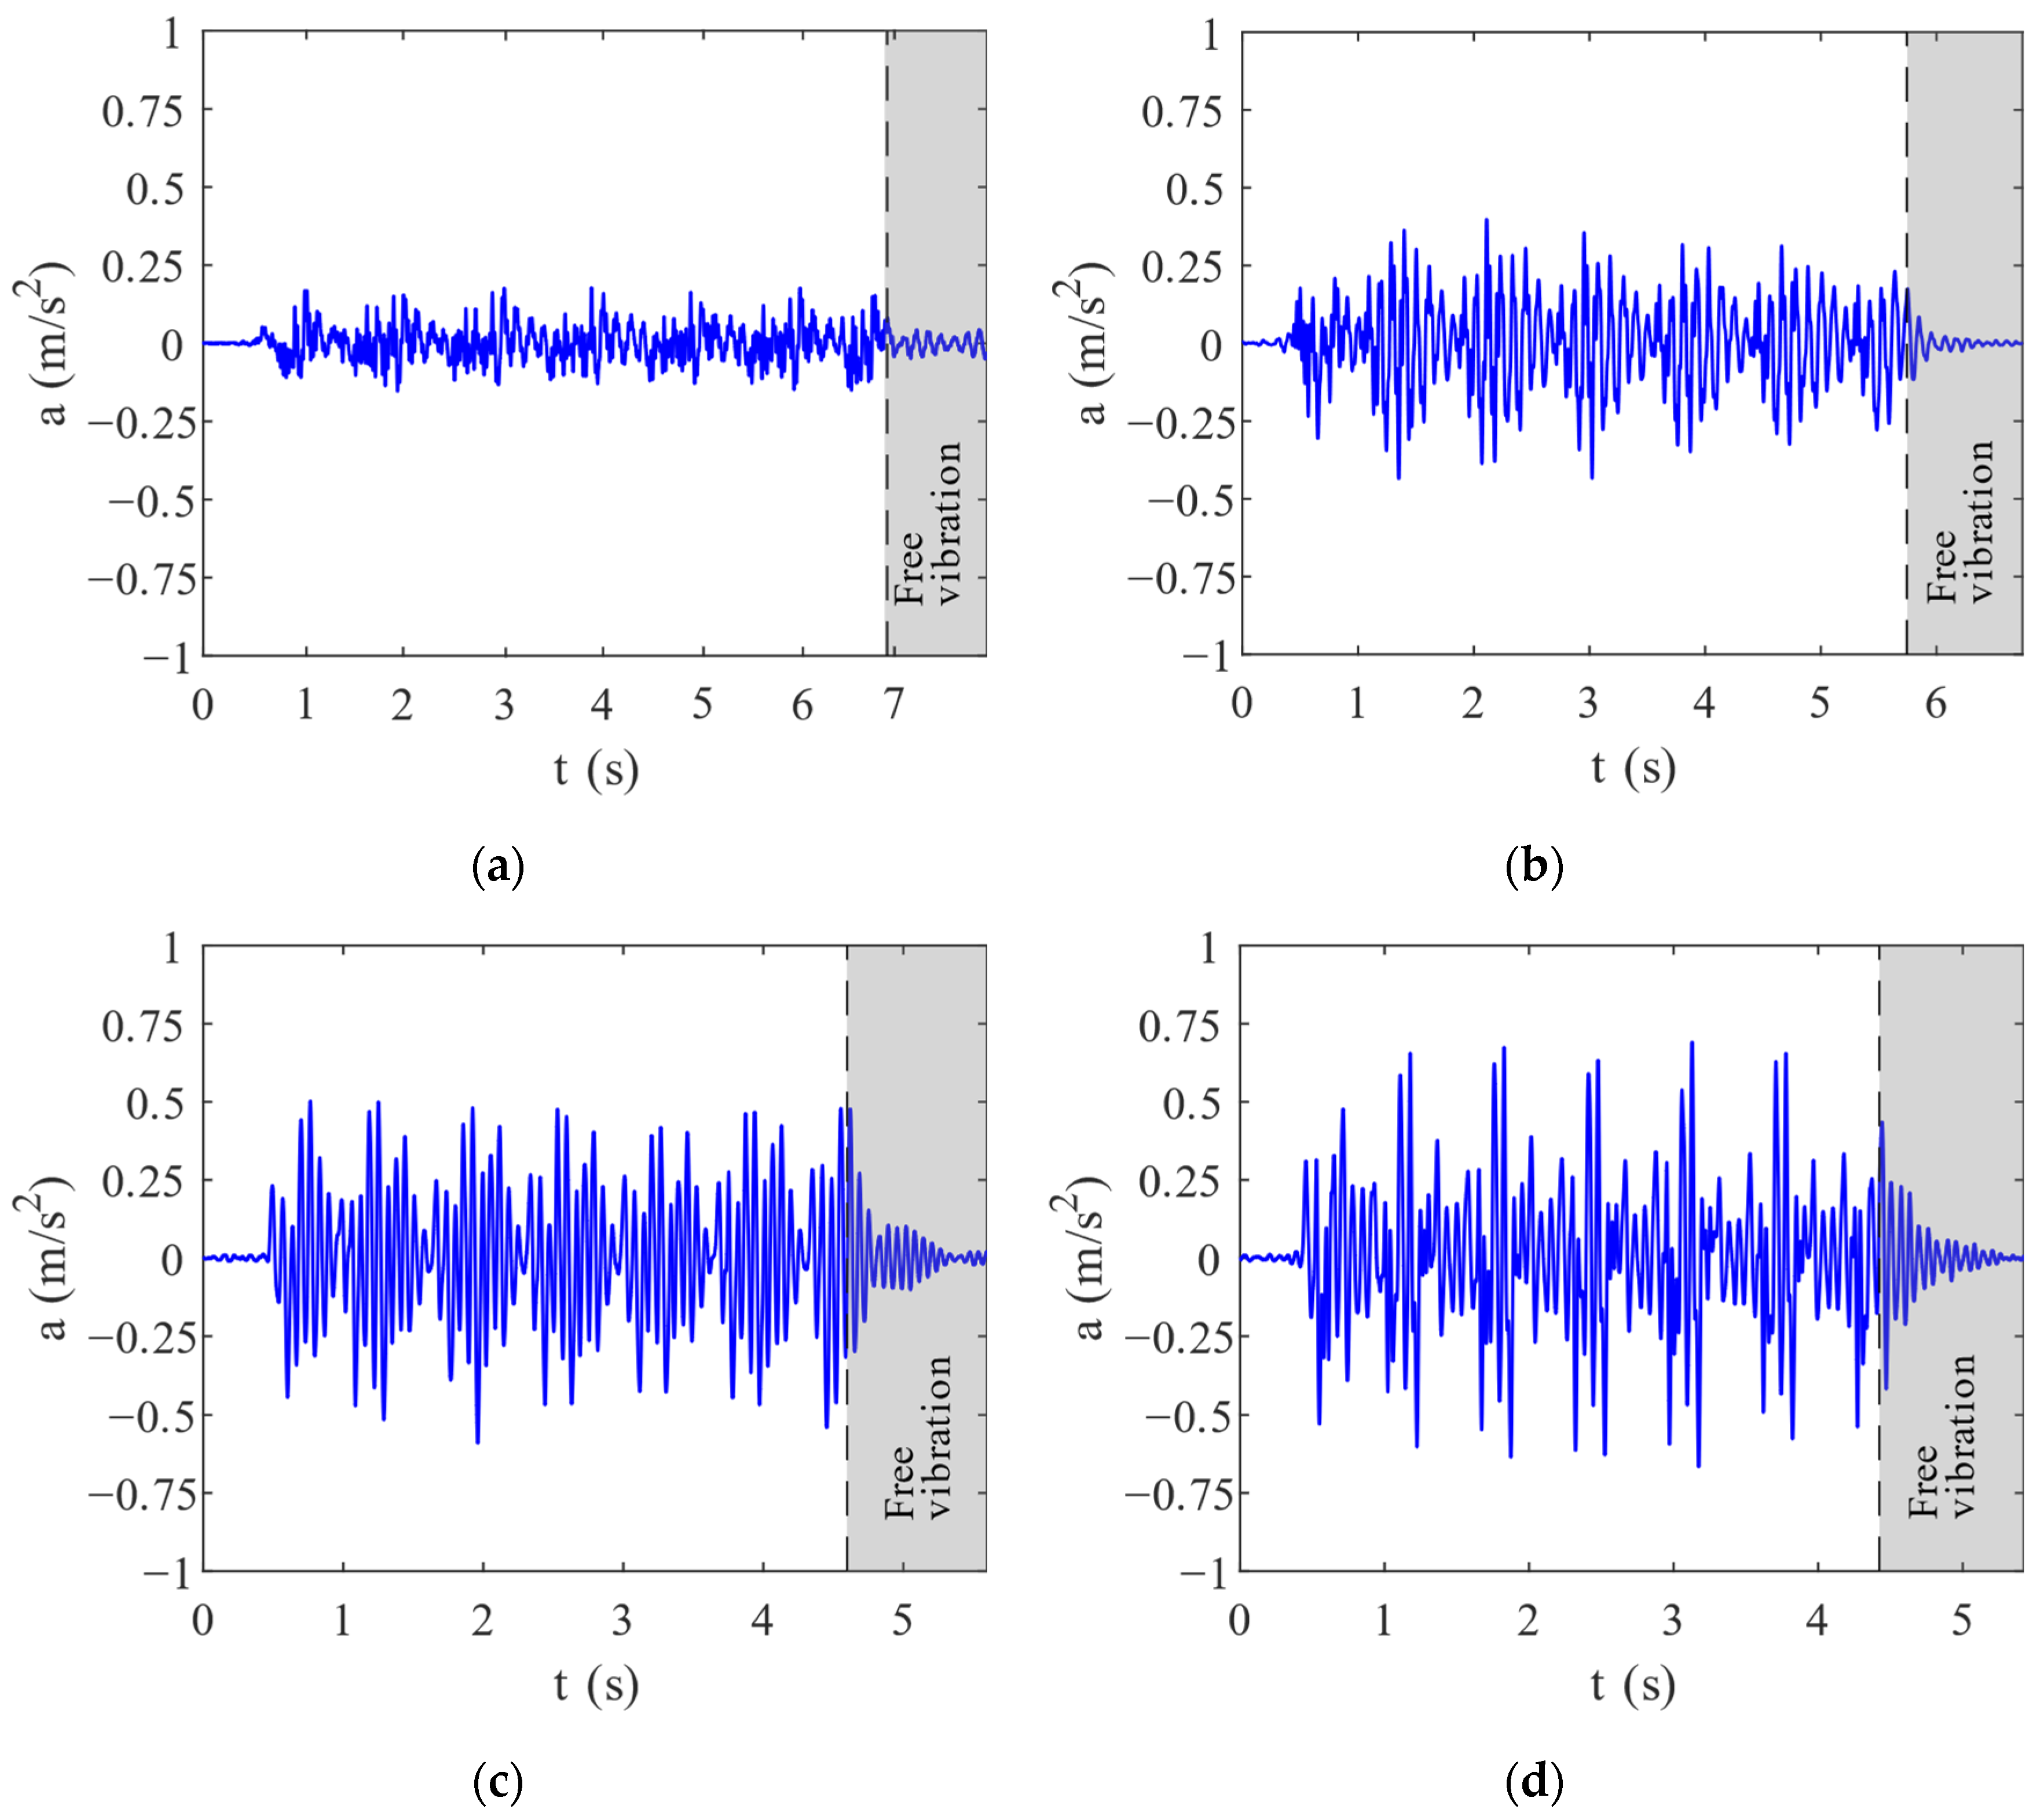
Figure 16 presents the results of damping coefficient values extracted from Prony method as a function of the maximum acceleration for the eigenfrequencies. The results consider the different values for two types of trains of the Portuguese Railways. It can be seen that for lower acceleration values, there is more dispersion in the damping coefficient values, with variations between 1% and 11%. For higher acceleration values, the dispersion of the damping coefficient values tends to decrease, with variations between 4% and 6%. Higher acceleration values in the train acceleration records in free vibration are a good reference for a better estimation and a smaller dispersion in the damping coefficient values, using the Prony method for the estimates. In the same figure, an example is highlighted for each of the bridges for which, in Figure 17, the acceleration records are represented, where the different levels of signal amplitude in the various bridges are visible.
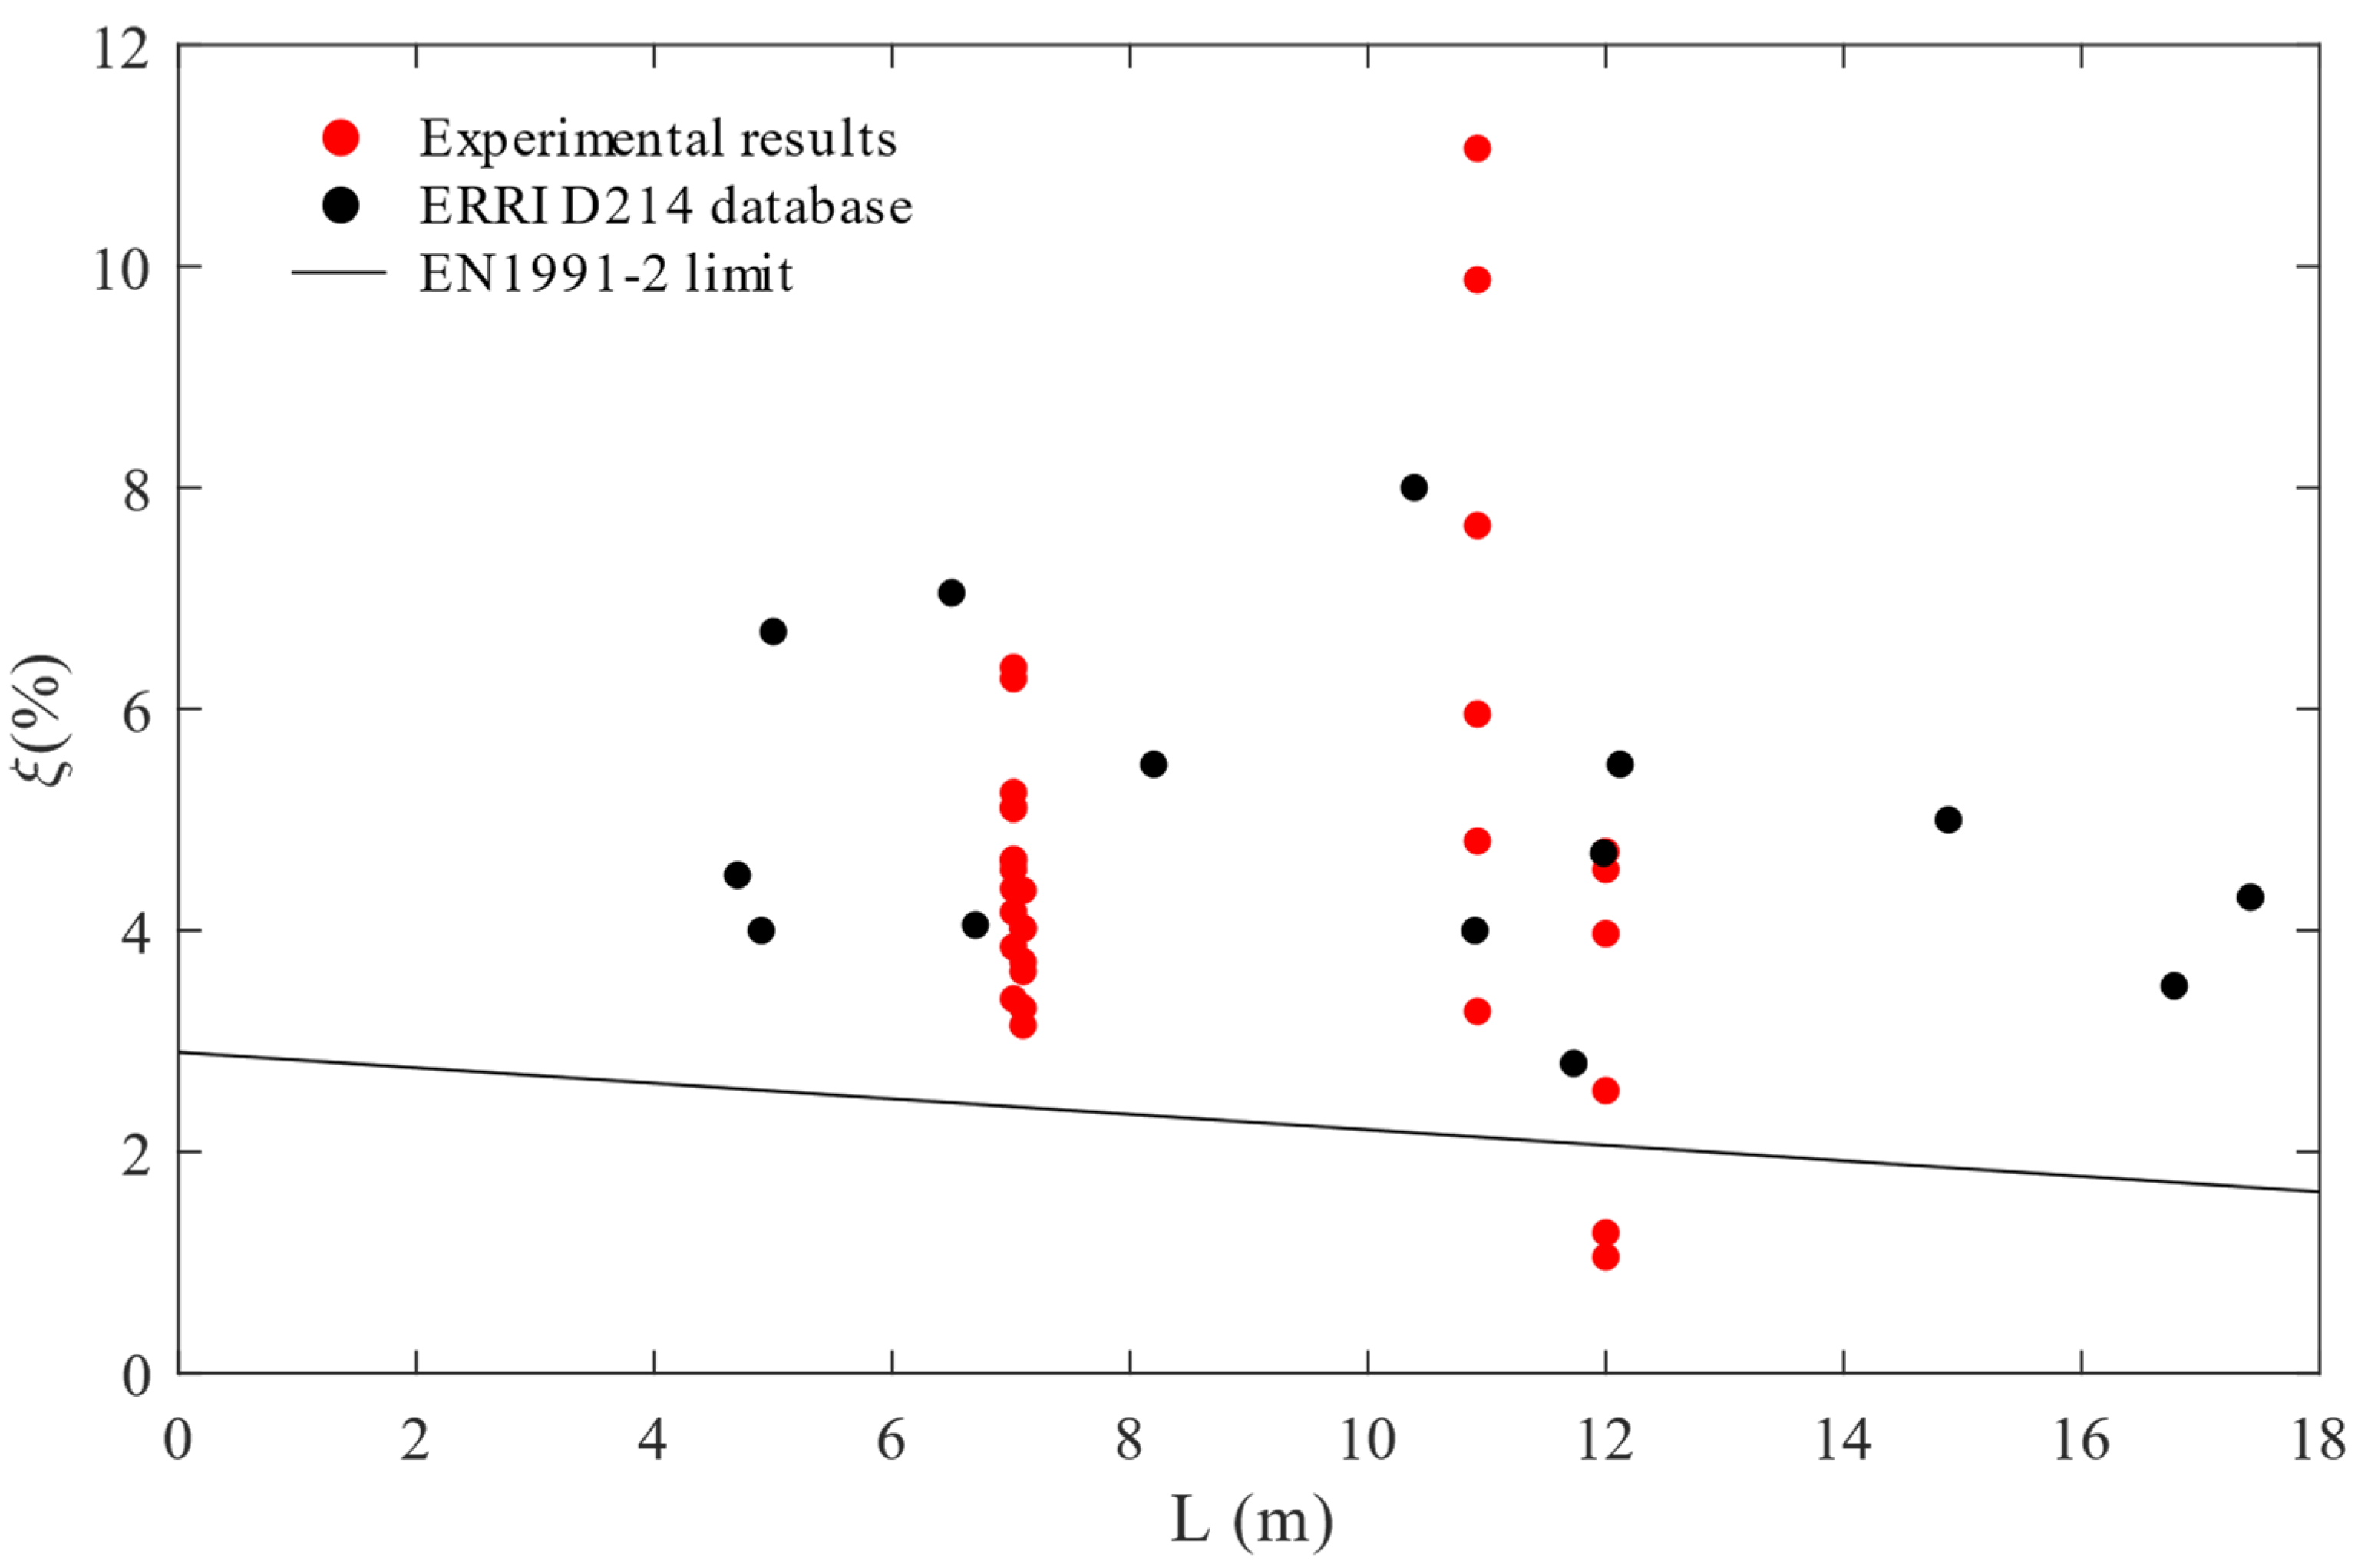
Figure 18 presents the damping coefficient values extracted from the Prony method for the four filler-beam bridges, as a function of each bridge span length. In the Figure is presented as well the results reported from the ERRI D214 committee [1] for filler-beam bridges and the respective lower limit for the damping coefficients from the EN1991-2 [2]. It can be observed that, for span lengths between 4 m and 8 m, the results obtained with the Prony method agree well with the results from the ERRI D214 database. However, for span lengths between 10 m and 12 m, the results of the Prony method are more dispersed, due to the low acceleration levels in which the damping coefficients were calculated, as demonstrated in Figure 16. This shows that this methodology should be applied for higher acceleration records, in order to obtain more precise damping coefficients. The results obtained with the Prony method may allow an update to the ERRI D214 database and further revisions of the EN1991-2 regarding the limits for the damping coefficient values.

5. Conclusions

This work focused on the presentation of an alternative methodology to assess the damping coefficients using the free vibration records from passing trains in filler-beam bridges, contributing to new developments in the damping assessment in railway bridges.
The methodology presented is based in the Prony method with application in the damping assessment in railway bridges. This method has the advantage of estimating the damping coefficients, frequency, phase, and amplitude of each sinusoid comprising the whole signal of the free vibration acceleration record of the passing trains, through decomposition of damped complex exponential sinusoids of the signal. However, when the signal is subjected to a high amplitude of noise, the method tends to have poor behaviour. To overcome this situation, a lowpass filter should be applied to the original data signal to eliminate as much noise as possible that is found in higher frequencies. The energy-sorting technique of the Prony method made it possible to sort each frequency of the complex exponential sinusoid as a function of the energy content of each frequency to identify the dominant frequencies of each signal, which are the ones with the most energy content. This technique reduces the chance of false frequency estimations.
The continuity effect of the track causes the free vibration not to start immediately after the train leaves the bridge. The analysis of this effect was done using static and dynamic analyses. The static analysis evaluated the influence line of displacements to analyse the distance for which the load starts to lose influence in the bridge’s response. The dynamic analysis evaluated the receptance, considering dynamic impact loads at different distances away from the bridge. These analyses conclude that the distance for which the load has a negligible effect in the response is when the train is approximately 3.0 m away from the bridge. This assumption was used for the damping estimation using the Prony method. The validation of the Prony method using a 3D numerical model through train–track–bridge interaction analyses, using different train speeds and different types of vertical irregularities, was made. A known damping coefficient was imposed to the first two modes of vibration of the bridge, according to the lower limit bound for filler-beam bridges of the EN1991-2. The Prony method proved to be capable to accurately identify the frequencies and damping coefficients of the numerical model, using the free vibration periods from the interaction analyses. The method has also shown efficiency in identifying frequencies and damping coefficients when coupled modes of vibration are presented in the free vibration periods.
The experimental assessment of the damping coefficients was performed in four filler-beam railway bridges of the Portuguese Railways Network. These tests evolved ambient vibration tests to achieve the modal parameters of the presented bridges, useful to the application of the Prony method. The tests under railway traffic allowed the identification of the dynamic response in terms of accelerations of each bridge due to the passage of trains. The results obtained in these tests made it possible to estimate the frequency and damping of each bridge due to the passing trains.
The work developed allowed a different approach of analysis of damping coefficients in railway bridges, highlighting the dominant frequencies that are mobilized after the train’s passage and its respective damping. The results of this work may allow one to update the limits for damping coefficients of the filler-beam railway bridges from the EN1991-2, giving forward steps for designing less expensive railway bridges as well as avoiding unnecessary retrofitting measures in existing railway bridges that aim to support new traffic at higher speeds.

Author Contributions

Methodology, A.S., D.R., P.A.M. and G.F.; formal analysis, A.S.; investigation, A.S., D.R., P.A.M. and G.F.; writing—original draft preparation, A.S., D.R., P.A.M. and G.F.; writing—review and editing, R.K., A.A., A.Z. and R.C.; visualization, A.S.; supervision, D.R. and P.A.M.; project administration, R.K. and R.C.; funding acquisition, R.C. All authors have read and agreed to the published version of the manuscript.

Funding

The authors would like also to acknowledge the financial support of the projects IN2TRACK2 and IN2TRACK3 funded by the Shift2Rail Joint Undertaking under the European Union’s Horizon 2020 research and innovation programme under grant agreements No. 826255 and No. 101012456, respectively, and of the Base Funding—UIDB/04708/2020 of the CONSTRUCT—Instituto de I&D em Estruturas e Construções—funded by national funds through the FCT/MCTES (PIDDAC). This work is also a result of the project Operation NORTE-08-5369-FSE-000027 supported by Norte Portugal Regional Operational Programme (NORTE 2020), under the PORTUGAL 2020 Partnership Agreement, through the European Social Fund (ESF). Finally, the third and fourth authors acknowledge financial support from the Portuguese Foundation for Science and Technology (FCT) through grant no. 2020.00305.CEECIND from the Stimulus of Scientific Employment, Individual Support (CEEC-IND)—3rd Edition and through the PhD scholarship PD/BD/143007/2018, respectively.

Institutional Review Board Statement

Not applicable.

Informed Consent Statement

Not applicable.

Data Availability Statement

Not applicable.

Acknowledgments

The authors extend their appreciation to Nuno Pinto of the CONSTRUCT-LESE laboratory for providing invaluable support throughout the preparation of the experimental tests.

Conflicts of Interest

The authors declare no conflict of interest.

References

  1. ERRI D214. ERRI D214/RP3; Railway Bridges for Speeds >200 km/h. Recommendations for Calculating Damping in Rail Bridge Decks. ERRI: Utrecht, The Netherlands, 1999.
  2. Eurocode EN 1991-2; Actions of Structures—Part 2: Traffic Loads on Bridges. CEN: Brussels, Belgium, 2003.
  3. Zhai, W.; Han, Z.; Chen, Z.; Ling, L.; Zhu, S. Train–track–bridge dynamic interaction: A state-of-the-art review. Veh. Syst. Dyn. 2019, 57, 984–1027. [Google Scholar] [CrossRef] [Green Version]
  4. Zhai, W.; Wang, K.; Cai, C. Fundamentals of vehicle–track coupled dynamics. Veh. Syst. Dyn. 2009, 47, 1349–1376. [Google Scholar] [CrossRef]
  5. Iwnicki, S.; Spiryagin, M.; Cole, C.; McSweeney, T. Handbook of Railway Vehicle Dynamics; CRC Press: Boca Raton, FL, USA, 2019. [Google Scholar] [CrossRef]
  6. Mosleh, A.; Meixedo, A.; Ribeiro, D.; Montenegro, P.; Calçada, R. Early wheel flat detection: An automatic data-driven wavelet-based approach for railways. Veh. Syst. Dyn. 2022, 1–30. [Google Scholar] [CrossRef]
  7. Chen, S.; Wang, K.; Zhou, Z.; Yang, Y.; Chen, Z.; Zhai, W. Quantitative detection of locomotive wheel polygonization under non-stationary conditions by adaptive chirp mode decomposition. Railw. Eng. Sci. 2022, 30, 129–147. [Google Scholar] [CrossRef]
  8. Museros, P.; Moliner, E.; Martínez-Rodrigo, M.D. Free vibrations of simply-supported beam bridges under moving loads: Maximum resonance, cancellation and resonant vertical acceleration. J. Sound. Vib. 2013, 332, 326–345. [Google Scholar] [CrossRef]
  9. Stollwitzer, A.; Fink, J.; Malik, T. Experimental analysis of damping mechanisms in ballasted track on single-track railway bridges. Eng. Struct. 2020, 220, 110982. [Google Scholar] [CrossRef]
  10. Brunetti, M.; Ciambella, J.; Evangelista, L.; Lofrano, E.; Paolone, A.; Vittozzi, A. Experimental results in damping evaluation of a high-speed railway bridge. Procedia Eng. 2017, 199, 3015–3020. [Google Scholar] [CrossRef]
  11. Rebelo, C.; Simões da Silva, L.; Rigueiro, C.; Pircher, M. Dynamic behaviour of twin single-span ballasted railway viaducts—Field measurements and modal identification. Eng. Struct. 2008, 30, 2460–2469. [Google Scholar] [CrossRef]
  12. Martínez-Rodrigo, M.D.; Lavado, J.; Museros, P. Dynamic performance of existing high-speed railway bridges under resonant conditions retrofitted with fluid viscous dampers. Eng. Struct. 2010, 32, 808–828. [Google Scholar] [CrossRef]
  13. Chen, Z.; Fang, H.; Han, Z.; Sun, S. Influence of bridge-based designed TMD on running trains. J. Vib. Control 2019, 25, 182–193. [Google Scholar] [CrossRef]
  14. Tell, S.; Leander, J.; Andersson, A.; Ülker-Kaustell, M. Probability-based evaluation of the effect of fluid viscous dampers on a high-speed railway bridge. Struct. Infrastruct. Eng. 2021, 17, 1730–1742. [Google Scholar] [CrossRef]
  15. Ticona Melo, L.R.; Malveiro, J.; Ribeiro, D.; Calçada, R.; Bittencourt, T. Dynamic analysis of the train-bridge system considering the non-linear behaviour of the track-deck interface. Eng. Struct. 2020, 220, 110980. [Google Scholar] [CrossRef]
  16. Galvín, P.; Romero, A.; Moliner, E.; De Roeck, G.; Martínez-Rodrigo, M.D. On the dynamic characterisation of railway bridges through experimental testing. Eng. Struct. 2021, 226, 111261. [Google Scholar] [CrossRef]
  17. Gattulli, V.; Lofrano, E.; Paolone, A.; Potenza, F. Measured properties of structural damping in railway bridges. J Civ Struct Heal. Monit. 2019, 9, 639–653. [Google Scholar] [CrossRef]
  18. Reiterer, M.; Lachinger, S.; Fink, J.; Bruschetini-Ambro, S.-Z. In-Situ Experimental Modal Testing of Railway Bridges. Int. Conf. Exp. Mech. 2018, 2, 413. [Google Scholar] [CrossRef] [Green Version]
  19. Stollwitzer, A.; Bettinelli, L.; Fink, J. The longitudinal track-bridge interaction of ballasted track in railway bridges: Experimental determination of dynamic stiffness and damping characteristics. Eng. Struct. 2023, 274, 115115. [Google Scholar] [CrossRef]
  20. Ülker-Kaustell, M.; Karoumi, R. Influence of non-linear stiffness and damping on the train-bridge resonance of a simply supported railway bridge. Eng. Struct. 2012, 41, 350–355. [Google Scholar] [CrossRef]
  21. Lind Östlund, J.; Andersson, A.; Ülker-Kaustell, M.; Battini, J.-M. On the influence of shallow soil strata on the dynamic soil–structure interaction of simply supported high-speed railway bridges. Int. J. Rail. Transp. 2021, 9, 405–423. [Google Scholar] [CrossRef]
  22. Zangeneh, A.; Battini, J.-M.; Pacoste, C.; Karoumi, R. Fundamental modal properties of simply supported railway bridges considering soil-structure interaction effects. Soil. Dyn. Earthq. Eng. 2019, 121, 212–218. [Google Scholar] [CrossRef]
  23. Glatz, B.; Fink, J. A redesigned approach to the additional damping method in the dynamic analysis of simply supported railway bridges. Eng. Struct. 2021, 241, 112415. [Google Scholar] [CrossRef]
  24. Stoura, C.D.; Dimitrakopoulos, E.G. Additional damping effect on bridges because of vehicle-bridge interaction. J. Sound. Vib. 2020, 476, 115294. [Google Scholar] [CrossRef]
  25. Malveiro, J.; Ribeiro, D.; Calçada, R.; Delgado, R. Updating and validation of the dynamic model of a railway viaduct with precast deck. Struct. Infrastruct. Eng. 2014, 10, 1484–1509. [Google Scholar] [CrossRef]
  26. Malveiro, J.; Sousa, C.; Ribeiro, D.; Calçada, R. Impact of track irregularities and damping on the fatigue damage of a railway bridge deck slab. Struct. Infrastruct. Eng. 2018, 14, 1257–1268. [Google Scholar] [CrossRef]
  27. Zangeneh, A.; Svedholm, C.; Andersson, A.; Pacoste, C.; Karoumi, R. Identification of soil-structure interaction effect in a portal frame railway bridge through full-scale dynamic testing. Eng. Struct. 2018, 159, 299–309. [Google Scholar] [CrossRef]
  28. Saramago, G.; Montenegro, P.A.; Ribeiro, D.; Silva, A.; Santos, S.; Calçada, R. Experimental Validation of a Double-Deck Track-Bridge System under Railway Traffic. Sustainability 2022, 14, 5794. [Google Scholar] [CrossRef]
  29. Ticona Melo, L.R.; Ribeiro, D.; Calçada, R.; Bittencourt, T.N. Validation of a vertical train–track–bridge dynamic interaction model based on limited experimental data. Struct. Infrastruct. Eng. 2020, 16, 181–201. [Google Scholar] [CrossRef]
  30. Moliner, E.; Martínez-Rodrigo, M.D.; Galvín, P.; Chordà- Monsonís, J.; Romero, A. On the vertical coupling effect of ballasted tracks in multi–span simply–supported railway bridges under operating conditions. Struct. Infrastruct. Eng. 2022, 1–23. [Google Scholar] [CrossRef]
  31. Ribeiro, D.; Costa, B.; Cruz, L.; Oliveira, M.; Alves, V.; Montenegro, P.; Calçada, R. Simulation of the Dynamic Behavior of a Centenary Metallic Bridge under Metro Traffic Actions Based on Advanced Interaction Models. Int. J. Struct. Stab. Dyn. 2021, 21, 2150057. [Google Scholar] [CrossRef]
  32. Ülker-Kaustell, M.; Karoumi, R. Application of the continuous wavelet transform on the free vibrations of a steel–concrete composite railway bridge. Eng. Struct. 2011, 33, 911–919. [Google Scholar] [CrossRef]
  33. Ribeiro, D.; Calçada, R.; Brehm, M.; Zabel, V. Train–Track–Bridge Dynamic Interaction on a Bowstring-Arch Railway Bridge: Advanced Modeling and Experimental Validation. Sensors 2022, 23, 171. [Google Scholar] [CrossRef]
  34. Petsounis, K.A.; Fassois, S.D. Parametric time-domain methods for the identification of vibrating structures—A critical comparison and assessment. Mech. Syst. Signal Process 2001, 15, 1031–1060. [Google Scholar] [CrossRef]
  35. Al-hababi, T.; Cao, M.; Saleh, B.; Alkayem, N.F.; Xu, H. A Critical Review of Nonlinear Damping Identification in Structural Dynamics: Methods, Applications, and Challenges. Sensors 2020, 20, 7303. [Google Scholar] [CrossRef]
  36. Park, D.-U.; Kim, N.-S.; Kim, S.-I. Damping Estimation of Railway Bridges Using Extended Kalman Filter. Trans. Korean Soc. Noise Vib. Eng. 2009, 19, 294–300. [Google Scholar] [CrossRef] [Green Version]
  37. Feltrin, G.; Gsell, E.D. Guideline for Estimating Structural Damping of Railway Bridges. Backgr. Doc. 2007, D5, 2-S2. [Google Scholar]
  38. Shift2Rail. IN2TRACK2 n.d. Available online: https://projects.shift2rail.org/s2r_ip3_n.aspx?p=IN2TRACK2 (accessed on 3 January 2023).
  39. Shift2Rail. IN2TRACK3 n.d. Available online: https://projects.shift2rail.org/s2r_ip3_n.aspx?p=IN2TRACK3%0A (accessed on 3 January 2023).
  40. de Prony, G. Essai expérimental et analytique. J. E Polytech 1795, 1, 24–76. [Google Scholar]
  41. Hildebrand, F.B. Introduction to Numerical Analysis; Courier Corporation: North Chelmsford, MA, USA, 1987. [Google Scholar]
  42. Marple, S.L., Jr.; Carey, W.M. Digital Spectral Analysis with Applications; Prentice-Hall: Hoboken, NJ, USA, 1989; Volume 86, p. 2043. [Google Scholar] [CrossRef] [Green Version]
  43. Singh, S. Application of Prony Analysis to Characterize Pulsed Corona Reactor Measurements; University of Wyoming: Laramie, WY, USA, 2003. [Google Scholar]
  44. Qi, L.; Qian, L.; Woodruff, S.; Cartes, D. Prony Analysis for Power System Transient Harmonics. EURASIP J. Adv. Signal Process 2007, 2007, 048406. [Google Scholar] [CrossRef] [Green Version]
  45. Johnson, M.A.; Zarafonitis, I.P.; Calligaris, M. Prony analysis and power system stability-some recent theoretical and applications research. In Proceedings of the 2000 Power Engineering Society Summer Meeting (Cat. No. 00CH37134), Seattle, WA, USA, 16–20 July 2000; Volume 3, pp. 1918–1923. [Google Scholar] [CrossRef]
  46. MATLAB®; The MathWorks Inc.: Natick, MA, USA, 2020.
  47. Parks, T.W.; Burrus, C.S. Digital Filter Design; Wiley-Interscience: Hoboken, NJ, USA, 1987. [Google Scholar]
  48. Patel, V.S.; Bhil, S.K.; Kazi, F.S.; Wagh, S.R. Energy-sorted Prony analysis for identification of dominant low frequency oscillations. In Proceedings of the 2013 Australian Control Conference, Fremantle, WA, Australia, 4–5 November 2013; pp. 85–90. [Google Scholar] [CrossRef]
  49. Montenegro, P.A.; Neves, S.G.M.; Calçada, R.; Tanabe, M.; Sogabe, M. Wheel–rail contact formulation for analyzing the lateral train–structure dynamic interaction. Comput. Struct. 2015, 152, 200–214. [Google Scholar] [CrossRef] [Green Version]
  50. ANSYS®; ANSYS Inc.: Canonsburg, PA, USA, 2018.
  51. European Union. Europe’s Rail 2018. Available online: https://rail-research.europa.eu/%0A (accessed on 3 January 2023).
  52. ARTeMIS. ARTeMIS Extractor Pro—Academic License, User’s Manual, SVS. ARTeMIS: Aalborg, Denmark, 2009. [Google Scholar]
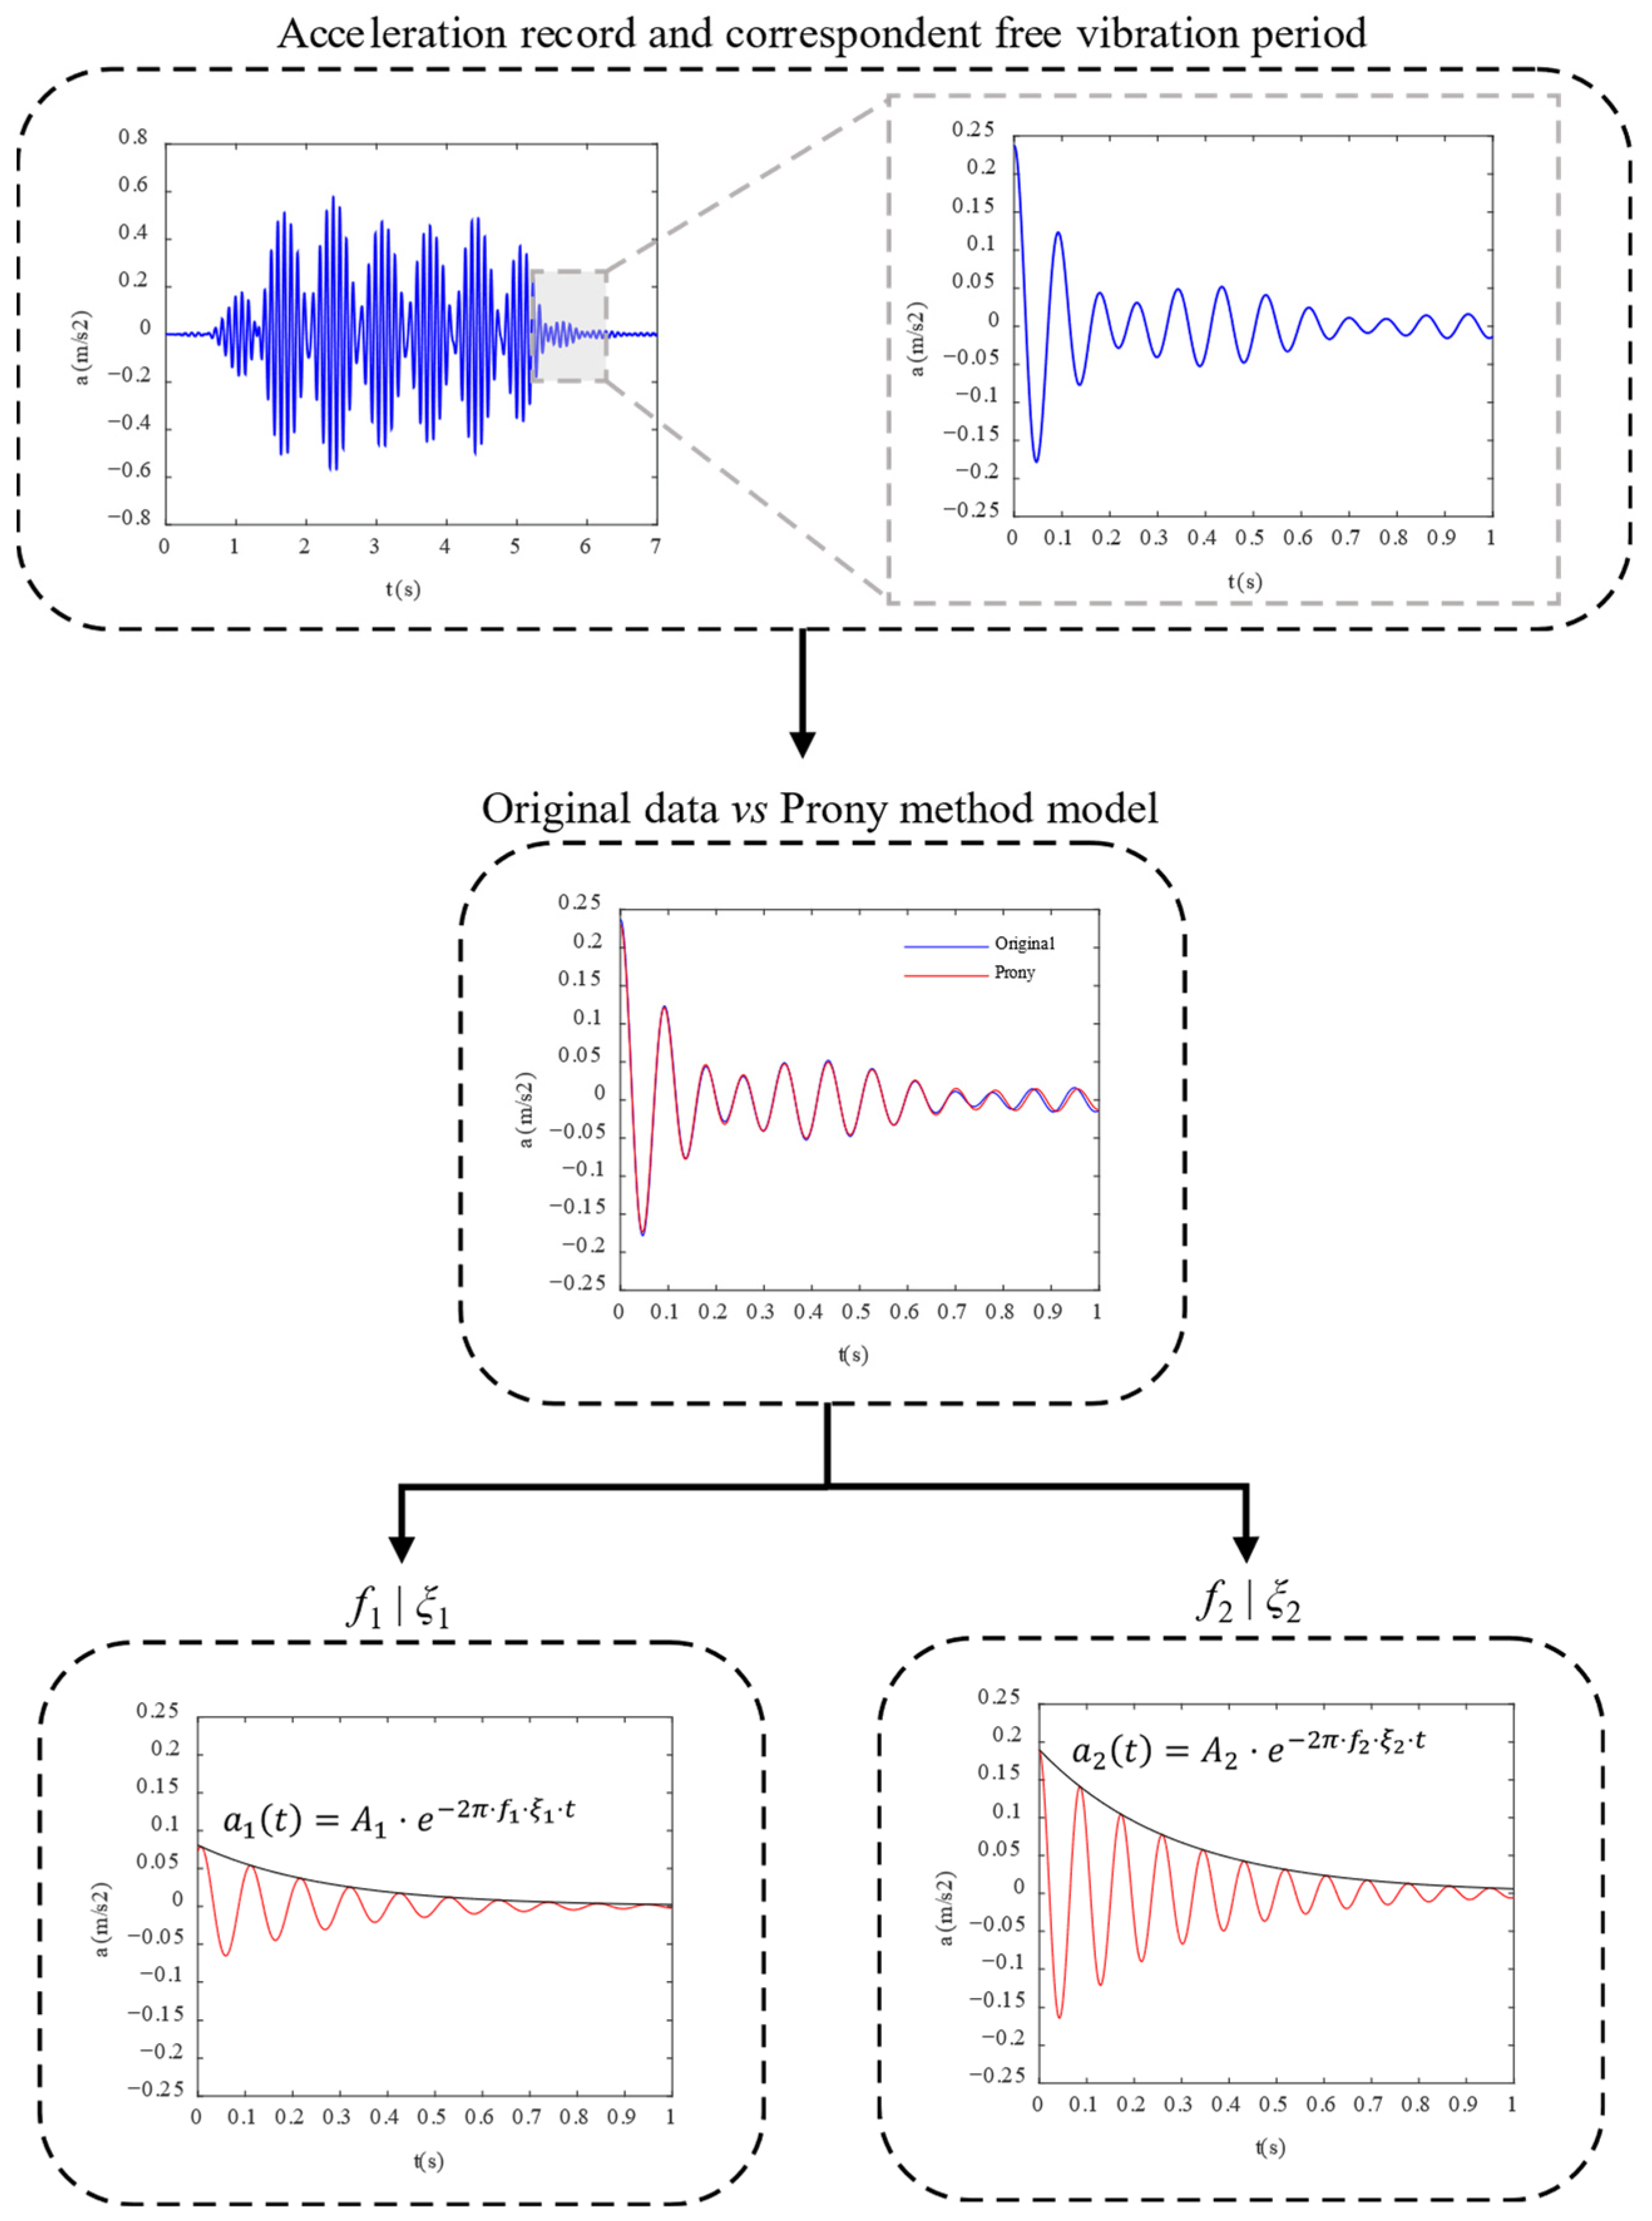
Figure 1. Methodology for damping coefficients estimation using the Prony method.
Applsci 13 02636 g001
Figure 2. Numerical model of the 11.50 m span bridge used for the sensibility analysis: (a) numerical model, (b) first, (c) second, and (d) third modes of vibration.
Applsci 13 02636 g002
Figure 3. Influence line corresponding to the midspan displacement: bridge with (a) 7.00 m, (b) 11.00 m, (c) 11.50 m, and (d) 23.50 m span.
Applsci 13 02636 g003
Figure 4. Receptance test simulated numerically: (a) impact load and (b) impact locations.
Applsci 13 02636 g004
Figure 5. Time history of the midspan displacement: bridge with (a) 7.00 m, (b) 11.00 m, (c) 11.50 m, and (d) 23.50 m span.
Applsci 13 02636 g005
Figure 6. Receptance functions corresponding to the midspan displacement: bridge with (a) 7.00 m, (b) 11.00 m, (c) 11.50 m, and (d) 23.50 m span.
Applsci 13 02636 g006aApplsci 13 02636 g006b
Figure 7. Cascalheira bridge: (a) numerical model, (b) first vibration mode, (c) second vibration mode, and (d) Rayleigh damping curve applied for this bridge.
Applsci 13 02636 g007
Figure 8. Vertical irregularities used in the dynamic analyses: (a) left rail, (b) right rail.
Applsci 13 02636 g008
Figure 9. Results for the Alfa Pendular train for a speed of 135 km/h and irregularity September 2019: (a) original record, (b) original record and Prony estimates along the LD exponential, (c) FFT for the free vibration records, and (d) sinusoids that compose the main Prony record.
Applsci 13 02636 g009
Figure 10. Results for the Alfa Pendular train for speed of 135 km/h and irregularity October 2020: (a) original record, (b) original record and Prony estimates along LD exponential, (c) FFT for the free vibration records, and (d) sinusoid that compose the main Prony record.
Applsci 13 02636 g010
Figure 11. Location of the tested railway bridges in Portugal.
Applsci 13 02636 g011
Figure 12. Cross sections and views of the decks of the Braço do Cortiço (a,b), Vale da Negra (c,d) and Cascalheira (e,f) underpasses and cross section and view of the first span of the Canelas bridge (g,h).
Applsci 13 02636 g012aApplsci 13 02636 g012b
Figure 13. Ambient vibration test typical layout with a detail of the accelerometer PCB 393B12.
Applsci 13 02636 g013
Figure 14. Enhanced Frequency Domain Decomposition method (EFDD) curves: average normalized singular values of the spectral density matrices.
Applsci 13 02636 g014
Figure 15. Tests under railway traffic typical layouts: (a) accelerometers with a detail of the PCB 393A03; (b) optical sensors layout with a detail of the sensor (left) and their locations in the tracks (right).
Applsci 13 02636 g015aApplsci 13 02636 g015b
Figure 16. Damping coefficient estimates based on the Prony method for the four filler-beam bridges as a function of the maximum acceleration for the eigenfrequencies.
Applsci 13 02636 g016
Figure 17. Acceleration records for those in which the damping coefficient values were calculated in Figure 16: (a) Canelas, (b) Cascalheira, (c) Vale da Negra, (d) Braço do Cortiço.
Applsci 13 02636 g017
Figure 18. Damping coefficient values in the function of the bridge span length (red) and the comparison with the ERRI D214 database [1] and the lower limit for damping coefficients for filler-beam bridges from the EN1991-2 [2].
Applsci 13 02636 g018
Table 1. Main parameters used in the bridges’ numerical models.
Span length L (m)7.011.011.523.5
Mass of the bridge mL (t/m)16.5117.6216.8617.99
Concrete elasticity modulus Ec (GPa)36.1036.1036.1036.10
Moment of inertia I (m4)0.1960.2940.2800.499
Table 2. Numerical modal frequencies of the four analysed bridges.
Span length L (m)7.011.011.523.5
First frequency f1 (Hz)20.039.498.612.19
Second frequency f1 (Hz)53.4231.7629.348.22
Third frequency f1 (Hz)84.3356.6053.3517.58
Table 3. Results from the application of the Prony method for validation of the methodology.
v (km/h)Irregularityf1 (Hz)ξ1 (%)f2 (Hz)ξ2 (%)
135February 201810.662.1411.982.12
135September 201910.662.1411.982.12
135July 2020--11.982.13
135October 2020--11.982.12
165February 2018--11.982.13
165September 201910.662.1211.982.13
165July 202010.662.1311.982.11
165October 202010.662.1311.982.12
f 1 ¯ = 10.66 ξ 1 ¯ = 2.13 f 2 ¯ = 11.98 ξ 2 ¯ = 2.12
Table 4. Overview of the filler-beam bridge characteristics.
No.NameNo. of SpansL (m)No. of TracksMax. Speed (km/h)
1Braço do Cortiço underpass17.022160
2Vale da Negra underpass17.102140
3Cascalheira underpass110.922160
4Canelas bridge66 × 12.002170
Table 5. Results from the ambient vibration tests.
BridgeFirst ModeSecond ModeThird Mode
Braço do Cortiço
(L = 7.02 m)
Applsci 13 02636 i001
f = 18.01 Hz
ξ = 1.13%
Applsci 13 02636 i002
f = 23.65 Hz
ξ = 0.75%
Applsci 13 02636 i003
f = 41.65 Hz
ξ = 1.36%
Vale da Negra
(L = 7.10 m)
Applsci 13 02636 i004f = 15.24 Hz
ξ = 2.12%
Applsci 13 02636 i005f = 18.56 Hz
ξ = 1.26%
Cascalheira
(L = 11.10 m)
Applsci 13 02636 i006
f = 9.50 Hz
ξ = 1.02%
Applsci 13 02636 i007
f = 11.82 Hz
ξ = 0.60%
Canelas
(L = 6 × 12 m)
Applsci 13 02636 i008
f = 8.70 Hz
ξ = 1.90%
Applsci 13 02636 i009
f = 9.80 Hz
ξ = 1.80%
Applsci 13 02636 i010
f = 14.90 Hz
ξ = 1.90%
Disclaimer/Publisher’s Note: The statements, opinions and data contained in all publications are solely those of the individual author(s) and contributor(s) and not of MDPI and/or the editor(s). MDPI and/or the editor(s) disclaim responsibility for any injury to people or property resulting from any ideas, methods, instructions or products referred to in the content.