Article

Improved Image Quality Assessment by Utilizing Pre-Trained Architecture Features with Unified Learning Mechanism

Electronics and Telecommunications Research Institute (ETRI), Gwangju 61012, Republic of Korea
Appl. Sci. 2023, 13(4), 2682; https://doi.org/10.3390/app13042682
Submission received: 16 January 2023 / Revised: 6 February 2023 / Accepted: 13 February 2023 / Published: 19 February 2023

Abstract

:
The purpose of the no-reference image quality assessment (NR-IQA) is to measure perceived image quality based on subjective judgments; however, due to the lack of a clean reference image, this is a complicated and unresolved challenge. Massive new IQA datasets have facilitated the creation of deep learning-based image quality measurements. We present a unique model to handle the NR-IQA challenge in this research by employing a hybrid strategy that leverages from pre-trained CNN model and the unified learning mechanism that extracts both local and non-local characteristics from the input patch. The deep analysis of the proposed framework shows that the model uses features and a mechanism that improves the monotonicity relationship between objective and subjective ratings. The intermediary goal was mapped to a quality score using a regression architecture. To extract various feature maps, a deep architecture with an adaptive receptive field was used. Analyses of this biggest NR-IQA benchmark datasets demonstrate that the suggested technique outperforms current state-of-the-art NR-IQA measures.

1. Introduction

Various types of multimedia content have become an integral part of consumers’ daily lives due to such an enormous rise in technology. Multiple distortions can be induced during the pipeline of multimedia generation to the utilization phase. Consequently, the constraints of technology degrade digital images. Social media content and captured images of natural scenes are both among the widely utilized content. The pipeline involves acquiring and processing the images, along with compressing and transmitting, and the final step involves the storage of digital images. This flow is induced with various types of distortions which consequently affect the quality of images and other multimedia content [1]. The visual quality of digital images deteriorates due to multiple effects of distortion, which is sub-categorized into three types, i.e., various distortions grouped can reduce the image quality; a unique single distortion can degrade the image and a scenario where the existing distortion is unidentified can occur in the images which are captured by imaging cameras [2]. The optimum quality of multimedia content is a key aspect for measuring user satisfaction [3]. The high utilization of social media content and images has given valuable significance to image quality assessment (IQA) [4].
The assessment of image quality is subdivided into two broader classes—objective IQA and subjective IQA. Subjective IQA deduces the quality of distorted images based on the observations of humans. The reason behind this is that humans are the end users of multimedia content and images. Due to this reason, the subjective IQA is set as a milestone in assessing image quality. It is considered a tiresome and time-consuming task for evaluating image quality. Other than that, human prejudice can affect the image quality evaluation process [5]. Its counterpart, Objective IQA, assesses the image quality based on mathematical models and evaluation metrics. Objective IQA is further categorized into full-reference-IQA (FR-IQA), reduced-reference-IQA (RR-IQA) and no-reference-IQA (NR-IQA), also termed IQA (BIQA) [6]. When analyzing the quality of a distorted picture in FR-IQA, a reference image is used. A reference image is a distortion-free or pristine version of a distorted image. While evaluating picture quality with RR-IQA, only specific information about the pristine image is accessible. In NR-IQA, no information about the immaculate image is used to determine the quality of the damaged image [7,8].
A method termed as region of interest or as visual saliency can be deployed to determine the locations or regions in an image that are more prominent for human eyes. Visual saliency establishes which regions of a picture draw the observer’s attention. Image quality evaluation and visual saliency go hand in hand, since a distortion in an image affects the saliency map. Image quality assessment and visual saliency go hand in hand as the saliency map gets affected if there is a distortion present in an image [9]. It can be deployed to obtain the quality of an ROI in an image, consequently determining the significance of a region of an image in patch-based IQA approaches [10]. A distortion occurring in an ROI in an image will be more prominent and attractive to observers; this base theory illustrates that visual saliency is a key aspect of IQA. IQA metrics should incorporate visual saliency as a prominent metric for evaluating image quality as the entire quality of the image can be depicted by only the perceived image quality of the region of interest in an image [11].
Traditional blind image quality assessment approaches were designed for specific distortions by embedding the information about the distortions to evaluate image quality [12,13,14,15]. More recent approaches have been designed based on the content of the images, i.e., images of natural scenes. Methods such as natural scene statistics (NSS)-based approaches assess the image quality irrespective of the type of distortion present in an image [16]. A more recent development for image quality assessment is the deep BIQA methods. Unlike previous methods they do not rely on handcrafted features to determine the quality of an image by capturing vital information from an image. Recently, the advancements in deep learning techniques have allowed the solving of many research problems such as image segmentation [17,18,19], problems associated with bio-informatics [20,21] and others [22]. Deep BIQA methods employ deep neural network (DNN) which is capable of extracting features in more depth than traditional BIQA approaches [23]. Various BIQA methods deploying VS along with machine learning methods are utilized to obtain image quality. A deep BIQA method that uses a convolutional neural network to apply VS to the images to extract the specific regions in an image and evaluates their quality to compute the quality of the entire image [24]. There is a lack of effective BIQA methods which deploy deep neural networks to evaluate the quality of images which includes the assessment of screen content and natural scene images and real-life images captured by digital imaging equipment, and images are embedded with synthetic type distortions [13].
To solve the complexity of the learning mechanism of NR-IQA, we have proposed using spinal-net on the feature maps attained using pre-trained architecture. The spinal-net learning mechanism improves the monotonicity relationship between objective and subjective ratings. It is also important that the feature maps are highly efficient and have high-quality learning. Therefore, a deep architecture with an adaptive receptive field (Inception-ResNet-V2) is used for the purpose.

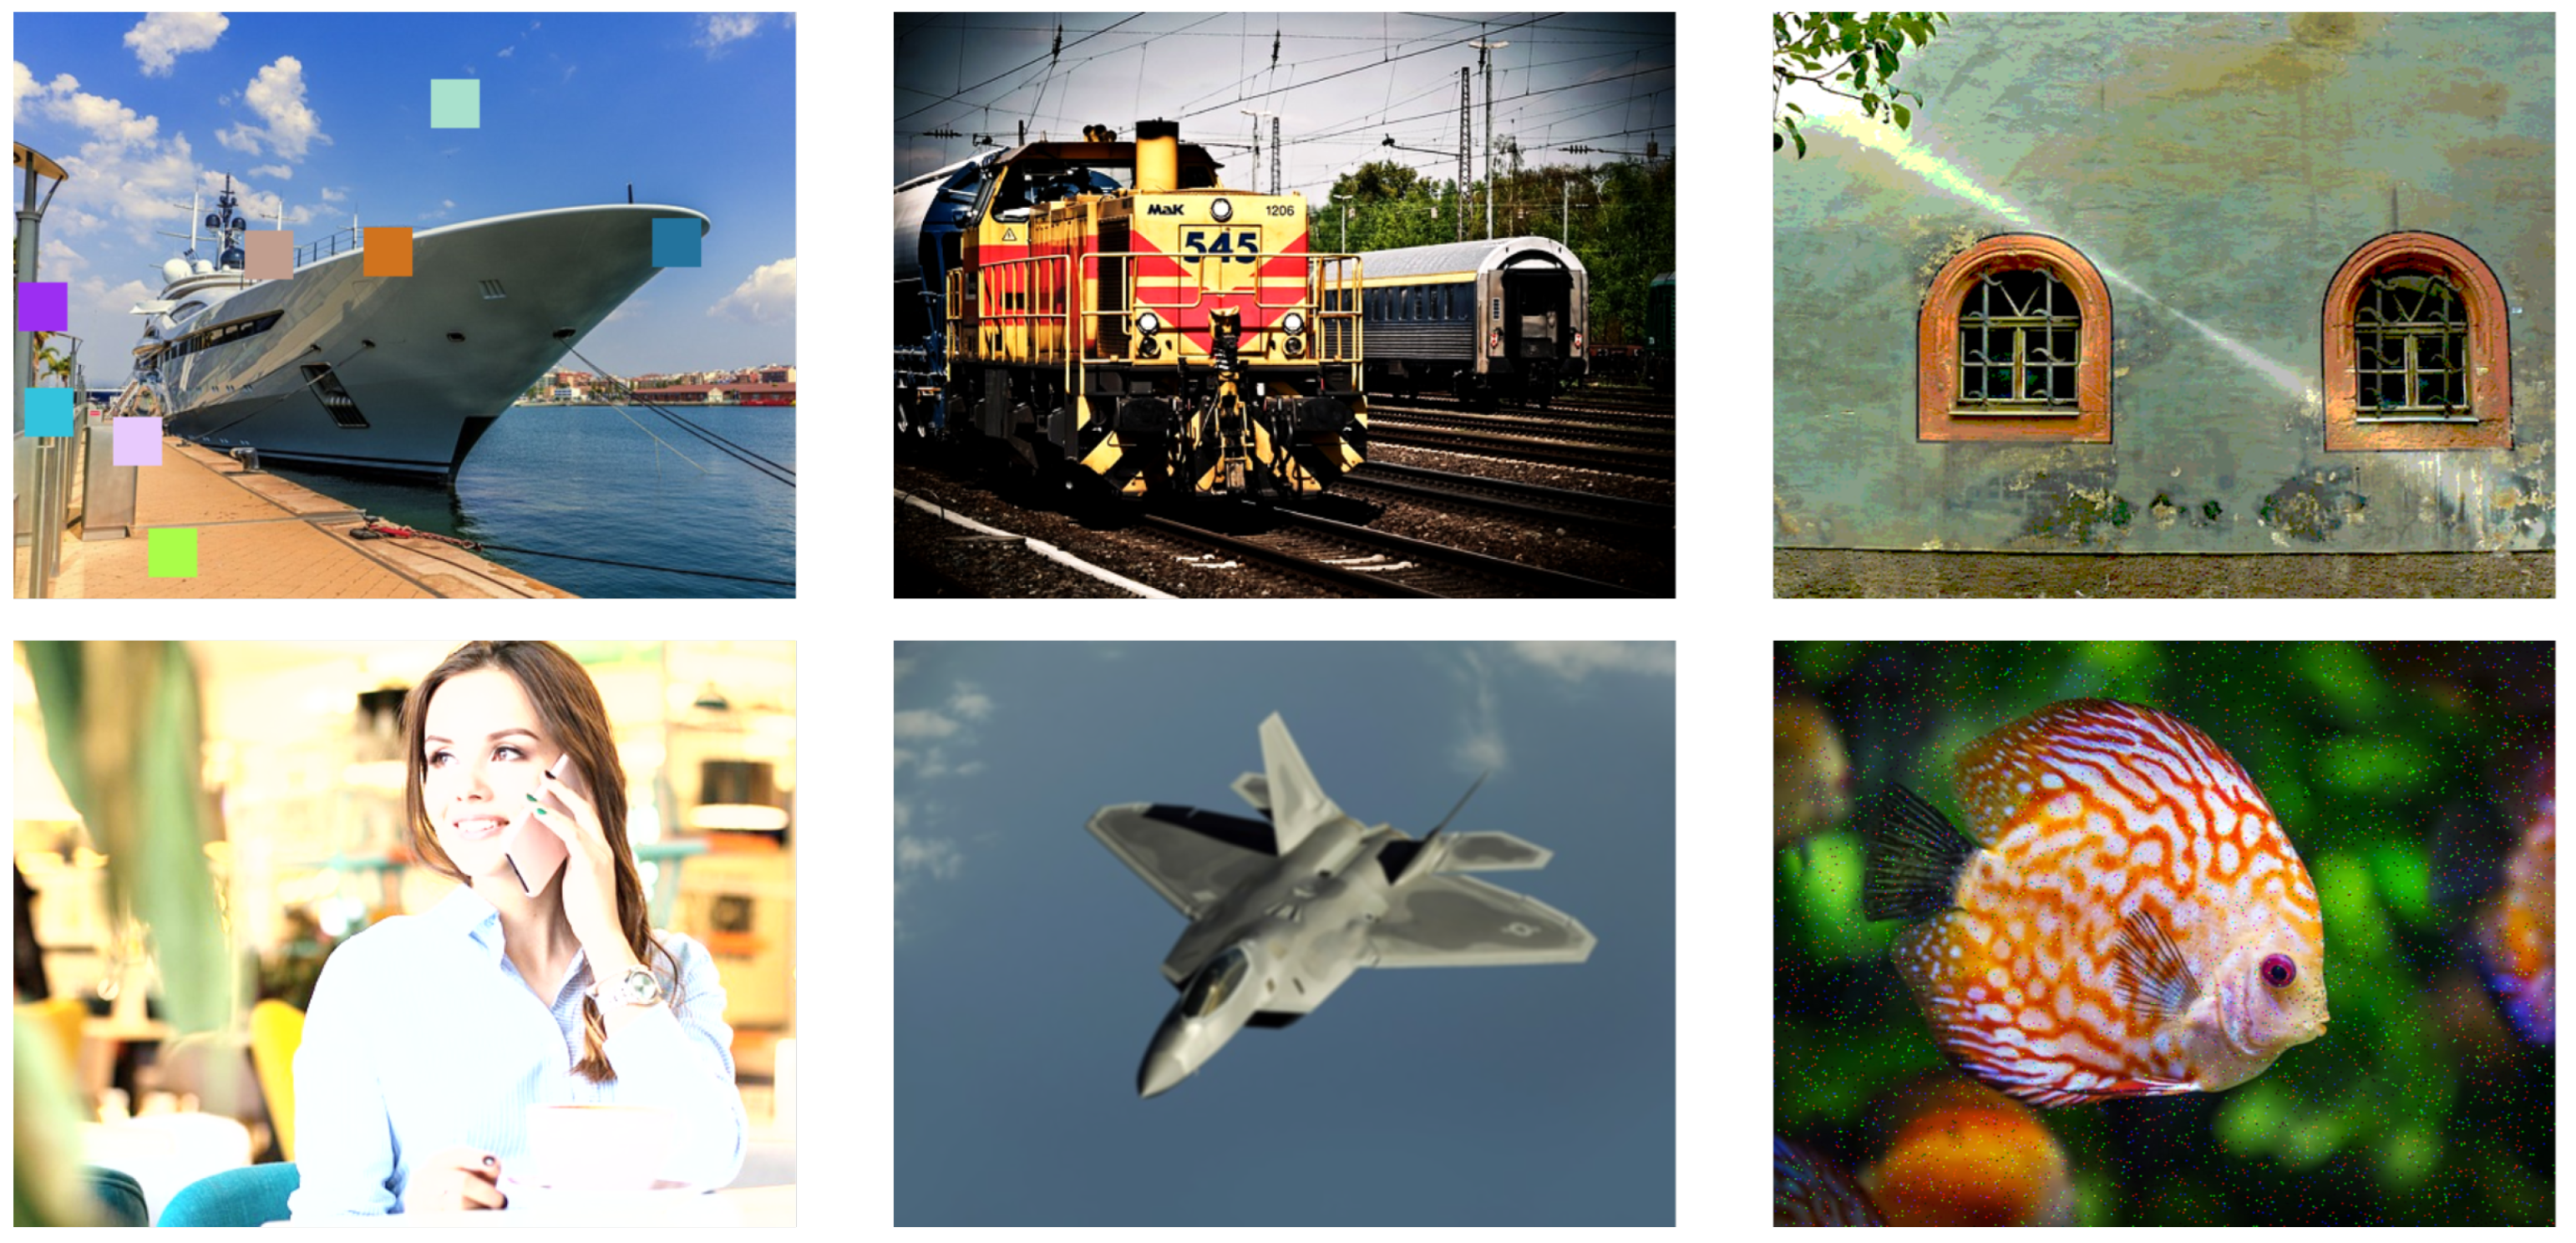
2. KADID-10k Dataset

The creation and evaluation of the objective image quality assessment IQA techniques necessitate the use of a variety of standard datasets including distorted pictures. The field of IQA is emerging with a new research direction, which is utilizing deep learning in IQA research. Consequently, the limited quantity of distorted images available in various datasets acts as a bottleneck for DL-based IQA methods [25]. The IQA methods based on deep convolutional neural networks require an enormous amount of data for the training phase. KADID-10k fills this gap, as it is an artificially distorted database consisting of a large number of distorted images with thrice the size as compared to the TID2013 database [26]. A total of 81 pristine images and 25 distortions in five levels are introduced in the database constituting a large sum of 10,125 images. Figure 1 shows six sample images belonging to different distortions categorised in 25 different distortions adopted to prepare the dataset. To obtain dependable degradation ratings for each distorted image, a total of 2209 enlisted people carried out crowd-sourcing.
The pristine images were accumulated from the Pixabay website. It is accessed globally for sharing photos and videos. The images were released under a free to edit and redistribution license. To check the quality of the pristine images, for each image, 20 independent Pixabay users’ votes were utilized, and they voted to accept or decline the image based on its quality. This is a clear indication that the images in use are in pristine condition based on the quality rating process of Pixabay. A total of 654,706 images were collected with a resolution higher than 1500 × 1200; further, all the images were brought to the same resolution, as in the TID2013 dataset, which is 512 × 384 for each image. A random selection of 81 pristine images was carried out for their utilization in making the KADID-10k database. Twenty-five various types of distortions were induced artificially and distorted images were grouped under the categories of blur-degraded images, spatial degradations, noise-related distortions, brightness changes in images, compression distortions, sharpness and contrast-related distortions [27].

3. Proposed Architecture for NR-IQA

Figure 2 depicts the suggested architecture for predicting the quality score of distorted images. With larger datasets, it is viable to use transfer learning, which involves fine-tuning pre-trained models using IQA datasets. The suggested architecture comprises a pre-trained network, namely Inception-RenNet-V2, which holds an adaptive receptive field that helps to generate better feature maps. This enables the removal of the greatest number of outliers from the feature vector that will be used by the unified learning mechanism, namely the spinal-net. The deformed pictures are influenced by noise, which mostly affects high-frequency areas because low-level characteristics are more useful for dealing with local distortions while elevated features are more representative of global abnormalities. Therefore, the selection of Inception-ResNet-V2 is a better choice.
The Inception-ResNet-V2 and the spinal network employed in the proposed framework are described in depth below.

3.1. Spinal Network

A spinal network is an artificial neural network with a structural architecture inspired by the human spinal cord, thus its name, SpinalNet [28]. The inputs are provided step by step and over regular intervals, just as with the architecture of the spinal cord. Two factors—local and global outputs—are computed, i.e., every layer in the network generates a local output and the amplified version of inputs is forwarded to the global output. Training data are utilized to perform configuration of the weights of the artificial neural network [29].
The traditional SpinalNet divides each layer of the neural network (NN) into three parts: input, intermediate, and output. Each input split of the NN layers receives a piece of the input data. Except for the intermediate split of the first layer of NN, all intermediate splits acquire two components [30]. The components are the outcomes of the preceding intermediary layer split and the outcome of the current layer’s existing input split. The weighted outputs of all the intermediate splits are fed into the output split of each layer where they are added together. A total of two neurons exist in each hidden layer of the intermediate splits.The output v n of a neuron n in the hidden layer is:
v n = σ ( i = 1 P ( y n i ) u i + R n k n l ) ,
where σ is the activation function. P is the number of neurons, y n i is the weight of a neuron, u i is the input of a neuron and R n k n l is the threshold value of neurons.
The architect can change the number of neurons that exist in a hidden layer. However, because of the computational expense of multiplications, both the number of intermediate layer neurons and the number of inputs sent to each layer are reduced to a minimum [31]. The activation function utilized can be a sigmoid function as:
σ ( t ) = 1 1 + exp ( t ) .
Since the SpinalNet takes the inputs repeatedly and at a gradual pace, all the input features will have an impact on the output. A nonlinear activation function, such as Relu, sigmoid or softmax, can be deployed in the intermediate splits of each layer. A linear activation function is deployed at the output layer, which is basically an identity or no activation function where the input is equivalent to the activation [32]. Relu activation function is illustrated as:
E ( m ) = m a x ( 0 , m ) .
The equivalence is drawn between the SpinalNet and a traditional neural network by comparing the two network architectures. A simplified SpinalNet consisting of four hidden layers where each layer is comprised of two neurons, is equivalent to a traditional neural network with only a single hidden layer where four neurons exist [33].

3.2. Inception-ResNet-V2

Millions of images were used in the training phase of the Inception-ResNet-v2 architecture, where these images belong to the imagenet dataset. The pre-trained network includes 164 neural network layers that are capable of categorizing images into 1000 classes, which also includes a desktop computer, computer, pen, and numerous animals. As result, the network has learned rich feature representations for a wide range of images. The architecture takes an input image of size 299 × 299 and outputs a list of predicted confidence scores as output.
If the number of filters was more than 1000, the residual variation became unstable, and the architecture simply “died” earlier in the learning, indicating that the final layer before the pooling layer began to generate only zeros within a few hundreds of thousands of repetitions. This could not be prevented by slowing down the learning rate or adding another batch normalization layer to this layer. Downsizing the residuals prior to adding them to the preceding level activation seems to stabilize the training, and that is being adopted in Inception-ResNet-V2. Scale factors ranging from 0.1 to 0.3 were used to scale the residuals. It is formed by fusing the Inception framework with the Residual linkage. In the Inception-Resnet block, several comprehensive network filters are blended with feedback links. The addition of feedback connections not only overcomes the degradation problem created by representations, but it also reduces training time.

4. Results & Discussion

4.1. Evaluation Details

The dataset was partitioned into train, test, and validation datasets at random. Sixty percent of the dataset was utilized to train, with the remainder shared evenly between test and validation samples. Furthermore, it was ensured that there would not be any overlap between the datasets. To train and assess the effectiveness of the suggested framework, a total of ten repetitions were performed. The pre-trained Inception-ResNet-V2 model was utilized, and the model was fine-tuned, utilizing the training dataset every time.
The model was trained for 100 epochs with a batch size of eight for the training, validation and testing process. Mean square error was used as a loss function, while the Adam optimizer with a learning rate of 1 × 10 5 was used as an optimizer.

4.2. Figure of Merits

Performance metrics are availed to ascertain the performance of a given image quality assessment IQA method. The research in the sphere of IQA mainly deploys three benchmark metrics, i.e., Spearman rank order correlation coefficient (SROCC), Kendall rank order correlation coefficient (KROCC) and Pearson linear correlation coefficient (PLCC). PLCC mainly accounts for the linear relationship which exists among variables that are continuous in nature [34]. It can be expressed as:
P L C C = i = 1 I ( n i n ^ ) ( m i m ^ ) i = 1 I ( n i n ^ ) i = 1 I ( m i m ^ ) ,
where n and m are sampling points gathered from the predicted and ideal score values, I is the total number of images and n ^ and m ^ are utilized as the means of two samples.
On the other hand, SROCC describes the monotonic relationship between two variables and it is expressed in mathematical terms as:
S R O C C = 1 6 i 1 I ( a i q i ) 2 I ( I 2 1 ) .
I is the total number of images, while q i and a i are the predicted and actual quality values.
KROCC is utilized to find out the ordinal relationship among two variables and it is illustrated as:
K R O C C = U Y ( s [ 0 ] s 1 ) ( s 0 s 2 )
s 0 = s ( s 1 ) 2
s 1 = x v x ( v x 1 ) 2
s 2 = l h l ( h l 1 ) 2 .
In the above equations, U and Y illustrates the number of concordant and discordant pairs, respectively. v x represents the samples from the x group and h l represents the samples which combine with the second quantity from the l group.

4.3. Performance Comparison

Image degradation variety and content variance make NR-IQA a difficult task. The suggested model may express deep features for quality information by combining the dual frameworks created by the deep feature extractor and crucial learning mechanism. Table 1 compares the proposed framework to current state-of-the-art approaches. As seen in the data, the suggested scheme performed the best. The suggested method has an SROCC of 0.759, a PLCC of 0.777, and a KROCC of 0.5873. The conceptual approach improved SROCC, PLCC, and KROCC by 0.028, 0.043, and 0.0413, respectively. The new framework’s outstanding performance demonstrates that adopting a spinal network for NR-IQA evaluation is advantageous. It aids the network architecture in learning the necessary information to forecast image quality. Compared to other pre-trained networks, the InceptionResNetV2-based model performed well. As a result, we used InceptionResNetV2 as the baseline model, along with a spinal network. Further, Figure 3 shows the visual comparison of the proposed architecture with existing techniques for image quality assessment.
The better performance of the spinal network is due to its unified learning mechanism. In a spinal network, the inputs are provided periodically and gradually to the neural network, just as with the biological configuration of the human spinal cord. Two variables, which are local and global outputs, are computed as every layer in the network generates a local output consequently the modulated version of inputs is, in turn, readdressed to the global output. Training data are utilized to perform a configuration of the network parameters, i.e., weights of the artificial neural network. The neural network is split into three groups—input split, intermediate and output split. A chunk of the input data is provided to each input split of the subsequent NN layers. Two components are fed into all the intermediate splits except the intermediate split of the first layer of the spinal network. The outputs of the existing input split of the current layer and the output of the previous intermediate layer split are both classified as network components. The weighted outputs of all the intermediate splits are combined as they are given to the output split of each subsequent layer in the neural network.
The radar graph is used for a competitive analysis between proposed and existing techniques. Figure 4 shows the radar graph for comparison. The proposed architecture was able to show better spikes than existing techniques. The spinal network was able to give meaningful representation to the extracted feature maps.
Figure 5 depicts the scatter graph between the expected and the actual quality scores. As can be seen in the scatter figure, there are a few outliers. The scatter plot approaches the perfect inclined line quite closely. This illustrates that the spinal network is capable of learning the significant features and predicting based on those features, improving prediction accuracy by ignoring undesired features that contribute to incorrect predictions.

5. Conclusions

Image quality evaluation is crucial and required for image-driven intelligent applications. A huge number of repetitious and low-quality images not only raises the cost of image collection and transmission but also renders job performance ineffective. Moreover, it affects the end-user experience in the real world. The reliability of the intermediary maps was found to be significantly dependent on the strength of the algorithms used to create the labels, and accurate labels could not be formed while training on real datasets without reference pictures. In this paper, we provide a novel approach for dealing with the NR-IQA issue by combining a pre-trained CNN model with a unified learning process that extracts both local and non-local properties from the input patch. An in-depth examination of the suggested framework reveals that the model employs characteristics and a mechanism that enhances the monotonicity connection between objective and subjective evaluations. The proposed framework has performed better than the existing techniques. In the future, we intend to further explore the spinal network with some customized CNN-based architectures.

Funding

This research received no external funding.

Institutional Review Board Statement

Not applicable.

Informed Consent Statement

Not applicable.

Data Availability Statement

Not applicable.

Conflicts of Interest

The author declares no conflict of interest.

References

  1. Wu, Q.; Wang, Z.; Li, H. A highly efficient method for blind image quality assessment. In Proceedings of the 2015 IEEE International Conference on Image Processing (ICIP), Quebec City, QC, Canada, 27–30 September 2015; pp. 339–343. [Google Scholar]
  2. Liu, D.; Wang, Y.; Chen, Z. Joint foveation-depth just-noticeable-difference model for virtual reality environment. J. Vis. Commun. Image Represent. 2018, 56, 73–82. [Google Scholar] [CrossRef]
  3. Wu, Y.; Liu, Y.; Gong, M.; Gong, P.; Li, H.; Tang, Z.; Miao, Q.; Ma, W. Multi-view point cloud registration based on evolutionary multitasking with bi-channel knowledge sharing mechanism. IEEE Trans. Emerg. Top. Comput. Intell. 2022, 5, 191–204. [Google Scholar] [CrossRef]
  4. Zhai, G.; Min, X. Perceptual image quality assessment: A survey. Sci. China Inf. Sci. 2020, 63, 1–52. [Google Scholar]
  5. Mantiuk, R.K.; Tomaszewska, A.; Mantiuk, R. Comparison of four subjective methods for image quality assessment. In Proceedings of the Computer Graphics Forum; Wiley Online Library: New York, NY, USA, 2012; Volume 31, pp. 2478–2491. [Google Scholar]
  6. Nizami, I.F.; Majid, M.; Khurshid, K. New feature selection algorithms for no-reference image quality assessment. Appl. Intell. 2018, 48, 3482–3501. [Google Scholar] [CrossRef]
  7. Ding, K.; Ma, K.; Wang, S.; Simoncelli, E.P. Comparison of full-reference image quality models for optimization of image processing systems. Int. J. Comput. Vis. 2021, 129, 1258–1281. [Google Scholar] [CrossRef]
  8. Ma, J.; Wu, J.; Li, L.; Dong, W.; Xie, X.; Shi, G.; Lin, W. Blind image quality assessment with active inference. IEEE Trans. Image Process. 2021, 30, 3650–3663. [Google Scholar] [CrossRef]
  9. Deng, J.; Chen, H.; Yuan, Z.; Gu, G.; Xu, S.; Weng, S.; Wang, H. An enhanced image quality assessment by synergizing superpixels and visual saliency. J. Vis. Commun. Image Represent. 2022, 88, 103610. [Google Scholar]
  10. Chang, H.W.; Du, C.Y.; Bi, X.D.; Wang, M.H. Color image quality evaluation based on visual saliency and gradient information. In Proceedings of the 2021 7th International Symposium on System and Software Reliability (ISSSR), Chongqing, China, 23–24 September 2021; pp. 64–72. [Google Scholar]
  11. Chang, H.W.; Bi, X.D.; Du, C.Y.; Mao, C.W.; Wang, M.H. Image Quality Evaluation Based on Gradient, Visual Saliency, and Color Information. Int. J. Digit. Multimed. Broadcast. 2022, 2022, 7540810. [Google Scholar] [CrossRef]
  12. Shahid, M.; Rossholm, A.; Lövström, B.; Zepernick, H.J. No-reference image and video quality assessment: A classification and review of recent approaches. EURASIP J. Image Video Process. 2014, 2014, 1–32. [Google Scholar]
  13. Nizami, I.F.; Waqar, A.; Majid, M. Impact of visual saliency on multi-distorted blind image quality assessment using deep neural architecture. Multimed. Tools Appl. 2022, 81, 25283–25300. [Google Scholar] [CrossRef]
  14. Nizami, I.F.; Majid, M.; Anwar, S.M. Natural scene statistics model independent no-reference image quality assessment using patch based discrete cosine transform. Multimed. Tools Appl. 2020, 79, 26285–26304. [Google Scholar]
  15. Nizami, I.F.; Majid, M.; Anwar, S.M.; Nasim, A.; Khurshid, K. No-reference image quality assessment using bag-of-features with feature selection. Multimed. Tools Appl. 2020, 79, 7811–7836. [Google Scholar] [CrossRef]
  16. Moorthy, A.K.; Bovik, A.C. Blind image quality assessment: From natural scene statistics to perceptual quality. IEEE Trans. Image Process. 2011, 20, 3350–3364. [Google Scholar] [CrossRef]
  17. Rehman, M.U.; Ryu, J.; Nizami, I.F.; Chong, K.T. RAAGR2-Net: A brain tumor segmentation network using parallel processing of multiple spatial frames. Comput. Biol. Med. 2022, 2022, 106426. [Google Scholar] [CrossRef]
  18. Rehman, M.U.; Cho, S.; Kim, J.; Chong, K.T. Brainseg-net: Brain tumor mr image segmentation via enhanced encoder–decoder network. Diagnostics 2021, 11, 169. [Google Scholar] [CrossRef]
  19. Rehman, M.U.; Cho, S.; Kim, J.H.; Chong, K.T. Bu-net: Brain tumor segmentation using modified u-net architecture. Electronics 2020, 9, 2203. [Google Scholar] [CrossRef]
  20. Rehman, M.U.; Tayara, H.; Zou, Q.; Chong, K.T. i6mA-Caps: A CapsuleNet-based framework for identifying DNA N6-methyladenine sites. Bioinformatics 2022, 38, 3885–3891. [Google Scholar]
  21. Rehman, M.U.; Tayara, H.; Chong, K.T. DL-m6A: Identification of N6-methyladenosine Sites in Mammals using deep learning based on different encoding schemes. IEEE/ACM Trans. Comput. Biol. Bioinform. 2022. [Google Scholar] [CrossRef]
  22. Wu, Y.; Zhang, Y.; Fan, X.; Gong, M.; Miao, Q.; Ma, W. Inenet: Inliers estimation network with similarity learning for partial overlapping registration. IEEE Trans. Circuits Syst. Video Technol. 2022. [Google Scholar] [CrossRef]
  23. Gao, F.; Yu, J.; Zhu, S.; Huang, Q.; Tian, Q. Blind image quality prediction by exploiting multi-level deep representations. Pattern Recognit. 2018, 81, 432–442. [Google Scholar] [CrossRef]
  24. Jia, S.; Zhang, Y. Saliency-based deep convolutional neural network for no-reference image quality assessment. Multimed. Tools Appl. 2018, 77, 14859–14872. [Google Scholar] [CrossRef] [Green Version]
  25. Hosu, V.; Lin, H.; Sziranyi, T.; Saupe, D. KonIQ-10k: An ecologically valid database for deep learning of blind image quality assessment. IEEE Trans. Image Process. 2020, 29, 4041–4056. [Google Scholar] [CrossRef] [Green Version]
  26. Yan, C.; Teng, T.; Liu, Y.; Zhang, Y.; Wang, H.; Ji, X. Precise no-reference image quality evaluation based on distortion identification. ACM Trans. Multimed. Comput. Commun. Appl. (TOMM) 2021, 17, 1–21. [Google Scholar] [CrossRef]
  27. Lin, H.; Hosu, V.; Saupe, D. KADID-10k: A large-scale artificially distorted IQA database. In Proceedings of the 2019 Eleventh International Conference on Quality of Multimedia Experience (QoMEX), Berlin, Germany, 5–7 June 2019; pp. 1–3. [Google Scholar]
  28. Dipu Kabir, H.; Abdar, M.; Jafar Jalali, S.M.; Khosravi, A.; Atiya, A.F.; Nahavandi, S.; Srinivasan, D. SpinalNet: Deep Neural Network with Gradual Input. arXiv 2020, arXiv:2007.03347. [Google Scholar]
  29. Changfan, Z.; Xinliang, H.; Jing, H.; Jianhua, L.; Na, H. Defect classification model for high-speed train wheelset treads based on SimAM and SpinalNet. China Saf. Sci. J. 2022, 32, 38. [Google Scholar]
  30. Ahuja, M.K.; Sahil, S.; Spieker, H. Mistake-driven Image Classification with FastGAN and SpinalNet. 2021. Available online: https://openreview.net/forum?id=ChKNCDB0oYj (accessed on 21 November 2022).
  31. Abbas, Z.; Tayara, H.; to Chong, K. Spinenet-6ma: A novel deep learning tool for predicting dna n6-methyladenine sites in genomes. IEEE Access 2020, 8, 201450–201457. [Google Scholar] [CrossRef]
  32. Shaiakhmetov, D.; Mekuria, R.R.; Isaev, R.; Unsal, F. Morphological Classification of Galaxies Using SpinalNet. In Proceedings of the 2021 16th International Conference on Electronics Computer and Computation (ICECCO), Kaskelen, Kazakhstan, 25–26 November 2021; pp. 1–5. [Google Scholar]
  33. Abbas, Z.; Tayara, H.; Chong, K.T. ZayyuNet–A unified deep learning model for the identification of epigenetic modifications using raw genomic sequences. IEEE/ACM Trans. Comput. Biol. Bioinform. 2021, 19, 2533–2544. [Google Scholar] [CrossRef]
  34. Varga, D. A Human Visual System Inspired No-Reference Image Quality Assessment Method Based on Local Feature Descriptors. Sensors 2022, 22, 6775. [Google Scholar] [CrossRef]
  35. Liu, L.; Liu, B.; Huang, H.; Bovik, A.C. No-reference image quality assessment based on spatial and spectral entropies. Signal Process. Image Commun. 2014, 29, 856–863. [Google Scholar] [CrossRef]
  36. Saad, M.A.; Bovik, A.C.; Charrier, C. Blind image quality assessment: A natural scene statistics approach in the DCT domain. IEEE Trans. Image Process. 2012, 21, 3339–3352. [Google Scholar] [CrossRef]
  37. Xu, J.; Ye, P.; Li, Q.; Du, H.; Liu, Y.; Doermann, D. Blind image quality assessment based on high order statistics aggregation. IEEE Trans. Image Process. 2016, 25, 4444–4457. [Google Scholar] [CrossRef]
  38. Mittal, A.; Moorthy, A.K.; Bovik, A.C. No-reference image quality assessment in the spatial domain. IEEE Trans. Image Process. 2012, 21, 4695–4708. [Google Scholar] [CrossRef]
  39. Moorthy, A.K.; Bovik, A.C. A two-step framework for constructing blind image quality indices. IEEE Signal Process. Lett. 2010, 17, 513–516. [Google Scholar] [CrossRef]
  40. Zhang, R.; Isola, P.; Efros, A.A.; Shechtman, E.; Wang, O. The unreasonable effectiveness of deep features as a perceptual metric. In Proceedings of the IEEE Conference on Computer Vision and Pattern Recognition, Salt Lake City, UT, USA, 18–22 June 2018; pp. 586–595. [Google Scholar]
  41. Ye, P.; Kumar, J.; Kang, L.; Doermann, D. Unsupervised feature learning framework for no-reference image quality assessment. In Proceedings of the 2012 IEEE Conference on Computer Vision and Pattern Recognition, Providence, RI, USA, 16–21 June 2012; pp. 1098–1105. [Google Scholar]
  42. Kang, L.; Ye, P.; Li, Y.; Doermann, D. Convolutional neural networks for no-reference image quality assessment. In Proceedings of the IEEE Conference on Computer Vision and Pattern Recognition, Columbus, OH, USA, 24–27 June 2014; pp. 1733–1740. [Google Scholar]
  43. Bosse, S.; Maniry, D.; Wiegand, T.; Samek, W. A deep neural network for image quality assessment. In Proceedings of the 2016 IEEE International Conference on Image Processing (ICIP), Phoenix, AZ, USA, 25–28 September 2016; pp. 3773–3777. [Google Scholar]
Figure 1. Distorted Images from the KADID-10K dataset.
Applsci 13 02682 g001
Figure 2. Spinal-Net-based architecture for quality assessment of distorted images.
Applsci 13 02682 g002
Figure 3. Performance comparison.
Applsci 13 02682 g003
Figure 4. Radar Graph for Competitive Analysis.
Applsci 13 02682 g004
Figure 5. Comparative analysis between predicted and actual quality.
Applsci 13 02682 g005
Table 1. Performance evaluation of the suggested scheme in comparison to existing NR-IQA methodologies.
TechniqueSROCCPLCCKROCC
SSEQ [35]0.4240.4630.295
BLINDS-II [36]0.5270.5590.375
HOSA [37]0.6090.6530.438
BRISQUE [38]0.5190.5540.368
BIQI [39]0.4310.4600.229
DIVINE [16]0.4890.5320.341
LPIPS [40]0.7210.713-
CORNIA [41]0.5410.5800.384
CNN [42]0.6030.619-
BosICIP [43]0.6300.628-
InceptionResNetV2 [27]0.7310.7340.546
Proposed Architecture0.7590.7770.5873
Disclaimer/Publisher’s Note: The statements, opinions and data contained in all publications are solely those of the individual author(s) and contributor(s) and not of MDPI and/or the editor(s). MDPI and/or the editor(s) disclaim responsibility for any injury to people or property resulting from any ideas, methods, instructions or products referred to in the content.

