Abstract
In this study, 10–50% of porcelain tile polishing residue (PPR) was used as an additive or as partial replacement of cement in concrete. The cement consumption was kept constant by correcting the amount of sand for each mixture. Concrete workability (slump) was reduced by up to 88.72% when PPR replaced the cement by up to 30%, while it was reduced by only 4.10% when PPR was added to the concrete at the same levels. Compressive strength at 28 days increased up to 92.22% with 50% PPR as additive, reducing the equivalent emission of CO2 per m³ of concrete up to 38.18%. PPR incorporation reduced the water permeability of concrete by up to 30.70% and 17.54% when used in addition and in cement replacement, respectively. Overall, PPR as an additive up to 50% and in cement with substitution levels up to 10–40% presented themselves as viable solutions for developing more resistant and durable concretes than the reference mixture (without incorporation of PPR).
1. Introduction
The extensive production of Portland cement, which amounts to about 4.2 billion tons per year, leads to a significant carbon footprint that raises concerns in the cement industry. The main reason for this is the high levels of CO2 emissions produced during the manufacturing process, which result from the use of high temperatures (around 1450 °C) and the chemical decomposition of calcium carbonate used as raw material [1]. In this scenario, the use of alternative materials in cement replacement is continuously growing [2].
Porcelain tile polishing residue (PPR) is generated in the final polishing stage of porcelain tile manufacturing; PPR is a fine, white, and moist powder. It is estimated that Brazil alone generates about 60,000 tons of PPR every year [3,4]. The proper destination of this residue becomes an issue especially in the largest ceramic tiles producers in the world, such as China, Brazil, and Italy [5,6]. A medium-sized company in Brazil’s northeast region produces approximately 200 tons of waste per month [7]; a large company in the southern region generates approximately 1000 tons per week [2]. Thus, the PPR can also become a local issue. Currently, the main destination of PPR is disposal in landfills [5,8]. PPR is composed of silica (60–70%), alumina (15–20%), as well as magnesium (1–6%) from the abrasive used in the polishing process [7,8,9,10]. Although PPR comprises crystalline quartz, the presence of amorphous quartz has also been reported; this indicates its possible pozzolanic reactivity [8,9,11,12,13,14,15,16,17,18,19]. Further, PPR is used in concrete because no additional high energy is required for its comminution and sieving because its granulometry is suitable for use as a supplementary material in cementitious systems, with an average diameter of approximately 10 µm [7].
Previous publications reported the positive influence of PPR in concrete including: a filler effect [8,9,11,19,20]; a reduction of permeability and porosity [7,8,9,11,20] and, consequently, increased durability [8,9]; the discontinuous granulometry between PPR and cement which contributes to the reduction of porosity [9,12,17,19,21]; PPR enabling of a better bond between the paste and aggregate, thereby acting as an agent that can increase mortar cohesion [9]; pozzolanic activity, where lower amounts of calcium hydroxide and higher C-S-H were found in cementitious materials with PPR in relation to the reference (material without PPR) [17,19]; an increase in mechanical compressive strength at advanced ages [7,8,9,11,12,19,20]; reduction of autogenous shrinkage caused by slow reactions of pozzolanic activity [8,12].
In turn, increasing the residue content reduces the workability of the mixture in the fresh state [7,11,22]. The high surface area of PPR requires more water than cement or other cementitious mixture compounds to achieve a desirable workability [19]. Furthermore, irregular and angular shapes of PPR particles hinder the effect of rolling motion in concrete [19]. However, this loss of workability can be compensated for by increasing the superplasticizer (SP) content [3,6].
For cement hydration in the presence of PPR, the greater the cement replacement by PPR, the lower is the heat of hydration released [9,19] and the faster are the hydration kinetics [19,20] at early ages (i.e., 24–48 h). The presence of PPR promotes heterogeneous nucleation during cement hydration [8,9,19,20], which accelerates the cement hydration caused by fine particles of the waste [9]. However, the agglomerative (i.e., pozzolanic) activity of the PPR is slower than that of Portland cement, and it results in a lower heat release in the early ages.
As durability indicators, cementitious materials incorporating porcelain tile waste showed lower oxygen permeability [12] and lower chloride ion diffusion coefficients [12,23] in addition to a lower loss of mechanical strength when exposed to accelerated aging tests [12]. Cheng et al. [17] performed a carbonation test and observed that mixtures containing PPR increased the depth of carbonation caused by the pozzolanic action that consumed calcium hydroxide, which decreased the pH. Further, for sulfate resistance, some studies reported that cementitious materials with PPR presented higher resistance because of the pore structure [17,24].
This study aims to analyze the influence of incorporating PPR in concrete in terms of mechanical performance, durability, and global warming potential (GWP) from a new perspective, comparing the incorporation of PPR both as cement replacement and addition. The cement consumption was adjusted for evaluating the real action of PPR in concrete as both a partial cement replacement (supplementary cementitious material—SCM) and as an additive under constant cement consumption.
2. Experimental Program
2.1. Raw Materials
A high early strength Portland cement (PC), type CPV-ARI, which is equivalent to the ASTM type III cement, was used in this study. Table 1 summarizes the physical properties of the cement used. Figure 1 shows the particle size distribution (PSD) of the cement. More information on the cement used can be found in [2].

Table 1.
Physical properties of the PC and PPR used.

Figure 1.
Particle size distribution of the cement, PPR, and aggregates.
A slurry of PPR was collected from a ceramic tile manufacturing company in João Pessoa, Paraíba, Brazil. The slurry was dried in an oven for 24 h at 100 °C, ground in a ball mill for 3 h, and sieved through a 0.075 mm mesh. The PSD of the PPR is presented in Figure 1. Table 1 summarizes the physical properties of the PPR. The chemical characterization of PPR determined by X-ray fluorescence under N2 atmosphere using an EDX 720 (Shimadzu) is summarized in Table 2. The PPR comprises silica and aluminum oxides, which is consistent with the previous reports in the literature [25,26,27,28]. Further information on the PPR used can be found in Ref. [2].
Table 2.
Chemical composition of the PPR used.
The crystallographic analysis of PPR is illustrated in Figure 2. The XRD analysis was performed using a Bruker D8 Advance Davinci diffractometer with CuKα radiation, λ = 1.5418 Å, 40 kV/40 mA, from 10–70° (2θ) with 0.02 step every 0.5 s of reading time. The PPR features mullite, quartz, silicon carbide, and magnesium oxide, which are potential pozzolanas because the sum of SiO2 + Al2O3 + Fe2O3 = 84.53% ≥ 70%; further, the amount of SO3 and Na2O is less than or equal to 4% and 1.5%, respectively [29].

Figure 2.
XRD pattern of the PPR used.
Figure 3 shows the thermogravimetric analysis (TGA) results of the PPR. A BP Engenharia RB-300 thermobalance was used at a heating rate of 12.5 °C·min−1. Two ranges of mass loss were verified: (i) 30–200 °C, which corresponds to the evaporation of free water, and (ii) 200–600 °C, which corresponds to the decomposition of the organic matter probably originating from the storage of the residue.

Figure 3.
TGA curve of the PPR.
A polycarboxylic ether-based SP (commercial name GLENIUM 51, BASF) was used. The admixture presents a pH of 5–7, density of 1.07–1.11 g·cm−3, viscosity < 150 cps, and 28.5–31.5 wt.% of solid content. Siliceous sand was used as a fine aggregate with a specific gravity of 2.58 g·cm−3, fineness modulus of 2.4, and the maximum diameter of 2.36 mm. The granitic gravel was used as the coarse aggregate with a specific gravity of 2.63 g·cm−3, fineness modulus of 7.03, and the maximum diameter of 19 mm. The PSD of the aggregates is shown in Figure 1.
2.2. Concrete Mix Proportion and Sample Preparation
First, the reference concrete (i.e., without PPR incorporation) was dosed using the Brazilian Portland Cement Association method [30] that is based on the American Concrete Institute (ACI) 211 method. The characteristic compressive strength of concrete (fck) was 30 MPa for determining the reference composition. The slump between 40 and 60 mm was established as another parameter.
To this end, the reference concrete mass proportion was set as 1:1.94:2.62:0.5 (cement:sand:gravel:w/c) with a cement consumption of 390 kg·m−3. For all mixtures containing PPR—both as an additive (A) and as a replacement for cement (S)—the cement consumption was kept constant. Therefore, the amount of sand was corrected for each mixture. A 1% SP additive was used for the cement mass. The PPR was incorporated in (A) and (S) at concentrations of 10%, 20%, 30%, 40%, and 50% of the cement mass. The compositions of the investigated mixtures are listed in Table 3. In the mixing process, a 400-L capacity concrete mixer with a constant speed was used. The mixing procedure was performed in the following order: 50% water (SP already diluted), 100% gravel, 100% sand, 100% cement, 100% PPR (in the proportion defined for each mixture), and the remaining 50% of water. The mixing time was set to 5 min. For each composition, 26 cylindrical specimens (10 × 20 cm) were molded; the concretes were molded in two layers and mechanically compacted using an immersion vibrator according to NBR 5738 [31]. After 24 h, the specimens were demolded and immersed immediately in saturated lime water until the test day.
Table 3.
Concrete mixes compositions.
2.3. Testing Methods
For the fresh-state tests, a sample of each mixture was used to determine the slump according to ABNT NBR NM 67 [32]. For the hardened state, compressive strength tests were conducted at 7, 28, and 90 days of hydration in 10 × 20 cm cylindrical samples according to ABNT NBR 5739 [33]. At least three samples were used for each age group. The compressive strength was determined using a UH-I universal testing machine (Shymadzu Coorporation, Kyoto, Japan) at a constant speed of 3 mm·min−1. Neoprene discs were used to correct irregularities at the top and bottom of the concrete samples. More details in the experimental setup can be seen in Figure S1 (see Supplementary Material). Water absorption via immersion (gravimetric method) was tested with three samples (10 × 20 cm samples) at the age of 28 days in wet curing according to NBR 9778 [34]. The capillary water absorption test at 28 days of curing was performed with three specimens (10 × 20 cm samples) based on the criteria established by NBR 9779 [35].
Three types of acids—acetic acid (CH3COOH, 0.1 M), hydrochloric acid (HCl, 0.1 M), and sulfuric acid (H2SO4, 0.1 M)—were used for the acid attack samples (five months of curing; extracted from the core of the concrete sample; 2 × 2 × 1.4 cm). The samples were dried in an oven at 65 ± 5 °C for 48 h, weighed, and then immersed in a 1 L container containing 500 mL of acid. The containers were agitated at 30 rpm for 24 h following NBR 10005 [36]. The final masses of the samples were measured after drying in an oven at 65 ± 5 °C for 48 h; then, they were compared to the initial masses. The results are expressed as percentages. More details on the testing setup can be seen in Figure S2.
The electrical resistivity was measured using two probes at frequencies of 200 kHz applied at 300 mV with alternating current to avoid polarization effects [14,15] according to Lavagna et al. [26]. Three half-cut cylindrical specimens were used after one year and three months of curing with a height of 10 cm; they were dried at 100 °C for 24 h in an oven followed by cooling to room temperature. Samples were placed in an apparatus comprising two copper plates at the end, where moist sponges were placed between the sample and plate to maintain electrical contact [17]. Excess water from the sponges was expelled by the application of uniform pressure; all measurements were performed for less than 2 min to minimize any variation in the sponge moisture content [17]. More details can be seen in Figure S3.
After 28 days of wet curing, three samples of each mixture were exposed to the laboratory environment for the natural carbonation for one year and two months. Further, the carbonation depth was measured using the colorimetric test method [18] on the freshly broken samples (longitudinal direction) with a phenolphthalein solution diluted in alcohol (1 g·100 g−1). Figure S4 illustrates the testing procedure.
2.4. Binder Index (bi)
The binder index (bi) was calculated as proposed by Damineli et al. [30]; according to the literature, the PPR may exhibit pozzolanic activity, and therefore, it may show binder action. The bi corresponds to the consumption of the binder per m³ of concrete to reach 1 MPa of compressive strength, as expressed in kg·m−3. MPa−1. This analysis was performed on concrete with a compressive strength of 91 days.
2.5. Global Warming Potential
This analysis was performed according to Matos et al. [4] wherein the average compressive strength of concrete at 91 days is selected. Based on the bi obtained in the previous analysis (reported in Section 3.3.2) and from this average strength (54.0 MPa), a simulation of the consumption of cement and other constituent materials of concrete can be performed for each mix. This procedure was chosen to allow the comparison of concretes with the same practical use. Then, the global warming potential (GWP) is estimated for each mixture, as obtained by adding the equivalent CO2 emissions related to the constituents (Portland cement, fine aggregates, coarse aggregates, PPR, and SP) and concrete production process (mixing, transportation, and casting). The functional unit used was kg CO2-eq·m−3 of concrete.
The adopted values of CO2 equivalent emissions per kilogram of material (for constituents) and per m3 of concrete (for processing) are Portland cement = 1.0, SP = 0.5, fine aggregate = 0.014, coarse aggregate = 0.046, and mixing + transportation + casting = 1.5 [37,38,39,40,41]. For the PPR, an equivalent emission of 0.05 kg CO2-eq·kg−1 was adopted, and this corresponds to the energy used to dry the material according to Matos et al. [4]
3. Results and Discussion
3.1. Fresh State Properties
The slump test results are shown in Figure 4. Workability decreased for both the partial cement replacement and the use of PPR as an additive. The loss of workability was more significant when the PPR replaced cement because the SP dosage was based on the cement mass. The partial replacement of cement by PPR decreased workability by 7.69% when PPR replaced 10% of cement; 46.15% for S20; 84.62% for S30; 88.72% for S40; and 91.28% for S50. Similar behavior was observed in concretes with PPR as an additive, but the SP dosage was not increased. In samples A10, A20, and A30, there was a small decrease in workability corresponding to 1.03%, 2.56%, and 4.10%, respectively; A40 and A50 showed decreases of 69.23% and 82.56%, respectively.
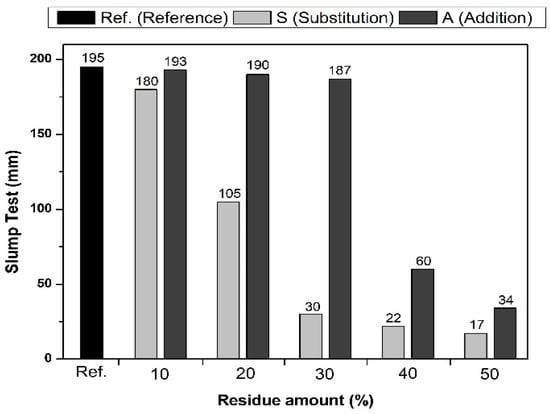
Figure 4.
Workability values of all mixes by slump test.
The specific surface area of PPR is greater than that of cement. Thus, more water is required to surround the grains because this waste is incorporated into the mixture. Zhong et al. [42] analyzed the morphology of PPR and found that its particles were irregular and angular, which reduces the workability sliding process between particles.
A reduction in workability was observed by Penteado et al. [11] when PPR partially replaced cement to produce paving blocks that reached 120 mm at 5%, 90 mm at 10%, 80 mm at 15% and 20%, and 70 mm at 25 and 30%. Further, Souza [7] reported a decrease in workability in concrete without the SP (from 50 mm to 5 mm) in samples with up to 40% addition of PPR. Moreover, de Matos et al. [6] and de Matos et al. [4] observed progressive increases in yield stress (related to slump) with increasing PPR content in pastes, and self-compacting concrete behavior to a higher specific surface area and irregularity of residue particles.
3.2. Hardened State Properties
3.2.1. Compressive Strength
Compressive strength results are shown in Figure 5. No improvements in compressive strength at 7 days were achieved when PPR replaced cement; however, better results were obtained at both 28 and 91 days. There were better resistances than the reference sample with the addition of PPR at all evaluated levels.

Figure 5.
Compressive strength of the concretes.
At 7 days, samples with cement replacement by PPR showed a reduction in compressive strength as the waste content increased. The reactivity of PPR is useful at advanced ages, usually for greater than 28 days of hydration. Jacoby and Pelisser [9] noted that higher strengths were achieved at more advanced ages, where this increase was proportional to the amount of PPR incorporated into the mixture; this shows the potential pozzolanic effect of the material. Accordingly, de Matos et al. [4] observed that replacing 10% cement with PPR resulted in strengths relative to the reference mixture (i.e., without waste) of 90%, 95%, and 98%, respectively, at 28, 91, and 365 days.
The compressive strength at 7 days decreased by 2.29% when PPR replaced 10% of cement, 3.98% for S20, 11.61% for S30, 29.80% for S40, and 40.12% for S50. The values of compressive strength for S10, S20, and S30 are relatively close to the reference, probably because of the lower substitution rates being associated with a better packing action [9,11,19,20]. Substitution contents higher than 30% did not present a beneficial effect, which results in the lower resistance rates at 7 days because of the removal of the cement, which is the main reactant.
An inverse behavior was observed in the mixtures containing PPR compared to the mixtures when PPR replaced cement. The compressive strength increased with the addition of PPR. This inverse behavior occurred because of better compactness caused by the high ratio of powder material consumption and aggregate consumption, which enhanced the filler effect of PPR. The addition of PPR to concrete contributed to an increase in the average compressive strength at 7 days of 24.52% for 10% PPR (A10), 37.59% for A20, 43.85% for A30, 50.98% for A40, and 54.95% for A50. As can be observed, it reached strengths above 50 MPa for A40 and A50. Souza [7] confirmed this fact, wherein the compressive strength at 7 days increased proportionally with the addition of PPR.
For the mechanical strength at 7 days when PPR is used as an additive and as partially replacement of the cement, the filler effect occurs quickly, and this is essential for concrete elements that require rapid demolding.
Higher average compressive strengths were obtained at 28 d for mixtures with partial replacement of cement by PPR. Increases of 7.45%, 16.16%, and 13.18% were achieved for concrete S10, S20, and S30, respectively, compared to that for the reference. Concrete S40 showed strength behavior similar that of the reference concrete considering the standard deviation bars. Further, there was a decrease of approximately 15.15% when the PPR replaced 50% of the cement.
Significant increases in compressive strength at 28 d were reported in several studies [8,12,19]. Depending on the percentage of cement replacement by PPR, Steiner et al. [8] observed improvements in the compressive strength of the reference concrete for the proportions of 10%, 20%, and 30%; however, there was a tendency to reduce this strength for cement replacement levels by PPR higher than 30%.
Concrete with the addition of PPR exhibited behavior similar to that presented at 7 days. The average compressive strength increased with the addition of PPR. An increase of 37.69% was obtained for A10; 53.79% for A20; 65.69% for A30; 77.89% for A40; and 92.22% for A50.
Souza [7] found an increase in the compressive strength of concrete with PPR when incorporated as an additive. The addition of 50% PPR using a SP increased the 28-day compressive strength by 80.68% compared to that using Souza’s reference concrete [7]. The addition of 40% PPR without additives caused an increase of only 50.00%. When the same amount of PPR was added with the SP, Souza [7] obtained an increase of 71.98%. Hence, applying SP and PPR is positive, and it promotes a better dispersion of the PPR particles that prevents them from agglomerating and increasing the number of nucleation points.
A similar behavior was observed at 91 days of curing with higher mean values of compressive strength for S10 (>15.15%), S20 (>14.52%), and S30 (>16.88%) when compared to the reference concrete. Similar average strength values were obtained for S40 and the reference concrete. The decrease in compressive strength of concrete S50 was 40.12% at 7 days, 15.15% at 28 days, and only 6.95% at 91 days, thereby confirming the reactivity of PPR. Besides, the A30-A50 mixes can be classified as high-performance concrete already at 28 days [43].
Pacheco-Torgal and Jalali [12] found more significant differences in compressive strengths at early curing ages and smaller differences at long curing ages, working with cement replacements for porcelain tile waste in concrete. Further, this behavior was observed in mortars with cement replacement by PPR because of the waste’s pozzolanic action [8]. Similar to 7 and 28 days, when incorporating the PPR as an additive in the mixtures, the compressive strengths at 91 days were higher than those of the reference concrete with 33.58% for A10, 48.61% for A20, 58.63% for A30, 71.69% for A40, and 78.25% for A50. The percentage of increase in compressive strength at 91 days was lower than that at 28 days. Further, Souza identified this trend [7] and found that an increase in strength at the advanced ages becomes less than that at early ages.
The filler effect and PPR reactivity contribute to the compressive strength of cementitious systems with PPR incorporation. The presence of PPR in cement-based systems is well known for its positive effect on the compressive strength. Other studies have confirmed the pozzolanic effect of PPR [4,8,9,12,19,20] and the filler effect [8,9,12,19].
3.2.2. Durability Indicators
Water Absorption by Immersion
The water absorption results are shown in Figure 6. Systems with the partial replacement of cement by PPR (S10, S20, and S30) showed lower water absorption values than the reference concrete (REF); these reductions were 4.42%, 8.98%, and 5.14% for S10, S20, and S30, respectively. However, concrete S40 obtained similar results to the reference (with an increase of 1.83%). Finally, the concrete with 50% substitution (S50) showed the highest absorption among all composites, 9.27% higher than the reference. In agreement with the results obtained, Pacheco-Torgal and Jalali [12] performed cement replacement with 25% of the waste; they observed a reduction in water absorption in concrete, relating this behavior to the dense microstructure provided by the pozzolanic reaction with calcium hydroxide generating C-S-H. However, Wang and Tian [19] found that large proportions of replacement by PPR in mortars showed higher rates of water absorption, and for Penteado et al. [11], there was an increase in water absorption at higher percentages of PPR in paving blocks. A high content of substitution excessively reduces the amount of clinker, which reduces the C-S-H formation from its hydration, and makes less calcium hydroxide available for the pozzolanic reaction of the residue. In this study, the compressive strength and water absorption results indicated that substitutions greater than 30% had deleterious effects on the hardened concrete performance.

Figure 6.
Water absorption of the concretes at 28 days.
Conversely, there was a reduction in water absorption as the percentage of PPR increased when the waste was used as an additive. This was found to be 7.06% for A10, 12.82% for A20, 15.95% for A30, 20.75% for A40, and 29.63% for A50, compared to that for REF. A similar behavior was reported by Souza [7]. The pozzolanic activity of the PPR associated with the filler effect caused by the particle size of the waste, which is finer than the cement (Figure 1), promoted a greater refinement of the pore structure [9,17,19,21,44]; this reduced water absorption. In addition, incorporating the fine particles of PPR promotes additional surfaces for the nucleation and growth of hydrates, which forms a more homogeneous microstructure [45,46].
Water Absorption by Capillarity
The water absorption by capillarity results are shown in Figure 7. Samples with cement replacement and PPR addition showed similar water absorption trends by capillarity wherein S10, S20, A10, and A20 showed higher values than the reference concrete. This increase, at 72 h, was 48.25% (S10), 18.42% (S20), 67.54% (A10), and 41.23% (A20). In contrast, contents higher than 20%, both for addition and replacement, led to a decrease in water absorption by capillarity compared to the reference concrete. At 72 h, this reduction was 8.77% for S30; 14.04% for S40; 17.54% for S50; 10.53% for A30; 22.81% for S40; and 30.70% for A50. Similar behavior was reported by Breitenbach et al. [47], where 5–20% PPR incorporation showed higher absorptions, while there was a decrease in water absorption by capillarity for contents higher than 20%. The authors observed that concretes with 30% PPR presented a 49.06% reduction in water absorption by capillarity compared to concretes with 20% of the residue. Water penetration is inversely proportional to the capillary diameter; the smaller pore size of the concrete with PPR resulted in smaller and more interconnected pores, which increased capillary absorption. The decrease in the average pore diameter in the presence of PPR was reported by Wang and Tian [19], because of the effect of pore tortuosity and/or clogging. Pacheco-Torgal and Jalali [12] obtained similar results and noted that the capillary water absorption in concretes incorporating porcelain tile waste decreased because of the pozzolanic reactions of the pore filling.

Figure 7.
Water absorption by capillarity at 28 days.
Acid Attack Susceptibility
In the acid attack resistance test, the reference concrete susceptibility and those with intermediate (30%) and maximum (50%) incorporation of PPR were evaluated. The results obtained in terms of mass loss are shown in Figure 8. More information on the specimen tested can be found in [2]. For attack by acetic acid, both the concrete and partial replacement of cement by PPR showed lower mass loss than the reference concrete. According to Oueslati and Duchesne [48], supplementary cementitious materials considerably improve the chemical durability of concrete subjected to an acetic acid solution. The penetration of the acid solution inside the cement matrix is directly linked to the transport properties of the cementitious material, where mineral additions allow a decrease in the total pore volume and an outstanding contribution to pore refinement, which consequently promotes low porosity and high compaction [48]. In addition, Oueslati [49] reported that some additives improve the chemical resistance of cementitious materials submitted to organic acids because their chemical compositions are rich in silicon, aluminum, and iron, which are resistant in an acidic medium and have low calcium content. This element was more leachable in acidic solutions. The employed PPR has high SiO2 (64.3%) and Al2O3 (19.3%) contents and a low CaO content (1.7%).

Figure 8.
Acid attack susceptibility test results at five months.
The mass loss observed when hydrochloric acid was used (Figure 8) was similar to that of acetic acid in the concrete with added waste. The concrete with substitution resulted in mass losses similar to those of the reference concrete. This acid was the most degraded by the progressive neutralization of the alkaline nature of the cement matrix through the decomposition of the main hydrated products (Ca(OH)2 and C-S-H), and it formed soluble calcium chloride (CaCl2) and water [50]. The S50 concrete presented the most significant mass loss; as this composition has a higher porosity (Figure 6), the acid penetration inside it is facilitated. When the pH is reduced to values below 12, calcium hydroxide is dissolved, and it contributes to a connected path of porous capillaries that allows acid ions to penetrate deeper into the internal structure. Further, the decrease in alkalinity caused the disintegration of the hydrated calcium silicate structure and increased pore size [51].
For the attack with sulfuric acid, the concrete with PPR showed a reduction in mass loss compared to the reference concrete whereas the concrete with the replacement showed an increase in the mass loss. This behavior agrees with the results of water absorption (Figure 6), which indicated that concretes with partial cement replacement tended to have higher permeability than the reference concrete, while mixtures with added waste showed the opposite behavior. A reduction in the cement amount leads to a lower formation of hydrated products at the age of the test, which increases the acid ingress into the concrete and consequently leads to a more significant degradation of the cement matrix. Concretes with added PPR showed the lowest mass losses, which can be related to the difficulty of acid penetration into the cement matrix. Cheng et al. [17] reported that the main factor favoring a lower degradation of concrete with PPR is the possibility of better packing because it reduces the voids and prevents the percolation of acid into its interior.
Electrical Resistivity
Electrical resistivity values are shown in Figure 9. All concretes obtained electrical resistivity results higher than 200 Ω m with an insignificant probability of corrosion rates based on Comité Euro-International du Béton (CEB-192) [52]. Figure 10 shows the correlation between electrical resistivity and compressive strength. The data are proportional to the mechanical strength values at 91 days, and they are inversely proportional to the water absorption values (not shown in the correlation), which indicates the direct influence of porosity on this property. The electrical resistivity increases as there is a decrease and refinement of pores because the ion flow is hindered [53]. The average electrical resistivity values of the concrete with a partial replacement of cement by PPR were 18.71% for S10, 23.23% for S20, 23.87% for S30, and 16.13% for S40. The exception was S50, which is caused by greater porosity, and it showed a lower result of 8.37%; further, with a high content of PPR, the particles may have agglomerated, which minimized its effect. All concretes presented average values of electrical resistivity that were higher than the reference concrete, 20.65% for A10, 25.16% for A20, 38.71% for A30, 45.61% for A40, and 48.97% for A50. The electrical resistivity increased as the PPR content in the mixture increased. In addition to porosity, another factor contributing to higher resistivities in concretes with PPR incorporation was pozzolanic reactivity because mineral additions can reduce hydroxyl ions that are one of the main components responsible for charge transport [54].

Figure 9.
Electrical resistivity of concrete.

Figure 10.
Relation between electrical resistivity and compressive strength.
Carbonation
Carbonation depth results are shown in Figure 11. All concretes with the partial replacement of cement by PPR showed higher average carbonation depths compared to the reference concrete (41.95% for S10, 51.71% for S20, 17.91% for S30, 41.82% for S40, and 234.20% for S50). The results obtained are similar to those reported by Cheng et al. [17], who used PPR as a supplementary cementitious material in concrete. According to the authors, this is attributed to two reasons: (1) the reference concrete has more clinker, and therefore, it has a higher amount of Ca(OH)2 when compared to mixtures with partial cement replacement; (2) the pozzolanic action of PPR can partially consume the Ca(OH)2 formed by cement hydration. Ca(OH)2 reacts with CO2, which penetrates the concrete in the context of carbonation. This forms CaCO3 that promotes the clogging of the pores, which reduces the CO2 ingress and consequently the carbonation depth. The lower production of Ca(OH)2 achieved by reducing the clinker or its consumption by pozzolanic activity reduces the occurrence of this phenomenon. Further, the carbonation depth of concrete S50 is considerably higher than that of the others, and it can be explained by the high porosity of the composite (higher water absorption among the concretes, Figure 6) together with the lower cement content and consequently lower Ca(OH)2 formation.
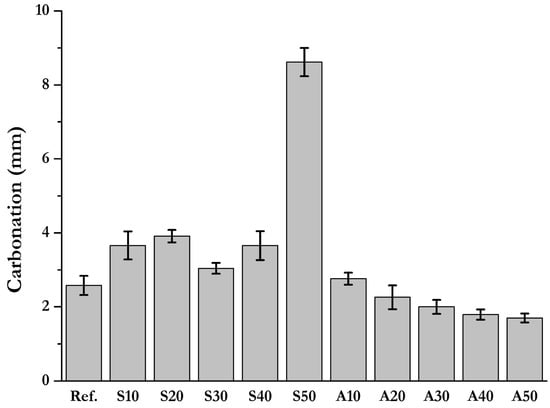
Figure 11.
Carbonation depths of concrete.
In concretes with added PPR, there was a tendency of equality (A10) or reduction (A20–A50) in the carbonation depth with increasing residue content. Although pozzolanic activity was observed in concrete with added PPR, the improvement in compactness promoted by the addition of waste reduced the ingress of CO2 through the voids. This trend agrees with the results of water absorption and compressive strength (correlation presented in Figure 12), which indicated lower porosities in the concretes with the addition of PPR.
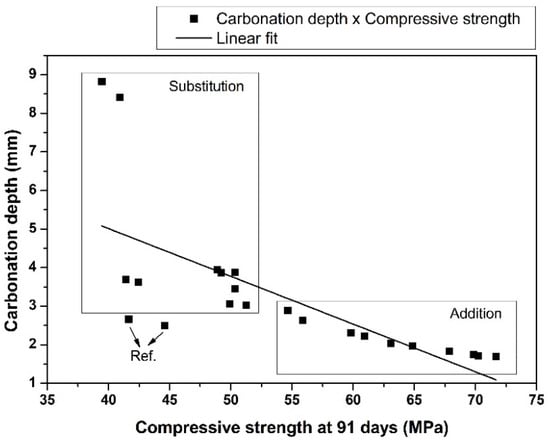
Figure 12.
Relationship between carbonation depth and compressive strength.
3.3. CO2 Emission Analysis
3.3.1. Binder Index (bi)
The values obtained from the bi of the concrete after 91 d are shown in Figure 13. For concretes with the partial replacement of cement with PPR, the S10 was the only one that showed a reduction in bi, and this reduction was 4.48% compared to the reference concrete. The others showed higher bi values of 4.79% for S20, 11.23% for S30, 44.17% for S40, and 61.21% for S50. These high rates were expected because less reactive additions increased the bi values. Therefore, as the PPR was not classified as pozzolanic, its reactivity was lower than that of pozzolans.

Figure 13.
Binder index results.
The efficiency of the binder increased for all concretes incorporated as an additive, and this resulted in a reduction of the reference mix bi (9.04 kg·m−3·MPa−1) by 13.86% for A10; 14.34% for A20; 12.37% for A30; 12.01% for A40; and 8.83% for A50.
Matos et al. [4] and Pelisser et al. [55] performed an analysis of the cement intensity index (CI) in self-compacting concrete with a partial replacement of cement by PPR. The CI is the ratio of cement consumption to the compressive strength obtained, that is, the consumption of other binders in the mixture is disregarded. These authors obtained a reduction in the CI of 18.46% at the maximum replacement content (30%).
If CII (Cement Intensity Index) was adopted, the mix S30 of the work in question would have a value of 7.73 kg·m−3·MPa−1, reaching a reduction of 14.44% in terms of the reference concrete (CII = 9.04 kg·m−3·MPa−1). Thus, the reduction of IIC in this study is close to that obtained by Matos et al. [4], which shows the good performance of PPR in cementitious matrices.
3.3.2. Global Warming Potential
The GWP values for all mixtures considering the compressive strength of 54 MPa are summarized in Table 4; these values correspond to the average compressive strength of the concrete at 91 days and the bi obtained in the previous analysis at 91 days.
Table 4.
Global warming potential results.
The results indicate the consumption of the materials of each mix to obtain a compressive strength of 54 MPa. The value of the bi is proportional to the consumption of binder, and therefore, the concretes with lower values of bi had lower binder consumption. As cement has the highest equivalent emission of CO2 among the constituents of concrete, the values of the GWP for composites will have a higher consumption.
According to Table 4, all concretes with the incorporation of the PPR—both as an additive and as a partial cement replacement—showed a reduction in the GWP of the reference concrete because they obtained lower cement consumption. Although the mixtures presented different consumption of other components (SPP, aggregates, and SP), the cement consumption considerably influenced the final result.
In addition to incorporation of PPR contributing to the reduction in cement consumption, another important factor is that the waste is practically neutral in CO2 emissions, which reduces the intensity of emissions, and consequently, the potential for global warming [56].
Further, mixtures with the additive presented the highest reductions in GWP, with a reduction of up to 38.8% for A50. Thus, the use of PPR is a satisfactory solution to reduce greenhouse gas emissions in concrete production, in addition to improving some concrete properties as analyzed previously. Similar results were observed by de Matos et al. [4], who found that the incorporation of PPR reduced the GWP.
4. Conclusions
This study evaluated the influence of incorporating PPR as an additive or as partial replacement of Portland cement on the properties of fresh and hardened concrete, durability, and CO2 equivalent emission of the composite. From these results, it can be concluded that:
- The incorporation of PPR as cement replacement significantly reduced the concrete workability, while this effect was less significant when PPR was incorporated as an additive.
- The concretes with cement replacement by RRP in 10–30% showed equivalent or higher strengths than the reference concrete at 7–91 days. With the addition of PPR, the compressive strength increased for all contents and ages, up to 92% (for 50% addition at 28 days).
- The incorporation of PPR generally improved the durability of concrete (water absorption, capillarity, and acid resistance) and this effect was more pronounced when the waste was incorporated as an additive. In turn, the carbonation depth increased with the partial replacement of cement (as previously reported in the literature for other SCMs), while it slightly decreased with the addition of waste.
- The incorporation of PPR reduced the equivalent emission of CO2 per m³ of concrete for both additive and cement replacement. For a compressive strength of 54 MPa at 91 days, the emission was reduced from 564 kg CO2-eq·m−3 of concrete for the reference mixture to 473 kg CO2-eq·m−3 of concrete (i.e., 16%) for 30% replacement and to 349 kg CO2-eq·m−3 of concrete (i.e., 38%) for 50% addition.
For practical engineering applications, this work revealed that using PPR in concrete is beneficial for the durability of the composite and for improving the mechanical strength and eco-efficiency, both as cement replacement and additive. This contributes to cleaner concrete production, reducing cement consumption and enabling the reuse of large-scale industrial waste. As a recommendation for future research, the potential of using PPR in ternary binders (e.g., together with fly ash or slag) may be addressed.
Supplementary Materials
The following supporting information can be downloaded at: https://www.mdpi.com/article/10.3390/app13052824/s1, Figure S1. Concrete specimen during the compressive strength test. Figure S2. Acid attack resistance test. (a) concrete sample tested (20 × 20 × 14 mm); (b) experimental setup. Figure S3. Concrete specimens and schematic illustration of the electrical resistivity test. Figure S4. Carbonation depth test. (a) specimen splitting procedure; (b) phenolphthalein colorimetric method.
Author Contributions
Conceptualization, H.M.M.S. and A.C.V.d.N.; methodology, H.M.M.S. and A.C.V.d.N.; formal analysis, H.M.M.S., L.F.J., P.R.d.M. and C.A.C.; investigation, H.M.M.S.; resources, M.S. and A.C.V.d.N.; data curation, L.F.J., P.R.d.M. and C.A.C.; writing—original draft preparation, H.M.M.S.; writing—review and editing, L.F.J., P.R.d.M., C.A.C., É.P.M., M.S. and A.C.V.d.N.; visualization, H.M.M.S.; supervision, É.P.M. and A.C.V.d.N.; project administration, A.C.V.d.N.; funding acquisition, M.S. and A.C.V.d.N. All authors have read and agreed to the published version of the manuscript.
Funding
This research was funded by the FACEPE-BR (APQ 0603-3.07/14), CAPES-BR (Finance Code 001), and FAPESC-BR.
Institutional Review Board Statement
Not applicable.
Informed Consent Statement
Not applicable.
Data Availability Statement
The data presented in this study are available on request from the corresponding author. The data are not publicly available yet because they are the subject of another ongoing research.
Conflicts of Interest
The authors declare no conflict of interest.
References
- Scrivener, K.L.; John, V.M.; Gartner, E.M. Eco-Efficient Cements: Potential Economically Viable Solutions for a Low-CO2 Cement-Based Materials Industry. Cem. Concr. Res. 2018, 114, 2–26. [Google Scholar] [CrossRef]
- Santos, H.M.M. Use of Waste from Porcelain Tile Polishing in Concrete as an Addition and as a Supplementary Cementitious Material. Master’s Thesis, Federal University of Pernambuco, Caruaru, Brazil, 2019. (In Portuguese). [Google Scholar]
- De Matos, P.R.; de Oliveira, A.L.; Pelisser, F.; Prudêncio, L.R., Jr. Rheological Behavior of Portland Cement Pastes and Self-Compacting Concretes Containing Porcelain Polishing Residue. Constr. Build. Mater. 2018, 175, 508–518. [Google Scholar] [CrossRef]
- De Matos, P.R.; Prudêncio, L.R.; de Oliveira, A.L.; Pelisser, F.; Gleize, P.J.P. Use of Porcelain Polishing Residue as a Supplementary Cimentitious Material in Self-Compacting Concrete. Constr. Build. Mater. 2018, 193, 623–630. [Google Scholar] [CrossRef]
- Rambaldi, E.; Esposito, L.; Tucci, A.; Timellini, G. Recycling of Polishing Porcelain Stoneware Residues in Ceramic Tiles. J. Eur. Ceram. Soc. 2007, 27, 3509–3515. [Google Scholar] [CrossRef]
- De Matos, P.R.; Jiao, D.; Roberti, F.; Pelisser, F.; Gleize, P.J.P. Rheological and Hydration Behaviour of Cement Pastes Containing Porcelain Polishing Residue and Different Water-Reducing Admixtures. Constr. Build. Mater. 2020, 262, 120850. [Google Scholar] [CrossRef]
- De Souza, P.A.B.F. Estudo Do Comportamento Plástico, Mecânico, Microestrutural e Térmico Do Concreto Produzido Com Resíduo de Porcelanato. Ph.D. Thesis, Federal University of Rio Grande do Norte, Natal, Brazil, 2007. [Google Scholar]
- Steiner, L.R.; Bernardin, A.M.; Pelisser, F. Effectiveness of Ceramic Tile Polishing Residues as Supplementary Cementitious Materials for Cement Mortars. Sustain. Mater. Technol. 2015, 4, 30–35. [Google Scholar] [CrossRef]
- Jacoby, P.C.; Pelisser, F. Pozzolanic Effect of Porcelain Polishing Residue in Portland Cement. J. Clean. Prod. 2015, 100, 84–88. [Google Scholar] [CrossRef]
- Ramos, G.A.; de Matos, P.R.; Pelisser, F.; Gleize, P.J.P. Effect of Porcelain Tile Polishing Residue on Eco-Efficient Geopolymer: Rheological Performance of Pastes and Mortars. J. Build. Eng. 2020, 32, 101699. [Google Scholar] [CrossRef]
- Penteado, C.S.G.; Viviani de Carvalho, E.; Lintz, R.C.C. Reusing Ceramic Tile Polishing Waste in Paving Block Manufacturing. J. Clean. Prod. 2016, 112, 514–520. [Google Scholar] [CrossRef]
- Pacheco-Torgal, F.; Jalali, S. Reusing Ceramic Wastes in Concrete. Constr. Build. Mater. 2010, 24, 832–838. [Google Scholar] [CrossRef]
- Puertas, F.; García-Díaz, I.; Barba, A.; Gazulla, M.F.; Palacios, M.; Gómez, M.P.; Martínez-Ramírez, S. Ceramic Wastes as Alternative Raw Materials for Portland Cement Clinker Production. Cem. Concr. Compos. 2008, 30, 798–805. [Google Scholar] [CrossRef]
- Naceri, A.; Hamina, M.C. Use of Waste Brick as a Partial Replacement of Cement in Mortar. Waste Manag. 2009, 29, 2378–2384. [Google Scholar] [CrossRef] [PubMed]
- Lavat, A.E.; Trezza, M.A.; Poggi, M. Characterization of Ceramic Roof Tile Wastes as Pozzolanic Admixture. Waste Manag. 2009, 29, 1666–1674. [Google Scholar] [CrossRef] [PubMed]
- Cheng, Y.; Huang, F.; Liu, R.; Hou, J.; Li, G. Test Research on Effects of Waste Ceramic Polishing Powder on the Permeability Resistance of Concrete. Mater. Struct. 2016, 49, 729–738. [Google Scholar] [CrossRef]
- Cheng, Y.; Huang, F.; Li, G.; Xu, L.; Hou, J. Test Research on Effects of Ceramic Polishing Powder on Carbonation and Sulphate-Corrosion Resistance of Concrete. Constr. Build. Mater. 2014, 55, 440–446. [Google Scholar] [CrossRef]
- Rodrigues Medeiros, V.B.; Lima, E.E.P.; Carvalho, C.M.; Júnior, A.S.S. Concreto Sustentável Produzido Com Resíduo de Porcelanato: Análise de Durabilidade Por Carbonatação. Rev. Ciência Tecnol. 2018, 17–24. [Google Scholar]
- Wang, G.; Tian, B. Effect of Waste Ceramic Polishing Powder on the Properties of Cement Mortars. In Proceedings of the 2009 International Conference on Energy and Environment Technology, Guilin, China, 16–18 October 2009; pp. 101–104. [Google Scholar]
- Pelisser, F.; Steiner, L.R.; Bernardin, A.M. Recycling of Porcelain Tile Polishing Residue in Portland Cement: Hydration Efficiency. Environ. Sci. Technol. 2012, 46, 2368–2374. [Google Scholar] [CrossRef]
- Wang, G.X.; Xu, K.J.; Zhu, M.Q.; Tian, B. Pozzolanic Activity of Ceramic Polishing Powder as Cementitious Material. Mater. Sci. Forum 2011, 675–677, 135–138. [Google Scholar] [CrossRef]
- Casagrande, C.A.; Jochem, L.F.; Repette, W.L.; Hotza, D. Evaluation of Nano-TiO2 on Properties of Cementitious Mortars. Matéria 2020, 25. [Google Scholar] [CrossRef]
- Li, L.G.; Zhuo, Z.Y.; Kwan, A.K.H.; Zhang, T.S.; Lu, D.G. Cementing Efficiency Factors of Ceramic Polishing Residue in Compressive Strength and Chloride Resistance of Mortar. Powder Technol. 2020, 367, 163–171. [Google Scholar] [CrossRef]
- Li, L.G.; Zhuo, Z.Y.; Zhu, J.; Kwan, A.K.H. Adding Ceramic Polishing Waste as Paste Substitute to Improve Sulphate and Shrinkage Resistances of Mortar. Powder Technol. 2020, 362, 149–156. [Google Scholar] [CrossRef]
- Lee, C.Y.; Wang, S.R. Application of Four-Electrode Method to Analysis Resistance Characteristics of Conductive Concrete. World Acad. Sci. Eng. Technol. 2010, 4, 77–80. [Google Scholar]
- Lavagna, L.; Musso, S.; Ferro, G.; Pavese, M. Cement-Based Composites Containing Functionalized Carbon Fibers. Cem. Concr. Compos. 2018, 88, 165–171. [Google Scholar] [CrossRef]
- Zhu, X.; Zhang, Z.; Yang, K.; Magee, B.; Wang, Y.; Yu, L.; Nanukuttan, S.; Li, Q.; Mu, S.; Yang, C.; et al. Characterisation of Pore Structure Development of Alkali-Activated Slag Cement during Early Hydration Using Electrical Responses. Cem. Concr. Compos. 2018, 89, 139–149. [Google Scholar] [CrossRef]
- Wen, S.; Chung, D.D.L. Effect of Stress on the Electric Polarization in Cement. Cem. Concr. Res. 2001, 31, 291–295. [Google Scholar] [CrossRef]
- Associação Brasileira de Normas Técnicas. NBR 12653—Materiais Pozolânicos—Requisitos; Associação Brasileira de Normas Técnicas: Rio de Janeiro, Brazil, 2015. [Google Scholar]
- Damineli, B.L.; Kemeid, F.M.; Aguiar, P.S.; John, V.M. Measuring the Eco-Efficiency of Cement Use. Cem. Concr. Compos. 2010, 32, 555–562. [Google Scholar] [CrossRef]
- Associação Brasileira de Normas Técnicas. NBR 5738—Concreto—Procedimento Para Moldagem e Cura de Corpos de Prova; Associação Brasileira de Normas Técnicas: Rio de Janeiro, Brazil, 2016. [Google Scholar]
- Associação Brasileira de Normas Técnicas. NBR NM 67—Concreto—Determinação Da Consistência Pelo Abatimento Do Tronco de Cone; Associação Brasileira de Normas Técnicas: Rio de Janeiro, Brazil, 1998. [Google Scholar]
- Associação Brasileira de Normas Técnicas. NBR 5739—Concreto—Ensaio de Compressão de Corpos de Prova Cilíndricos; Associação Brasileira de Normas Técnicas: Rio de Janeiro, Brazil, 2018. [Google Scholar]
- Associação Brasileira de Normas Técnicas. NBR 9778—Argamassa e Concreto Endurecidos—Determinação Da Absorção de Água, Índice de Vazios e Massa Específica; Associação Brasileira de Normas Técnicas: Rio de Janeiro, Brazil, 2005. [Google Scholar]
- Associação Brasileira de Normas Técnicas. NBR 9779—Argamassa e Concreto Endurecidos—Determinação Da Absorção de Água Por Capilaridade; Associação Brasileira de Normas Técnicas: Rio de Janeiro, Brazil, 2012. [Google Scholar]
- Associação Brasileira de Normas Técnicas. NBR 10005 Procedimento Para Obtenção de Extrato Lixiviado de Resíduos Sólido; ABNT: Rio de Janeiro, Brazil, 2004. [Google Scholar]
- Flower, D.J.M.; Sanjayan, J.G. Green House Gas Emissions Due to Concrete Manufacture. Int. J. Life Cycle Assess. 2007, 12, 282–288. [Google Scholar] [CrossRef]
- Cassagnabère, F.; Mouret, M.; Escadeillas, G.; Broilliard, P.; Bertrand, A. Metakaolin, a Solution for the Precast Industry to Limit the Clinker Content in Concrete: Mechanical Aspects. Constr. Build. Mater. 2010, 24, 1109–1118. [Google Scholar] [CrossRef]
- Liu, R.; Durham, S.A.; Rens, K.L.; Ramaswami, A. Optimization of Cementitious Material Content for Sustainable Concrete Mixtures. J. Mater. Civ. Eng. 2012, 24, 745–753. [Google Scholar] [CrossRef]
- Turner, L.K.; Collins, F.G. Carbon Dioxide Equivalent (CO2-e) Emissions: A Comparison between Geopolymer and OPC Cement Concrete. Constr. Build. Mater. 2013, 43, 125–130. [Google Scholar] [CrossRef]
- Celik, K.; Meral, C.; Petek Gursel, A.; Mehta, P.K.; Horvath, A.; Monteiro, P.J.M. Mechanical Properties, Durability, and Life-Cycle Assessment of Self-Consolidating Concrete Mixtures Made with Blended Portland Cements Containing Fly Ash and Limestone Powder. Cem. Concr. Compos. 2015, 56, 59–72. [Google Scholar] [CrossRef]
- Zhong, M.F.; Su, D.G.; Zhao, Y.X. Hydration Activity of Ceramic Polishing Powder at Autoclaved Condition. Adv. Mater. Res. 2012, 568, 392–395. [Google Scholar] [CrossRef]
- Roberti, F.; Cesari, V.F.; de Matos, P.R.; Pelisser, F.; Pilar, R. High- and Ultra-High-Performance Concrete Produced with Sulfate-Resisting Cement and Steel Microfiber: Autogenous Shrinkage, Fresh-State, Mechanical Properties and Microstructure Characterization. Constr. Build. Mater. 2021, 268, 121092. [Google Scholar] [CrossRef]
- Jochem, L.F.; Casagrande, C.A.; Bizinotto, M.B.; Aponte, D.; Rocha, J.C. Study of the Solidification/Stabilization Process in a Mortar with Lightweight Aggregate or Recycled Aggregate. J. Clean. Prod. 2021, 281, 129415. [Google Scholar] [CrossRef]
- Berodier, E.; Scrivener, K. Understanding the Filler Effect on the Nucleation and Growth of C-S-H. J. Am. Ceram. Soc. 2014, 97, 3764–3773. [Google Scholar] [CrossRef]
- Jochem, L.F.; Rocha, J.C.; Cheriaf, M. The Influence of Fine Sand from Construction-Demolition Wastes (CDW) in the Mortar Properties. In Key Engineering Materials; Trans Tech Publications Ltd.: Zurich, Switzerland, 2014; Volume 600, pp. 357–366. [Google Scholar] [CrossRef]
- Breitenbach, S.B.; Santos, O.C.; Andrade, J.C.S.; Nascimento, R.M.; Martinelli, A.E. Adição de Resíduo Do Polimento de Porcelanato Em Argamassas de Restauro à Base de Cal. Cerâmica 2017, 63, 395–401. [Google Scholar] [CrossRef]
- Oueslati, O.; Duchesne, J. The Effect of SCMs on the Corrosion of Rebar Embedded in Mortars Subjected to an Acetic Acid Attack. Cem. Concr. Res. 2012, 42, 467–475. [Google Scholar] [CrossRef]
- Oueslati, O. Durabilité des Matériaux Cimentaires Soumis Aux Acides Organiques; Université Laval: Quebec, QC, Canada, 2011. [Google Scholar]
- Donatello, S.; Palomo, A.; Fernández-Jiménez, A. Durability of Very High Volume Fly Ash Cement Pastes and Mortars in Aggressive Solutions. Cem. Concr. Compos. 2013, 38, 12–20. [Google Scholar] [CrossRef]
- Chatveera, B.; Lertwattanaruk, P. Evaluation of Nitric and Acetic Acid Resistance of Cement Mortars Containing High-Volume Black Rice Husk Ash. J. Environ. Manag. 2014, 133, 365–373. [Google Scholar] [CrossRef]
- Mehta, P.K.; Monteiro, P.J. Concreto: Microestrutura, Propriedades e Materiais; IBRACON: São Paolo, Brazil, 2008. [Google Scholar]
- Safiuddin, M.; West, J.S.; Soudki, K.A. Hardened Properties of Self-Consolidating High Performance Concrete Including Rice Husk Ash. Cem. Concr. Compos. 2010, 32, 708–717. [Google Scholar] [CrossRef]
- De Matos, P.R.; Sakata, R.D.; Prudêncio, L.R. Eco-Efficient Low Binder High-Performance Self-Compacting Concretes. Constr. Build. Mater. 2019, 225, 941–955. [Google Scholar] [CrossRef]
- Pelisser, F.; Vieira, A.; Bernardin, A.M. Efficient Self-Compacting Concrete with Low Cement Consumption. J. Clean. Prod. 2018, 175, 324–332. [Google Scholar] [CrossRef]
- John, V.M. Concreto: Ciência e Tecnologia, 1st ed.; Isaia, G.C., Ed.; IBRACON: São Paulo, Brazil, 2011; Volume 2. [Google Scholar]


Disclaimer/Publisher’s Note: The statements, opinions and data contained in all publications are solely those of the individual author(s) and contributor(s) and not of MDPI and/or the editor(s). MDPI and/or the editor(s) disclaim responsibility for any injury to people or property resulting from any ideas, methods, instructions or products referred to in the content. |
© 2023 by the authors. Licensee MDPI, Basel, Switzerland. This article is an open access article distributed under the terms and conditions of the Creative Commons Attribution (CC BY) license (https://creativecommons.org/licenses/by/4.0/).