Article

Low-Dose Non-Thermal Atmospheric Plasma Promotes the Proliferation and Migration of Human Normal Skin Cells

1
Anhui Province Key Laboratory of Medical Physics and Technology, Institute of Health & Medical Technology, Hefei Institutes of Physical Science, Chinese Academy of Sciences, Hefei 230031, China
2
College of Basic Medical, Anhui Medical University, Hefei 230032, China
3
School of Life Science, Hefei Normal University, Hefei 230061, China
4
Key Laboratory of Xin’an Medicine, Ministry of Education, Anhui University of Chinese Medicine, Hefei 230012, China
5
Hefei Cancer Hospital, Chinese Academy of Sciences, Hefei 230031, China
6
Collaborative Innovation Center of Radiation Medicine, Jiangsu Higher Education Institutions and School for Radiological and Interdisciplinary Sciences, Soochow University, Suzhou 215123, China
*
Authors to whom correspondence should be addressed.
These authors contributed equally to this work.
Appl. Sci. 2023, 13(5), 2866; https://doi.org/10.3390/app13052866
Submission received: 16 December 2022 / Revised: 13 February 2023 / Accepted: 20 February 2023 / Published: 23 February 2023
(This article belongs to the Special Issue Cold Atmospheric Plasma and Its Applications)

Abstract

:
(1) Background: The purpose of this study was to investigate the effects of low-dose non-thermal atmospheric plasma (NTP) on the proliferation and migration of human immortalized keratinocytes (HaCaT cells) and its molecular mechanisms. (2) Methods: The effects of NTP on HaCaT cells were detected by cell viability, wound healing assay, cell cycle, mitochondrial membrane potential detection, and western blot, and the role of reactive oxygen species (ROS) content in low-dose NTP was explored. (3) Results: Results showed that the proportion of cells in G1-S phase transition, cell migration ability, and the expression of Cyclin D1 and STAT3 reached the peak at 10 s treatment group, while the cell viability and the expression of PI3K, AKT, mTOR, ERK, WNT, and β-catenin proteins reached the peak at 15 s treatment group. (4) Conclusions: These results manifested that ROS produced by low-dose NTP promoted the proliferation of HaCaT cells by activating the PI3K/AKT/mTOR signaling pathway and also promoted the migration by activating the WNT/β-catenin signaling pathway. Therefore, these results will be useful for the application of low-dose NTP in the treatment of wound healing.

1. Introduction

Plasma is usually defined as an ionized gas, which is produced by the decomposition of polyatomic gas molecules or the removal of electrons from monoatomic gas shells [1]. Non-thermal atmospheric plasma (NTP) is one of them, which can produce reactive oxygen species (ROS), reactive nitrogen species (RNS), ultraviolet radiation, infrared radiation, electronic ion electric field, and so on [2]. The physiological level of ROS (mainly hydrogen peroxide) generated by plasma entering cells is a key redox signaling factor which emits signals through specific protein targets and participates in cell metabolism regulation and stress response to support cells to adapt to changing environments and pressures [3]. These special ingredients make NTP a powerful tool for many applications, such as cancer treatment [4,5], coagulation [6], oral treatment [7], sterilization [8], skin disease treatment [9], and wound healing [10,11] etc.
As the largest organ of the human body, the skin is the first line of defense against microbial invasion, physical and chemical damage, and trauma [12]. However, when this line of defense is destroyed by mechanical or chemical damage, the skin needs wound healing rapidly. Wound healing is a complex and dynamic process generally divided into four stages, starting with hemostasis, inflammation, then proliferation, and finally tissue remodeling. In the micro environment of damaged tissue, there are many biological factors and cell types involved in this process. One cell type is keratinocytes, which proliferate and migrate to the site of the injury during proliferation under the induction of growth factors [13]. In clinical practice, there are various therapeutic strategies for wound healing, such as the most common drug therapy [14], growth factor therapy [15], epidermal stem cell transplantation [16], spray and stem cell therapy [17], etc. Although there are many methods, there are still many limitations, such as drug resistance, high price, and complex operation. Therefore, there is an urgent need for new treatments to promote wound healing, especially for complex chronic wounds.
Low-dose NTP is promising to achieve this strategic goal [18,19,20], which can promote wound healing not only by killing bacteria in the wound area [21], but also by stimulating the proliferation of vascular endothelial cells [22], inducing the expression of IL-6, IL-8, MCP-1, TGF-β1, and TGF-β2 [23], which is related to wound healing, and promoting angiogenesis [24], etc. The proliferation stage of wound healing is characterized by extensive activation of keratinocytes, fibroblasts, macrophages, and endothelial cells to coordinate wound closure matrix deposition and angiogenesis [25]. As early as 12 h after injury, keratinocytes are activated by various alterations [26], which lead to partial epithelial–mesenchymal transition in keratinocytes at the edge of the wound [27]. Furthermore, keratinocytes with altered polarity migrate horizontally through the wound to reconstruct the epidermis [28]. The keratinocytes behind the leading edge regulate their cell adhesion through PCKα-mediated desmosomal adhesion changes [29] and Eph-mediated adhesion junction changes [30], so that they can rearrange their order with the migrated epithelial sheets [26]. Keratinocytes in new epidermis release matrix metalloproteinases in the neoepidermis to assist their migration pathways and rebuilt the basement membrane [31], and then completely remodel the basement membrane and undergo terminal differentiation to stratification and regeneration of the epidermis [32,33].
Keratinocyte is one of the most important cells in wound healing, and the HaCaT cell is a cell line of immortalized keratinocytes from adult humans. Previous studies have found that low-dose NTP treatment promotes the proliferation of basal epidermal keratinocytes [34], but the mechanism of action is not elucidated. Subsequent studies have found that microvesicles extracted from human adipose stem cells and dracorhodin perchloratecan can stimulate HaCaT cells to promote wound healing [35,36]. In this study, low-dose NTP is applied to promote the proliferation and migration of HaCaT cells, and the mechanism is investigated. The effect of NTP on HaCaT cells is studied by cell viability assay, cell migration assay, cell cycle detection, western blot (WB), and the changes of reactive oxygen and nitrogen species (RONS). What is more, the effects of NTP treatment on mitochondrial membrane potential in HaCaT cells is detected by 5,5′,6,6′-tetrachloro-1,1′,3,3′-tetraethyl-pyridoxal (JC-1). In addition, the mechanism of NTP-promoted HaCaT cell proliferation and migration is investigated via WB to clarify the role and mechanism of NTP stimulating HaCaT cells in skin wound repair, which will lay a theoretical foundation for NTP in the clinical treatment of various wounds.

2. Materials and Methods

2.1. Cell Culture

HaCaT cells were purchased from KeyGEN BioTECH (Cas: 20210513) and cultured in Dulbecco’s modified eagle medium (DMEM) supplemented with 10% fetal bovine serum (LONSERA, Shanghai, China, S711-001S) and 1% penicillin/streptomycin (NCM BioTECH, Suzhou, China, 15140-122), which were cultured at 37 °C and 5% CO2 in an incubator (Thermo Fisher Scientific, Waltham, MA, USA). Cells were grown in a single layer on 60 mm petri dishes (Biotech, Shanghai, China, QN2911) until about 80% of the bottom area was covered, before NTP treatment.

2.2. NTP Device

The atmospheric pressure dielectric barrier discharge (DBD) plasma device in our lab was illustrated in Liu et al. [37]. The NTP was generated under a voltage of 3.78 kV (peak to peak) with a frequency of 25 kHz. In addition, industrial-grade pure helium (99.999%) was used as discharge gas, whose flow rate was 1 L/min. Helium was introduced for 90 s before cell treatment to ensure sufficient helium in the reactor. An amount of 5 mL fresh medium was replaced before NTP treatment in order for the cells to be nutritionally adequate within 24 h of incubation after NTP treatment. After the cells were treated with NTP for 0, 5, 10, 15, 20, and 25 s, they were further cultured in the incubator for 0, 4, 12, and 24 h for various experiments.

2.3. Cell Viability

HaCaT cells were cultured in 60 mm petri dishes, and when the concentration required for the experiment was reached, the old medium was discarded and replaced with new medium. After NTP treatment, the cells were incubated for 24 h. The medium was discarded again, and 1.5 mL of preconfigured 3-(4,5-dimethylthiazole-2-yl)-2,5-diphenyltetrazolium bromide (MTT, Sigma-Aldrich, St. Louis, MO, USA, 298-93-1) working solution was added to each dish. After further incubation in the incubator for 4 h, an equal volume of dimethyl sulfoxide (DMSO, Sangon Biotechnology, Shanghai, China, 67-68-5) was added and shaken for 10 min to completely dissolve the blue-purple crystals in living cells. The culture solution was then transferred to a 96-well plate and the absorbance of each well was measured with a microplate reader at 492 nm. Cell viability was calculated from a standard curve. To investigate the effect of ROS on the viability of HaCaT cells, N-acetyl-L-cysteine (NAC, Beyotime, Shanghai, China, S0077), a scavenger of ROS, was used to verify the results. HaCaT cells were pretreated with 100 μL NAC (10 mM) for 1 h before NTP treatment and their cell viability was measured again.
In addition, in order to explore whether short-term NTP treatment (15 s) promoted the viability of HaCaT cells through the PI3K/AKT/mTOR pathway, we added PI3K inhibitor LY294002 (Beyotime, Shanghai, China, S1737) to conduct an MTT experiment; the working concentration was 25 μM, and cells were divided into four groups: the control group (without NTP treatment and LY294002 pretreatment), the NTP treatment group (NTP treatment 15 s), the inhibitor group (LY294002 pretreatment only), and the inhibitor pretreatment group (LY294002 pretreatment before NTP treatment). The MTT experimental method was the same as before.

2.4. Extracellular Reactive Species Detection

After HaCaT cells were treated with NTP, the concentrations of ROS and RNS in the cell culture medium were detected immediately using a H2O2 detection kit (Beyotime, Shanghai, China, S0038) and NO detection kit (Beyotime, Shanghai, China, S0021S), respectively. Incubated for 4 h after NTP treatment, and detected the concentration of ROS in the medium again. The absorbance was measured at 540 nm, and the concentration was calculated according to the standard curve.

2.5. Intracellular Reactive Species Detection

Intracellular ROS levels were measured by incubation for 4 h after NTP treatment. An ROS detection kit (KeyGEN BioTECH, Nanjing, China, S0033S) containing 2′,7′-Dichlorodihydro -fluorescein diacetate (DCFH-DA) was used as a fluorescent probe. After the fluorescent probes were mounted, the incubation was continued in the incubator for 30 min, and the fluorescence intensity of ROS in the cells was observed and photographed using a fluorescence microscope (Olympus, Tokyo, Japan). Image J software (version V1.8.0.112) was used for analysis and recording.

2.6. Mitochondrial Membrane Potential Detection

After 4 h of NTP treatment, the original medium was discarded, and then the cell was washed twice with PBS. Then 2 mL DMEM medium was added to each petri dish, which was added the pre-prepared JC-1 staining working solution and was fully mixed according to the mitochondrial membrane potential kit (JC-1, Solarbio, Beijing, China, M8650). After incubation in the incubator for 20 min, the solution in the petri dish was discarded, washed twice with pre-prepared JC-1 staining buffer, which was discarded afterwards. Then 2 mL DMEM medium was added to each petri dish again, and the fluorescence images were observed and recorded under a fluorescence microscope. Quantitative fluorescence analysis was performed using Image J software.

2.7. Scratch Wound Assay

After the cells had grown to cover the bottom of the petri dish, the original cell medium was discarded, and 200 μL of a sterile yellow pipette tip was used to scratch the bottom of the petri dish in a vertically uniform straight line. The plates were washed three times with PBS to remove scraped cells and cell debris, and the new medium was added. After NTP treatment, the cells were cultured in an incubator for 0, 4, 12, and 24 h, and the degree of cell migration was observed and recorded under a microscope (Guangzhou, China). Image J software was used to calculate the scratch area.

2.8. Cell Migration Assay

Cell migration assay was performed in 24-well transwell chambers (Costar, Washington, DC, USA, 3415) with 8 μm wells. Cells were treated with NTP and left for 4 h before being digested with trypsin to prepare a cell suspension. Cells were counted so that the cell number was approximately 1 × 10⁵/mL. An amount of 200 μL of FBS-free DMEM cell suspension was added to the upper chamber. In the lower chamber, DMEM containing 10% fetal bovine serum (500 μL) was added as a chemical attractant. After incubation for approximately 24 h, the cells that had crossed the membrane were washed with PBS, fixed with 4% paraformaldehyde and stained with crystal violet. The cells that did not pass through the superior ventricular membrane were gently wiped with a cotton swab, and the remaining cells were observed under a low-power microscope (100×) in five randomly selected fields.
In addition, in order to explore whether short-term NTP treatment (15 s) promoted the migration of HaCaT cells through the Wnt/β-catenin pathway, we added IWP-2 (Beyotime, Shanghai, China, SF 6831), an inhibitor of the Wnt/β-catenin pathway to conduct the transwell experiment; the working concentration was 25 nM. The cells were divided into four groups: control group (no NTP treatment and IWP-2 pretreatment), NTP treatment group (NTP treatment for 15 s), inhibitor group (IWP-2 pretreatment only) and inhibitor pretreatment group (IWP-2 pretreatment before NTP treatment). The transwell experimental method is the same as before.

2.9. Cell Cycle Analysis

Cells grown to about 80% of the bottom of the dish were subjected to NTP treatment and then incubated for 24 h at 37 °C in a 5% CO2 incubator. The original medium was blotted dry, cells were washed with PBS, dissociated by trypsin, and then fixed by suspension in 70% cold alcohol overnight at 4 °C temperature. The prefabricated propidium iodide staining solution was added at room temperature and incubated for an additional 30 min in the absence of light according to the manufacturer’s instructions (KGI Biology, Nanjing, China, KGA512), then the FACs Calibur system (BD Biosciences, Franklin Lakes, NJ, USA) was used for cell cycle analysis. ModFit Version 3.1 Software (Verity Software House, Inc., Topsham, ME, USA) was used to analyze the percentage of cells in G0/G1, S, and G2/M phases.

2.10. Western Blot

WB was used to detect the protein expression of the proliferation-related PI3K-AKT signaling pathway and migration-related WNT/β-catenin signaling pathway. Briefly, proteins (20 μg) were separated by SDS-PAGE (sodium dodecyl sulfatepolyacrylamide gel electrophoresis, P0012A) and then transferred to nitrocellulose membranes. Rabbit anti-PI3K antibody (1:1000 3011S), rabbit anti-AKT antibody (1:1000 4685S), rabbit anti-CyclinD1 antibody (1:1000 55506), rabbit anti-ERK antibody (1:1000 A16686), rabbit anti-mTOR antibody (1:1000 2983), and rabbit anti-STAT3 antibody (1:1000 4904), were purchased from Cell Signaling, Danvers, MA, USA and used for incubation membranes. Rabbit anti-WNT3A antibody (1:1000 A0642), rabbit anti-β-catenin antibody (1:1000 A19657) and rabbit anti-ACTB antibody (1:1000 AC062) were purchased from Abclonal, Wuhan, China and also used for incubation membranes. Horseradish peroxidase-coupled anti-rabbit IgG secondary antibody (1:10,000 AS014) (AB Clone, Wuhan, China) was then incubated for 40 min. Chemiluminescence kit (Thermo Fisher Scientific Searle Scientific Company, USA A3855) and chemiluminescence gel imaging system (Tanon, Shanghai, China) were used to detect and quantify protein. Finally, the ratio of fluorescence intensity of each objective band to the 0 s control group was calculated.
To further validate the effect of low-dose ROS produced by NTP treatment on the phosphorylation of protein, we supplemented the WB experiments with p-AKT (Beyotime, China, 1:1000, AF5740) and p-β-catenin (Wuhan, China, 1:1000, AP0979). According to the needs of the experiment, they were divided into four groups: control group (no NTP treatment and NAC pretreatment), NTP treatment group (NTP treatment for 15 s), NAC group (NAC pretreatment only) and NAC pretreatment group (NAC pretreatment before NTP treatment for 15 s).

2.11. Statistical Analysis

Data were reported as means ± SD of three independent experiments. The p-values were determined by Student’s t-test for comparison between two groups, and by one-way analysis of variance (ANOVA) with Bonferroni’s correction for comparison among three or more groups. p < 0.05 was considered as a significant difference.

3. Results and Discussion

3.1. Effect of NTP on Viability of HaCaT Cells

HaCaT cells were stimulated with NTP at an interval of 5 s, and the cell viability was measured. Compared with the untreated cell group, the survival rate of HaCaT cells treated for 10 s and 15 s significantly increased (both p < 0.05), and the cell survival rate of the 15 s treatment group reached the peak (Figure 1A) (p < 0.001). However, when the plasma treatment time was increased to 20 s and 25 s, the cell survival rate decreased sharply, which was significantly lower than that of the control group. The results showed that low-dose NTP promoted HaCaT cell viability, while high-dose NTP inhibited it.
As an important cellular component in the wound healing process, the enhancement of the cell viability of HaCaT cells was undoubtedly beneficial to wound healing. In addition to promoting the viability of cells related to wound healing, such as fibroblasts [38] and vascular endothelial cells [19], low-dose NTP has also been reported to promote the viability of HaCaT cells [34], but the mechanism of its action has not been elucidated. Furthermore, both polysaccharide from Gracilaria lemaneiformis [39] and NTP-like low-intensity pulsed ultrasound [40] promoted wound healing by promoting HaCaT cell viability. In this study, low-dose NTP treatment (10 s and 15 s treatment groups) promoted cell viability, while high-dose NTP treatment (20 s and 25 s treatment groups) inhibited it compared with control group, which was similar to the study of Hasse et al. [34].

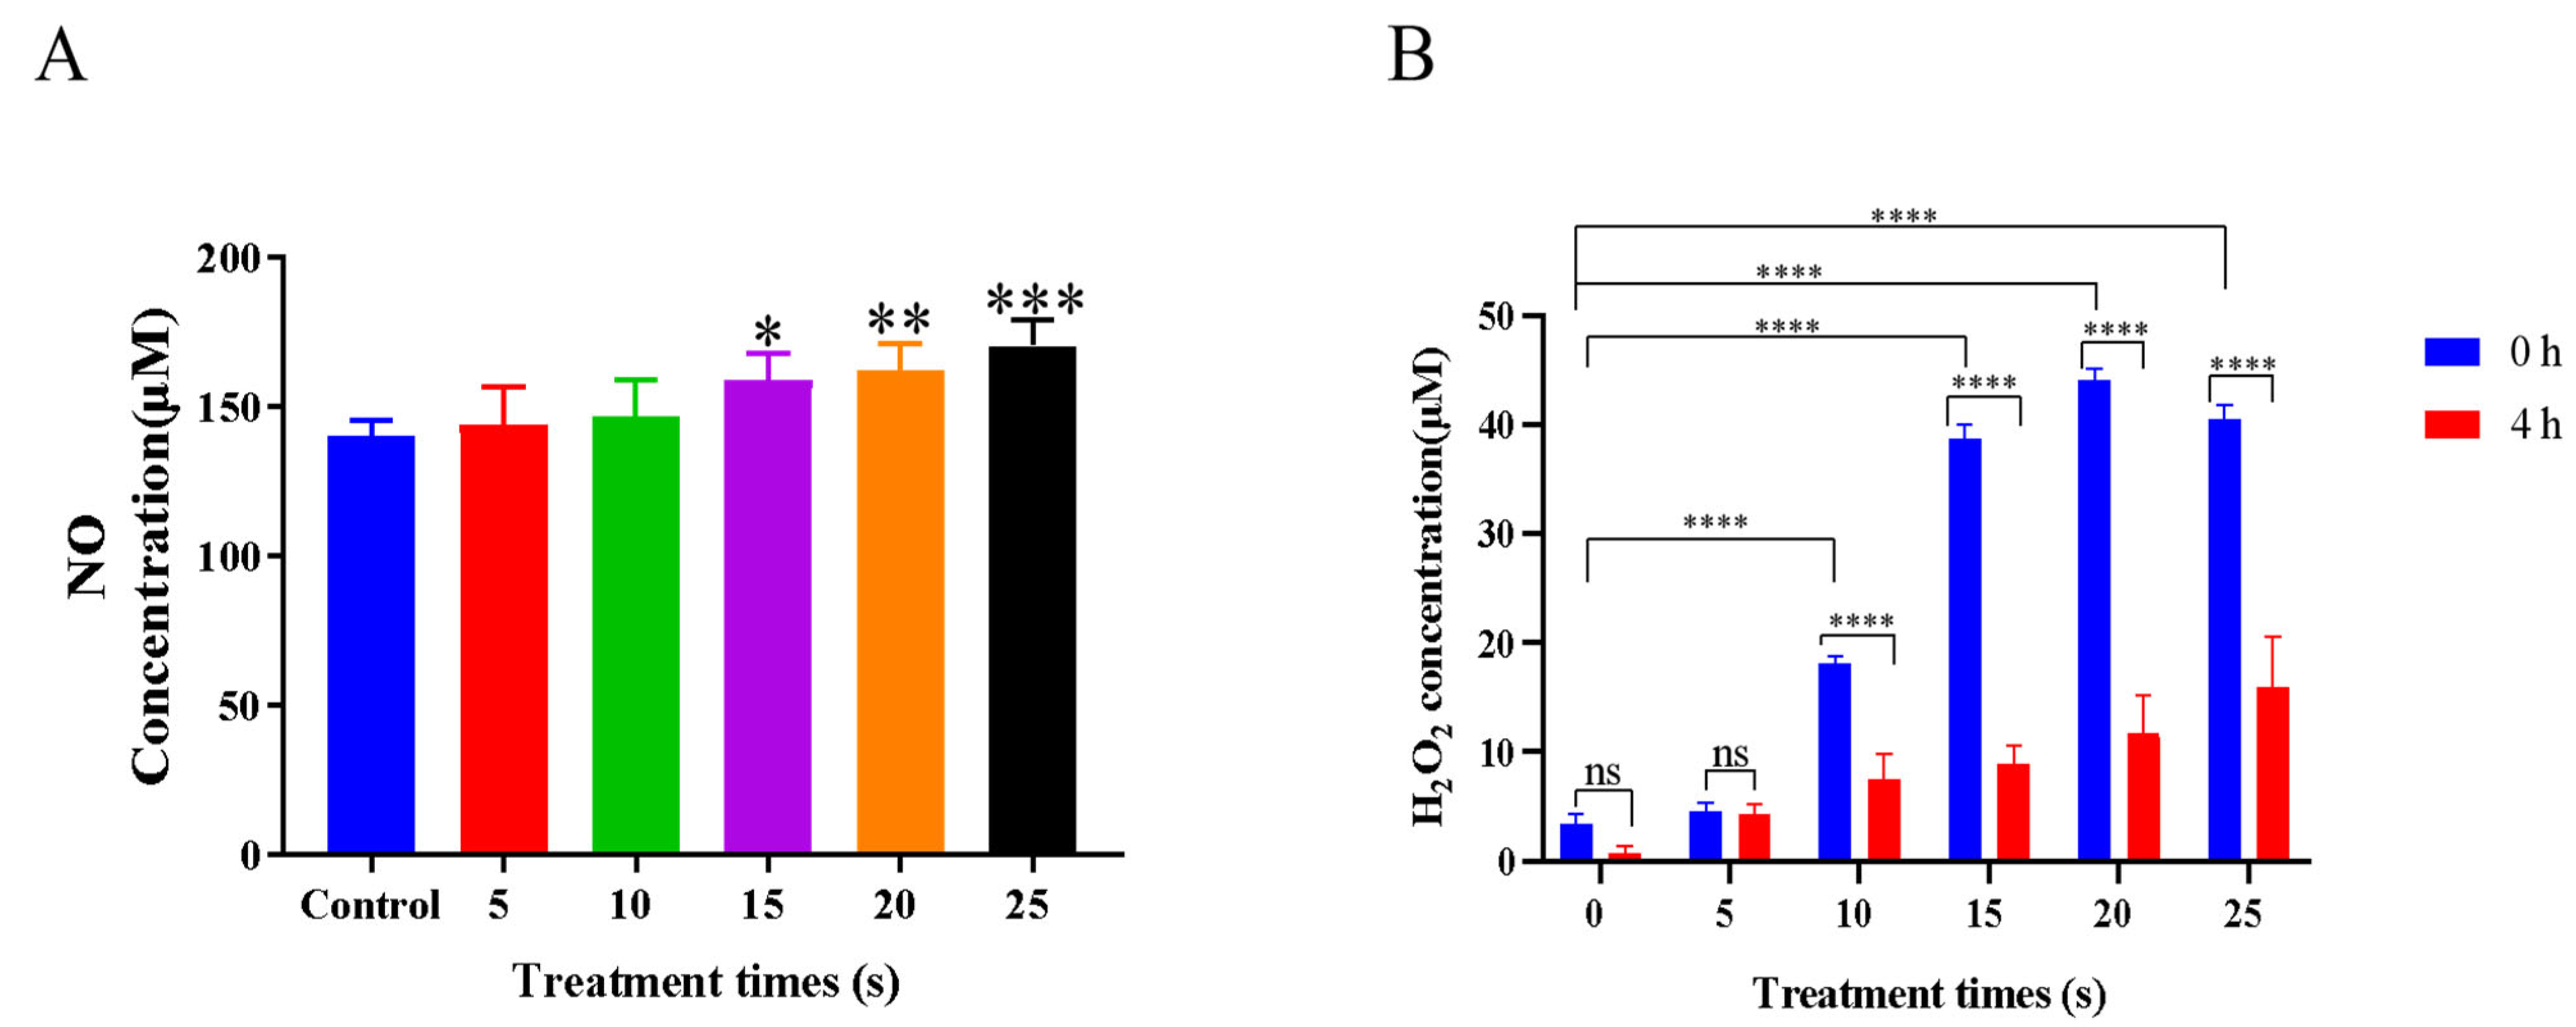
3.2. Effects of NTP Treatment on Extracellular Reactive Species Generation

The contents of NO and H2O2 in the culture medium were measured immediately after NTP treatment. As mediators of many physiological activities, the contents of NO and H2O2 in the medium increased in a dose-dependent manner with the increase in plasma treatment time (Figure 2A,B). H2O2 concentrations in each treatment group after 4 h incubation were lower than that of 0 h incubation after NTP treatment (Figure 2B). Therefore, it suggested that extracellular ROS might enter the cell and play a role in promoting cell viability.
Previous studies have confirmed that NTP enhances the formation of neovascularization in burn wounds by regulating the endothelial NO synthase signaling pathway [41]. The promoting role of NO airflow generated by plasma in wound healing was also demonstrated [42]. In addition, cancer cells were more sensitive to plasma-induced RONS (especially nitric oxide (NO) and nitrogen dioxide (NO2) radicals) compared with normal cells, and the apoptotic response induced by plasma mainly occurred in cancer cell [43]. For normal cells, ROS produced by low-dose NTP in the culture medium promotes fibroblast proliferation while high doses inhibited it [18]. In addition, high levels of ROS produced by Erianin inhibited the proliferation and induced apoptosis of HaCaT cells [44]. In our experiment, with the increase in plasma treatment time, the concentration of ROS in the culture medium increased in a time-dependent manner and decreased significantly after 4 h of incubation, and the cell viability reached its peak after 15 s of treatment. Therefore, we believed that ROS produced by low-dose NTP might enter the cells from the outside, which promoted the vitality of HaCaT cells, while ROS produced by high-dose NTP may inhibit this effect because excessive ROS reduces cell viability.

3.3. Effects of NTP Treatment on Intracellular Reactive Species Generation

Similarly, we used an ROS detection kit containing DCFH-DA fluorescent probes (Beyotime, Shanghai) to detect the ROS entering the cell for 4 h incubation after NTP treatment. Unlike the results of Shi et al. (25 s and 30 s treatment groups showed a substantial decrease in intracellular ROS content) [18], our study found that the intracellular ROS increased in a time-dependent manner with the extension of plasma treatment time compared with the control group (Figure 3A,B), which was in agreement with a time-dependent increase in the preceding extracellular ROS. Furthermore, the ROS effect validation experiment (Figure 1B) found that the cell viability of the NTP-treated group was similar to that of the control group. Therefore, combined with the drastic reduction in ROS in the culture medium for 4 h after NTP treatment, we concluded that the entry of low levels of extracellular ROS into the cells promoted cell viability.
H2O2 was an important component of ROS produced by NTP. In a previous study, low-dose H2O2 in honey entered cells through aquaporin 3 to exert a wound healing effect [45], and ROS produced by low-dose NTP have been shown to promote fibroblast proliferation [18] and wound angiogenesis [24]. However, high concentrations of ROS produced by erianin inhibited the proliferation of HaCaT cells [44] and induced their apoptosis. In addition, ROS produced by high-dose NTP had an anti-tumor effect [46]. In this paper, our findings showed a time-dependent increase in intracellular ROS concentration with prolonged NTP treatment, consistent with the increasing trend of ROS concentration in the assay medium. Therefore, ROS generated by low-dose NTP acted as cell messengers within the cell and played a role in promoting cell viability, while ROS generated by high-dose NTP inhibited HaCaT cell viability, which was consistent with the results of previous studies [18,24,46]. However, the specific mechanism of ROS produced by NTP entering HaCaT cells to exert their effects remained to be further explored.

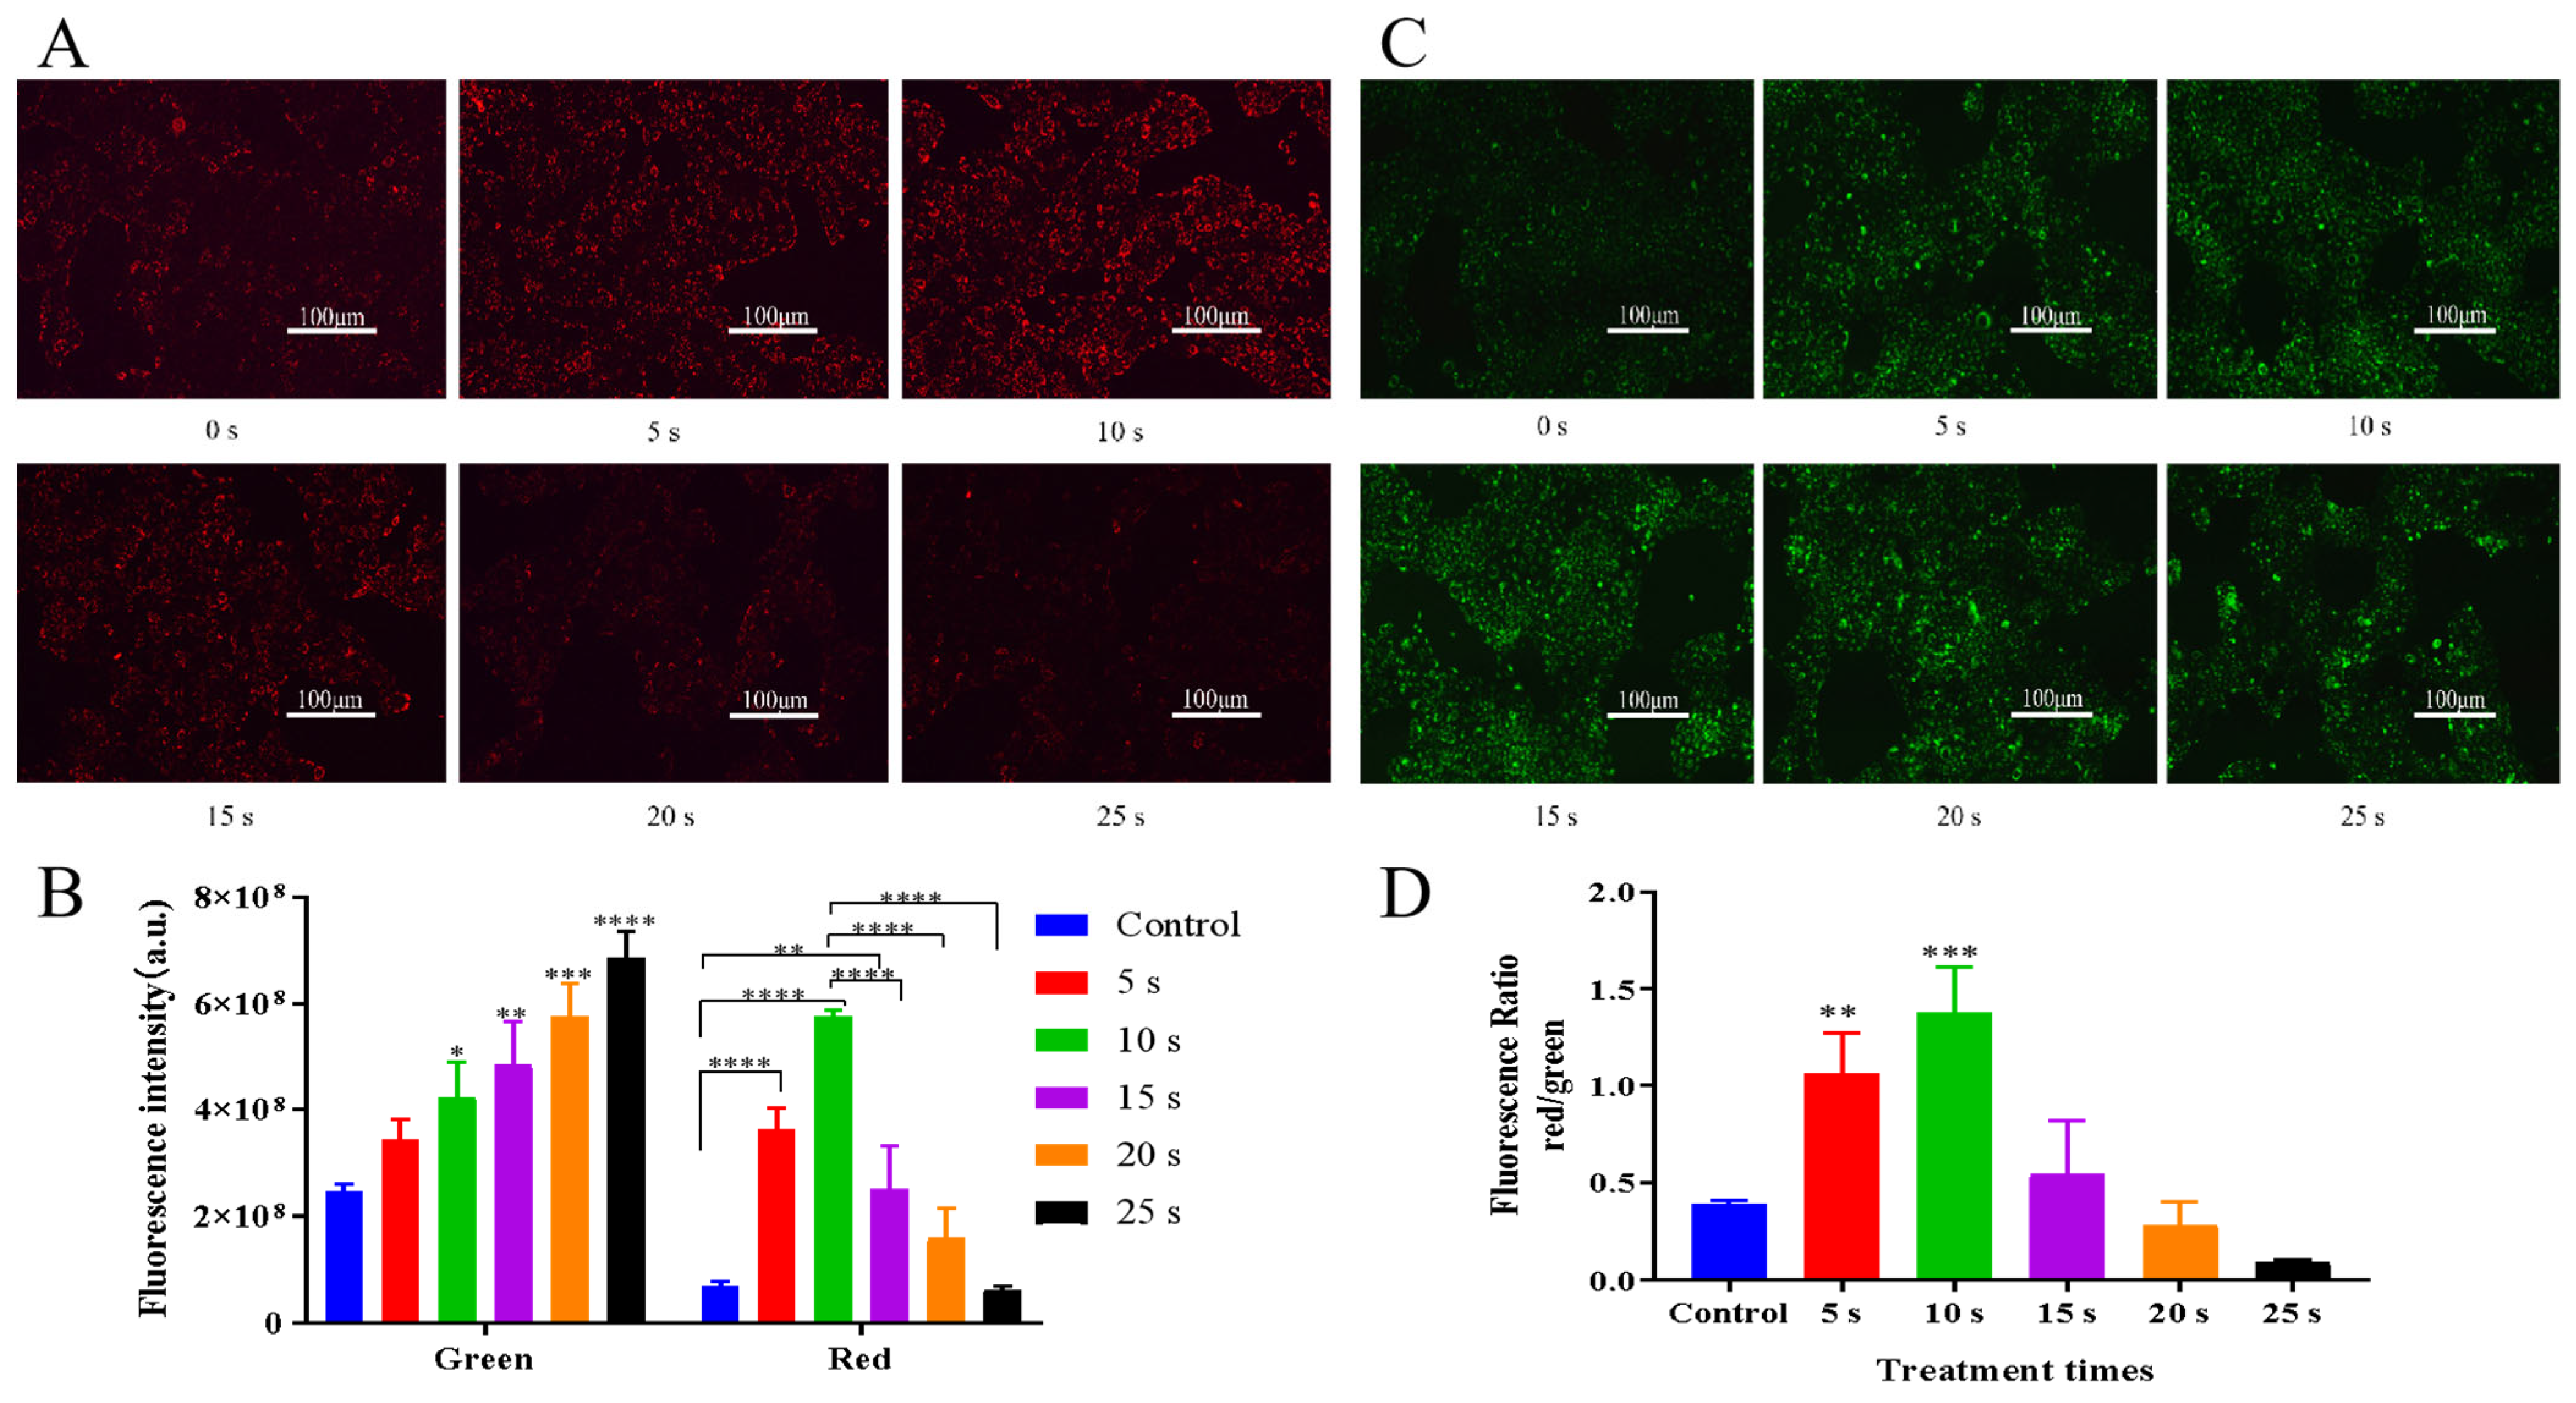
3.4. Effects of NTP Treatment on Mitochondrial Membrane Potential

The proportion of red and green fluorescence in the 5 s and 10 s treatment groups was significantly higher compared with the control group (Figure 4D). The results here were consistent with previous cell viability results, indicating that the cells were in good condition (Figure 4A,B) and a short period of NTP treatment was beneficial to the cells. With the further prolongation of treatment time, the red-green fluorescence ratios of the 20 s and 25 s treatment groups decreased sharply (Figure 4B–D), suggesting that high-dose NTP treatment was not conducive to the cells, which significantly reduced the intracellular mitochondrial membrane potential of HaCaT cells. According to the previous research results, we believe that intracellular ROS generated by low-dose NTP promoted cell viability by increasing intracellular mitochondrial membrane potential, while ROS generated by high-dose NTP induced early apoptosis and inhibited cell viability by reducing intracellular mitochondrial membrane potential.
The decrease in cell mitochondrial membrane potential can be used as an indicator of early apoptosis. The mitochondria are the main sites for ROS production, and the study has shown that tungstate-induced mitochondrial dysfunction is related to the increase in ROS produced by mitochondria [47]. In addition, the decrease in mitochondrial membrane potential in BEAS-2B cells was also closely related to intracellular ROS accumulation, and the decrease in mitochondrial membrane potential led to the increase in the apoptosis rate [48]. Compared with the control group, the red-green fluorescence ratio of JC-1 was increased after low-dose NTP treatment, indicating that the intracellular ROS content did not damage the intracellular mitochondria at this time, and it might promote the viability of HaCaT cells by promoting the function of the respiratory chain of intracellular mitochondria. On the contrary, the proportion of red-green fluorescence was significantly decreased after high-dose NTP treatment, indicating that the intracellular ROS content was too high, which destroyed the intracellular mitochondria, induced early apoptosis and inhibited cell viability.

3.5. Effects of NTP Treatment on Cell Migration

In order to further explore the effect of NTP treatment on the migration ability of HaCaT cells, the cell scratch test was used to detect the migration ability of HaCaT cells. Compared with the control group, the cell scratch areas in the 15 s treatment group were significantly reduced at 4 h and 24 h after NTP treatment, and the areas in the 10 s treatment group were nearly completely closed after incubation for 24 h. However, we also observed that with the extension of treatment time, the scratch area of cells in the 20 s and 25 s treatment groups did not change significantly (Figure 5A,B). To further verify the results of the scratch test described above, we performed a cell migration test using transwell. Consistent with the scratch test results, the number of cell migrations was significantly greater in the 10 s treatment group than in the control group, and was less for the 25 s treatment group (Figure 5C,D). Therefore, low-dose NTP promoted the migration of HaCaT cells, while high-dose NTP inhibited the migration of HaCaT cells after NTP treatment.
Wound healing was a complex process with the purpose of restoring skin function. Skin regeneration involved the proliferation and migration of HaCaT cells. Therefore, the migration of HaCaT cells to the wound site was extremely important for wound healing, and many studies have demonstrated the migratory ability of HaCaT cells [49,50]. For instance, Se-methylselenocysteine stimulates the migration of HaCaT cells [51]. NTP was often used to inhibit the migration of cancer cells [52], but there were few reports suggesting that it promotes HaCaT cell migration. Therefore, we attempted to explore the migration effect of NTP treatment on HaCaT cells. Encouragingly, both cell scratch and transwell experiments showed that low-dose NTP treatment promoted cell migration, while high-dose NTP treatment inhibited cell migration. For migration, intracellular ROS often showed inhibition on cancer cells [53]. However, our results showed that ROS generated by low-dose NTP promoted the migration of HaCaT cells, which was consistent with the results of previous cell viability measurements. The specific mechanism remains to be further explored.

3.6. Effects of NTP Treatment on Cell Cycle

To further elucidate the mechanism of NTP stimulating cell proliferation, flow cytometry was used to examine the cell cycle. Compared with the control group, the results showed that the number of S-phase cell in the 10 s NTP treatment group (25.25%) was significantly higher than that in the control group (18.23%), and the result from the 5 s NTP treatment group (19.38%) was also slightly higher than that of the control group. With increased in NTP treatment time, the cycle phase of treated cells was gradually increased. The number of S-phase cell in the 15 s treatment group (4.72%) suddenly decreased, and M-phase cells increased significantly from the 15 s treatment group (54.6%) to the 25 s treatment group (83.5%) in a dose-dependent manner (Figure 6A,B), which showed that low-dose NTP treatment (10 s) promoted the proliferation of HaCaT cells by increasing the proportion of S-phase cells, while high-dose NTP advanced the cell cycle progress, arrested cells in the G2/M phase, and inhibited cell proliferation.
Moreover, ROS produced by low-dose NTP promoted the proliferation of fibroblasts by promoting the transition from G1 to S phase [38], while ROS produced by high-dose NTP tended to arrest cells in the G2/M phase and fought cancer [54]. The G2/M phase arrest of cells might be due to DNA damage, which initiated cell cycle checkpoints to prevent mitosis [55]. In our study, the results showed that the number of cells int the S phase gradually increased in the 5 s and 10 s treatment groups compared with the control group. However, when the NTP treatment time increased to 15 s, the number of S phase cells suddenly decreased, and the number of G2/M phase cells gradually increased with the increase in the treatment time. The decrease in S phase cells after NTP treatment of HaCaT cells for 15 s seemed to be inconsistent with the overall result in the article. However, we could see that although the number of cells in the G2/M phase increased sharply after NTP treatment of 15 s, the increase in cells in the G2 phase was more significant, suggesting that NTP treatment of cells for 15 s might promote the process of cell division and thus cell proliferation, which is consistent with the overall result in the article. In addition, compared with the NTP 15 s treatment group, the M-stage cells in the 20 s treatment group and the 25 s treatment group were significantly increased (Figure 6), suggesting that the cells might be blocked in the cell division stage at this time, and the cells stayed in the cell division stage and did not continue to divide, thus cell proliferation was inhibited. Therefore, ROS generated by low-dose NTP promoted the proliferation of HaCaT cells, while ROS generated by high-dose NTP blocked the cells in the G2/M phase and inhibited cell proliferation.

3.7. NTP Activated the PI3K/AKT and STAT3 Pathways in HaCaT Cells

Subsequently, the specific mechanism of NTP promoting cell proliferation was further explored. The expression of PI3K, AKT, mTOR, Cyclin D1, ERK, and STAT3 were detected by WB, and results showed that the expression levels of PI3K, AKT, mTOR, and ERK reached the peak in the 15 s NTP treatment group while the expression levels of Cyclin D1 and STAT3 peaked in the 10 s NTP treatment group compared with the control group. However, the expression levels of all proteins gradually decreased with the further extension of NTP treatment time (Figure 7A–D). Therefore, we suggested that low-dose NTP treatment promoted cell proliferation by activating the PI3K/AKT/mTOR signaling pathway, whereas high-dose NTP inhibited cell proliferation by inhibiting this pathway. In addition, the expression of STAT3 and Cyclin D1 also suggested that NTP might activate the JAK/STAT3 pathway and promote cell proliferation.
To date, it has been frequently reported that low-dose NTP treatment promotes wound healing by stimulating HaCaT cell proliferation [38,56]. However, the specific mechanism of NTP promoting cell proliferation was not very clear. The PI3K/AKT/mTOR signaling pathway was the key pathway for cell proliferation, and its expression was significantly increased in proliferating HaCaT cells [35,40,50]. In addition, studies had shown that ROS played an important role in the PI3K/AKT/mTOR signaling pathway [52]. In this study, the intracellular ROS level increased in a time-dependent manner, while the expression levels of PI3K, AKT, mTOR, and ERK reached the peak at 15 s, which indicated that ROS produced by low-dose NTP activated this signaling pathway while ROS produced by high-dose inhibited it. Studies have shown that Cyclin D1 was a key protein regulating the G1 phase of the cell cycle [57]. The results here were consistent with the cell cycle results mentioned above, so ROS produced by low-dose NTP stimulated the G1-to-S cycle transition of HaCaT cells and thus promoted cell proliferation by promoting the expression of Cyclin D1. Furthermore, the increasing expression of STAT3 was also confirmed to be closely related to the proliferation of HaCaT cells [58]. Therefore, ROS produced by low-dose NTP might also activate the expression of JAK/STAT3 pathway proteins and promote the proliferation of HaCaT cells.

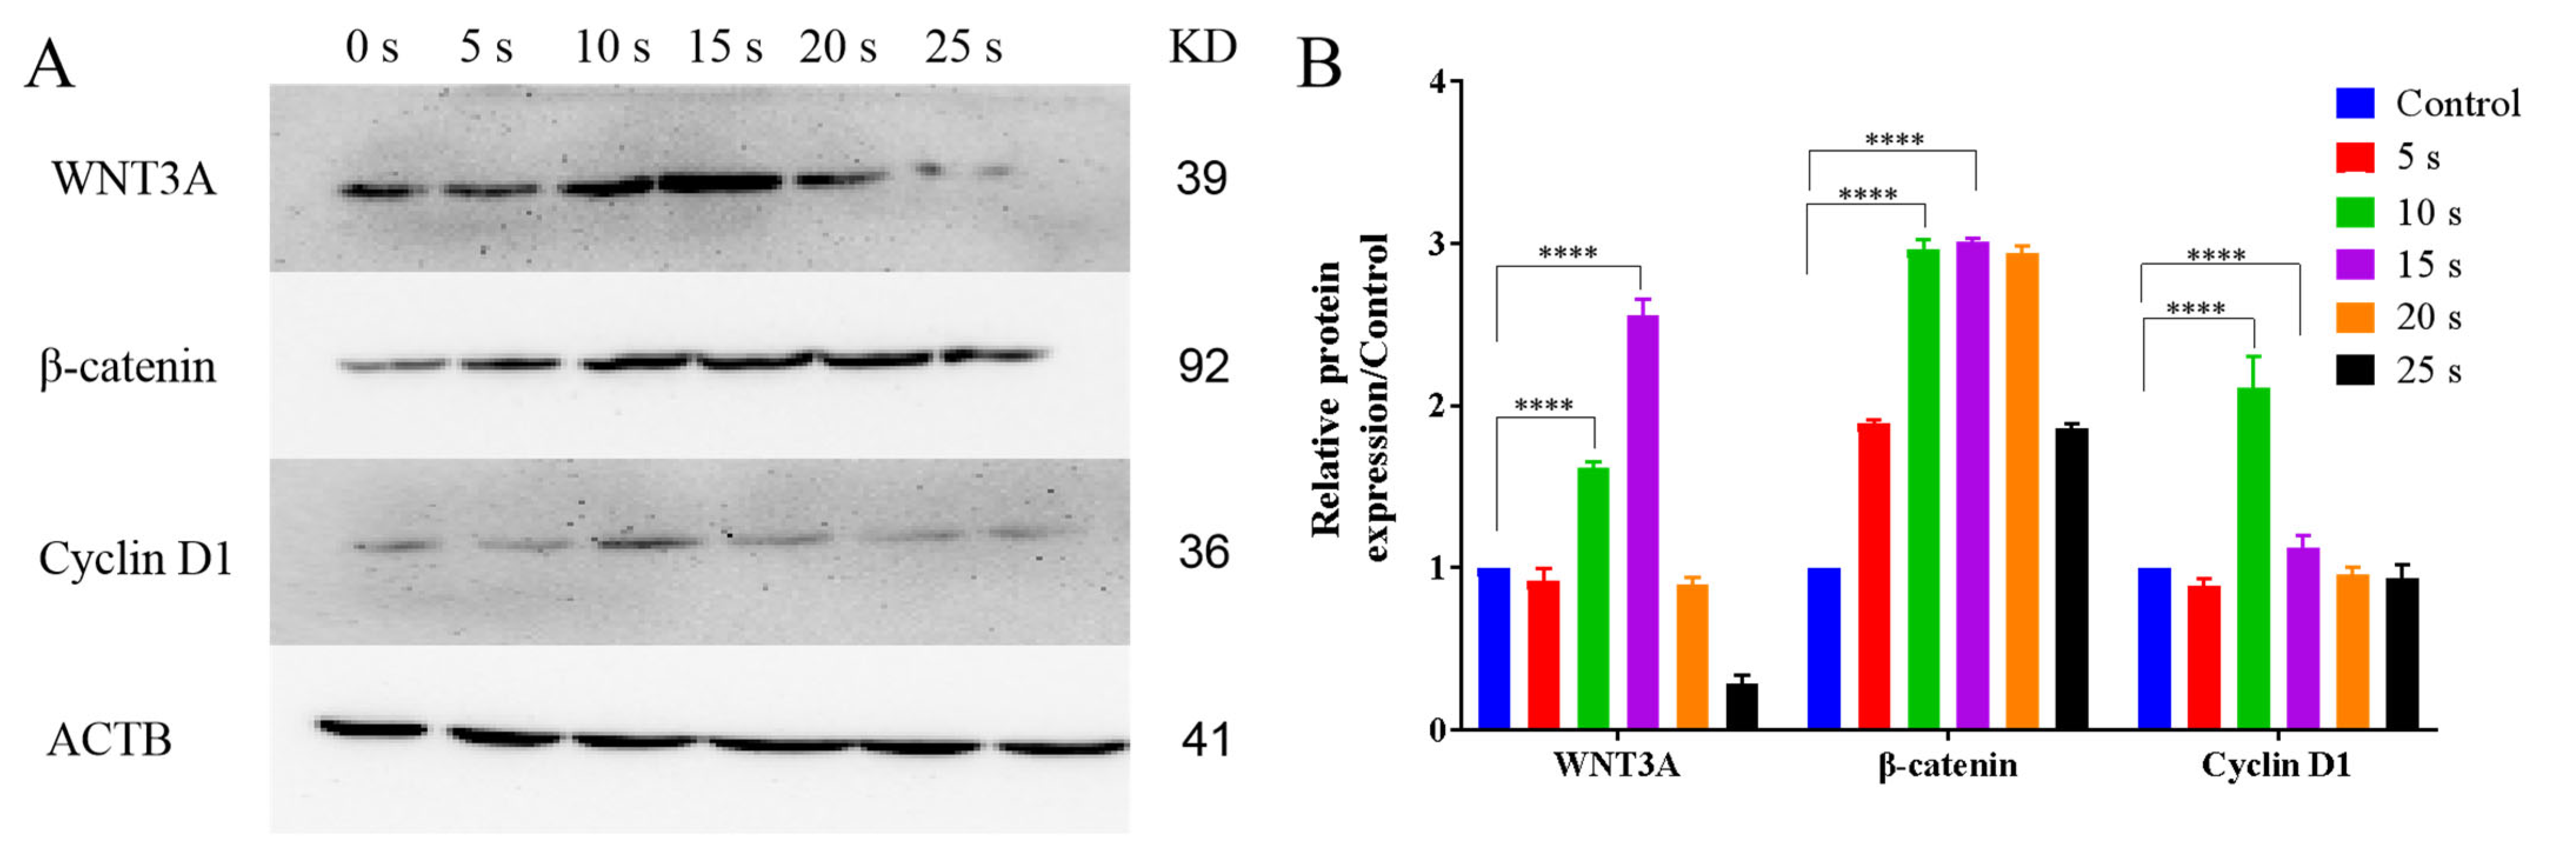
3.8. NTP Activated the WNT3A/β-Catenin Pathways in HaCaT Cells

In addition to the scratch test and transwell test, we also used WB test to further study the mechanism of NTP promoting cell migration. Results showed that the expression of WNT3A and β-catenin reached the peak in the 15 s NTP treatment group, while the expression of Cyclin D1 reached the peak in the 10 s NTP treatment group, the expression of all proteins gradually decreased with further extension of NTP treatment time (Figure 8A,B). Therefore, we also concluded that low-dose NTP might promote HaCaT cell migration by activating the WNT/β-catenin pathway, while high-dose NTP inhibits it by inhibiting this pathway.
The WNT/β-catenin signaling pathway was an important intracellular activation pathway for cell migration, and studies had shown that the expression levels of protein related to this signaling pathway were also significantly increased in HaCaT cells with promoted migration levels [36,59,60]. In this study, the results showed increased WNT3A and β-catenin protein expression in the NTP low-dose treatment group and decreased WNT3A and β-catenin protein expression in the NTP high-dose treatment group. In addition, it has been shown that ROS were involved in activating the WNT/β-catenin pathway [61]. Therefore, we can conclude that ROS produced by low-dose NTP may promote the migration of HaCaT cells by activating the WNT/β-catenin signaling pathway, while ROS produced by high-dose NTP may inhibit the migration of HaCaT cells by inactivating the WNT/β-catenin signaling pathway.

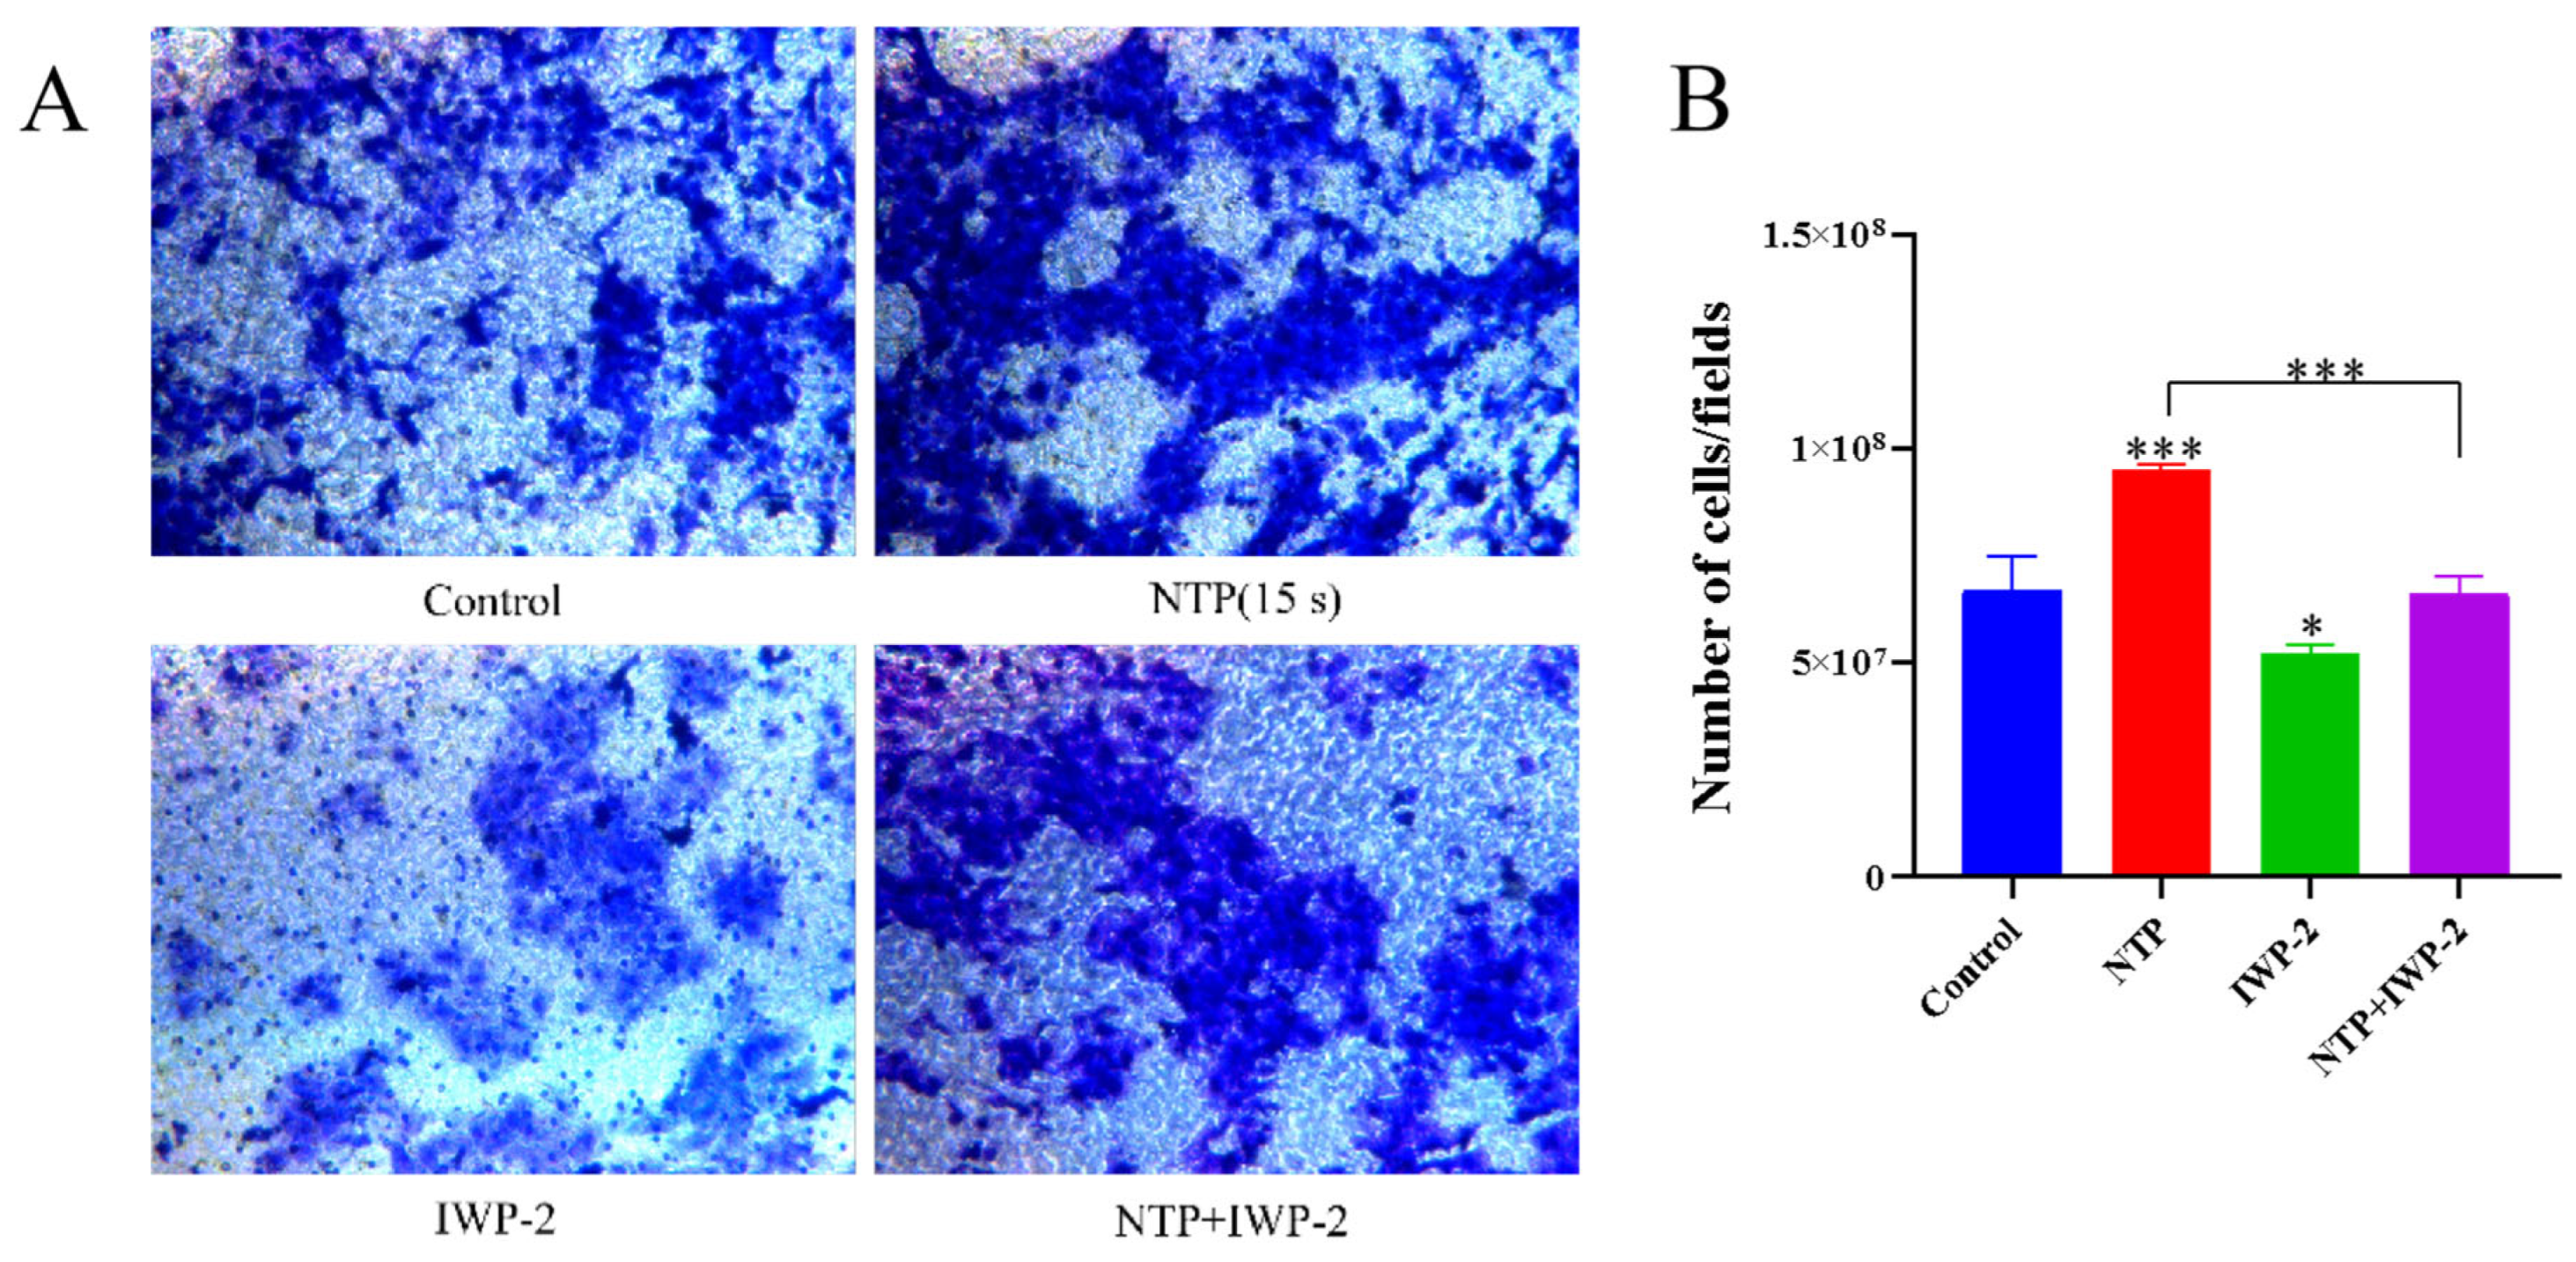
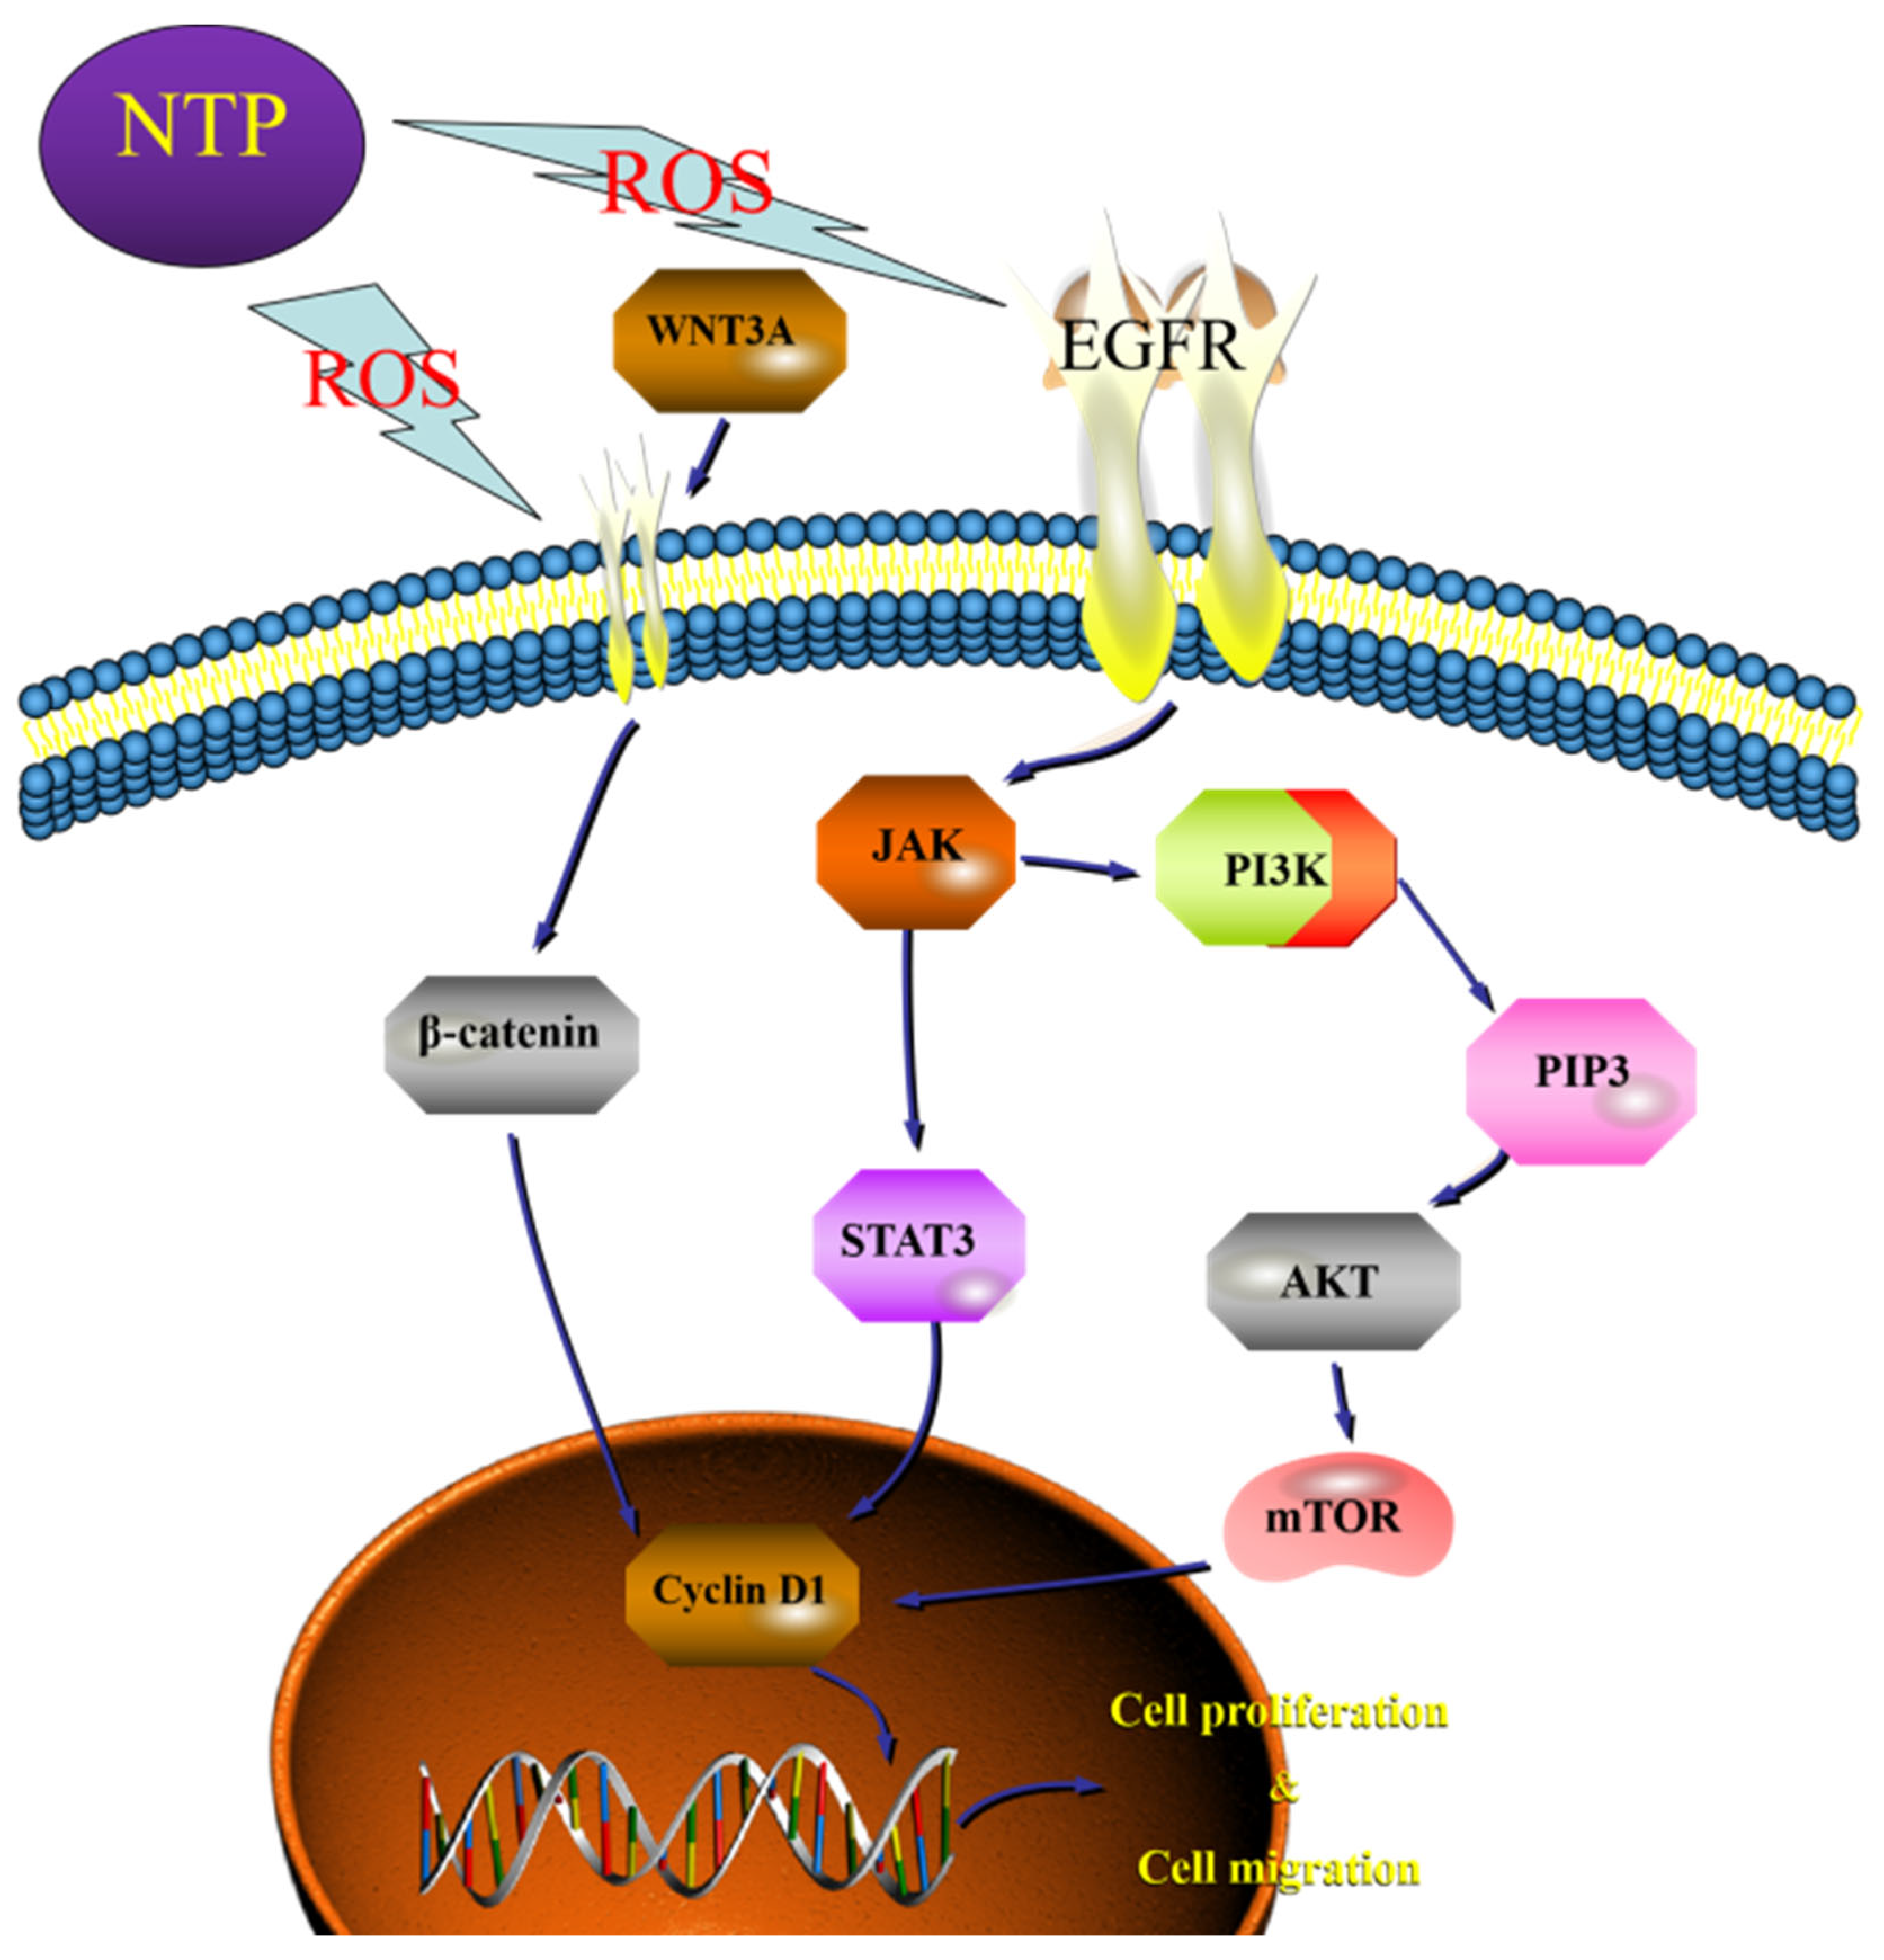
3.9. Low-Dose ROS Promotes HaCaT Cell Proliferation and Migration by Activating the PI3K/AKT and Wnt/β-Catenin Pathways

We also explored the effects of the PI3K/AKT pathway inhibitor LY294002 on the activity of HaCaT cells and the effect of the Wnt/β-catenin pathway inhibitor IWP-2 on the migration ability of HaCaT cells. An MTT assay showed that the cell viability of the NTP-treated group was significantly higher than that of the control group. The inhibitor LY294002-pretreated group showed significantly reduced cell viability compared with the NTP-treated group (Figure 1C). In addition, the results of the Transwell experiment showed that the number of migrated cells in the NTP treatment group was significantly higher than that in the control group. The number of migrated cells was significantly reduced in the inhibitor IWP-2-pretreated group when compared with the NTP-treated group (Figure 9A,B). To further explore whether short-term NTP treatment (15 s) promoted the proliferation and migration of HaCaT cells through the low-dose ROS-generated activation of PI3K/AKT and Wnt/β-catenin pathways, expressions of AKT and β-catenin phosphorylation were also detected by using a WB experiment. The results showed that the phosphorylated expressions of AKT and β-catenin in the NTP treatment group were significantly higher than those in the control group. In addition, phosphorylation was significantly reduced in the NAC-pretreated group when compared with the NTP-treated group (Figure 9C,D). In conclusion, the above results indicated that short-term NTP treatment (15 s) promoted the proliferation and migration of HaCaT cells through the generation of low-dose ROS that activated PI3K/AKT and Wnt/β-catenin pathways (Figure 10).
Studies have shown that cells show different cell states and fates to different concentrations of H2O2 [3,62]. For nerve cells, at levels below 1 nM H2O2, cell growth is slow and development and regeneration are impaired. In addition, the cells tended to be in a resting state with no tendency to proliferate and differentiate. When the nerve cells were exposed to H2O2 in the range of 1–10 nM, the growth of axons and dendrites was promoted. It was mainly because the cells produced oxidative stress under this H2O2 concentration, which stimulated the proliferation and differentiation of cells. In addition, the study also showed that a modest increase in H2O2 concentration (up to about 100 nM) further promoted dendritic growth. Abnormally high H2O2 (more than 100 nM) can lead to the death of nerve cells and tissue degradation [3].
It is well known that the proliferation and migration of HaCaT cells is essential to promote clinical wound healing. In this study, NTP directly acted on HaCaT cells for 10 s or 15 s to promote their proliferation and migration, showing that NTP directly acts on such wounds as clinical diabetic ulcer wounds [11] and burn wounds [41] to promote their healing by promoting the proliferation and migration of HaCaT cells. In addition, results showed that treatment of cells with NTP for 20 s or 25 s inhibited cell proliferation and migration, which also made NTP potentially applicable to diseases such as psoriasis [63] and melanoma [64]. Although the difference was only more than ten seconds, the reaction of cells to it was not the same. The plasma device finally applied to clinical practice must undergo repeated improvement and testing. Our experiment here was only to explore the impact of NTP on the cell level. It was only a preliminary study, which was different from the final clinical application of NTP. In addition, the sensitivity of cells and tissues to plasma is different because tissues also contain many other kinds of cells and substances. NTP treatment of tissues was the result of a comprehensive effect. Therefore, the time for NTP treatment of cells was relatively short, and the time for final treatment of clinical tissues was definitely relatively long. Compared with the characteristics of small discharge intensity and accurate treatment of the plasma jet, the plasma dielectric barrier discharge device we used had the characteristics of large discharge intensity and wide treatment range, and could process multiple samples at the same time [4]. In addition, our current NTP device was an experimental device and was not suitable for use in patients, and further research is required. In the future, we will manufacture an automatic NTP device with a timer, which can provide specific treatment times according to different conditions of diseases, such as wounds or skin diseases, and different treatment areas, and can also target different wound conditions by adjusting other parameters of the device, such as the flow rate of gas, the type of gas, or a mixture of gases in different proportions, so as to provide more accurate treatment. There still are some shortcomings in our experimental results. Next, we need to conduct a large number of animal experiments and clinical trials before NTP can be finally applied to clinical practice.

4. Conclusions

This study reported the effects of NTP treatment on the proliferation and migration of HaCaT cells. With the increase in NTP treatment time, the intracellular ROS and extracellular RONS levels of HaCaT cells increased in a time-dependent manner. The cell viability, expression of PI3K, AKT, mTOR, ERK, WNT3A, and β-catenin proteins peaked in the 15 s NTP treatment group, while the G1-S phase-change cell proportion, cell migration ability, and expression of STAT3 and Cyclin D1 proteins in HaCaT cells peaked in the 10 s NTP treatment group. However, the high-dose NTP treatment group exhibited significantly decreased cell viability, significantly decreased mitochondrial membrane potential and blocked G2/M cycle, which also increased apoptosis, and inhibited cell migration. In addition, ROS produced by NTP played an important role in cell proliferation. Therefore, this study showed that ROS generated by low-dose NTP promote the proliferation and migration of HaCaT cells by activating the PI3K/AKT/mTOR pathway and WNT/β-catenin pathway, while ROS generated by high-dose NTP inhibit the proliferation and migration of HaCaT cells by inhibiting these pathways. In conclusion, the results of this study provided useful theoretical support for the treatment of wound healing with low-dose NTP.

Author Contributions

Conceptualization, H.W., Y.Z. (Yan Zhang), W.S. and J.C.; methodology, H.W. and Z.Y.; software, H.W.; validation, Y.Z. (Yan Zhang) and Y.Z. (Yuanyuan Zhou); data curation, H.W.; writing—original draft preparation, H.W.; writing—review and editing, W.S.; supervision, W.S., T.L. and J.C.; funding acquisition, W.S. and J.C. All authors have read and agreed to the published version of the manuscript.

Funding

This research was funded by the National Natural Science Foundation of China (21876179 and 82104454), China Postdoctoral Science Foundation (2020T130117ZX, 2020M671914 and 2020B470), and the Natural Science Foundation of Anhui Province (Grant No. 2108085QH376).

Institutional Review Board Statement

Not applicable.

Informed Consent Statement

Not applicable.

Data Availability Statement

Not applicable.

Conflicts of Interest

The authors declare no conflict of interest.

References

  1. Adhikari, B.R.; Khanal, R. Introduction to the Plasma State of Matter. Himal. Phys. 2013, 4, 60. [Google Scholar] [CrossRef] [Green Version]
  2. Weltmann, K.D.; Kindel, E.; Brandenburg, R.; Meyer, C.; Bussiahn, R.; Wilke, C.; von Woedtke, T. Atmospheric Pressure Plasma Jet for Medical Therapy: Plasma Parameters and Risk Estimation. Contrib. Plasma Phys. 2009, 49, 631–640. [Google Scholar] [CrossRef]
  3. Sies, H.; Jones, D.P. Reactive oxygen species (ROS) as pleiotropic physiological signalling agents. Nat. Rev. Mol. Cell Biol. 2020, 21, 363–383. [Google Scholar] [CrossRef] [PubMed]
  4. Yan, D.; Sherman, J.H.; Keidar, M. Cold atmospheric plasma, a novel promising anti-cancer treatment modality. Nontarget 2017, 8, 15977–15995. [Google Scholar] [CrossRef] [Green Version]
  5. Guo, B.; Pomicter, A.D.; Li, F.; Bhatt, S.; Chen, C.; Li, W.; Qi, M.; Huang, C.; Deininger, M.W.; Kong, M.G.; et al. Trident cold atmospheric plasma blocks three cancer survival pathways to overcome therapy resistance. Proc. Natl. Acad. Sci. USA 2021, 118, e2107220118. [Google Scholar] [CrossRef]
  6. Shahbazi Rad, Z.; Abbasi Davani, F.; Etaati, G. Determination of proper treatment time for in vivo blood coagulation and wound healing application by non-thermal helium plasma jet. Australas. Phys. Eng. Sci. Med. 2018, 41, 905–917. [Google Scholar] [CrossRef]
  7. Eggers, B.; Stope, M.B.; Marciniak, J.; Marciniak, J.; Mustea, A.; Deschner, J.; Nokhbehsaim, M.; Kramer, F.J. Modulation of Inflammatory Responses by a Non-Invasive Physical Plasma Jet during Gingival Wound Healing. Cells 2022, 11, 2740. [Google Scholar] [CrossRef]
  8. Sarthak, D.; Veda, P.G.; Sarita, M.; Gagandeep, S.; Satyananda, K. Role of cold atmospheric plasma in microbial inactivation and the factors affecting its efficacy. Health Sci. Rev. 2022, 4, 100037. [Google Scholar] [CrossRef]
  9. Zhai, S.; Xu, M.; Li, Q.; Guo, K.; Chen, H.; Kong, M.G.; Xia, Y. Successful Treatment of Vitiligo with Cold Atmospheric Plasma—Activated Hydrogel. J. Invest. Dermatol. 2021, 141, 2710–2719.e6. [Google Scholar] [CrossRef]
  10. Kang, S.U.; Choi, J.W.; Chang, J.W.; Kim, K.; Kim, Y.S.; Park, J.K.; Kim, Y.E.; Lee, Y.S.; Yang, S.S.; Kim, C.H. N2 non-thermal atmospheric pressure plasma promotes wound healing in vitro and in vivo: Potential modulation of adhesion molecules and matrix metalloproteinase-9. Exp. Dermatol. 2017, 26, 163–170. [Google Scholar] [CrossRef]
  11. Stratmann, B.; Costea, T.C.; Nolte, C.; Nolte, C.; Hiller, J.; Schmidt, J.; Reindel, J.; Masur, K.; Motz, W.; Timm, J.; et al. Effect of Cold Atmospheric Plasma Therapy vs Standard Therapy Placebo on Wound Healing in Patients with Diabetic Foot Ulcers: A Randomized Clinical Trial. JAMA Netw. Open. 2020, 3, e2010411. [Google Scholar] [CrossRef]
  12. Brun, P.; Bernabè, G.; Marchiori, C.; Scarpa, M.; Zuin, M.; Cavazzana, R.; Zaniol, B.; Martines, E. Antibacterial efficacy and mechanisms of action of low power atmospheric pressure cold plasma: Membrane permeability, biofilm penetration and antimicrobial sensitization. J. Appl. Microbiol. 2018, 125, 398–408. [Google Scholar] [CrossRef]
  13. Guo, S.; Dipietro, L.A. Factors affecting wound healing. J. Dent. Res. 2010, 89, 219–229. [Google Scholar] [CrossRef]
  14. Fouché, M.; Willers, C.; Hamman, S.; Malherbe, C.; Steenekamp, J. Wound Healing Effects of Aloe muth-muth: In Vitro Investigations Using Immortalized Human Keratinocytes (HaCaT). Biology 2020, 9, 350. [Google Scholar] [CrossRef]
  15. Catanzano, O.; Quaglia, F.; Boateng, J.S. Wound dressings as growth factor delivery platforms for chronic wound healing. Expert Opin. Drug Deliv. 2021, 18, 737–759. [Google Scholar] [CrossRef]
  16. Koo, M.A.; Hee Hong, S.; Hee Lee, M.; Kwon, B.J.; Mi Seon, G.; Sung Kim, M.; Kim, D.; Chang Nam, K.; Park, J.C. Effective stacking and transplantation of stem cell sheets using exogenous ROS-producing film for accelerated wound healing. Acta Biomater. 2019, 95, 418–426. [Google Scholar] [CrossRef]
  17. Nilforoushzadeh, M.A.; Afzali, H.; Raoofi, A.; Nouri, M.; Naser, R.; Gholami, O.; Nasiry, D.; Mohammadnia, A.; Razzaghi, Z.; Alimohammadi, A.; et al. Topical spray of Wharton’s jelly mesenchymal stem cells derived from umbilical cord accelerates diabetic wound healing. J Cosmet Dermatol. 2022, 21, 5156–5167. [Google Scholar] [CrossRef]
  18. Shi, X.M.; Xu, G.M.; Zhang, G.J.; Liu, J.R.; Wu, Y.M.; Gao, L.G.; Yang, Y.; Chang, Z.S.; Yao, C.W. Low-temperature Plasma Promotes Fibroblast Proliferation in Wound Healing by ROS-activated NF-κB Signaling Pathway. Curr. Med. Sci. 2018, 38, 107–114. [Google Scholar] [CrossRef]
  19. Arndt, S.; Unger, P.; Berneburg, M.; Bosserhoff, A.K.; Karrer, S. Cold atmospheric plasma (CAP) activates angiogenesis-related molecules in skin keratinocytes, fibroblasts and endothelial cells and improves wound angiogenesis in an autocrine and paracrine mode. J. Dermatol. Sci. 2018, 89, 181–190. [Google Scholar] [CrossRef]
  20. Frescaline, N.; Duchesne, C.; Favier, M.; Onifarasoaniaina, R.; Guilbert, T.; Uzan, G.; Banzet, S.; Rousseau, A.; Lataillade, J.J. Physical plasma therapy accelerates wound re-epithelialisation and enhances extracellular matrix formation in cutaneous skin grafts. J. Pathol. 2020, 252, 451–464. [Google Scholar] [CrossRef]
  21. Yu, Y.; Tan, M.; Chen, H.; Wu, Z.; Xu, L.; Li, J.; Cao, J.; Yang, Y.; Xiao, X.; Lian, X.; et al. Non-thermal plasma suppresses bacterial colonization on skin wound and promotes wound healing in mice. J. Huazhong Univ Sci. Technol. Med. Sci. 2011, 31, 390–394. [Google Scholar] [CrossRef] [PubMed]
  22. Kalghatgi, S.; Friedman, G.; Fridman, A.; Clyne, A.M. Endothelial cell proliferation is enhanced by low dose non-thermal plasma through fibroblast growth factor-2 release. Ann. Biomed. Eng. 2010, 38, 748–757. [Google Scholar] [CrossRef] [PubMed]
  23. Arndt, S.; Unger, P.; Wacker, E.; Shimizu, T.; Heinlin, J.; Li, Y.F.; Thomas, H.M.; Morfill, G.E.; Zimmermann, J.L.; Bosserhoff, A.K.; et al. Cold atmospheric plasma (CAP) changes gene expression of key molecules of the wound healing machinery and improves wound healing in vitro and in vivo. PLoS ONE 2013, 8, e79325. [Google Scholar] [CrossRef] [PubMed] [Green Version]
  24. Arjunan, K.P.; Clyne, A.M. Non-thermal dielectric barrier discharge plasma induces angiogenesis through reactive oxygen species. Annu. Int. Conf. IEEE Eng. Med. Biol. Soc. 2011, 2011, 2447–2450. [Google Scholar] [CrossRef] [PubMed] [Green Version]
  25. Wilkinson, H.N.; Hardman, M.J. Wound healing: Cellular mechanisms and pathological outcomes. Open Biol. 2020, 10, 200223. [Google Scholar] [CrossRef]
  26. Shaw, T.J.; Martin, P. Wound repair: A showcase for cell plasticity and migration. Curr. Opin. Cell Biol. 2016, 42, 29–37. [Google Scholar] [CrossRef] [Green Version]
  27. Li, J.; Chen, J.; Kirsner, R. Pathophysiology of acute wound healing. Clin. Dermatol. 2007, 25, 9–18. [Google Scholar] [CrossRef]
  28. Abba, M.; Patil, N.; Leupold, J.; Allgayer, H. MicroRNA Regulation of Epithelial to Mesenchymal Transition. J. Clin. Med. 2016, 5, 8. [Google Scholar] [CrossRef]
  29. Thomason, H.A.; Cooper, N.H.; Ansell, D.M.; Chiu, M.; Merrit, A.J.; Hardman, M.J.; Garrod, D.R. Direct evidence that PKCα positively regulates wound re-epithelialization: Correlation with changes in desmosomal adhesiveness. J. Pathol. 2012, 227, 346–356. [Google Scholar] [CrossRef]
  30. Nunan, R.; Campbell, J.; Mori, R.; Pitulescu, M.E.; Jiang, W.G.; Harding, K.G.; Adams, R.H.; Nobes, C.D.; Martin, P. Ephrin-Bs Drive Junctional Downregulation and Actin Stress Fiber Disassembly to Enable Wound Re-epithelialization. Cell Rep. 2015, 13, 1380–1395. [Google Scholar] [CrossRef] [Green Version]
  31. Rousselle, P.; Braye, F.; Dayan, G. Re-epithelialization of adult skin wounds: Cellular mechanisms and therapeutic strategies. Adv. Drug Deliv. Rev. 2019, 146, 344–365. [Google Scholar] [CrossRef]
  32. Santoro, M.M.; Gaudino, G. Cellular and molecular facets of keratinocyte reepithelization during wound healing. Exp. Cell Res. 2005, 304, 274–286. [Google Scholar] [CrossRef]
  33. Baum, C.L.; Arpey, C.J. Normal cutaneous wound healing: Clinical correlation with cellular and molecular events. Dermatol. Surg. 2005, 31, 674–686. [Google Scholar] [CrossRef]
  34. Hasse, S.; Duong Tran, T.; Hahn, O.; Kindler, S.; Metelmann, H.R.; von Woedtke, T.; Masur, K. Induction of proliferation of basal epidermal keratinocytes by cold atmospheric-pressure plasma. Clin. Exp. Dermatol. 2016, 41, 202–209. [Google Scholar] [CrossRef]
  35. Ren, S.; Chen, J.; Duscher, D.; Liu, Y.; Guo, G.; Kang, Y.; Xiong, H.; Zhan, P.; Wang, Y.; Wang, C.; et al. Microvesicles from human adipose stem cells promote wound healing by optimizing cellular functions via AKT and ERK signaling pathways. Stem. Cell Res. Ther. 2019, 10, 47. [Google Scholar] [CrossRef]
  36. Lu, C.C.; Yang, J.S.; Chiu, Y.J.; Tsai, F.J.; Hsu, Y.M.; Yin, M.C.; Juan, Y.N.; Ho, T.J.; Chen, H.P. Dracorhodin perchlorate enhances wound healing via β-catenin, ERK/p38, and AKT signaling in human HaCaT keratinocytes. Exp. Ther. Med. 2021, 22, 822. [Google Scholar] [CrossRef]
  37. Liu, F.; Zhou, Y.; Song, W.; Wang, H. Cold Atmospheric Plasma Inhibits the Proliferation of CAL-62 Cells through the ROS-Mediated PI3K/Akt/mTOR Signaling Pathway. Sci. Technol. Nucl. Install. 2022, 2022, 3884695. [Google Scholar] [CrossRef]
  38. Liu, J.R.; Xu, G.M.; Shi, X.M.; Zhang, G.J. Low temperature plasma promoting fibroblast proliferation by activating the NF-κB pathway and increasing cyclinD1 expression. Sci. Rep. 2017, 7, 11698. [Google Scholar] [CrossRef] [Green Version]
  39. Veeraperumal, S.; Qiu, H.M.; Zeng, S.S.; Yao, W.Z.; Wang, B.P.; Liu, Y.; Cheong, K.L. Polysaccharides from Gracilaria lemaneiformis promote the HaCaT keratinocytes wound healing by polarised and directional cell migration. Carbohydr. Polym. 2020, 241, 116310. [Google Scholar] [CrossRef]
  40. Leng, X.; Shang, J.; Gao, D.; Wu, J. Low-intensity pulsed ultrasound promotes proliferation and migration of HaCaT keratinocytes through the PI3K/AKT and JNK pathways. Braz. J. Med. Biol. Res. 2018, 51, e7862. [Google Scholar] [CrossRef]
  41. Duchesne, C.; Banzet, S.; Lataillade, J.J.; Rousseau, A.; Frescaline, N. Cold atmospheric plasma modulates endothelial nitric oxide synthase signalling and enhances burn wound neovascularisation. J. Pathol. 2019, 249, 368–380. [Google Scholar] [CrossRef] [PubMed]
  42. Pekshev, A.V.; Shekhter, A.B.; Vagapov, A.B.; Sharapov, N.A.; Vanin, A.F. Study of plasma-chemical NO-containing gas flow for treatment of wounds and inflammatory processes. Nitric. Oxide. 2018, 73, 74–80. [Google Scholar] [CrossRef] [PubMed]
  43. Kim, S.J.; Chung, T.H. Cold atmospheric plasma jet-generated RONS and their selective effects on normal and carcinoma cells. Sci. Rep. 2016, 6, 20332. [Google Scholar] [CrossRef] [PubMed] [Green Version]
  44. Mo, C.; Shetti, D.; Wei, K. Erianin Inhibits Proliferation and Induces Apoptosis of HaCaT Cells via ROS-Mediated JNK/c-Jun and AKT/mTOR Signaling Pathways. Molecules 2019, 24, 2727. [Google Scholar] [CrossRef] [Green Version]
  45. Martinotti, S.; Laforenza, U.; Patrone, M.; Moccia, F.; Ranzato, E. Honey-Mediated Wound Healing: H₂O₂ Entry through AQP3 Determines Extracellular Ca2+ Influx. Int. J. Mol. Sci. 2019, 20, 764. [Google Scholar] [CrossRef] [Green Version]
  46. Yang, X.; Chen, G.; Yu, K.N.; Yang, M.; Peng, S.; Ma, J.; Qin, F.; Cao, W.; Cui, S.; Nie, L.; et al. Correction: Cold atmospheric plasma induces GSDME-dependent pyroptotic signaling pathway via ROS generation in tumor cells. Cell Death Dis. 2022, 13, 690. [Google Scholar] [CrossRef]
  47. Cheraghi, G.; Hajiabedi, E.; Niaghi, B.; Nazari, F.; Naserzadeh, P.; Hosseini, M.J. High doses of sodium tungstate can promote mitochondrial dysfunction and oxidative stress in isolated mitochondria. J. Biochem. Mol. Toxicol. 2019, 33, e22266. [Google Scholar] [CrossRef]
  48. Cao, X.; Fu, M.; Bi, R.; Zheng, X.; Fu, B.; Tian, S.; Liu, C.; Li, Q.; Liu, J. Cadmium induced BEAS-2B cells apoptosis and mitochondria damage via MAPK signaling pathway. Chemosphere 2021, 263, 128346. [Google Scholar] [CrossRef]
  49. Azmi, L.; Shukla, I.; Goutam, A.; Allauddin, R.C.V.; Jawaid, T.; Kamal, M.; Awaad, A.S.; Alqasoumi, S.I.; AlKhamees, O.A. In vitro wound healing activity of 1-hydroxy-5,7-dimethoxy-2-naphthalene-carboxaldehyde (HDNC) and other isolates of Aegle marmelos L: Enhances keratinocytes motility via Wnt/β-catenin and RAS-ERK pathways. Saudi Pharm. J. 2019, 27, 532–539. [Google Scholar] [CrossRef]
  50. Misiura, M.; Baszanowska, W.; Ościłowska, I.; Pałka, J.; Miltyk, W. Prolidase Stimulates Proliferation and Migration through Activation of the PI3K/Akt/mTOR Signaling Pathway in Human Keratinocytes. Int. J. Mol. Sci. 2020, 21, 9243. [Google Scholar] [CrossRef]
  51. Kim, D.; Ku, B.; Choi, E.M. Se-methylselenocysteine stimulates migration and antioxidant response in HaCaT keratinocytes: Implications for wound healing. J. Trace Elem. Med. Biol. 2020, 58, 126426. [Google Scholar] [CrossRef]
  52. Li, Y.; Lv, Y.; Zhu, Y.; Yang, X.; Lin, B.; Li, M.; Zhou, Y.; Tan, Z.; Choi, E.H.; Wang, J.; et al. Low-Temperature Plasma-Activated Medium Inhibited Proliferation and Progression of Lung Cancer by Targeting the PI3K/Akt and MAPK Pathways. Oxid. Med. Cell Longev. 2022, 2022, 9014501. [Google Scholar] [CrossRef]
  53. Liu, Y.; Piao, X.J.; Xu, W.T.; Zhang, Y.; Zhang, T.; Xue, H.; Li, Y.N.; Zuo, W.B.; Sun, G.; Fu, Z.R.; et al. Calycosin induces mitochondrial-dependent apoptosis and cell cycle arrest, and inhibits cell migration through a ROS-mediated signaling pathway in HepG2 hepatocellular carcinoma cells. Toxicol. In Vitro 2021, 70, 105052. [Google Scholar] [CrossRef]
  54. Liu, T.; Zhao, X.; Song, D.; Liu, Y.; Kong, W. Anticancer activity of Eremanthin against the human cervical cancer cells is due to G2/M phase cell cycle arrest, ROS-mediated necrosis-like cell death and inhibition of PI3K/AKT signalling pathway. J. BUON 2020, 25, 1547–1553. [Google Scholar]
  55. Karki, S.B.; Gupta, T.T.; Yildirim-Ayan, E.; Eisenmann, K.M.; Ayan, H. Miniature Non-thermal Plasma Induced Cell Cycle Arrest and Apoptosis in Lung Carcinoma Cells. Plasma Chem. Plasma Process. 2019, 40, 99–117. [Google Scholar] [CrossRef]
  56. Cui, H.S.; Cho, Y.S.; Joo, S.Y.; Mun, C.H.; Seo, C.H.; Kim, J.B. Wound Healing Potential of Low Temperature Plasma in Human Primary Epidermal Keratinocytes. Tissue Eng. Regen. Med. 2019, 16, 585–593. [Google Scholar] [CrossRef]
  57. Chen, Y.; Liu, X.; Wang, H.; Liu, S.; Hu, N.; Li, X. AKT Regulated Phosphorylation of GSK-3β/Cyclin D1, p21 and p27 Contributes to Cell Proliferation Through Cell Cycle Progression From G1 to S/G2M Phase in Low-Dose Arsenite Exposed HaCat Cells. Front. Pharmacol. 2019, 10, 1176. [Google Scholar] [CrossRef] [Green Version]
  58. Miao, X.; Xiang, Y.; Mao, W.; Chen, Y.; Li, Q.; Fan, B. TRIM27 promotes IL-6-induced proliferation and inflammation factor production by activating STAT3 signaling in HaCaT cells. Am. J. Physiol. Cell Physiol. 2020, 318, C272–C281. [Google Scholar] [CrossRef]
  59. He, L.; Zhu, C.; Jia, J.; Hao, X.Y.; Yu, X.Y.; Liu, X.Y.; Shu, M.G. ADSC-Exos containing MALAT1 promotes wound healing by targeting miR-124 through activating Wnt/β-catenin pathway. Biosci. Rep. 2020, 40, BSR20192549. [Google Scholar] [CrossRef]
  60. Mendoza-Reinoso, V.; Beverdam, A. Epidermal YAP activity drives canonical WNT16/β-catenin signaling to promote keratinocyte proliferation in vitro and in the murine skin. Stem. Cell Res. 2018, 29, 15–23. [Google Scholar] [CrossRef]
  61. Vallée, A.; Lecarpentier, Y. Crosstalk Between Peroxisome Proliferator-Activated Receptor Gamma and the Canonical WNT/β-Catenin Pathway in Chronic Inflammation and Oxidative Stress During Carcinogenesis. Front. Immunol. 2018, 9, 745. [Google Scholar] [CrossRef] [PubMed] [Green Version]
  62. Schieber, M.; Chandel, N.S. ROS function in redox signaling and oxidative stress. Curr. Biol. 2014, 24, R453–R462. [Google Scholar] [CrossRef] [PubMed] [Green Version]
  63. Gan, L.; Duan, J.; Zhang, S.; Liu, X.; Poorun, D.; Liu, X.; Lu, X.; Duan, X.; Liu, D.; Chen, H. Cold atmospheric plasma ameliorates imiquimod-induced psoriasiform dermatitis in mice by mediating antiproliferative effects. Free Radic. Res. 2019, 53, 269–280. [Google Scholar] [CrossRef] [PubMed]
  64. Yadav, D.K.; Adhikari, M.; Kumar, S.; Ghimire, B.; Han, I.; Kim, M.H.; Choi, E.H. Cold atmospheric plasma generated reactive species aided inhibitory effects on human melanoma cells: An in vitro and in silico study. Sci. Rep. 2020, 10, 3396. [Google Scholar] [CrossRef] [Green Version]
Figure 1. Cell viability of HaCaT cells. (A) HaCaT cell viability after NTP treatment for 24 h. (B) Effect of NTP on the viability of HaCaT cells pre-incubated with NAC. (C) Effect of PI3K inhibitor LY294002 on cell viability. C 1: cells given neither NAC nor NTP treatment; C 2: cells treated with NAC in the absence of NTP treatment. Data represent the mean ± SD of three independent experiments. * p < 0.05, *** p < 0.001, **** p < 0.0001 with ANOVA compared with the control.
Applsci 13 02866 g001
Figure 2. Extracellular NO and H2O2 content. (A) The concentration of NO in the cell culture medium after NTP treatment for 0, 5, 10, 15, 20 and 25 s. (B) The concentration of H2O2 in the cell culture medium for 0 h and 4 h after NTP treatment for 0, 5, 10, 15, 20, and 25 s. Data represent the mean ± SD of three independent experiments. “ns” was not considered statistically significant. * p < 0.05, ** p < 0.01, ***p < 0.001, **** p < 0.0001 with ANOVA compared with the control.
Applsci 13 02866 g002
Figure 3. Intracellular ROS levels. (A) Fluorescence images of intracellular ROS generation in HaCaT cells. (B) The quantification by measuring fluorescence pixel intensity using Image J software. Data represent the mean ± SD of three independent experiments. * p < 0.05, **** p < 0.0001 with ANOVA compared with the control.
Applsci 13 02866 g003
Figure 4. Mitochondrial membrane potential in HaCaT cells. (A) Red fluorescence image of mitochondrial membrane potential in HaCaT cells. (B) Quantification was performed by measuring the intensity of red and green fluorescence pixels in HaCaT cells using Image J software. (C) Green fluorescence image of mitochondrial membrane potential in HaCaT cells. (D) The ratio of red to green fluorescent pixels was quantified using Image J software. Data represent the mean ± SD of three independent experiments. * p < 0.05, ** p < 0.001, *** p < 0.001, **** p < 0.0001 with ANOVA compared with the control.
Applsci 13 02866 g004
Figure 5. Effect of NTP treatment on HaCaT cell migration. (A) Migration of HaCaT cells treated with NTP by the scratch wound healing assay. (B) Quantitative analysis was performed by measuring the scratch area of HaCaT cells using Image J software. (C) Migration of HaCaT cells treated with NTP by the transwell assay, the picture scale size was the same as (A). (D) Quantitative analysis was performed by measuring the number of HaCaT cells crossing the membrane using Image J software. Data represent the mean ± SD of three independent experiments. * p < 0.05, ** p < 0.001, *** p < 0.001, **** p < 0.0001 with ANOVA compared with the control.
Applsci 13 02866 g005
Figure 6. Effect of NTP treatment on HaCaT cell cycle. (A) The cell cycle distribution of HaCaT cells after NTP treatment was detected by flow cytometry. (B) The cell population at each stage was expressed as a percentage of the total number of cells. Data represent the mean ± SD of three independent experiments. “ns” was not considered statistically significant. * p < 0.05, ** p < 0.001, **** p < 0.0001 with ANOVA compared with the control.
Applsci 13 02866 g006
Figure 7. NTP activated the PI3K/AKT and STAT3 pathways in HaCaT cells. (A) The expression of PI3K, AKT, mTOR, Cyclin D1, ERK, and STAT3 were determined by WB. (B) The quantification by measuring the protein expression with Photoshop software (version 20.0.4). Data represent the mean ± SD of three independent experiments. ** p < 0.001, **** p < 0.0001 with ANOVA compared with the control.
Applsci 13 02866 g007
Figure 8. NTP activated the WNT3A/β-catenin pathways in HaCaT cells. (A) The expression of WNT3A, β-catenin, and Cyclin D1 were determined by WB. (B) The protein expression quantification measured with Photoshop software. Data represent the mean ± SD of three independent experiments. **** p < 0.0001 with ANOVA compared with the control.
Applsci 13 02866 g008
Figure 9. Effect of Wnt/β-catenin pathway inhibitor IWP-2 on HaCaT cell migration and effect of NAC on protein phosphorylation. (A) Picture of effects of IWP-2, a Wnt/β-catenin pathway inhibitor, on HaCaT cell migration. (B) Count of the number of migrated cells. (C) Effect of NAC on protein phosphorylation. (D) Quantification of phosphorylated protein expression. Data represent the mean ± SD of three independent experiments. * p < 0.05, ** p < 0.01, *** p < 0.001 with ANOVA compared with the control.
Applsci 13 02866 g009aApplsci 13 02866 g009b
Figure 10. Schematic representation of the mechanism by which NTP treatment promoted proliferation and migration of HaCaT cells. ROS produced by low-dose NTP promoted the proliferation and migration of HaCaT cells by promoting the expression of PI3K, AKT, mTOR, ERK, PI3K, Cyclin D1, WNT, and β-catenin.
Applsci 13 02866 g010
Disclaimer/Publisher’s Note: The statements, opinions and data contained in all publications are solely those of the individual author(s) and contributor(s) and not of MDPI and/or the editor(s). MDPI and/or the editor(s) disclaim responsibility for any injury to people or property resulting from any ideas, methods, instructions or products referred to in the content.

