Article

Classification of Bugs in Cloud Computing Applications Using Machine Learning Techniques

1
Department of Computer Science, Virtual University of Pakistan, Lahore 54000, Pakistan
2
Faculty of Computer and Information Systems, Islamic University of Madinah, Medina 42351, Saudi Arabia
3
Department of Computer Science, Lahore Garrison University, Lahore 54000, Pakistan
4
School of Digital Science, Universiti Brunei Darussalam, Tungku Link, Bandar Seri Begawan BE1410, Brunei
5
Department of Cyber Security, Ajou University, Suwon 16499, Republic of Korea
*
Authors to whom correspondence should be addressed.
Appl. Sci. 2023, 13(5), 2880; https://doi.org/10.3390/app13052880
Submission received: 21 January 2023 / Revised: 17 February 2023 / Accepted: 19 February 2023 / Published: 23 February 2023
(This article belongs to the Special Issue Computation and Complex Data Processing Systems)

Abstract

:
In software development, the main problem is recognizing the security-oriented issues within the reported bugs due to their unacceptable failure rate to provide satisfactory reliability on customer and software datasets. The misclassification of bug reports has a direct impact on the effectiveness of the bug prediction model. The misclassification issue surely compromises the accuracy of the system. Manually reviewing bug reports is necessary to solve this problem, but doing so takes a lot of time and is tiresome for developers and testers. This paper proposes a novel hybrid approach based on natural language processing (NLP) and machine learning. To address these issues, the intended outcomes are multi-class supervised classification and bug prioritization using supervised classifiers. After being collected, the dataset was prepared for vectorization, subjected to exploratory data analysis, and preprocessed. The feature extraction and selection methods used for a bag of words are TF-IDF and word2vec. Machine learning models are created after the dataset has undergone a full transformation. This study proposes, develops, and assesses four classifiers: multinomial Naive Bayes, decision tree, logistic regression, and random forest. The hyper-parameters of the models are tuned, and it is concluded that random forest outperformed with a 91.73% test and 100% training accuracy. The SMOTE technique was used to balance the highly imbalanced dataset, which was initially created for the justified classification. The comparison between balanced and imbalanced dataset models clearly showed the importance of the balanced dataset in classification as it outperformed in all experiments.

1. Introduction

Software as a Service (SaaS) is the concept of hosting ready-to-use applications for customers, which customers can access online. SaaS is among the main categories in cloud computing, including Infrastructure as a Service (IaaS) and Platform as a Service (PaaS). In SaaS, multiple customers can access the same copy of the application that the service provider creates. Depending on the Service Level Agreement (SLA) between the service providers and service users, the service usage can be charged accordingly. Agreements are also per the usage of the services or can be monthly or yearly. SaaS applications are currently deployed in many industries such as emails, financial applications, and human resources applications [1].
In SaaS models, users have full access to use applications as per their agreement. The service providers develop, deploy, and maintain applications, and users can use those applications to achieve their tasks. SaaS applications can be accessed through web browsers. Application users do not have to worry about installations and the applications’ maintenance, as the applications vendor is responsible for this process. In some cases, users have to download plugins to perform different functionalities in the application [2].
The usage of SaaS applications in the cloud is increasing daily, and these applications are also expanding. With the increase in usage, application bugs can result in poor user experience. Maintaining these applications is also a challenging task that is time-consuming and impacts cost. To make the development and maintenance of these applications easy, there is a need to investigate the bugs occurring in these applications so that users can classify and prioritize these defects. Based on these priorities, developers can quickly proceed with the fixation process. The manual process of classifying or setting the bugs’ priority is time-consuming. Thus, there is a need to automate the activity of bug classification and prioritization [3].
The motivation for classifying bugs in cloud computing applications using machine learning techniques stems from the increasing importance and widespread adoption of cloud computing in today’s world. Cloud computing has become an essential tool for businesses and organizations of all sizes, offering a range of benefits such as increased efficiency, scalability, and cost savings. However, as the number of cloud computing applications continues to grow, the number of bugs that arise in these systems do too. Bugs can cause significant downtime and negatively impact the performance of cloud computing systems, leading to lost productivity, decreased customer satisfaction, and potential financial losses. As such, there is a growing need to develop effective methods for detecting and resolving bugs in cloud computing applications. Machine learning algorithms have shown great promise in addressing this problem, as they can process large amounts of data and detect patterns indicative of bugs. The classification of bugs in cloud computing applications using machine learning techniques is motivated by improving bug detection, resolution efficiency, and accuracy. This approach can help organizations to quickly identify the source of bugs, prioritize bug resolution efforts, and prevent downtime and other negative impacts on cloud computing systems. The use of machine learning techniques for bug classification can also help to reduce the workload of developers and system administrators, allowing them to focus on more strategic tasks and further improve the overall efficiency and reliability of cloud computing systems. In conclusion, the classification of bugs in cloud computing applications using machine learning techniques represents a crucial area of research and development. It can greatly improve cloud computing systems’ stability, reliability, and performance and, ultimately, benefit businesses and organizations of all sizes.

1.1. Problem Statement

This research work is presented to automate the process of classifying bugs and setting the priority of those bugs/defects in SaaS applications. With the increase in usage of SaaS applications, bugs/errors in applications can result in poor user experience, and the maintenance of these applications is also becoming challenging. This research aims to develop a model to classify and prioritize SaaS applications’ bugs/error logs.

1.2. Objective of Our Studies

Objectives of our research are as given below:
  • To design a machine learning model that can classify the bugs from cloud-based applications’ errors.
  • To predict the priority of bugs from classified bugs.
  • To achieve the best possible results and accuracy for bug classification and prioritization.

1.3. Significance of Work

Bugs in cloud computing applications can have significant consequences, as they can potentially compromise the system’s security, reliability, and performance. In addition, bugs can lead to data loss or corruption, resulting in unexpected user downtime. Additionally, attackers can exploit bugs to gain unauthorized access to the system or steal sensitive information. Therefore, it is important for developers to thoroughly test and debug their cloud computing applications to ensure that they are free from bugs before they are deployed to production.
The outline of the paper “Classification of Bugs in Cloud Computing Applications Using Machine Learning Techniques” presents a comprehensive outline for utilizing machine learning techniques to classify and categorize bugs in cloud computing applications in the introduction section, along with problem statements and the significance of work. The paper begins by introducing the concept of cloud computing and highlighting the importance of identifying and addressing bugs within these applications. It then discusses the machine learning algorithms used for bug classification, including decision trees, support vector machines, and neural networks. Section 2 explains the previous study that delves into the various types of bugs in cloud computing applications, such as resource allocation, configuration, and security. Section 3 shows the detailed design and implementation with different classifiers. The paper concludes by outlining a step-by-step process for bug classification using machine learning techniques, including data collection and preprocessing, feature selection and extraction, and model building and evaluation. Overall, this paper serves as a valuable resource for those looking to improve the quality and performance of cloud computing applications by identifying and addressing bugs through machine learning techniques.

2. Literature Review

Software testing is an essential component of software Verification and Validation (V and V), which ensures software systems’ accuracy and long-standing dependability. Costs of software improvement intend to create a practical approach for predicting software defects using soft computing-based machine learning techniques that aid in predicting, optimizing, and efficiently learning features. Concurrently, software analysis requires significant time, money, infrastructure, and expertise. As safety-critical software systems advance, the costs and efforts required to ensure their reliability increase significantly. Therefore, adopting a rigorous analysis approach is absolutely critical for any business operating in high-stakes environments [4].
Our research aims to automate finding bugs while delivering the SaaS applications, identifying those bugs’ categories, and setting the bugs’ priority. Multiple types of research have been performed related to software bug classification from bug reports where researchers have performed classification and set priorities for the report’s bugs. There are also different tools developed that can be used to find bugs from software source code and identify the priorities of those bugs. Thus, we have presented a literature review related to software bug classification and prioritization [5].
In [6], it was proposed that machine learning can be a useful tool for automating manual processes, including bug prioritization in software development. Using historical data from bug reports, the model can learn patterns and make predictions about the priority of new bugs, making the process more efficient and accurate. The increasing complexity of software systems means manual error detection can be time-consuming and prone to human error. Automated detection of faulty components using machine learning techniques can help ensure that the software system is of high quality and has a low error rate, especially in safety-critical and mission-critical applications. This can also increase efficiency and reduce software development and maintenance costs. [7].
In [8], the use of ensemble-based techniques for bug triaging is an interesting and promising area of research, and the results of this study suggest that it could be a useful approach for improving the efficiency and accuracy of the bug handling process. The results showing that ensemble classifiers outperformed classical machine learning algorithms for selecting a suitable developer to handle the bug report is promising. It suggests that ensemble techniques could potentially improve the efficiency and accuracy of bug triaging by helping identify the most appropriate developer to handle each reported bug.
In [9], the authors proposed a mechanism for predicting the priority of bug reports using an emotion-based approach. They collected data from online resources, used machine learning classifiers, and trained the model with that data. The priority was predicted using the feature vector created from the bug report. Natural Language Processing is used to preprocess the bug report. From the preprocessed data, emotion words from the bug report description were identified and assigned an emotion value. The model was evaluated from open-source projects from Eclipse. The result shows that the mechanism used in this research performs better and has a more than six percent improved F1 score.
Modern software systems are becoming more complex as huge storing competencies, fast-paced internet, and IoT devices come into being and maintain great value in such difficult schemes, whereas hand-reducing mistake rates is difficult. Researchers suggest a collaborative software flaw calculation prototype that interprets the class disparity problem in real software datasets. In [10], the authors built an ensemble classifier using various oversampling techniques to decrease the consequences of little sectional examples in the faulty data. The outcomes show that the collaborative oversampling method can significantly decrease the wrong adverse rate and more accurately recognize the defective gears compared to standard classification techniques, resulting in a less affluent recognition arrangement. The bug description task is a critical activity that attempts to select an appropriate creator to solve the bug. Incorrect distribution causes a significant deferral in the bug-solving procedure.
This concept is very interesting, combining two powerful technologies: Blockchain and ERP. Blockchain in AIS can revolutionize how businesses manage and store their financial information and enhance overall accountability and transparency in the financial reporting process [11]. By integrating Blockchain into the ERP system, the data stored in the data vaults can be ensured to be tamper proof and secure, providing high confidence and trust in the information stored. This can be particularly useful in industries where data security and integrity are crucial, such as finance, healthcare, and government. One potential challenge in this approach is scalability, as the size of the Blockchain can become large and slow down the system as more transactions are added. However, this challenge can be overcome with technological advancements and solutions such as sharding. It will be interesting to see how the proposed solution is implemented in practice and its impact on the AIS domain.
Bugs are a solemn contest for organization reliability and effectiveness in standard software projects, which are flattering, progressively large, and composite. Three managed machine learning algorithms, LR, NB, and DT, were used in the research process to construct a model and predict the occurrence of software bugs based on historical data. By employing classifier methods and generating replicas, an improved model was developed for predictions using collective classifiers such as RF. The model was validated using the K-Fold cross-validation method, which confirmed its effectiveness in predicting future software issues in both classical and high-stress situation [12].
TF-IDF (Term Frequency-Inverse Document Frequency) is widely used in text processing and information retrieval. It is a statistical measure representing the importance of a word or terms in a document or a set of documents. The basic idea behind TF-IDF is that, the more frequently a word appears in a document, the more important it is to that document, but if the word frequently appears across all documents, its importance is reduced.
The TF-IDF value is calculated as the product of two values: the term frequency (TF) and the inverse document frequency (IDF). The term frequency is the number of times a word appears in a document, and the inverse document frequency is the logarithm of the total number of documents divided by the number of documents that contain the word. TF-IDF is commonly used in information retrievals, such as search engines, document classification, and text clustering. It provides a simple yet effective way to represent the content of a document and compare it with other documents. This helps to penalize common words across all documents and give more weight to words unique to a specific document.
Submitting and resolving software issues can be time-consuming and challenging, as software developers, testers, and customers often misclassify bug reports as improvement requests and vice versa. Automated classification of these reports using machine learning techniques can significantly improve the efficiency of this process. In this paper, we explore the use of various machine learning algorithms, including Naive Bayes, linear discriminant analysis, k-nearest neighbors, and support vector machine (SVM) with various kernels, decision trees, and random forests, to classify issue reports from three open-source projects. Our experiments reveal that random forests perform best, while SVM with certain kernels also exhibits high performance. The results are evaluated using metrics such as F-measure, average accuracy, and weighted average F-measure and provide valuable insights into the potential of machine learning for the automated classification of software issues [13].
Using machine learning algorithms in bug tracking can automate the process of bug classification, reducing the workload on developers and testers and increasing the speed of bug resolution. This can result in improved software quality and reduced time and cost associated with software testing. Additionally, machine learning can provide greater collaboration, flexibility, and smart decision-making in the bug-tracking process, leading to a more efficient and effective bug resolution process. In conclusion, integrating machine learning techniques in cloud-based bug tracking systems can significantly improve the efficiency and accuracy of the bug resolution process, leading to higher software quality and reduced time and cost associated with software testing. This is particularly important for embedded software design, where bugs are challenging to detect and correct, and machine learning can provide a much-needed solution [14].

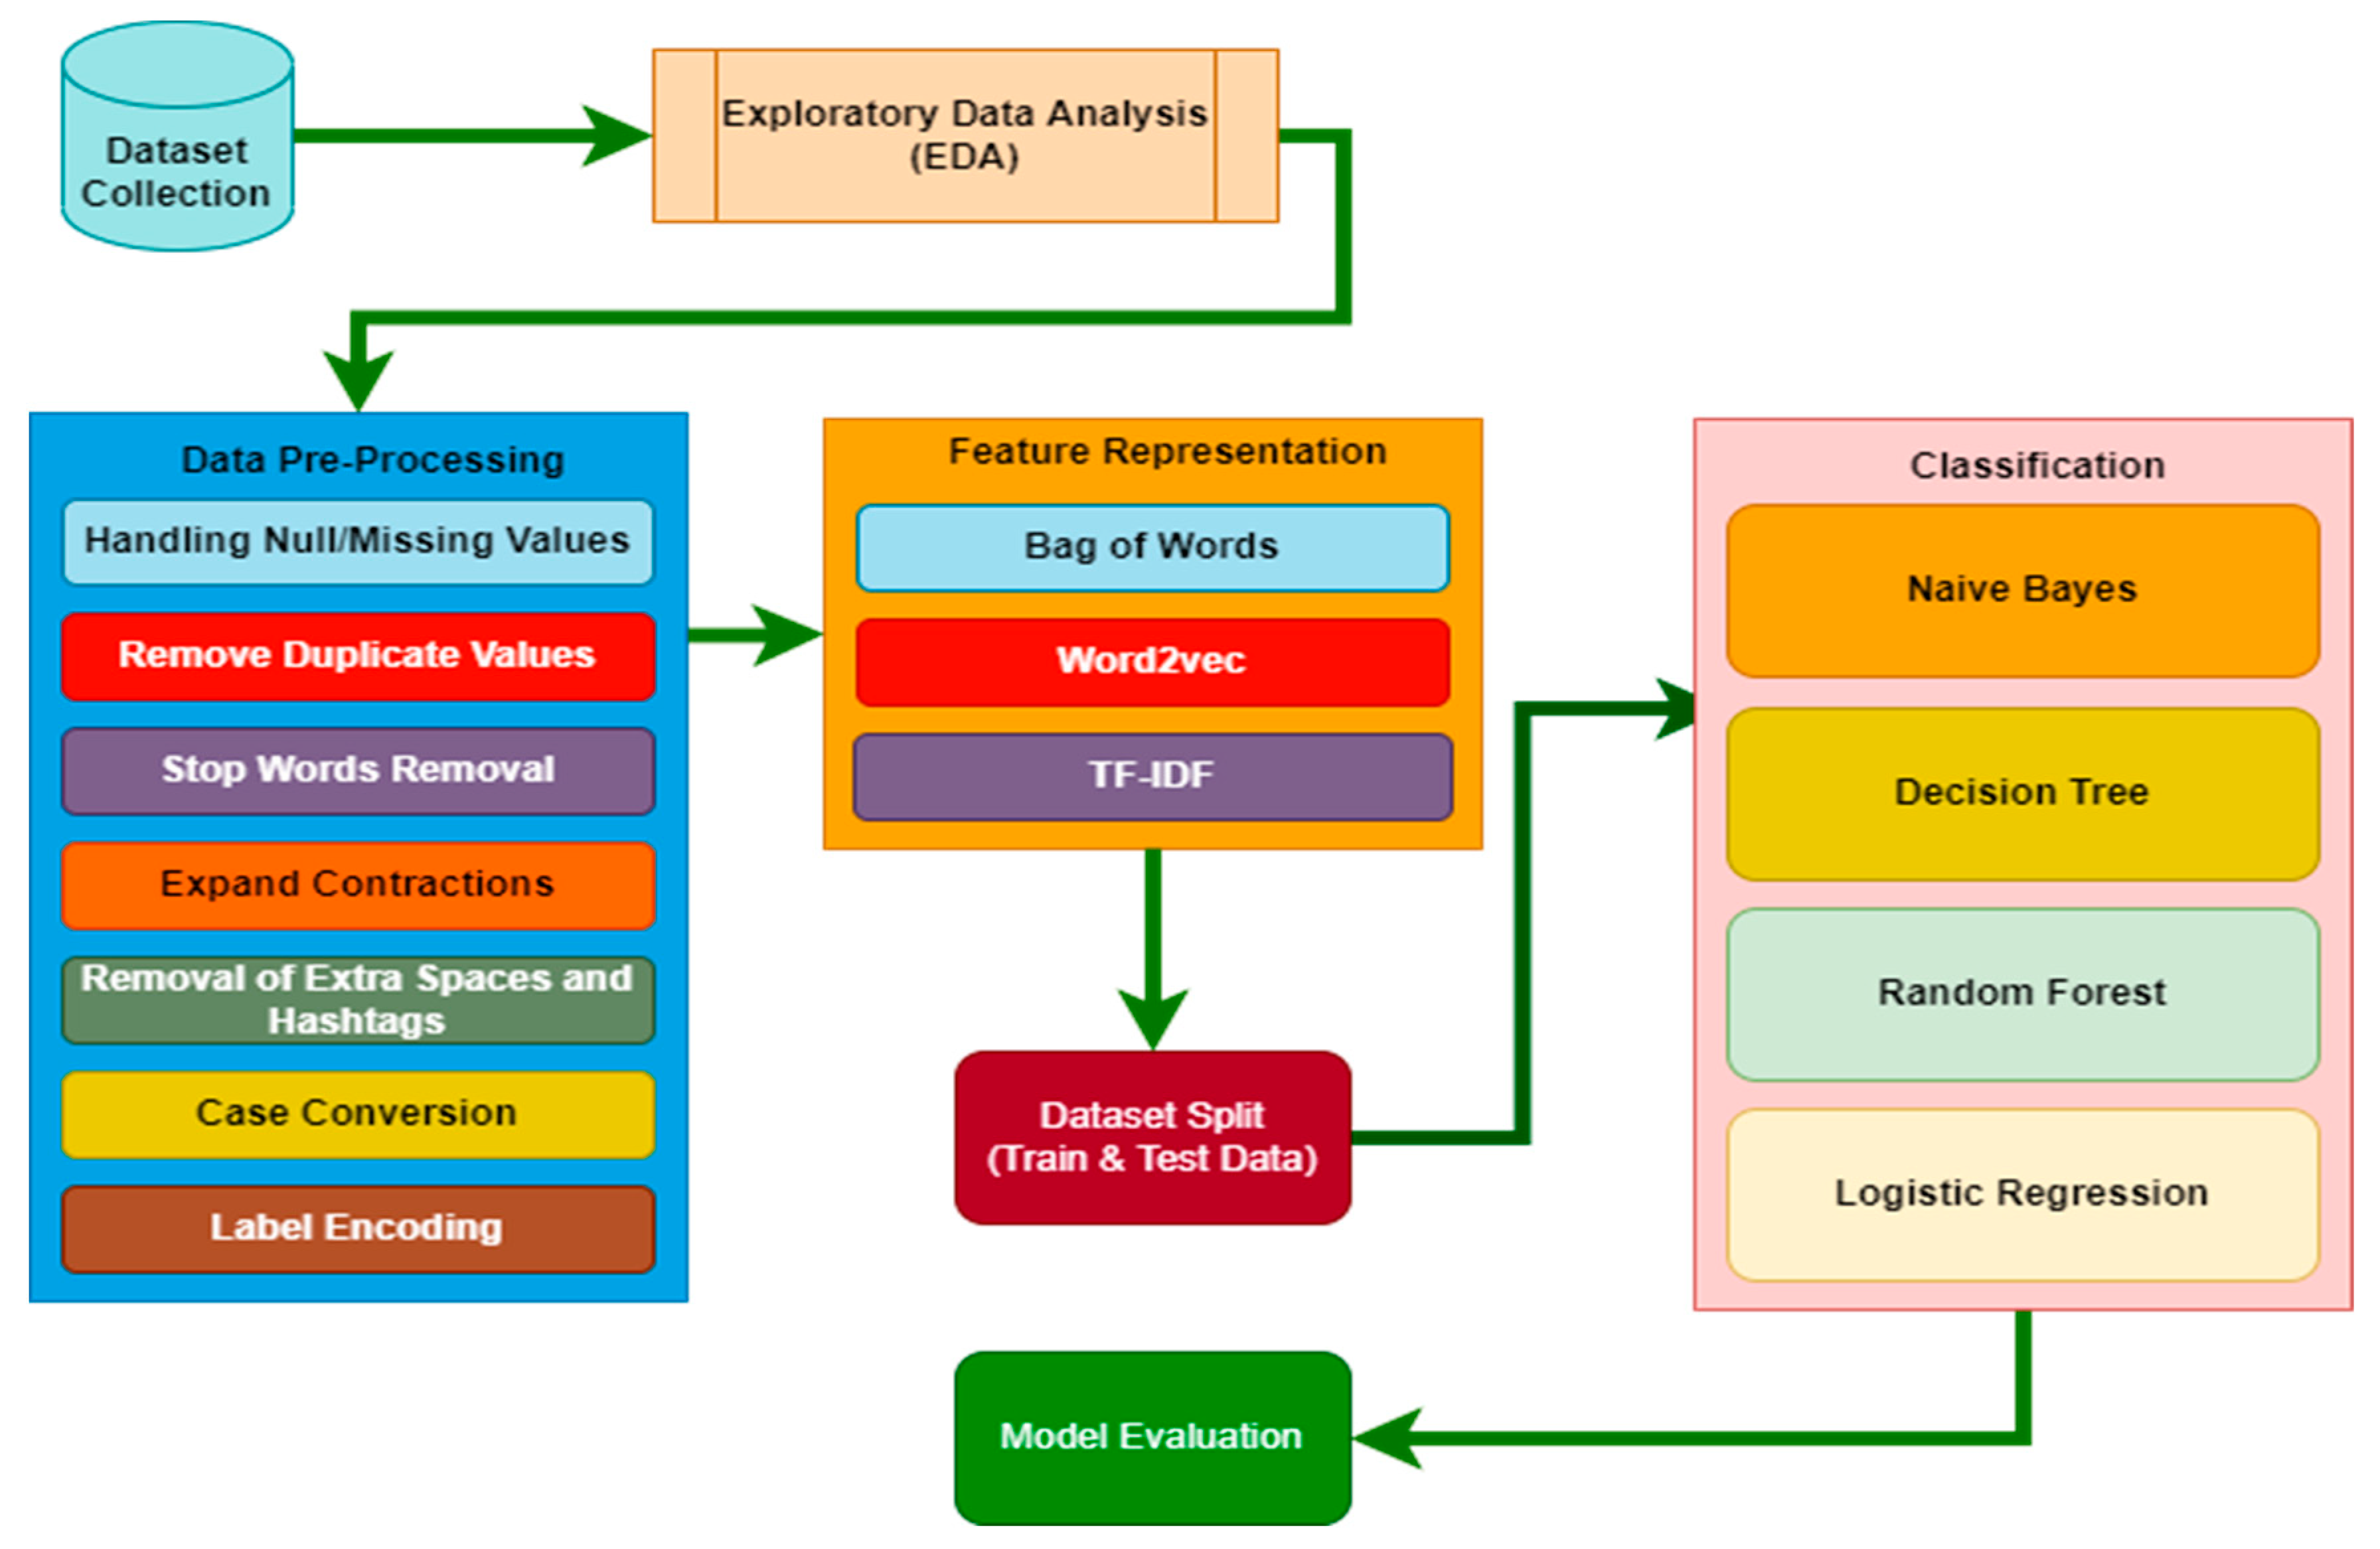
3. Solution Design and Implementation

The following Design solution for the “Classification of Bugs in Cloud Computing Applications Using Machine Learning Techniques”. The first step is collecting the data for cloud computing applications’ bugs. This data can be obtained from various sources such as bug reports, tracking systems, and forums. The next step is to clean the data, which involves removing irrelevant information, handling missing values, and transforming the data into a suitable format for analysis. In this step, relevant features are selected from the cleaned data and transformed into a format that machine learning algorithms can use. This includes extracting information such as severity, priority, and bug description. The next step is to select an appropriate machine-learning algorithm for bug classification. This can be performed through various techniques, such as comparing the performance of different algorithms on the same data or by conducting a literature review to determine which algorithms are commonly used for bug classification. Once the algorithm is selected, it is trained on the transformed data to create a bug classification model. After the model is trained, its performance is evaluated on a separate dataset. This evaluation includes measuring metrics such as accuracy, precision, and recall to determine the model’s effectiveness. Finally, the model is deployed in a cloud computing environment, where it can classify bugs in real time. The above solution is just a high-level design, and the actual implementation may require more steps or a different approach based on the specific requirements and constraints of the problem, as shown in Figure 1.

3.1. Dataset Description

Data are rich and the key to data science. It is possible to be sure that you have trained a good model if you have high-quality data. Similarly, gathering the dataset was the initial phase in this endeavour. Bug categorization and prediction are among the most challenging tasks that must be handled successfully and efficiently in the modern world. This research uses the sole publicly available dataset because it is rarely made available to the public and cannot be manually acquired. In 2020, a dataset was made available on Kaggle [15]. The following Table 1 provides a detailed description of the dataset attributes:
Based on the title, this is a web-based issue tracker for Python. There are five types of bugs in the dataset; enhancement, security, compilation error, resource utilization, performance, and crash are the names of these bugs. The classification issue in this field is intriguing because the title uses code such as SyntaxError or ImportError rather than conversational or typical sentences [16]. There are six types of bugs in the dataset, as shown in Table 2.
Exploratory data analysis (EDA) frequently uses data visualization techniques to examine and study data sets, and summarize their key properties. It makes it simpler for data scientists to find patterns, identify anomalies, test hypotheses, or verify assumptions by determining how to modify data sources to achieve the necessary answers.
EDA offers a better knowledge of data set variables and their interactions. It examines what data might disclose beyond the formal modelling or hyporesearch work testing assignment. It can also assist in determining the suitability of the statistical methods you are considering using for data analysis [17]. Initially created by American mathematician John Tukey in the 1970s, EDA approaches are still frequently employed in data discovery.
The dataset has the shape (5300,3), indicating that it contains 5300 records and 3 attributes, including the label. This leads to the conclusion that the dataset has three columns with the names Unnamed: 0, title, and type. The Unnamed attribute, the unique id index column, is followed by the attribute type, which is the label/class, which contains the entire text of any code errors.
The error types contained in the dataset are visualized using a bar plot. From this, it can be concluded that there are six different sorts of mistakes, with performance issues occurring the most frequently, followed by crashes, and resource utilization errors occurring the least frequently, as shown in Figure 2. Since this is a multi-class classification, the dataset does not need to be balanced. Cross-validation is a statistical method used to evaluate the performance of a machine learning model. It helps to prevent overfitting, which occurs when a model is trained too well on the training data and does not generalize well to new data.
The cross-validation process involves dividing the original dataset into several smaller subsets, typically called “folds”. The model is trained on k-1 of the folds and tested on the remaining fold. This process is repeated k times, with each fold being used as the test set exactly once. The results from each fold are then aggregated to produce a final performance score, which provides a more robust estimate of the model’s performance on unseen data than a single train-test split.
A one-word sequence is known as a 1 g (or unigram). Each word in a uni-gram is thought to arise independently of the word that came before it. Thus, each word here becomes a grammatical characteristic.
The attribute “title uni-grams” is taken out and plotted based on the most frequent terms. The top ten most frequent words are plotted in Figure 3. As a result, the word module occurs the most often, while the phrase python appears the least frequently in the error text list. From this, it can be inferred that the top 10 words are all standard terms that appear in practically all Python-related git errors, including module, windows, files, documentation, file, argument, function, functions, code, and python.
By adjusting the size of each word proportionate to its frequency, the word cloud plot is a visualization technique that shows how often words occur in a body of text. The words are then placed in a group or word cloud.
Figure 4 is the word cloud plot of performance error. In this, the words such as python, IDLE, return, module, and exception occurred the most, hence these are the most common words for this error.
Resource usage errors are mostly linked to the cloud and storage. Figure 5 is the word cloud plot of the resource usage error. In this, words such as attack, security, injection, and header occurred the most, hence these are the most common words for this error.
Figure 6 is the word cloud plot of resource usage error. In this, the words such as document, module, python, support, option, etc., occurred the most, hence these are the most common words for this error.
Figure 7 is the word cloud plot of enhancement error. In this, the words such as document, module, python, support, option, etc., occurred the most, hence these are the most common words for this error.
Figure 8 is the word cloud plot of security error. In this, the words such as warning, module, compiler, build, etc., occurred the most, hence these are the most common words for this error.
Figure 9 is the word cloud plot of a compile error. In this, the words such as PEP, applied, refactoring, window, etc., occurred the most, hence these are the most common words for this error. Details of the most frequent words in each error are shown in the figures above. The composite plot of all errors is shown in Figure 10.
The combined word cloud plot of all errors shows that words such as fail, window, dom error, option, object, etc., occurred in almost every error and are the most commonly occurring words.
Word clouds are a visual representation of text data that display the most frequent words in a text as larger and more prominent than less frequent words. They can be useful for identifying patterns and themes in text data, including the occurrence of words for each error type. The word clouds can be interpreted to gain insights into the occurrence of words for each error type. For example, if the word cloud for spelling errors shows that the most frequent words are misspelt versions of common words, this could suggest that spell-checking tools or training may be needed to address this type of error. Similarly, if the word cloud for grammar errors shows that the most frequent words are conjunctions or prepositions, this could suggest that learners need more instruction on these types of words and their usage.

3.2. Dataset Preprocessing

Preprocessing is a data mining approach that transforms raw data into information that machines understand. Real-world data are shown to be insufficient, inconsistent, and frequently inaccurate. The following figure shows the preprocessing steps employed in this research work:
The dataset preprocessing is divided into two major steps, including raw data and basic preprocessing labelling. The basic analysis covers the size of the dataset in terms of the number of rows and columns, and checks the format of the dataset to make sure that it is in a format that can be easily read and analyzed. After the basic analysis, the null/missing values are handled to check for missing or incomplete data. Duplicate values are removed to handle it and to help stop word removal. In the third step, contractions are expanded, punctuation and extra spaces are removed, and mentions and hashtags are performed. Finally, the case convention and label encoding are performed, as shown in Figure 11. The dataset’s form is (5300,3), indicating that it has 5300 records and three characteristics. The dataset has two objects and a single integer attribute, and the attribute title has 5299 unique values and a frequency of 2. Additionally, the attribute “type” has six distinct values, indicating that the dataset comprises six classes, making this a multi-class classification problem.
Missing or null values in the dataset are the curse that must be handled properly. Otherwise, it can ruin the model and lead to wrong predictions. Fortunately, this employed dataset is free from this curse and has no null/missing values.
Redundant data creates many issues for machine learning models. The model generally learns and trains itself on the same data and tends to overfit sometimes. Removing or handling duplicate values is important to prevent the model from this issue.
The dataset had 1 duplicate value that was dropped, leaving the shape of the dataset at (5299,2). Here, the attribute Unnamed: 0 was also dropped because that is the most uncorrelated column with labels.
The advanced preprocessing stages begin from this point. One of the most crucial steps in the text data is the elimination of stop words. Stop words are a meaningless dataset that is ineffective for classifying texts since they lack any semantic value. A stop word is a frequently used term that a search engine has been configured to ignore while indexing entries for searching and retrieving them as the result of a search query. Examples of stop words include “the”, “a”, “an”, and “in”. Because it takes up database space and lengthens processing times, these types of data are ignored. Stopword elimination also aids in lowering dataset size. Stop words in Python can be eliminated by utilizing the NLTK (Natural Language Toolkit) package. NLTK is used for the removal of stopwords. The stopword lists of English words are here because the dataset is in English [18].
Punctuation, white spaces, hashtags, and mentions are all dirty text which needs to be cleaned. Moreover, digits are essential in this case because errors mostly have significant meaning against each digit or number present inside the text. That is why digits are not removed here.
To overcome the bias issue and complexity in the text for machines, case folding is important to do. Figure 12 illustrates the results of case folding, where all text has been converted into a lowercase using the Python library [19].
After successful cleaning, it is time for data transformation. The type column of the dataset is a categorical type. To transform it into a numeric type, the LabelEncoding library is used. Labels of the dataset followed the following convention, as shown in Figure 13.
Traditionally, the machine learning preprocessing completes after the label encoding process. However, as this is text data, one more step, known as the feature vector representation, is implemented. This research has performed experiments with two classical (Bag-of-word and TF-IDF) and one advanced word embedding (word2vec).
Term frequency is the weight feature, the ratio of terms’ total occurrence by a total number of terms. Equation (1) represents its formula.
T F_(t,d) = N_(t,d)/N_d
TF-IDF has a history of showing promising results in many cases. TF-IDF vectorization on the training data has also experimented with models in this research work.
tf idf(t,d,D) = tf(t,d).idf (t,D)
where
tf (t,d) = log(1 + freq (t,d))
idf (t,D) = log(N/(count (d ∈ D:t ∈ d)))
TF-IDF vectorization was imported from the sklearn library, and then the training data were passed to it for vectorization. After vectorization, the final shape of the dataset was (5299,5940), which indicates that the 5940 vectors containing the unique words based on frequency were created against 5299 records.
Word2vec is the shallow neural-network-based word embedding that Google developed in 2013. It has two models, Continuous Bag of Word and Skip gram, respectively [20].
Min_count = 5: The words with at least five characters are included, and words with less than that will be discarded.
Size = 50: Sentences with at least 50 characters will be considered.
Workers = 4: Four workers will be used in the model training.
By default, the continuous bag of words model will be trained with word2vec in this case because that is the default model.
Imbalanced datasets are a scourge that must be banished to prevent biased models. Sadly, despite the multi-classes, the selected dataset has this problem. SMOTE was combined with the random oversampling technique to balance the dataset. The Synthetic Minority OverSampling Technique is referred to as SMOTE. SMOTE is a method of oversampling in which artificial samples are produced for the minority class. This method aids in overcoming the overfitting issue brought on by random oversampling. With the use of interpolation between the positive instances that are close together, it concentrates on the feature space to produce new instances.
The dataset was balanced after SMOTE was applied.
Figure 14 illustrates how all classes are now evenly distributed, and the dataset is ready to be fed into a machine learning algorithm for classification [21].

4. Result and Analysis

Four classifiers which have been used in this research for classification with different vectorization techniques and experimental setups are:
  • Naive Bayes
  • Decision tree
  • Random forest
  • Logistic regression
Aside from the comparative analysis of classifiers, seven experiments, which are listed below, were performed:
  • Three vectorization techniques (Bag-of-words, TF-IDF and Wfigord2vec).
  • Parameter tuning using Randomized SearchCV (for both BOW and TF-IDF).
  • Comparative analysis of four models based on Accuracy, Precision, Recall, and F1-score.
The dataset was divided into a training and test dataset with an 80/20 split, meaning that 80% of the total dataset was used for training and 20% for testing. The random state of 42 is used to randomize the 80/20 picked records. These four metrics are commonly used to evaluate the performance of classification models. In order to achieve the best accuracy within the given dataset, it is important to optimize the model’s parameters and features to improve the precision, recall, and F1 score as well. A high accuracy alone may not indicate good performance if the precision, recall, or F1 score are low. Therefore, it is important to evaluate all four metrics to assess the overall performance of the model. [22].
Our main goal is to achieve the best accuracy within the given dataset with four stable parameters [23]. The four parameters, Accuracy, Precision, F1 score, and Recall, are formulated as:
Accuracy = (TP + TN)/(TP + TN + FP + FN)
Precision = TP/(TP + FP)
Recall =TP/(TP + FN)
F1 score = 2 × (Precision × Recall)/(Precision + Recall)
A group of supervised learning algorithms known as Naive Bayes methods utilize Bayes’ theorem with the “naive” assumption that each pair of features is conditionally independent given the value of the class variable [24].
As this is a multi-class classification problem, Multinomial Naives are imported from the sklearn library and incorporated with all the enlisted experiments. The results of all the experiments are concluded in Table 3.
From Table 3, it can be concluded that Naive Bayes outperformed BOW with tuned hyper-parameters. The achieved training and test accuracy was 97.14 and 88.18%, respectively.
Figure 15 is the confusion matrix of Naive Bayes with the BOW-tuned parameters model, while Figure 16 is the classification report of the respective model.
Figure 16 shows that the precision of all classes lies between the range of 73 and 95%, whereas class 4 and 5 has 100% recall, which are comparatively good scores. The F1 score shows that the model is not biased and the trained model is generalized, and it is not doing overfitting or underfitting. All classes contributed almost equally in training [25].
A broad predictive modelling tool called decision tree analysis has many applications. Decision trees are often built using an algorithmic method that finds ways to divide a data set depending on several criteria. The decision tree classifier used in this research work is imported from the sklearn trees library, and then the model was built bypassing the training dataset and labels. All the enlisted experiments were performed and concluded in Table 4.
The selected hyper-parameters for the decision tree classifier were:
criterion = “gini”, max_depth = 54, min_samples_leaf = 4, min_samples_split = 95
From Table 4, it can be inferred that the performance of the decision tree classifier with adjusted parameters and BOW and TF-IDF, respectively, was nearly the same. There is a slight difference in accuracy between BOW and TF-IDF; TFIDF yields test accuracy ratings of 87.59 percent and a training rating of 99.89 percent.
Figure 17 is the confusion matrix of the decision trees, while Figure 18 is their classification reports.
The generalized trained model is not overfitting or underfitting at all, according to the F1 score. The precision of all classes is between 71 and 98 percent, according to the categorization reports below, while classes 4 have 100% recall, which is considered a good rating. Nearly all classes contributed equally to the instruction [26].
The broad category of ensemble-based learning techniques includes random forest classifiers. They are incredibly effective across many domains, easy to adopt, and quick to use. The main idea behind the random forest method entails building a lot of “simple” decision trees during training and using a majority vote (mode) across them for classification [27]. This voting method corrects the unfavourable tendency of decision trees to overfit training data, among other things. Random forests apply the general bagging strategy to each tree in the ensemble during the training phase. Bagging continually chooses a random sample from the training set with a replacement and then fits trees to these samples. The sklearn ensemble library is used to import the random forest classifier employed in this research work. The model was then created by passing the training dataset and labels. Table 5 summarizes the results of all the trials that were included:
The selected hyper-parameters for random forest were:
criterion = “entropy”, max_depth = 79, min_samples_leaf = 1, min_samples_split = 79
Table 5 indicates that the random forest classifier beat the tweaked hyper-parameter model’s TF-IDF classifier. While the test accuracy was 91.73 percent, the achieved training correctness was 100 percent. The confusion matrix for the random forest classifier is shown in Figure 19, and the classification results for the same model are shown in Figure 20.
The precision of all classes is between 73 and 100 percent, according to the categorization reports below, while classes 4 and 5 have 100% recall, which are considered good ratings. The generalized trained model is not overfitting or underfitting at all, according to the F1 score. Nearly all classes contributed equally to the instruction.
An illustration of supervised learning is logistic regression. It is used to determine or forecast the likelihood that a binary (yes/no) event will occur. One use of machine learning to identify whether a person is likely to have the COVID-19 virus or not is through the example of logistic regression [26]. The logistic regression used in this research is imported from the sklearn linear_model library, and, then, the model was built bypassing the training dataset and labels. All the enlisted experiments were performed and concluded in Table 6.
The selected hyper-parameters for logistic regression were:
C = 10, solver = “newton-cg”
It is clear from the table that the logistic regression did not work well. The greatest test and training accuracy recorded is 88.27% and 93.37%, respectively.
The confusion matrix of logistic regression is shown in Figure 21, and the classification reports of the same model are shown in Figure 22.
The precision of all classes is between 73 and 99 percent, according to the categorization report below, while classes 4 and 5 have 100% recall, which are considered to be good ratings. The generalized trained model is not overfitting or underfitting at all, according to the F1 score. Nearly all classes contributed equally to the instruction.
In this study, errors are prioritized based on errors occurring and insights gained from the dataset is shown in Figure 23.
It is observed that the performance error occurred the most, followed by the crash error. Resource usage errors occurred the least. This error occurs mainly when the user has a large dataset, and the processing is huge.

5. Comparative Analysis

All studies showed that balanced datasets with optimal model hyper-parameters produced good results. The four classifiers, Naive Bayes, decision tree, random forest, and logistic regression, are built on balanced and imbalanced datasets. Table 7 lists all of the models’ final highest achieved accuracies [28].
The random forest classifier achieved the maximum training and test accuracy in the following hyper-parameters. You may see a diagrammatic depiction of the accuracy in Figure 24.
With the training and test accuracy, it may, therefore, be said that the random forest outperformed other classifiers. Additionally, the recall, accuracy, and F1 score outperformed those of other classifiers.
The limitation of this approach for the classification of bugs can evolve over time as cloud computing applications are updated or new features are added. This can result in models that become outdated and less accurate over time. To maintain accuracy, models must constantly be updated and retrained with new data.

6. Conclusions

Classifying bugs in cloud computing applications using machine learning techniques is a crucial task that requires a combination of technical expertise and domain knowledge. The study conducted in this work demonstrates that machine learning algorithms can be effectively used to identify and classify different types of bugs in cloud computing applications. By leveraging the vast amount of data generated by cloud computing systems, machine learning algorithms can accurately predict the presence of bugs in real-time and with a high degree of accuracy. This approach can significantly improve the efficiency of bug detection and resolution, which can help organizations to prevent costly downtime and ensure the reliable operation of their cloud computing systems. As such, the use of machine learning techniques for bug classification in cloud computing applications is a promising area for future research and development and has the potential to revolutionize the way bugs are detected and resolved in the cloud. There are several directions that future work can go down in this area. Transferring learning techniques can leverage knowledge gained from previous bug classification problems to improve the performance of bug classification in cloud computing applications. Domain adaptation techniques can be used to improve the performance of bug classification in cloud computing applications when there is a mismatch between training and test data distribution.

Author Contributions

N.T., A.N. and T.A. performed the analysis, A.T., M.T. and K.-H.K. conducted the experiments. A.T., M.T. and K.-H.K. prepared the original draft. A.N. and T.A. performed the detailed review and editing. N.T. and A.T. performed the supervision. K.-H.K. and A.N. performed the revision and improved the quality of the draft. All authors have read and agreed to the published version of the manuscript.

Funding

This research was partially supported by the MSIT (Ministry of Science and ICT), Korea, under the ITRC (Information Technology Research Center) support program (IITP2021-2021-0-01835) and the research grant (No. 2021-0-00590 Decentralized High-Performance: 2021-0-00590; IITP2021-2021-0-01835). This research was also partially supported by KIAT (Korea Institute for Advancement of Technology) grant funded by the Korea Government (MOTIE) (P0008703, The Competency Development Program for Industry Specialist) and the Basic Science Research Program through the National Research Foundation of Korea (NRF) funded by the Ministry of Education (2021R1F1A1045861).

Institutional Review Board Statement

Not applicable.

Informed Consent Statement

Not applicable.

Data Availability Statement

The data used in this paper can be obtained from the corresponding author upon request.

Conflicts of Interest

The authors declare that they have no conflicts of interest regarding the publication of this work.

References

  1. Kim, J. Deep Learning vs. Machine Learning vs. AI: An InDepth Guide, readspeaker.ai, 3 May 2021. Available online: https://www.readspeaker.ai/blog/deep-learning-vs-machine-learning/ (accessed on 16 July 2022).
  2. Thota, M.K.; Shajin, F.H.; Rajesh, P. Survey on software defect prediction techniques. Int. J. Appl. Sci. Eng. 2020, 17, 331–344. [Google Scholar] [CrossRef]
  3. Iqbal, S.; Naseem, R.; Jan, S.; Alshmrany, S.; Yasar, M.; Ali, A. Determining Bug Prioritization Using Feature Reduction and Clustering With Classification. IEEE Access 2020, 8, 215661–215678. [Google Scholar] [CrossRef]
  4. Umer, Q.; Liu, H.; Sultan, Y. Emotion Based Automated Priority Prediction for Bug Reports. IEEE Access 2018, 6, 35743–35752. [Google Scholar] [CrossRef]
  5. Harer, J.A.; Kim, L.Y.; Russell, R.L.; Ozdemir, O.; Kosta, L.R.; Rangamani, A.; Hamilton, L.H.; Centeno, G.I.; Key, J.R.; Ellingwood, P.M.; et al. Automated software vulnerability detection with machine learning. arXiv 2018, arXiv:1803.04497. [Google Scholar]
  6. Waqar, A. Software Bug Prioritization in Beta Testing Using Machine Learning Techniques. J. Comput. Soc. 2020, 1, 24–34. [Google Scholar]
  7. Huda, S.; Liu, K.; Abdelrazek, M.; Ibrahim, A.; Alyahya, S.; Al-Dossari, H.; Ahmad, S. An Ensemble Oversampling Model for Class Imbalance Problem in Software Defect Prediction. IEEE Access 2018, 6, 24184–24195. [Google Scholar] [CrossRef]
  8. Goyal, A.; Sardana, N. Empirical Analysis of Ensemble Machine Learning Techniques for Bug Triaging. In Proceedings of the 2019 Twelfth International Conference on Contemporary Computing (IC3), Noida, India, 8–10 August 2019; pp. 1–6. [Google Scholar] [CrossRef]
  9. Gupta, A.; Sharma, S.; Goyal, S.; Rashid, M. Novel XGBoost Tuned Machine Learning Model for Software Bug Prediction. In Proceedings of the 2020 International Conference on Intelligent Engineering and Management (ICIEM), London, UK, 17–19 June 2020; pp. 376–380. [Google Scholar] [CrossRef]
  10. Ahmed, H.A.; Bawany, N.Z.; Shamsi, J.A. CaPBug-A Framework for Automatic Bug Categorization and Prioritization Using NLP and Machine Learning Algorithms. IEEE Access 2021, 9, 50496–50512. [Google Scholar] [CrossRef]
  11. Sarwar, M.I.; Iqbal, M.W.; Alyas, T.; Namoun, A.; Alrehaili, A.; Tufail, A.; Tabassum, N. Data Vaults for Blockchain-Empowered Accounting Information Systems. IEEE Access 2021, 9, 117306–117324. [Google Scholar] [CrossRef]
  12. Leotta, M.; Olianas, D.; Ricca, F. A large experimentation to analyze the effects of implementation bugs in machine learning algorithms. Future Gener. Comp. Syst. 2022, 133, 184–200. [Google Scholar] [CrossRef]
  13. Hai, T.; Zhou, J.; Li, N.; Jain, S.K.; Agrawal, S.; Dhaou, I.B. Cloud-based bug tracking software defects analysis using deep learning. J. Cloud. Comp. 2022, 11. [Google Scholar] [CrossRef]
  14. Pandey, N.; Sanyal, D.K.; Hudait, A.; Sen, A. Automated classification of software issue reports using machine learning techniques: An empirical study. Innov. Syst. Softw. Eng. 2017, 13, 279–297. [Google Scholar] [CrossRef]
  15. Tabassum, N.; Alyas, T.; Hamid, M.; Saleem, M.; Malik, S. Hyper-Convergence Storage Framework for EcoCloud Correlates. Comput. Mater. Contin. 2022, 70, 1573–1584. [Google Scholar] [CrossRef]
  16. Catolino, G.; Palomba, F.; Zaidman, A.; Ferrucci, F. Not all bugs are the same: Understanding, characterizing, and classifying bug types. J. Syst. Softw. 2019, 152, 165–181. [Google Scholar] [CrossRef]
  17. Kukkar, A.; Mohana, R. A Supervised Bug Report Classification with Incorporate and Textual field Knowledge. Procedia Comput. Sci. 2018, 132, 352–361. [Google Scholar] [CrossRef]
  18. Shuraym, Z. An efficient classification of secure and non-secure bug report material using machine learning method for cyber security. Mater. Today Proc. 2021, 37, 2507–2512. [Google Scholar] [CrossRef]
  19. Kukkar, A.; Mohana, R.; Nayyar, A.; Kim, J.; Kang, B.-G.; Chilamkurti, N. A Novel Deep-Learning-Based Bug Severity Classification Technique Using Convolutional Neural Networks and Random Forest with Boosting. Sensors 2019, 19, 2964. [Google Scholar] [CrossRef] [PubMed] [Green Version]
  20. Dam, H.K.; Pham, T.; Ng, S.W.; Tran, T.; Grundy, J.; Ghose, A.; Kim, C.J. Lessons learned from using a deep tree-based model for software defect prediction in practice. In Proceedings of the IEEE International Working Conference on Mining Software Repositories, Montreal, QC, Canada, 26–27 May 2019; pp. 46–57. [Google Scholar] [CrossRef]
  21. Bani-Salameh, H.; Sallam, M.; Al Shboul, B. A deep-learning-based bug priority prediction using RNN-LSTM neural networks. E-Inform. Softw. Eng. J. 2021, 15, 29–45. [Google Scholar] [CrossRef]
  22. Ramay, W.Y.; Umer, Q.; Yin, X.C.; Zhu, C.; Illahi, I. Deep Neural Network-Based Severity Prediction of Bug Reports. IEEE Access 2019, 7, 46846–46857. [Google Scholar] [CrossRef]
  23. Polat, H.; Polat, O.; Cetin, A. Detecting DDoS Attacks in Software-Defined Networks Through Feature Selection Methods and Machine Learning Models. Sustainability 2020, 12, 1035. [Google Scholar] [CrossRef] [Green Version]
  24. Umer, Q.; Liu, H.; Illahi, I. CNN-Based Automatic Prioritization of Bug Reports. IEEE Trans. Reliab. 2020, 69, 1341–1354. [Google Scholar] [CrossRef]
  25. Ni, Z.; Li, B.; Sun, X.; Chen, T.; Tang, B.; Shi, X. Analyzing bug fix for automatic bug cause classification. J. Syst. Softw. 2020, 163, 110538. [Google Scholar] [CrossRef]
  26. Aung, T.W.W.; Wan, Y.; Huo, H.; Sui, Y. Multi-triage: A multi-task learning framework for bug triage. J. Syst. Softw. 2022, 184, 111133. [Google Scholar] [CrossRef]
  27. Hirsch, T. Using textual bug reports to predict the fault category of software bugs. Array 2022, 15, 100189. [Google Scholar] [CrossRef]
  28. Wu, H. A spatial–temporal graph neural network framework for automated software bug triaging. Knowl. Based Syst. 2022, 241, 108308. [Google Scholar] [CrossRef]
Figure 1. Proposed System Model.
Applsci 13 02880 g001
Figure 2. Bar chart of attribute “type”.
Applsci 13 02880 g002
Figure 3. Most frequent unigrams of dataset.
Applsci 13 02880 g003
Figure 4. Word Cloud of “Performance error”.
Applsci 13 02880 g004
Figure 5. Word cloud of “Resource usage” error.
Applsci 13 02880 g005
Figure 6. Word cloud of “Crash” error.
Applsci 13 02880 g006
Figure 7. Word cloud of “Enhancement” error.
Applsci 13 02880 g007
Figure 8. Word cloud of “Security” error.
Applsci 13 02880 g008
Figure 9. Word cloud of “Compile” error.
Applsci 13 02880 g009
Figure 10. Integrated word cloud of all errors.
Applsci 13 02880 g010
Figure 11. Dataset Preprocessing.
Applsci 13 02880 g011
Figure 12. Dataset after case conversion.
Applsci 13 02880 g012
Figure 13. Label Encoding.
Applsci 13 02880 g013
Figure 14. Balanced Dataset.
Applsci 13 02880 g014
Figure 15. Confusion matrix of Naive Bayes.
Applsci 13 02880 g015
Figure 16. Classification Report of Naive Bayes.
Applsci 13 02880 g016
Figure 17. Confusion matrix of the decision tree.
Applsci 13 02880 g017
Figure 18. Classification Report of the decision tree.
Applsci 13 02880 g018
Figure 19. Confusion matrix of random forest.
Applsci 13 02880 g019
Figure 20. Classification report of random forest.
Applsci 13 02880 g020
Figure 21. Confusion matrix of logistic regression.
Applsci 13 02880 g021
Figure 22. Classification report of logistic regression.
Applsci 13 02880 g022
Figure 23. Prioritization of bugs in SaaS applications.
Applsci 13 02880 g023
Figure 24. Accuracy plot of comparative analysis (Training vs. Testing).
Applsci 13 02880 g024
Table 1. Dataset Description.
SR#AttributeDescriptionDataType
1UnnamedThe column has unique ID’s against each record.Integer
2TitleThe column contains all text of error as a record.Object
3TypeLabel column.Integer
Table 2. Types of bug.
TitleType
Doc strings omitted from ASTPerformance
Upload failed (400): Digests do not match on .tar.gz ending with x0d binary code Resource usage
ConfigParser writes a superfluous final bank linePerformance
csv.reader() to support QUOTE_ALLCrash
IDLE: make smart indent after comments line consistent Performance
xml.etree.Elementinclude does not include nested xincludes Crash
Add Py_BREAKPOINT and sys._breakpoint hooksCrash
documentation of ZipFile file name encoding Performance
Allow ‘continue’ in ‘finally’ clause Crash
Move unwinding od stack for “pseudo exceptions” from interpreter to compile Crash
Improve regular expression HOWTOCrash
Windows python cannot handle an early PATH entry containing “…” and python.exe Enhancement
tkinter after_cancel does not behave correctly when called with id=None Performance
PEP 1: Allow provisional status for PEPs Crash
os.chdir(), os.getcwd() may crash on windows in presence of racesEnhancement
tk busy command Crash
os.chdir() may leak memory on windows Compiler error
Table 3. Results of Naive Bayes.
Sr#DatasetBOWTF-IDFWord2vecPT—BOWPT—TFIDF
1ImbalanceTrain: 86.43
Test: 66.66
Train: 81.42
Test: 65.28
Train: 98.47
Test: 34.16
Train: 64.98
Test: 65.13
Train: 66.19
Test: 66.19
2BalanceTrain: 91.66
Test: 83.54
Train: 91.89
Test: 84.11
Train: 92.11
Test: 41.29
Train: 93.34
Test: 87.01
Train: 97.14
Test: 88.18
Table 4. Results of the decision tree.
Sr#DatasetBOWTF-IDFWord2vecPT—BOWPT—TFIDF
1ImbalanceTrain: 100
Test: 62.89
Train: 100
Test: 61.88
Train: 99.81
Test: 43.11
Train: 99.52
Test: 64.02
Train: 100
Test: 65
2BalanceTrain: 100
Test: 86.14
Train: 99.98
Test: 85.56
Train: 99.28
Test: 43.12
Train: 100
Test: 88.45
Train: 100
Test: 87.79
Table 5. Results of random forest.
Sr#DatasetBOWTF-IDFWord2vecPT—BOWPT—TFIDF
1ImbalanceTrain: 100
Test: 66.54
Train: 100
Test: 66.03
Train: 99.81
Test: 57.91
Train: 100
Test: 64.84
Train: 100
Test: 65.53
2BalanceTrain: 100
Test: 89.52
Train: 99.24
Test: 88.76
Train: 100
Test: 58.12
Train: 100
Test: 90.86
Train: 100
Test: 91.73
Table 6. Results of logistic regression.
Sr#DatasetBOWTF-IDFWord2vecPT—BOWPT—TFIDF
1ImbalanceTrain: 95.44
Test: 66.28
Train: 84.33
Test: 65.66
Train: 48.47
Test: 46.60
Train: 66.66
Test: 65.78
Train: 67.14
Test: 66.16
2BalanceTrain: 90.52
Test: 87.52
Train: 92.24
Test: 86.22
Train: 40.12
Test: 42.15
Train: 93.37
Test: 88.27
Train: 90.03
Test: 85.55
Table 7. The accuracy of various classifiers.
SR#ClassifierTraining AccuracyTest Accuracy
1Naive Bayes93.84%87.01%
2Decision tree100%88.45%
3Random forest100%91.73%
4Logistic regression93.37%88.27%
Disclaimer/Publisher’s Note: The statements, opinions and data contained in all publications are solely those of the individual author(s) and contributor(s) and not of MDPI and/or the editor(s). MDPI and/or the editor(s) disclaim responsibility for any injury to people or property resulting from any ideas, methods, instructions or products referred to in the content.

