Article

Evaluation of Methods Based on CPTu Testing for Prediction of the Bearing Capacity of CFA Piles

Department of Geotechnics, Faculty of Civil Engineering, University of Žilina, Univerzitná 8215/1, 010 26 Žilina, Slovakia
*
Author to whom correspondence should be addressed.
Appl. Sci. 2023, 13(5), 2931; https://doi.org/10.3390/app13052931
Submission received: 16 December 2022 / Revised: 17 February 2023 / Accepted: 23 February 2023 / Published: 24 February 2023
(This article belongs to the Special Issue Pile Foundation Analysis and Design)

Abstract

:

Featured Application

Output of the presented study can serve as a theoretical foundation for application of methods for designing of pile foundations or can serve as a reference study for realization of piles at similar conditions.

Abstract

Analysis of pile bearing capacity is an important task in the investigation of soil-structure interaction. The paper is dedicated to the prediction methods for the pile bearing capacity calculation based on the cone penetration test (CPTu) results, namely UniCone method, Laboratoire Central des Ponts et Chaussées method (LCPC), and the method involved in the Eurocode 7—2. A set of CFA piles was tested to obtain reference bearing capacity. The ability of the prediction methods to determine the bearing capacity of the pile was investigated. In each evaluation criteria using statistical tools, the methods were ranked based on their performance. The results of the study indicate that the UniCone method is most applicable for the given conditions. The EC 7—2 method showed the largest variability of results, and we do not recommend its application without a deeper analysis. The applicability of any presented method cannot be considered final or universal. It is advisable to use more modern and updated methods which have been developed from a larger database of pile tests. The development of these methods should continue by expanding the database of tested piles together with the application of more advanced rock environment testing procedures.

1. Introduction

Various types of piles can be utilized in civil engineering practice. The response of the pile to the load considerably varies depending on the installation method or technology, respectively. There are non-displacement piles on one side of the spectrum (e.g., bored piles or drilled shaft piles) and the full-displacement piles on the other side (e.g., closed-end pipe piles or precast reinforced concrete piles). Non-displacement piles are constructed by removing drilled-out soil and replacing the soil with concrete or another suitable material [1,2,3]. Full-displacement piles are driven in the ground using variety of materials, technical design, and utilization [4,5,6,7,8,9]. Significant changes in porosity and overall stress state in the soil occur during the driving of the pile. The soil around the pile shaft is drifted mainly in the horizontal direction while the soil beneath the pile tip is compacted (densification of the soil). These factors lead to improving the ground stiffness during the installation of full-displacement piles in comparison with non-displacement piles, especially in the case of sandy soils [10].
Pile utility depends on the proper approximation of the pile–soil relation. Uncertainties in the understanding of such a relation consists of the variability of ground properties, measurement errors, and transformation of data during experimental works. Several uncertainties that cannot be described with sufficient reliability level lead to adopting the correlations between ground test outputs and required “structural” parameters of the rock environment [11,12,13].
Analysis of pile bearing capacity is an important task in the investigation of soil-structure interaction and the safe, economic, and effective design of the structure should be the output of the analysis. Despite the large database of case studies, practical application of pile design methods based on in situ testing requires proper care because of a large variety of ground conditions, pile types, and some shortcomings of the methods itself [14,15,16]. Statistical analyses with empirical approaches are widely used to avoid the above-mentioned uncertainties [17,18,19,20].
Uncertainties in the pile bearing capacity evaluation based on the strength and deformation characteristics of soils, designated as indirect methods, lead to adopting the direct relation between in situ test results of penetration testing (cone tip resistance qb, shaft friction fs, pore pressure u1 and u2, or shear and pressure waves velocity) and the pile bearing capacity [21,22]. The direct approach allows to avoid the two-step derivation of soil parameters and reduces the level of uncertainty that is increased by each step.
Laboratory testing provides useful information in the case of clayey soils but in the case of sand or coarse-grained soils, it is difficult to obtain a non-disturbed soil specimen in the original stress state. Despite the improvement of numerical and analytical methods, the empirical approach is widely used for the design pile foundations. This approach is supported by the load tests of piles and outputs of in situ surveys, especially penetration and borehole testing [23,24,25,26].
Interpretation and application of penetration test data requires the appropriate approach and evaluation method [27,28]. The paper is dedicated to the direct design or prediction methods for the pile bearing capacity calculation based on the cone penetration test (CPT) results, namely the UniCone method, Laboratoire Central des Ponts et Chaussées method (LCPC), and the method involved in the Eurocode 7—2. Design methods were selected in accordance with the recent research and the possibility of application of the CPT method for the design of Continuous Flight Auger piles (CFA). These methods are developed on the basis of a large set of various pile types and ground conditions, e.g., soil types and properties. The study is conceived as a direct application of selected methods in the rock environment that can be characterized as quasi-homogenous halfspace with a layer of soil with higher bearing capacity in which pile tips are situated. Applicability of prediction methods in such conditions is investigated using the basis of CPT and pile load tests with utilization of statistical tools.

2. Materials and Methods
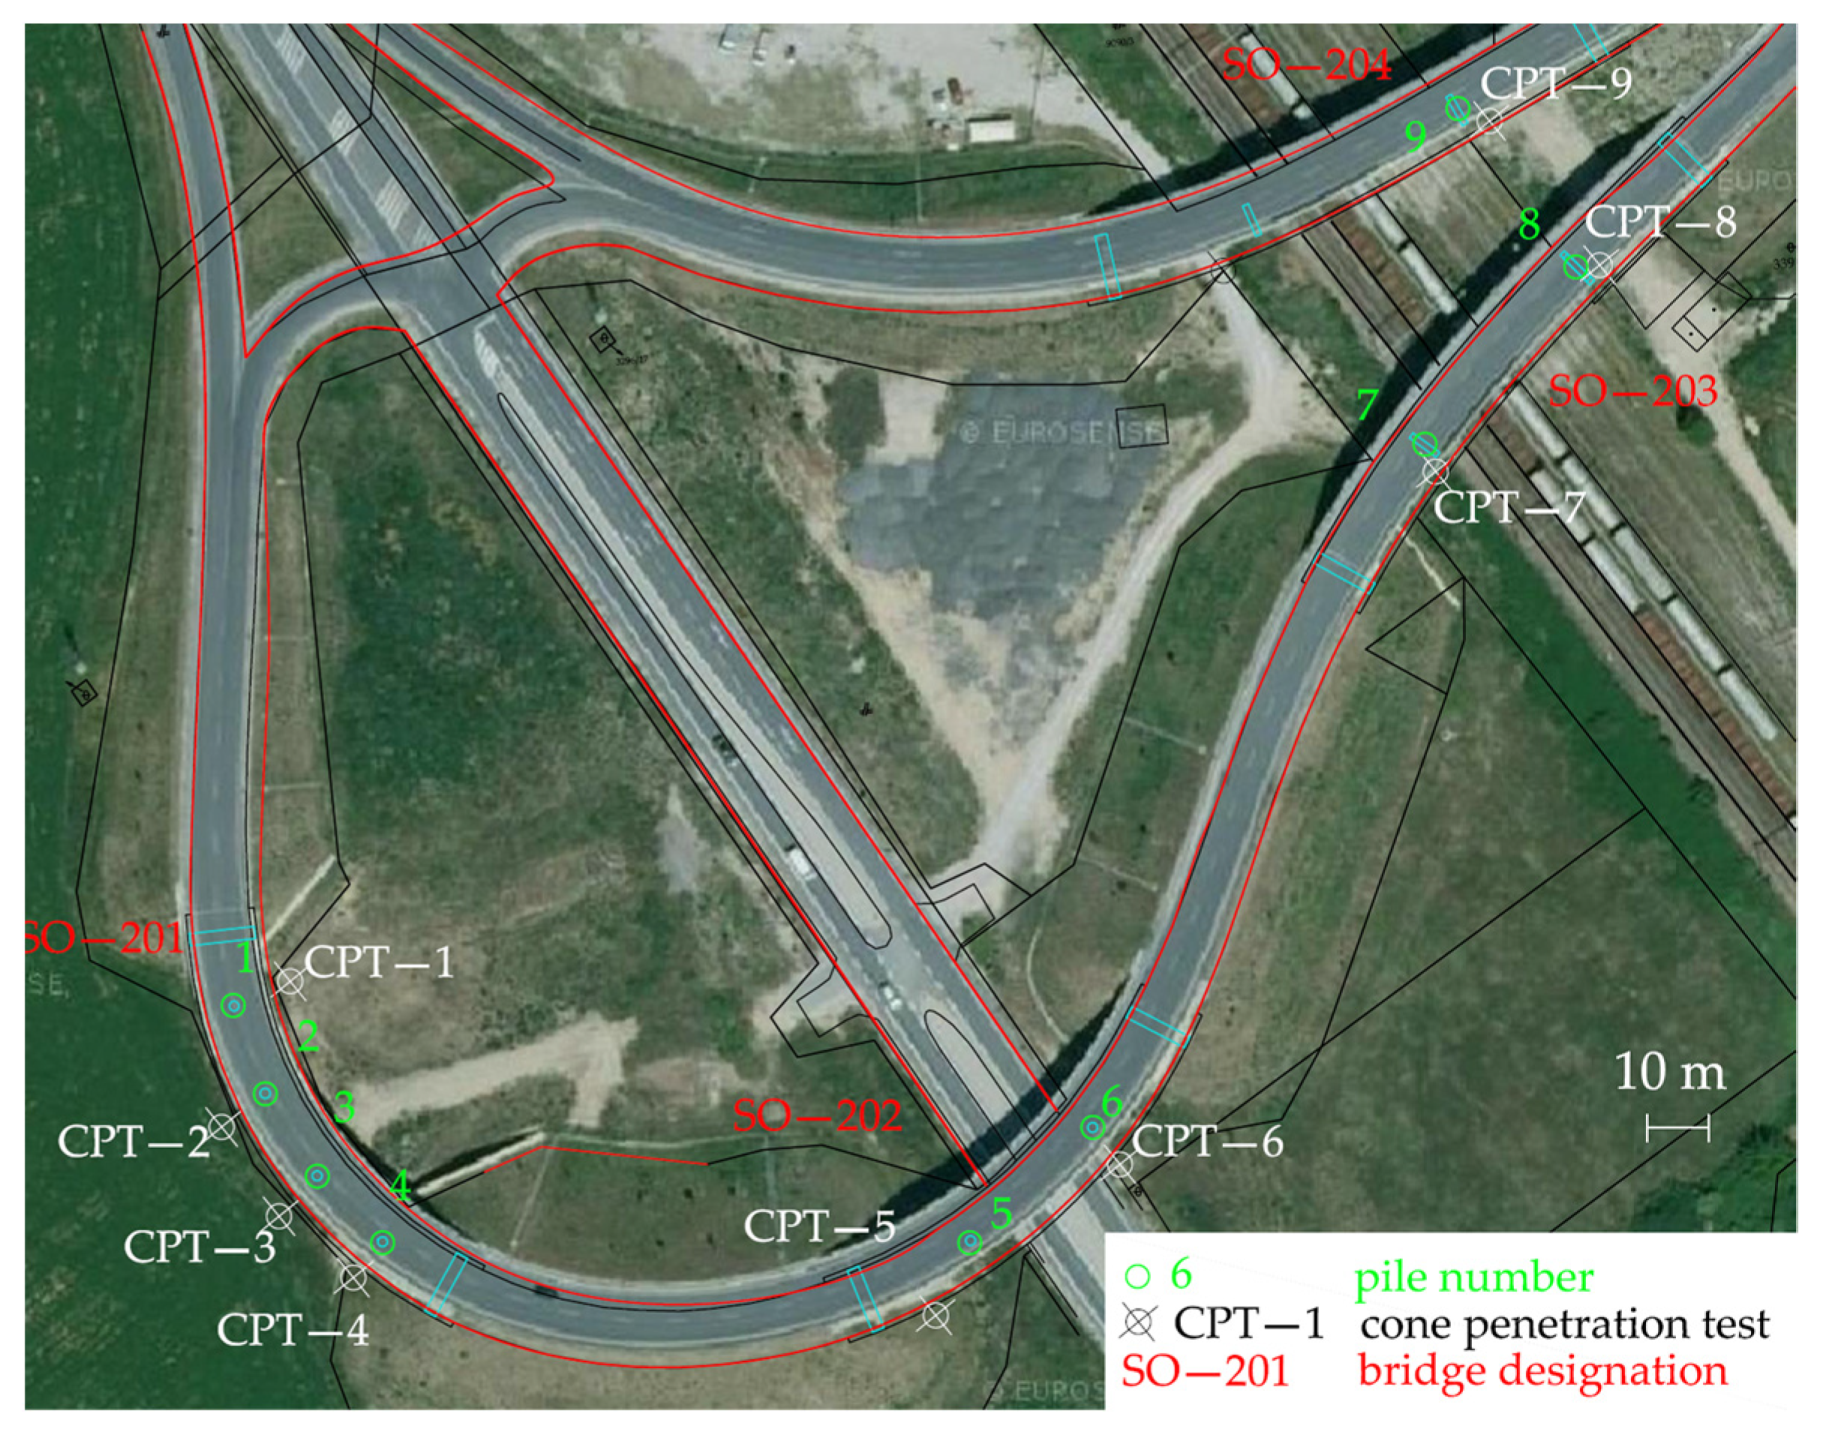
To evaluate the bearing capacity of CFA piles calculated by the above-mentioned methods, a static load test was conducted on selected piles in pile groups of bridge foundations during construction. Cone penetration tests were then proposed to link the outputs of CPT testing and experimental measurements on piles which can be considered as a reference database. Detailed description of investigated geological conditions at the site, tested CFA piles, and CPT testing is mentioned in the following sections.

2.1. Pile Test Site

The test site for in situ CPT testing and experimental measurement of piles is part of the city bypass with bridges designated as SO—201 to SO—204 (Figure 1). A geological survey involving boreholes and dynamic penetration tests (DPTs) was performed to describe the geological conditions in the designed route. For the research purpose, additional CPTu probes with continuous record of data were realized using piezoelectric cone with sensor for measurement of pore pressure u2. Probes were situated at already constructed bridges SO—201 to SO—204, near the foundations of pillars (Figure 1).
Detailed geological characterization is mentioned in the survey report [29]. The terrain of the locality is mainly planar with elevation of 153.8 to 154.3 m above sea level. Top-soil layers consist of eolian deposit, namely washed-out clayed loess. Fluvial sands and gravels were located in lower positions and they act as an aquifer for groundwater. The typical geological profile is described below:
  • Topsoil with humus with thickness of 0.3–0.5 m;
  • Silt with intermediate plasticity and firm consistency with thickness of 0.3–0.7 m;
  • Loess–eolian clay with low to intermediate plasticity and stiff to hard consistency with tubules with thickness of 7.6–10.1 m. Some positions are washed-out;
  • Fluvial deposits–clayey sand, sand to gravel, clayey gravel and gravel with loose to medium density with the thickness of 0.9–3.1 m;
  • Neogene deposits–clay with intermediate to high plasticity and firm to stiff consistency, sandy clay to clayey sand.
Groundwater level was located in the fluvial sand and gravel deposits during survey.
Collapsibility of loess was investigated by the oedometric tests where the coefficient of collapsibility Im was in the interval from 0.20 to 3.63%. Soil is considered collapsible if Im > 1.0%. Most of the quaternary clay layers were declared as collapsible [29]. Loess represents a risk factor for ultimate and serviceably limit state of the structure because of the lower structural stability of the soil skeleton [30,31,32,33]. Therefore, a pile foundation was proposed for realized bridges with load testing of selected piles. Additionally, monitoring of the structure during service life using geodetic methods, laser scanning, or various types of sensors can be adopted [34,35,36,37].

2.2. Continuous Flight Auger Piles (CFA)

CFA method allows to exclude the casing of the borehole, while the soil remains at the drill thread and supports the shaft. The method is suitable for dry and saturated cohesionless soils and for most of the cohesive soils without hard drillable insertions. Drilling is executed in the shortest possible time with minimum revolutions of the auger to minimize the effect of drilling on the surrounding soil. In the first step, the auger is drilled to the designed depth. Subsequently, concrete is injected with simultaneous withdrawal of the auger with the remains of soil. Withdrawal of the auger takes place without its rotation but some rotation to the drilling direction can be performed at certain conditions. Concrete injection is performed through the auger pipe connected to the concrete mixture pump. In the final step, the reinforcement cage is inserted into the concrete [3,38].
Pillars of selected bridges were supported by the CFA piles. All tested piles were manufactured using same technology in similar geological conditions and with the same pile diameter of 1.0 m. The length varied from 5.4 to 8.6 m and the pile tip was situated in the layer of fluvial sandy and gravelly sediments. Because of the lower bearing capacity of the Neogene deposit below fluvial sediments, the pile length was adjusted so the pile can end in sandy and gravelly soils with potentially higher bearing capacity. Embedment of the pile into this layer varied depending on the actual pile shaft depth during manufacturing.

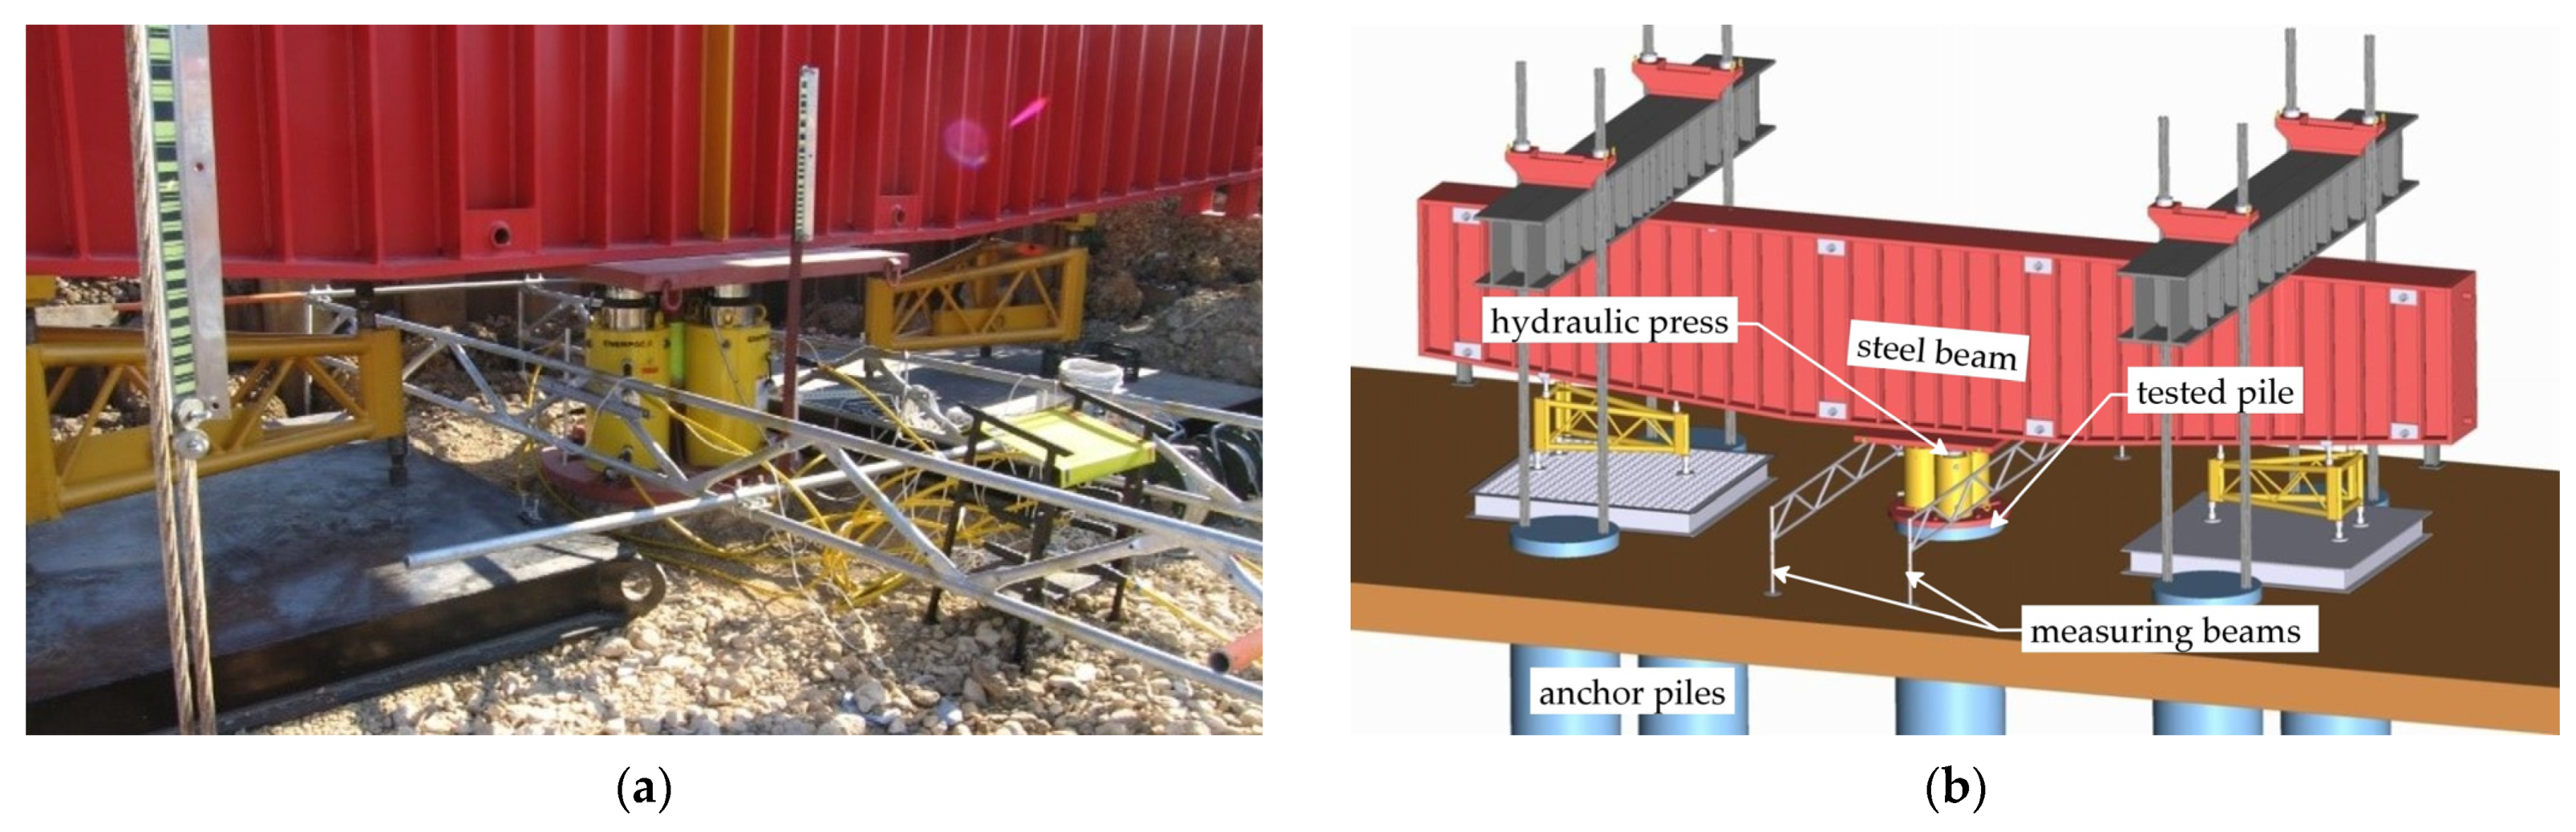
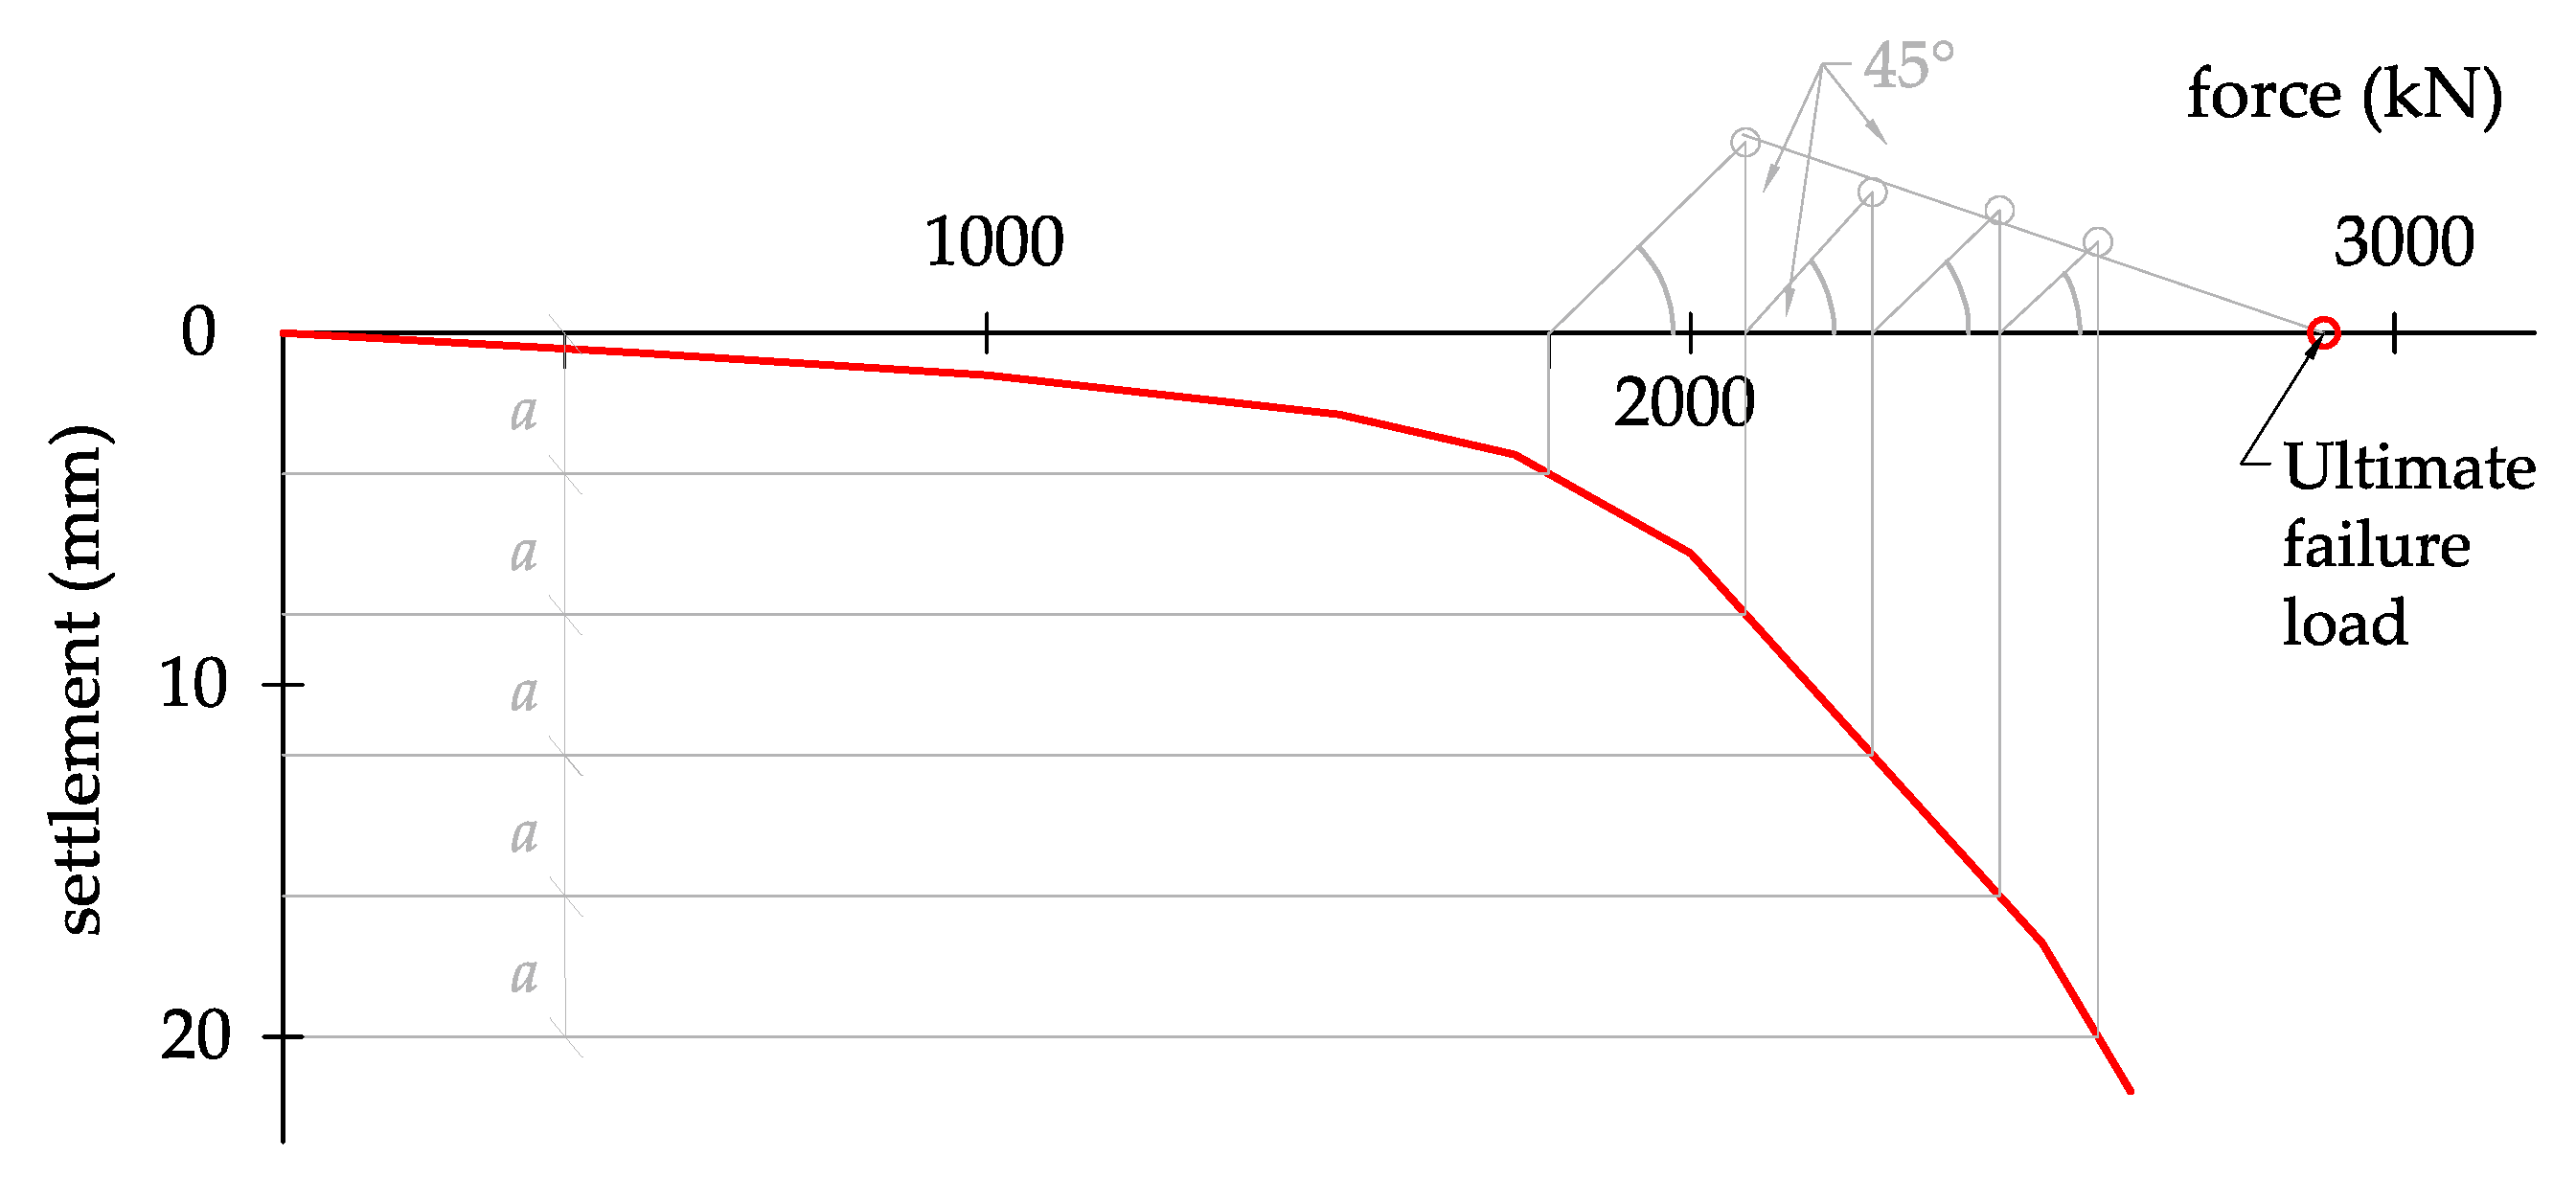
2.2.1. Static Load Tests of Piles

One pile of each pile group under the bridge pillar was tested using the static load test. Overall, 9 CFA piles were tested and they remained as a part of the deep foundation after testing or as system piles.
Loading equipment for pile load tests consisted of a steel beam (loading bridge) which was anchored to the 4 already manufactured piles acting as a counterweight during loading. Hydraulic presses were placed on the pile cap under the steel beam (Figure 2). Loading force was measured with the dynamometers and with the pressure sensors at hydraulic presses at the same time. Actual and overall settlement at every loading step were measured with the inductive displacement sensors attached on the reference measuring beams and equally positioned around the pile head. Pile head settlement was also controlled with the precise levelling geodetic method.
Maximum loading force Vmax was limited to 1.5 multiple of the design load Vd. Pile head settlement was observed every minute until attenuation at every loading step. This was defined as a maximum change in settlement of 0.05 mm during last 15 min. The number of loading steps and load increment were set in accordance with the maximum load Vmax during the test. At least 6 loading steps were applied with load increment in interval from 11% to 25% of Vmax. After 2/3 of Vmax was achieved in the first cycle, the pile was unloaded to zero load with continuous record of pile head displacement during at least 3 unloading steps. After unloading and settlement attenuation, the pile was loaded up to Vmax during the second cycle. Unloading during this cycle was performed in at least 4 unloading steps, with exception of pile No. 9, where only 3 unloading steps were realized.

2.2.2. Pile Load Test Evaluation

Determination of measured pile bearing capacity was based on analysis of load/pile cap settlement plot using the Mazurkiewicz method [40]. This method is further described in [41,42,43,44,45,46,47,48,49]. The method approximates the load/settlement curve to parabola and the bearing capacity is investigated graphically. Lines parallel to the loading force axis are plotted in random intervals a (Figure 3). While there is no exact guide to estimate this interval, several values were applied and evaluated. According to various authors, smaller intervals should lead to more accurate results. Perpendicular to the loading force axis is constructed the intersection of the parallel line and load/settlement curve. From the intersection axis, a 45° line is plotted to the intersection with next one perpendicular. These intersections create an approximation line that ends at the loading force axis where the bearing capacity is read. In some cases, the points do not create a clear line so certain adjustment of the line is allowed. A narrower interval a brings more accurate results of bearing capacity. The method is more reliable for curves close to the ultimate failure load. An example of pile bearing capacity evaluation for pile No. 5 is displayed in Figure 3.

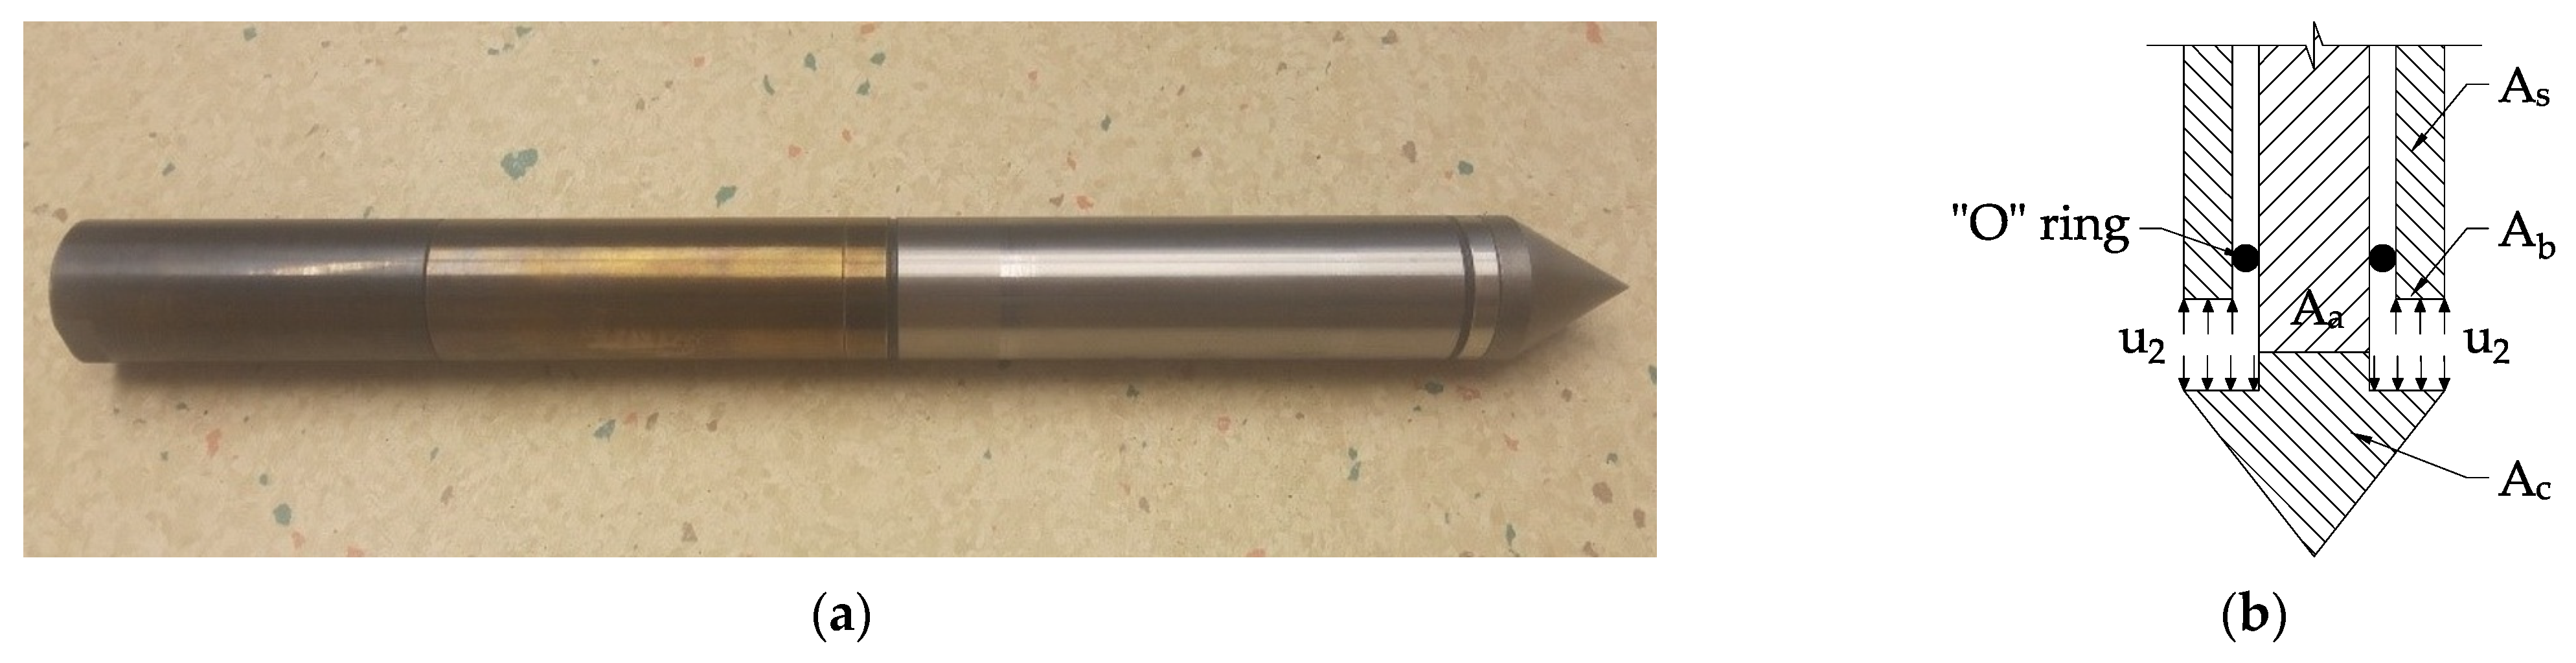
2.3. Cone Penetration Testing and Pile Bearing Capacity Prediction

The cone penetration test is based on the determination of the penetration resistance of soil against static pressing of the cone. It is one of the quick and reliable survey methods of soils and semi-rocks. For practical application, appropriate interpretation of observed data is crucial. Therefore, combination with other survey methods, such as boreholes, is suitable. Probing is performed without sampling of soil specimens and because of this, the method is less disturbing to the environment. The method is preferred mainly for fine-grained clayey, silty, and sandy soils [10].
In principle, a penetration cone is similar to a small driven “pile” when the cone tip resistance qs and shaft friction fs correspond to the pile tip bearing capacity and shaft bearing capacity, respectively. The piezoelectric penetration cone used in this study and the principle of pore pressure measurement are displayed in Figure 4.
Evaluation of pile bearing capacity represents one of the most frequent applications of in situ test results. Utilization of CPT testing as a survey method arises the need of a proper connection between the test data and applicable quantities for designing structures. Because of the indirect nature of output data, a relation must be set up to convert the cone tip resistance or the shaft friction into components of pile bearing capacity.
Pile bearing capacity analysis underwent a considerable development recently. Aside from the formulation of shaft friction based on soil strength parameters, alternative approaches have been adopted involving investigation of friction at the soil–pile interface. Additional variables that affect the pile bearing capacity were studied such as stress history, pile slenderness, soil sensitivity, plasticity of clayey soils, relative density of cohesionless soils, failure mechanism progress, pile installation method or compressibility of pile and soil. Similarly, the pile tip bearing capacity component primarily depends on the conditions within the influence zone, pile tip shape, installation process, strength and stiffness of the ground around the pile tip, loading rate, groundwater effect, etc. Several theories of bearing capacity and their modifications were proposed such as limit plasticity, elastoplasticity, theory of dilatancy strength or particle breaking theory. This led to derivation of more sophisticated calculation formulas [51].
Considering the above-mentioned similarity of a penetration cone and a pile, the bearing capacity components can be generally expressed as follows [52,53]:
Q p = Q b + Q s ,
Q p = A b   ×   q b + O p 0 h f p   dz = A b   ×   q b + O p i f p i   ×   h i ,
where Qp is overall bearing capacity of a pile; Qb is bearing capacity of a pile tip; Qs is a pile shaft bearing capacity, qb is average penetration resistance at the pile tip derived from interval depending on the method; fpi is unit shaft friction in i-th layer; Ab is pile cross-section; d is diameter of a pile; Op is circumference of a pile; and hi is the thickness of an i-th soil layer.
Pile bearing capacity calculation based on CPT data can be performed in two main ways: The first group is designated as direct methods and the second one as indirect or rational methods with division into another sub-groups. Despite the major contribution to this problem, several design methods have fundamental disadvantages [50,54,55]. Soil behavior is governed by the complex stress–strain state changes already occurring during manufacturing or installation and throughout the service life of a pile. Because of uncertainty at bearing capacity calculation based on strength and deformation characteristics of soils, direct correlation between the pile bearing capacity components and CPT results is the most practically utilized approach.
This paper is dedicated to the direct methods of pile design based on CPT results, namely the UniCone method, Laboratoire Central des Ponts et Chaussées method (LCPC) and the method involved in Eurocode 7—2 [56,57].

2.3.1. UniCone Method

The UniCone method was proposed by Eslami and Fellenius and it underwent several modifications summarized by Niazi [10,58]. The method uses three quantities of CPTu measurement using piezoelectric cone and it provides bearing capacity calculation for various pile types manufactured by different technologies. Modification involves extension of pile load test database from 142 to 330 pile tests.
The method prefers geometric averaging to obtain filtered and representative values for determining the pile tip bearing capacity using corrected cone tip resistance (Equations (3)–(5)):
qe = qtu2,
q E g = q e , 1 ×   q e , 2   ×     ×   q e , n n ,
q b = C t e   ×   q E g ,
where qt is the corrected penetration resistance; u2 is the pore pressure; Cte is the correlation coefficient for the pile tip based on pile diameter d (Cte = 1.0 if d ≤ 0.4 m, Cte = 1/3d if d > 0.4 m); qEg is geometric average of effective cone resistance; and qe,n is effective cone resistance.
Unit shaft friction fp is calculated for a particular soil layer (Equation (6)):
f p = C s e   ×   q E ,
where Cse is correlation coefficient based on soil type in classification chart (Figure 5) and qE is average of values of effective cone resistance.
Correlation coefficient Cse is selected according to CPT outputs in classification chart in Figure 5 and corresponding zone in Table 1.

2.3.2. LCPC Method

The Laboratoire Central des Ponts et Chaussées (LCPC) was developed by Bustamante and Gianeselli. It is based on the analysis of 197 static pile load tests on 96 pile foundations at 48 sites in various soil types such as clay, sand, gravel, weathered rock, mud, peat, or weathered chalkstone. The method also considers various pile manufacturing or installation technologies [59].
To determine the pile tip bearing capacity qb, an averaging approach of characteristic value of cone resistance qc below pile tip in interval 1.5d above and 1.5d below pile tip is adopted, where d is a pile diameter. The unit cone resistance at pile tip qb is calculated as follows (Equation (7)):
q b = k b   ×   q c , e q ,
where kb is the reduction coefficient for bearing capacity at the pile tip and qc,eq is the equivalent average penetration resistance. Coefficient kb = 0.40 for non-displacement piles with the tip in clay and silt and kb = 0.15 for piles with the tip in sand and gravel [60].
Shaft friction is calculated from penetration resistance and the limit value of unit shaft friction fp is determined according to the soil type and pile manufacturing technology (Equation (8)):
f p = q e q k s     f p , m a x ,
where ks is reduction coefficient of pile shaft bearing capacity; qeq is equivalent average of penetration resistance in a soil layer; and fp,max is maximum value of unit shaft friction in a soil layer.

2.3.3. Eurocode 7—2 Method

The method involved in Eurocode 7—2 is based on the Dutch standard NEN 6743-1 Geotechniek–Berekeningsmethode voor funderingen op palen–Drukpalen (Koppejan method) [57]. The maximal unit resistance at pile tip qb, which is limited to 15 MPa, is determined as follows (Equation (9)):
q b = 0.5   ×   α p   ×   β   ×   s ( q c ; I ; e + q c ; II ; e 2 + q c ; III ; e )   15   MPa ,
where αp is the pile type coefficient (0.8 for CFA piles); β is the pile tip shape coefficient (β = 1.0 for circular piles); s is a coefficient of pile foundation base shape (s = 1.0 for circular piles); and qc;I;e is an average of values qc;I from depths below the pile tip limited by 0.7Deq to 4Deq: where Deq is an equivalent diameter of a pile at the tip; qc;II;e is an average of smallest values of qc;II above the depth going up from critical depth up to the pile tip; and qc;III;e is an average of values qc;III from interval of depths within the interval of 8Deq above the pile tip.
Maximal unit shaft friction fp is calculated as follows (Equation (10)):
p max ; shaft ; z = α s   ×   q c ; z ; a ,
where αs is a pile type coefficient (αs = 0.006 for sand and sandy gravels, αs = 0.02—0.03 for clays) and qc;z;a is the reduced value of qc at the depth z. If qc;z;a > 12 MPa continually with depth interval of 1 m or more, qc;z;a ≤ 15 MPa in this interval.

2.4. Statistical Analysis of Pile Bearing Capacity

Several authors carried out the statistical analysis for evaluation of applicability of various methods for estimation/prediction of pile bearing capacity [50,51,61,62]. Statistical analysis allows to classify given methods based on reliability of pile bearing capacity estimation and this approach should be one of the criteria for evaluation and comparison of methods. The ratio of predicted and measured pile bearing capacity Qp/Qm is important evaluation criterion. However, visual examination of Qp/Qm plot can be highly subjective. Therefore, additional tools are required for proper evaluation.
Overall, four evaluation criteria were adopted to classify selected methods for prediction of pile bearing capacity based on CPT data:
  • Best fit formula of predicted and measured bearing capacity function Qp/Qm and coefficient of determination R2;
  • Mean µ and sample standard deviation σ for Qp/Qm;
  • A value of 20% reliability level obtained from log-normal distribution of Qp/Qm;
  • A value of 50% and 90% cumulative probability P50 and P90.
Predicted bearing capacity based on CPT data Qp is compared with the interpreted bearing capacity obtained from the static load test of pile Qm. The Qp/Qm ratio is theoretically in interval from 0 to an unlimited upper value with the optimal value of 1.0. If the ratio Qp/Qm < 1.0, the method underestimates the bearing capacity and if the ratio Qp/Qm > 1.0, the method overestimates the bearing capacity.
Mean μ and sample standard deviation σ based on Qp/Qm ratio are important indicators of reliability and efficiency of method. The ideal accurate method has μ(Qp/Qm) = 1.0 and σ(Qp/Qm) = 0, which means that every predicted pile bearing capacity is equal to the measured one. In a real case, μ is close to 1.0 and σ is close to 0, respectively.
As mentioned above, the Qp/Qm ratio can be from 0 to an unlimited upper value which provides uneven weight to underestimated and overestimated predictions. If Qp ≤ 0, the pile has no bearing capacity in the physical point of view but such a conclusion is unrealistic. In a mathematical point of view, such a case is achieved when Qm is infinitely large and is also unrealistic. Therefore, Briaud and Tucker proposed the application of log-normal distribution of Qp/Qm for evaluation of efficiency of pile bearing capacity prediction method [51]. For log-normal distribution, mean µ and sample standard deviation σ are calculated for natural logarithm of Qp/Qm (Equations (11) and (12)):
μ l n ( Q p Q m ) = 1 n i = 1 n l n ( Q p Q m ) ,
σ l n ( Q p Q m ) = 1 n 1 .
The Qp/Qm ratio and natural logarithm ln(Qp/Qm) are determined for each pile. The mean µln, sample standard deviation σln and coefficient of variation COV for ln(Qp/Qm) are calculated for each method.
Log-normal distribution is defined as a distribution with density f(x) according to Equation (13) and distribution function F(x) according to Equation (14):
f ( x ) = 1 2 π σ l n exp [ 1 2 ( ln ( x )   μ l n σ l n ) 2 ] ,  
F ( x ) = 1 2 π σ ln 0 x 1 μ exp [ 1 2 ( ln ( μ )   μ l n σ ln ) 2 ] d μ .
Log-normal distribution was applied for evaluation of reliability and efficiency of UniCone, LCPC, and Eurocode 7—2 prediction methods. According to probability function of log-normal distribution, the probability of a bearing capacity prediction with 20% reliability level was calculated for each method. Probability corresponding to 20% reliability level means that the expected pile bearing capacity lies within an interval of 0.8QmQp ≤ 1.2Qm. The reliability is in agreement with other authors [24,63]. A similar reliability interval was observed by the authors of this paper in case of the determination of soil parameters from CPT outputs verified by laboratory testing.
The ratio of Qp/Qm and cumulative probability can be utilized as another evaluation criterion for prediction methods [51,62]. Values of Qp/Qm are ordered in ascending order (1, 2, 3, …, i, …, n) and the cumulative probability P is calculated as follows (Equation (15)):
P = i ( n + 1 ) ,
where i is the serial number for the given Qp/Qm ratio and n is the number of piles. For quantification of capability of prediction methods, 50% and 90% cumulative probability, P50 and P90, are determined. Value of P50 represents the median while P90 corresponds to the 90th percentile of values of Qp/Qm. The value of P50 is used as a measure of tendency to underestimate or overestimate measured pile bearing capacity. The closer the value of P50 for the ratio of Qp/Qm is to 1.0, with a smaller range of P90–P50 at the same time, the more suitable the method is.

3. Results

Data from pile load tests represent the reference for bearing capacity of individual pile or measured pile bearing capacity Qm. This value is obtained by the analysis of load/pile cap settlement plot. However, this value can be only obtained by an in situ pile load test. Within the design process, we must design the pile with predicted bearing capacity Qp. Estimation of this value based on CPTu outputs using above mentioned prediction methods are presented further.

3.1. Pile Load Test Output

For comparison, all loading curves from pile load tests without unloading part are plotted together with the same scale in Figure 6.
Measured pile bearing capacity Qm was estimated by Mazurkiewicz method mentioned above. The obtained values together with geometric characteristics of tested piles and representative CPTu probes are displayed in Table 2.
Of course, more evaluation methods can be adopted to analyze the pile load test output. Some approaches cannot be fully utilized because of the loading curve shape or the reached settlement (Figure 6). There are some characteristic points of the loading curve such as settlement related to 0.1 pile diameter or 25 mm and loading force related to intersection of tangents to the branches of the curve or significant change in curvature of the loading curve. However, when such points cannot be identified, evaluation of the load test can be difficult. The Mazurkiewicz method proved to be the most suitable for loading curves from the pile tests while processing the data regardless of the curve propagation [40].

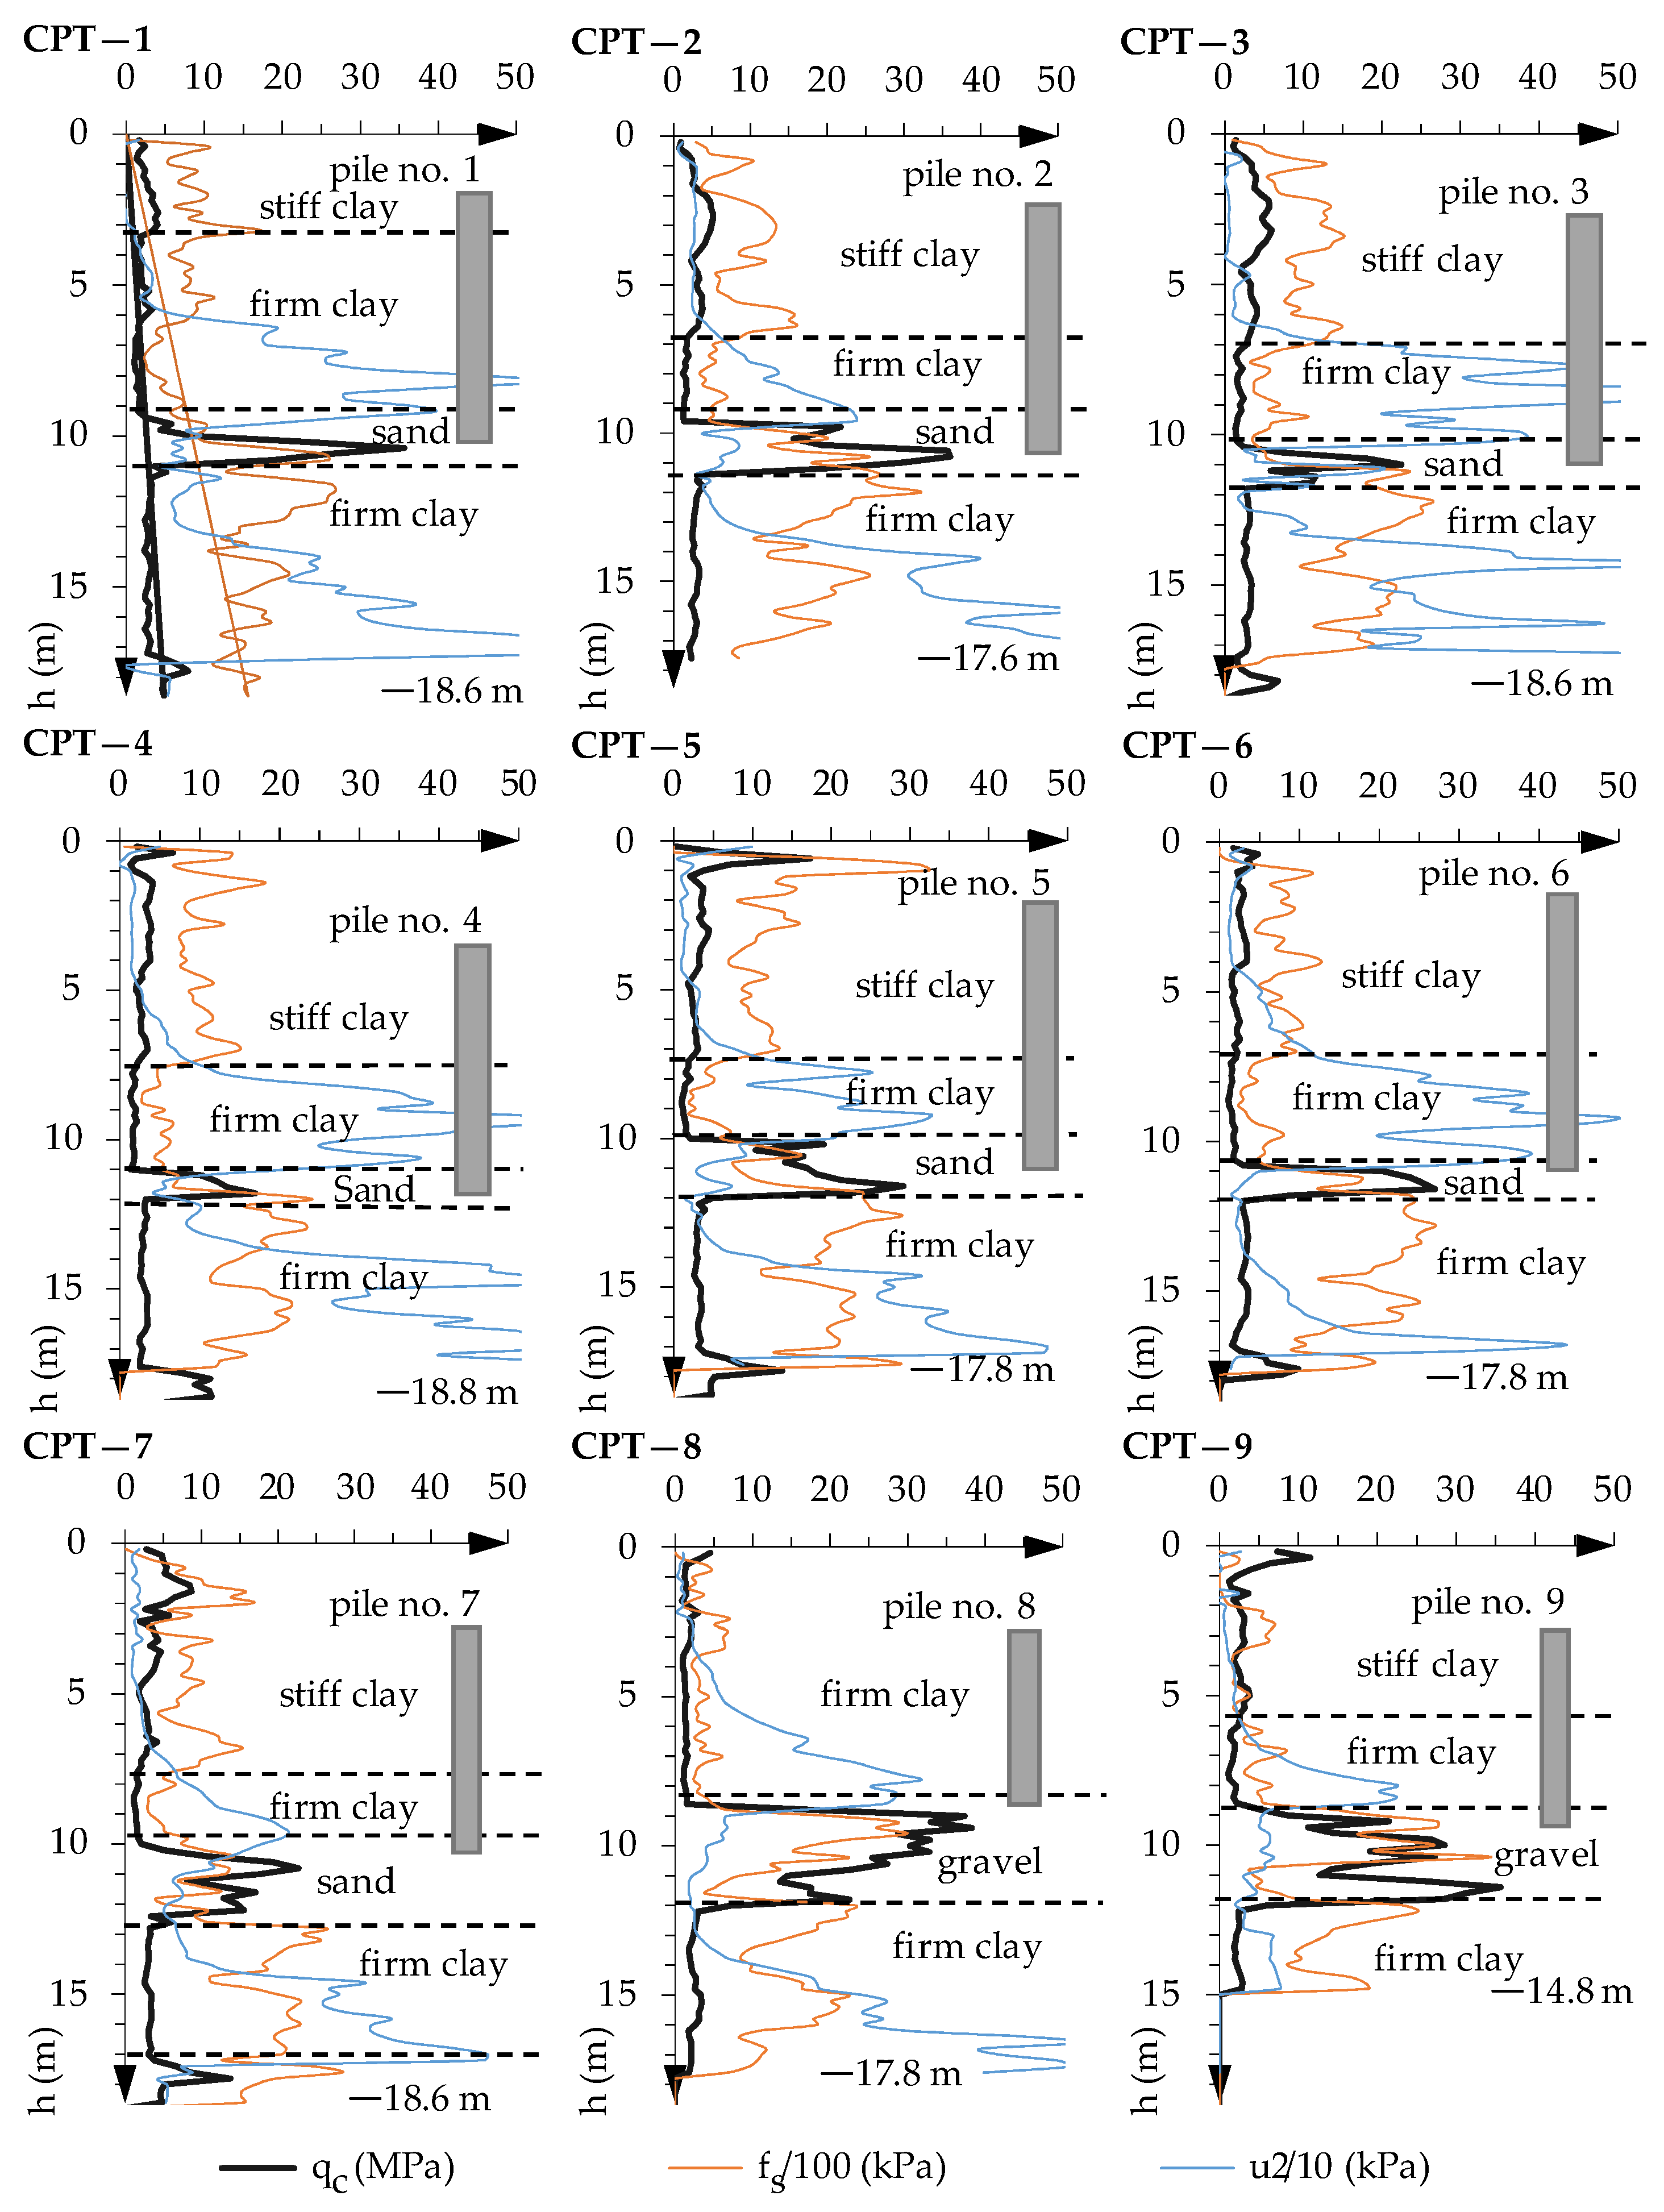
3.2. Penetration Test Results

At least two CPTu probes were realized at every tested pile, as close as possible to the pile foundation. After data analysis, a representative CPTu record was assigned to a particular pile. The record of cone penetration resistance qc, shaft friction fs, and pore pressure u2 is plotted in Figure 7. According to the evaluation of boreholes and pile manufacturing reports, a geological profile was added to the CPTu charts together with the actual vertical position of the corresponding pile.

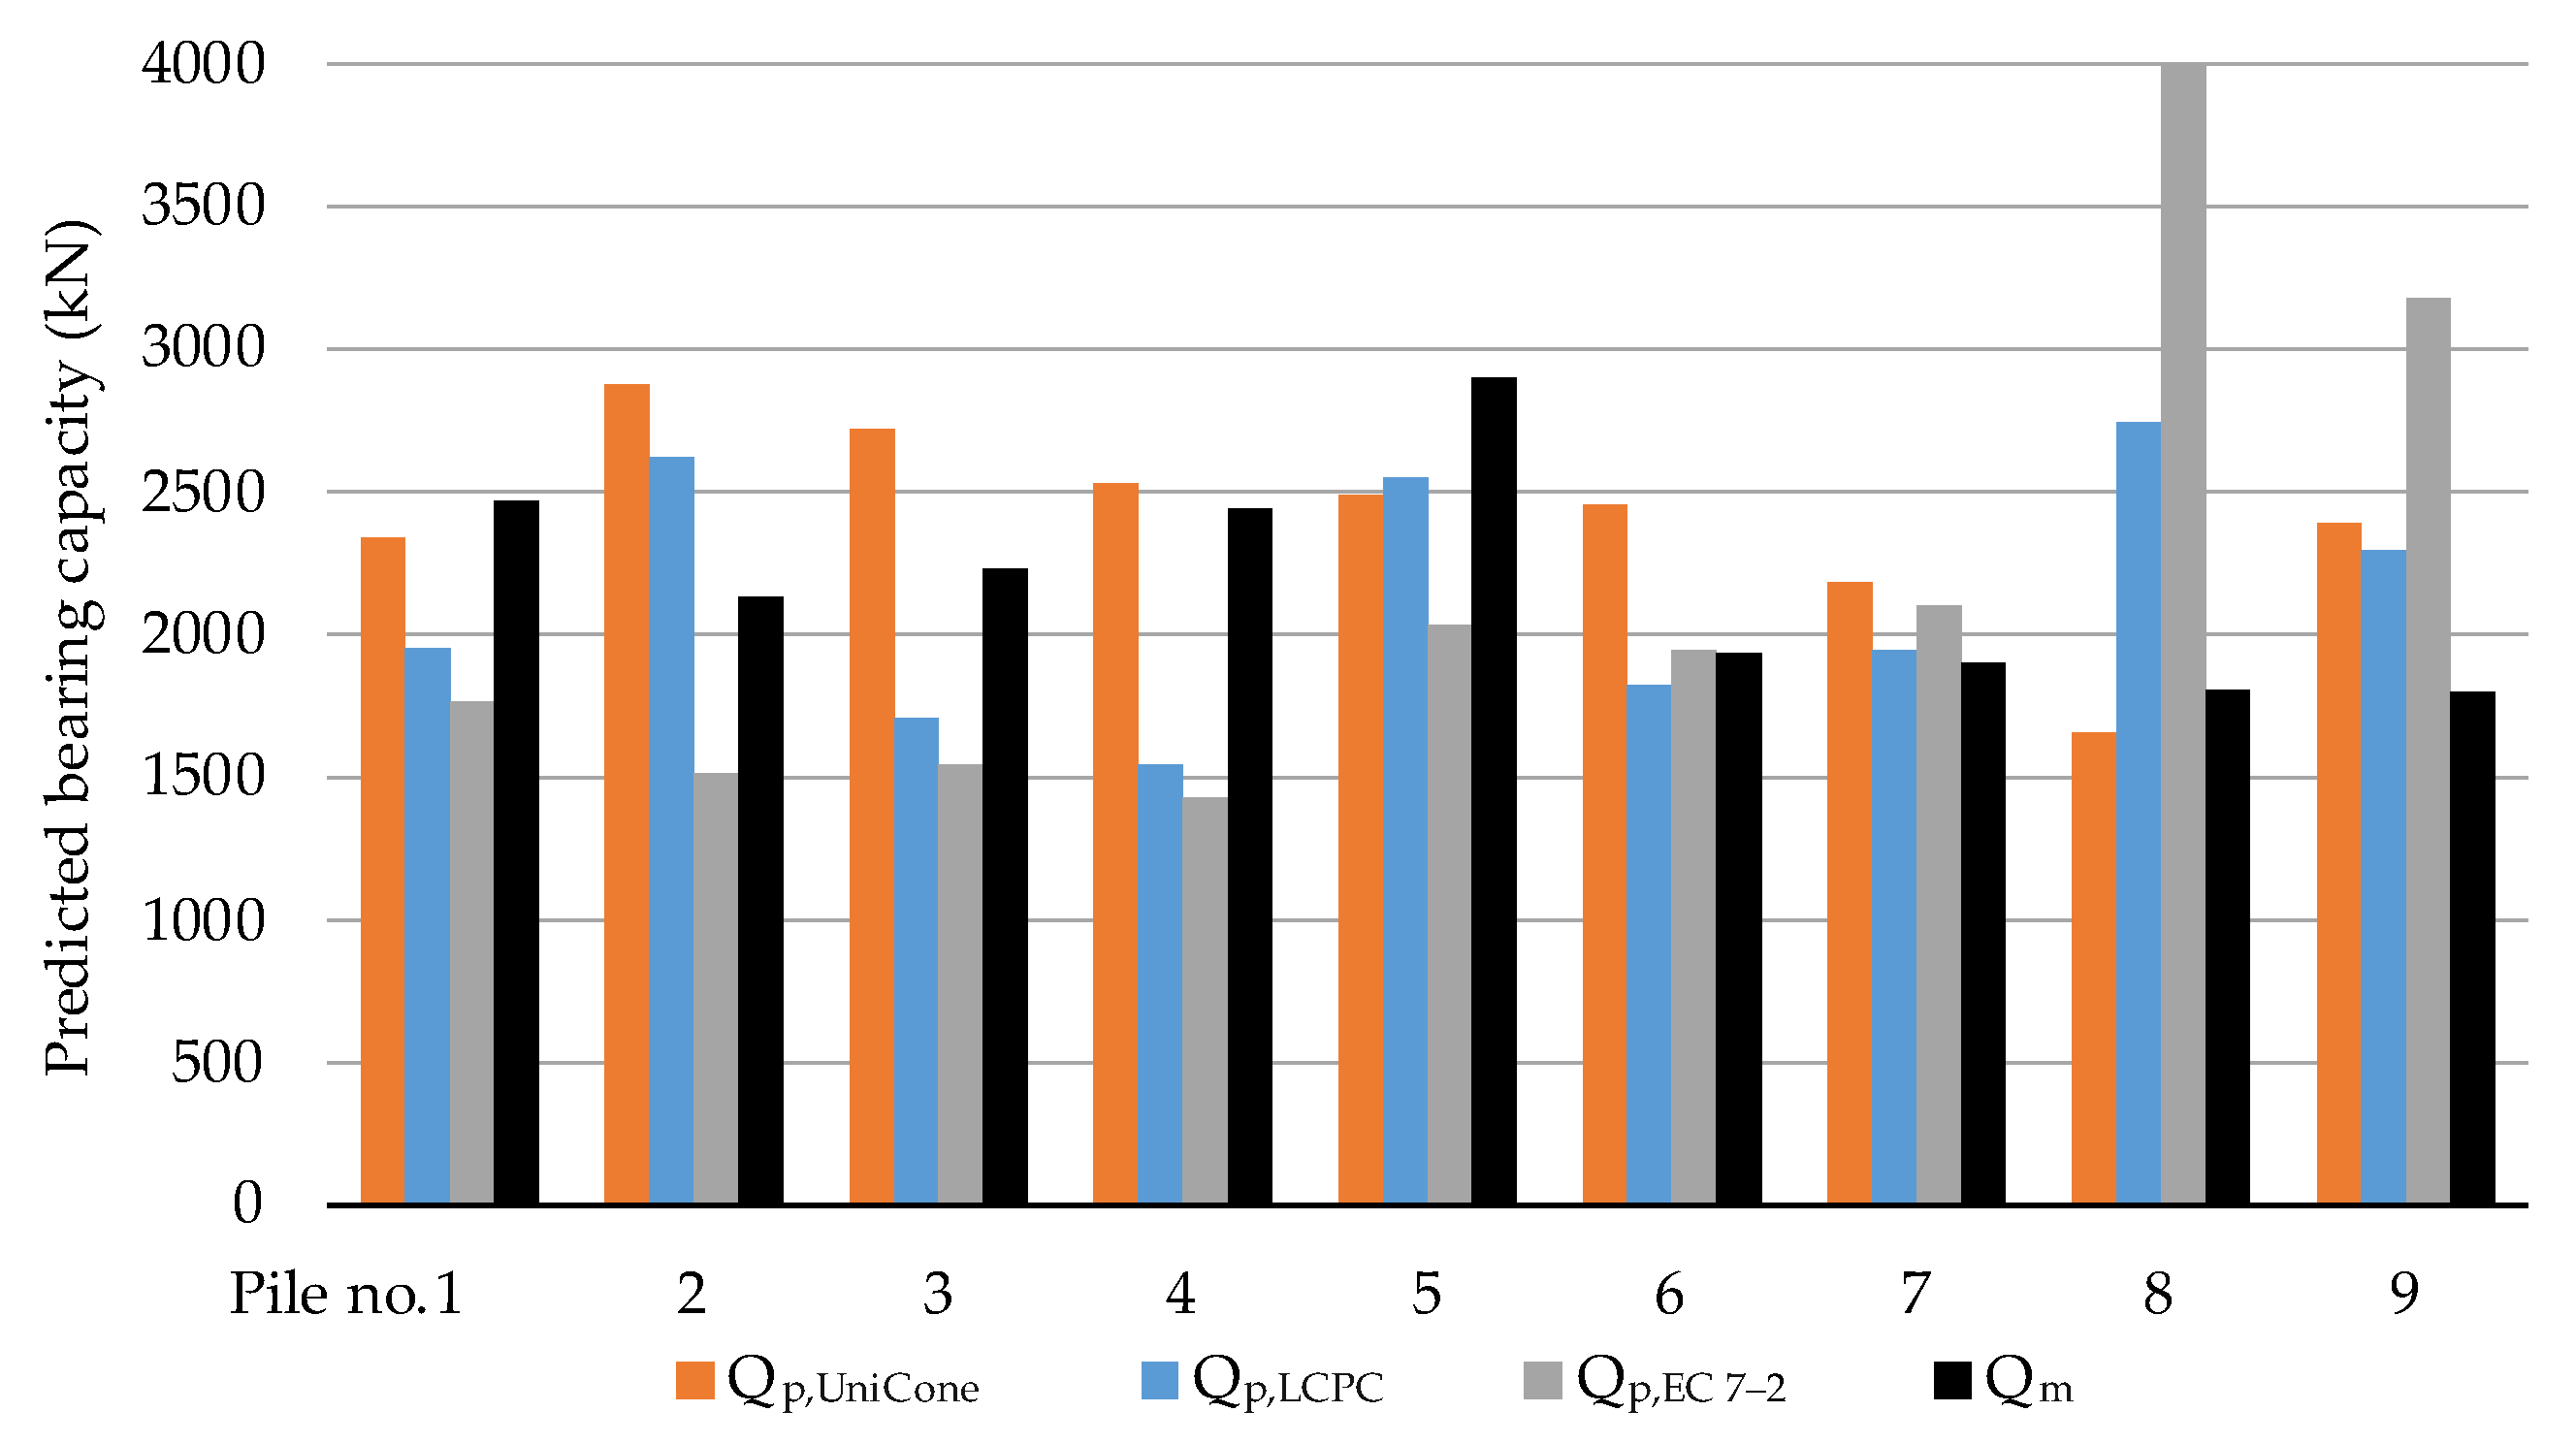
3.3. Prediction of Pile Bearing Capacity

The bearing capacity of tested piles based on CPTu output was calculated using prediction methods, the UniCone, LCPC, and EC 7—2 methods as described above. The bearing capacity for pile shaft Qs, pile tip Qb, and overall pile bearing capacity Qp are listed in Table 3.

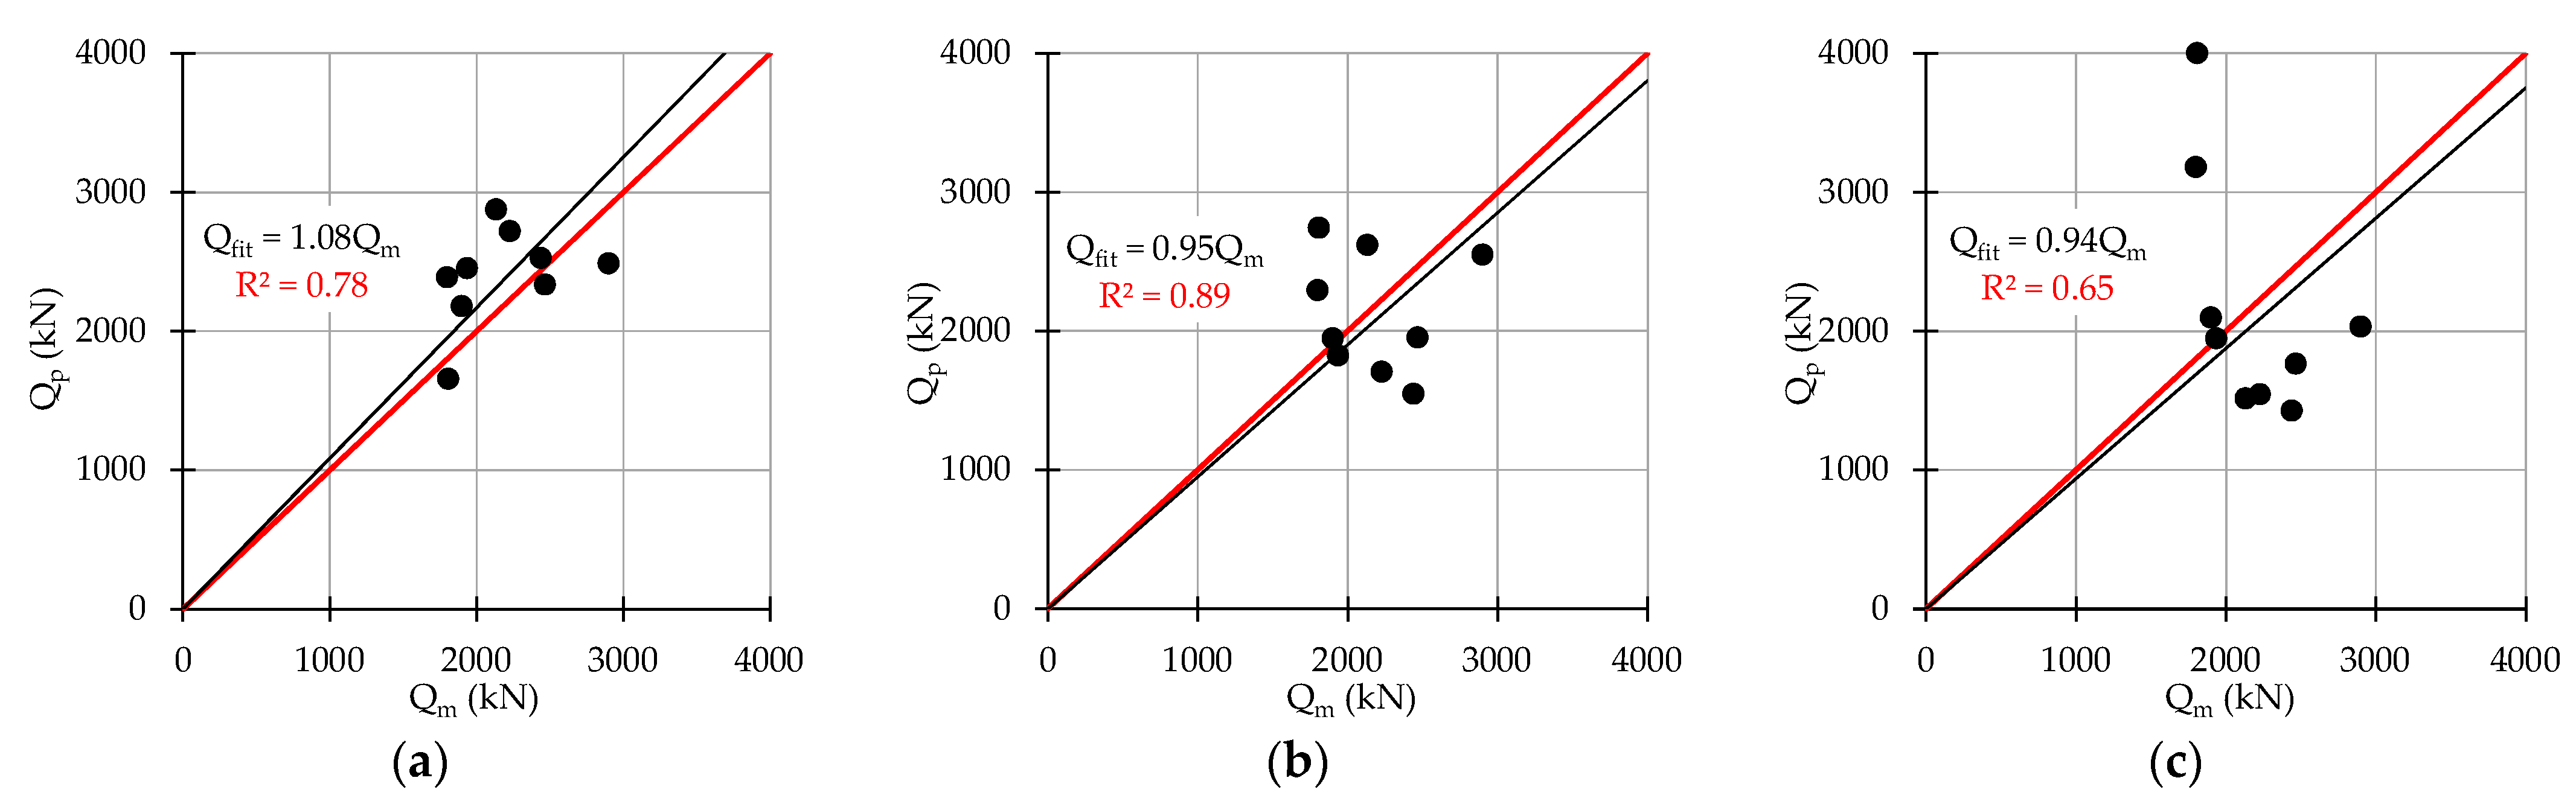
3.4. Analysis of Predicted Pile Bearing Capacity

CPTu probes proved variable thickness of fluvial deposit under bridges SO—201 and SO—202. The consequence of this fact is noticeable during the pile bearing capacity calculation, especially the LCPC method which influences where the zone of pile tip is located within the interval of 1.5 pile diameter above and below pile tip. The difference in the tip bearing capacity of pile No. 2 (fluvial deposit with thickness of 1.6 m) and pile No. 3 (fluvial deposit with thickness of 1.1 m), which end at same level, is 651 kN or 51%. The same phenomenon was observed at piles No. 5 and No. 6 where thickness of more bearable fluvial sediments was 1.8 m and 0.9 m, respectively. The difference in tip bearing capacity of pile No. 5 and pile No. 6 is 489 kN or 37.8%. Piles No. 2, 3, 5, and 6 were designed in accordance with the same survey borehole; therefore, the mentioned piles were manufactured with practically identical length and vertical position of the pile in soil stratum (Table 2).
Loose fluvial sediments were identified during CPTu sounding and their occurrence is also mentioned in documentation of geological survey [29]. Variability of thickness of fluvial deposit has no significant influence on pile tip bearing capacity according to UniCone and EC 7—2 methods. Piles under bridges SO—201 and SO—202 and pile No. 7 show lower bearing capacity according to LCPC method by 16 to 39% in comparison with the UniCone method. Only bearing capacity of pile No. 5 is higher by 2%. The same tendency was observed with the EC 7—2 method where bearing capacity is lower by 4 to 47% in comparison with the UniCone method.
Gravel fraction is more present in fluvial sediments under bridges SO—203 and SO—204 with thickness of 1.7 to 1.9 m. This was proved by higher values of cone penetration resistance qc in lower a part of the formation. Together with higher thickness of this deposit led to higher bearing capacity calculated by the LCPC and EC 7—2 methods in comparison with the UniCone results. On the other hand, UniCone output was not significantly affected by this phenomenon.
The significant difference in bearing capacity was observed between LCPC and EC 7—2 methods at pile No. 2 with 42% higher value with LCPC method. Another significant difference was identified at pile No. 8 where the LCPC method shows lower bearing capacity by 46% in comparison with the EC 7—2 method (Table 3). Comparing LCPC and EC 7—2 methods, the overall trend is similar but it should be mentioned that the EC 7—2 method puts more than 70% of overall bearing capacity to the pile tip at every calculated pile. Unfortunately, this issue cannot be confirmed by the pile load tests but several studies show lower influence of pile tip on the bearing capacity of bored piles (replacement piles) [41,64]. Comparison of the overall predicted pile bearing capacity based on prediction methods Qp and measured bearing capacity Qm is plotted in Figure 8.
Evaluation of ability to predict the pile bearing capacity based on CPT output was initially performed through Qm/Qp plot analysis. Ideally, Qm/Qp pair represented by the data point should create the best fit line, which intersects the beginning of the x- and y-axes, with the slope of 1 (or 45°) within the set of Qm/Qp couples. However, the slope of the line differs from the ideal slope for real data. Coefficient of determination R2 indicates the proportionate amount of variation in the response of variable Qp explained by the independent variable Qm in the linear regression model. The larger the R2 is, the more the variability is explained by the linear regression model. We can judge the ability of particular method to predict the pile bearing capacity using this coefficient. Because the best fit line should intersect the beginning of axes and should be in 45° slope, we cannot directly apply linear regression. Such a regression line may not be in 45° slope and calculated coefficient of determination is not reliable. The coefficient was calculated for a 45° line which intersects the beginning of the x- and y-axes (red line in Figure 9).
We can utilize the regression line formula Qfit to evaluate the over- or underestimation of pile bearing capacity. The least square method was applied to construct the regression line for the particular prediction method (black line in Figure 9). The UniCone method overestimates the pile bearing capacity by 8%, while the other two methods underestimate the bearing capacity by 5 or 4%, respectively (Table 4).
The probability density function and cumulative probability chart for ranking of prediction methods are plotted in Figure 10.
Overall efficiency of methods to predict the pile bearing capacity was evaluated by the rank index (RI) as a sum of ranks of method in particular criteria R1 to R4 (Table 4). Lower rank index (RI) means higher efficiency of method for bearing capacity prediction [24,50,63].
Coefficient of determination R2 was considered in R1 criterion. Higher value means stronger relation between measured and predicted bearing capacity and higher reliability in bearing capacity prediction.
Mean µ and sample standard deviation σ for Qp/Qm ratio were calculated for each method within R2 criterion. The more suitable method is characterized by the mean closer to 1.0 and the lower sample standard deviation representing the dispersion of data around mean value. Considering this criterion, all the methods overestimate the predicted bearing capacity.
The cumulative probability at 50% and 90% (P50 and P90) were calculated according to cumulative probability curves in criterion R3 (Figure 10b). The more suitable method has P50 value closer to 1.0 and with a smaller range of P90–P50 at the same time.
In criterion R4, ranking of methods was performed using 20% reliability level in log-normal distribution. Higher value signalizes higher efficiency of method.
The UniCone method was proved the most reliable from the investigated methods while LCPC and EC 7—2 methods were ranked as second and third, respectively, in terms of efficiency according to ranking index RI (Table 4).

4. Discussion

Before a conclusion can be drawn, some remarks must be mentioned. Pile load tests were performed on the piles manufactured by the same technology and were located in a homogenous geological environment. However, some variation in the fluvial deposit influenced the test output, but this variation was to some extent reflected by the prediction methods.
Generally, it can be stated that the investigated methods have certain limitations.
In case of the UniCone method, there is no consideration of pile manufacturing technology for pile tip coefficient, only pile diameter is taken into account.
The LCPC method shows higher values of predicted bearing capacity in comparison with the measured data. The influence zone around the pile tip is restricted to the interval 1.5 pile diameter above and below the pile tip. However, if a less bearable soil is located below this zone, it is not taken into account by this method. The method considers the statistical processing of the measured data from the CPT test using “curve smoothing”. The measured data, which were not subjected to curve smoothing to obtain a representative cone resistance value qc,eq for the pile tip, did not cause a significant difference in the results. The difference represented a maximum of ±2% of the bearing capacity of the pile tip.
Pardoski stated the difference between results of UniCone and LCPC methods as 19% [65]. Cruz and Howie designated the LCPC method as most conservative as removing the upper bearing capacity limits leads to the results closer to the measured ones [66]. Moshfegi and Eslami noted that more consistent results were achieved for soils with cone penetration resistance from 5 to 15 MPa. In the case of the UniCone method, utilization of the upper limits of pile resistance can be evaluated [2]. Generally, these results are in agreement with the outputs of this study depending on the evaluation criterion.
The EC 7—2 method based on the Dutch NEN standard shows the worst applicability at given boundary conditions. The approach to obtain the representative qc value is based on graphical evaluation using “the path of least resistance” which is not a convenient method when using computer calculation. The analysis shows inverted distribution of bearing capacity between pile tip and shaft in comparison with other methods. A significant part of the overall bearing capacity comes from the pile tip. Gavin and Cadogan or Huybrechts proved the opposite phenomenon when major parts of pile resistance is based on the shaft friction as was verified by other prediction methods [67,68].
Pile load tests proved the major contribution of shaft friction of CFA piles to overall bearing capacity. However, pile tip position affects the load/settlement response of the pile in a certain way because of the deformation resistance of soil within the influence zone of the pile tip and disturbance of the soil during drilling of the CFA pile.

5. Conclusions

An evaluation procedure was adopted to investigate the ability of the prediction methods to determine the bearing capacity of the pile in accordance with the results of the static load tests. CFA piles were situated in loess and the tip in fluvial sediments. Four different criteria were selected for the evaluation scheme. Each criterion was used to rank the methods based on their effectiveness or performance. The results of the study indicate that the UniCone method is most applicable for the investigated set of CFA piles and geological conditions. The method presented in the EC 7—2 standard showed the highest variability of results, and we do not recommend its application for similar geological conditions with the given pile manufacturing technology without a deeper analysis.
Despite an extensive database of piles and geological conditions at the formulation of prediction methods, direct application of any of the investigated methods in practice requires some modification or careful approximation. Two of the prediction methods proved that a major part of bearing capacity of CFA piles comes from shaft friction. Despite the occurrence of loess along the pile body and thin layer of fluvial sediments at the pile tips, piles showed restricted settlement during load tests which complicates the evaluation of loading curve and determination of appropriate pile resistance value representing the pile bearing capacity. This becomes more obvious when certain movement of the pile along the shaft is necessary to fully activate the friction part of the bearing capacity. The influence of the shaft friction increases with increasing pile length and diameter and can be more significant in comparison with the drilled piles according to other studies. However, the contribution of the CFA pile tip to the total pile bearing capacity was proved by the load tests.
The use of CPT probing in the design of piles requires appropriate interpretation of the test results. The application of any prediction method to specific conditions encountered in design practice requires due attention, especially the interpretation of survey data, the used initial database of experimental measurements, pile manufacturing technology, method limitations, etc. The practical applicability of any of the presented methods cannot be considered final or universal. A particular approach can provide outputs with variable reliability depending on the boundary conditions regardless of supporting database utilized for the development of the method.
For predictive analysis, it is advisable to use more modern and updated methods that make maximum use of the outputs from CPT sounding and which are developed from a larger database of pile tests. The development of these methods should continue by expanding the database of tested piles together with the application of more advanced rock environment testing procedures, e.g., using seismographs in CPT equipment, Marchetti flat dilatometer, etc. This allows a better understanding of the interaction between the pile foundation and the foundation soil and increase the reliability of the design methods.

Author Contributions

F.G. and J.M. performed the in situ tests; J.M. performed calculations; J.V. analyzed test and calculation outputs and wrote the original paper; M.D. revised the draft. All authors have read and agreed to the published version of the manuscript.

Funding

This research was funded by Operational Programme Integrated Infrastructure: Application of innovative technologies focused on the interaction of engineering constructions of transport infrastructure and the geological environment, ITMS2014+ code 313011BWS1. The project is co-funding by European Regional Development Fund.

Institutional Review Board Statement

Not applicable.

Informed Consent Statement

Not applicable.

Data Availability Statement

Due to the nature of this research, participants of this study did not agree for their data to be shared publicly and are only available upon reasonable request.

Conflicts of Interest

The authors declare no conflict of interest.

References

  1. Basu, P.; Prezzi, M.; Basu, D. Drilled displacement piles—Current practice and design. DFI J. J. Deep. Found. Inst. 2010, 4, 3–20. [Google Scholar] [CrossRef]
  2. Moshfeghi, S.; Eslami, A. Reliability-based assessment of drilled displacement piles bearing capacity using CPT records. Mar. Georesources Geotechnol. 2019, 37, 67–80. [Google Scholar] [CrossRef]
  3. Stacho, J. The design of drilled displacement system piles using the cavity expansion theory. Acta Geotech. Slov. 2018, 15, 81–89. [Google Scholar] [CrossRef]
  4. Kocherzhenko, V.; Suleymanova, L.; Kolesnikov, M. Innovative structural and technological developments of pile foundation engineering. IOP Conf. Ser. Mater. Sci. Eng. 2020, 945, 012035. [Google Scholar] [CrossRef]
  5. Jančula, M.; Jošt, J.; Gocál, J. Influence of aggressive environmental actions on bridge structures. Transp. Res. Procedia 2021, 55, 1229–1235. [Google Scholar] [CrossRef]
  6. Kraľovanec, J.; Prokop, J. Indirect methods for determining the state of prestressing. Transp. Res. Procedia 2021, 55, 1236–1243. [Google Scholar] [CrossRef]
  7. Adamczak, A.; Lipiec, S.; Vavruš, M.; Koteš, P. Non-destructive methods and numerical analysis used for monitoring and analysis of fibre concrete deformations. Materials 2022, 15, 7268. [Google Scholar] [CrossRef] [PubMed]
  8. Bujnakova, P.; Kralovanec, J.; Perkowski, Z.; Bouchair, A. Verification of precast concrete girder bridge under static load. Civ. Environ. Eng. 2022, 18, 760–767. [Google Scholar] [CrossRef]
  9. Sadeghi, H.; Singh, R.M. Driven precast concrete geothermal energy piles: Current state of knowledge. Build Environ. 2023, 228, 109790. [Google Scholar] [CrossRef]
  10. Niazi, F.S. Static Axial Pile Foundation Response Using Seismic Piezocone Data. Ph.D. Thesis, School of Civil and Environmental Engineering, Georgia Institute of Technology, Atlanta, GA, USA, 2014. [Google Scholar]
  11. Jamiolkowski, M.; Lo Presti, D.C.; Manaserrro, M. Evaluation of Relative Density and Shear Strength of Sands from CPT and DMT. In Proceedings of the Symposium on Soil Behavior and Soft Ground Construction Honoring Charles C. “Chuck” Ladd, Cambridge, MA, USA, 5–6 October 2001. [Google Scholar]
  12. Misra, A.; Roberts, L. Axial service limit state analysis of drilled shafts using probabilistic approach. Geotech. Geol. Eng. 2006, 24, 1561–1580. [Google Scholar] [CrossRef] [Green Version]
  13. Stacho, J.; Sulovska, M.; Slávik, I. Determining the shear strength properties of a soil-geogrid interface using a large-scale direct shear test apparatus. Period. Polytech. Civ. Eng. 2020, 64, 989–998. [Google Scholar] [CrossRef]
  14. Cherian, A. Static behavior of strain gauge instrumented continuous flight auger (CFA) piles. Jordan J. Civ. Eng. 2022, 16, 229–241. [Google Scholar]
  15. Stacho, J. Analysis of Static Load Tests of Bored Piles Using the Limit Load Curve Method. In Proceedings of the 16th International Multidisciplinary Scientific Geoconference (SGEM 2016), Albena, Bulgaria, 30 June–6 July 2016. [Google Scholar]
  16. Štefaňák, J.; Miča, L.; Chalmovský, J.; Leiter, A.; Tichý, P. Full-scale testing of ground anchors in Neogene clay. Procedia Eng. 2017, 172, 1129–1136. [Google Scholar] [CrossRef]
  17. NeSmith, W.M. Design and Installation of Pressure-Grouted, Drilled Displacement Piles. In Proceedings of the Ninth International Conference on Piling and Deep Foundation, Nice, France, 3–5 June 2002. [Google Scholar]
  18. Siegel, T.C.; Cargill, P.E.; NeSmith, W.M. CPT Measurements near Drilled Displacement Piles. In Proceedings of the 7th FMGM 2007, Boston, MA, USA, 21 September 2007. [Google Scholar]
  19. Zhang, Z.; Gong, W.; Dai, G.; Xu, J. Enhancement of load bearing of post-grouted drilled shafts based on in situ tests. Arab. J. Geosci. 2021, 14, 32. [Google Scholar] [CrossRef]
  20. Valletta, A.; Carri, A.; Segalini, A. Alert threshold assessment based on equivalent displacements for the identification of potentially critical landslide events. Nat. Hazards 2022, 115, 1549–1570. [Google Scholar] [CrossRef]
  21. Niazi, F.S.; Mayne, P.W. Cone penetration test based direct methods for evaluating static axial capacity of single piles. Geotech. Geol. Eng. 2013, 31, 979–1009. [Google Scholar] [CrossRef]
  22. Niazi, F.S.; Mayne, P.W. Enhanced UniCone Expressions for Axial Pile Capacity Evaluation from Piezocone Tests. In Proceedings of the IFCEE 2015, San Antonio, TX, USA, 17 March 2015. [Google Scholar]
  23. Robertson, P.K. Interpretation of cone penetration tests—A unified approach. Can. Geotech. J. 2009, 46, 1337–1355. [Google Scholar] [CrossRef] [Green Version]
  24. Titi, H.H.; Abu-Farsakh, M. Evaluation of Bearing Capacity of Driven Piles from CPT Data and Development of Design Software. In Proceedings of the Art of Foundation Engineering Practice, West Palm Beach, FL, USA, 18 February 2010. [Google Scholar]
  25. Alkroosh, I.; Nikraz, H. Predicting axial capacity of driven piles in cohesive soils using intelligent computing. Eng. Appl. Artif. Intell. 2012, 25, 618–627. [Google Scholar] [CrossRef]
  26. Kodsy, A.; Iskander, M. Insights into plugging of pipe piles based on pile dimensions. Appl. Sci. 2022, 12, 2711. [Google Scholar] [CrossRef]
  27. Xu, D.; Liu, Z.; Chen, B.; Xu, X. Bearing capacity analysis of offshore pipe piles with CPTs by considering uncertainly. Comput. Geotech. 2020, 126, 103731. [Google Scholar] [CrossRef]
  28. Moshfeghi, S.; Eslami, A. Study on pile ultimate capacity criteria and CPT-based direct methods. Int. J. Geotech. Eng. 2018, 12, 28–39. [Google Scholar] [CrossRef]
  29. Obert, L. Trnava—Road I/51—North Bypass, 3rd Phase, Additional Geological Survey; Ageo: Bratislava, Slovakia, 2006. (In Slovak) [Google Scholar]
  30. Vaníček, I. Geotechnical Problems with Man-Made and Man Influenced Grounds. In Proceedings of the 13th European Conference on Soil Mechanics and Geotechnical Engineering, Prague, Czech Republic, 25–28 August 2003. [Google Scholar]
  31. Dobeš, P. Calibration of TDR test probe for measuring moisture in the body of the railway substructure and its subgrade. Civ. Environ. Eng. 2015, 11, 84–94. [Google Scholar] [CrossRef] [Green Version]
  32. Bulko, R.; Masarovičová, S. Effect of lime filling on the compactibility of clay soils. Civ. Environ. Eng. 2022, 18, 501–506. [Google Scholar] [CrossRef]
  33. Cviklovič, V.; Mojžiš, M.; Majdan, R.; Kollarová, K.; Tkáč, Z.; Abrahám, R.; Masarovičová, S. Data acquisition system for on-the–go soil resistance force sensor using soil cutting blades. Sensors 2022, 22, 5301. [Google Scholar] [CrossRef] [PubMed]
  34. Brna, M.; Cingel, M. Comparison of pavement surface roughness characteristics of different wearing courses evaluated using 3D scanning and pendulum. MATEC Web Conf. 2020, 313, 00013. [Google Scholar] [CrossRef]
  35. Seo, H. Monitoring of CFA pile test using three dimensional laser scanning and distributed fiber optic sensors. Opt. Lasers Eng. 2020, 130, 106089. [Google Scholar] [CrossRef]
  36. Chromčák, J.; Bačová, D.; Pecho, P.; Seidlová, A. The possibilities of orthophotos application for calculation of ecological stability coefficient purposes. Sustainability 2021, 13, 3017. [Google Scholar] [CrossRef]
  37. Chromčák, J.; Bačová, D.; Seidlová, A.; Danišovič, P.; Zuziaková, I. Terrestrial Laser Scanning Application for General Plane Position Estimation. In Proceedings of the XXX Russian-Polish-Slovak Seminar Theoretical Foundation of Civil Engineering (RSP 2021), Moscow, Russia, 13–18 September 2021. [Google Scholar] [CrossRef]
  38. Continuous Flight Auger (CFA). Available online: https://www.keller.com.kz/brochure/K_Brochure_Technique_CFA.pdf (accessed on 16 December 2022).
  39. Drusa, M.; Korenko, M. Project Documentation for Pile Load Test and Pile Load Test Evaluation for Piles SO 201—SO 204; University of Žilina: Žilina, Slovakia, 2010–2011. (In Slovak) [Google Scholar]
  40. Mazurkiewicz, B.K. Test Loading of Piles According to Polish Regulations, Royal Swedish Academy of Engineering Sciences Report No. 35; Commission on Pile Research: Stockholm, Sweden, 1972; pp. 1–20. [Google Scholar]
  41. Abdelrahman, G. Interpretation of Axial Pile Load Test Results for Continuous Flight Auger Piles. In Proceedings of the 9th Arab Structural Engineering Conference, Abu Dhabi, United Arab Emirates, 29 November–1 December 2003. [Google Scholar]
  42. Mulyono, T. Lesson Learn for Comparison of Single Pile Axial Capacity Based on Soil Parameter and Static Loading Test Result. In Proceedings of the UNJ ICTVET 2015, Jakarta, Indonesia, 27 October 2015. [Google Scholar]
  43. Olgun, M.; Yenginar, Y.; Hanati, A. Interpreting Load-Settlement Curves of Pile Foundations by Graphical Methods. Eurasian J. Civ. Eng. Archit. 2017, 1, 1–10. [Google Scholar]
  44. Olgun, M.; Hanati; Yenginar, Y. Prediction of Pile Capacity from Field Loading Test Results by Using Different Methods. In Proceedings of the Third International Soil-Structure Interaction Symposium, Izmir, Turkey, 18–19 October 2017. [Google Scholar]
  45. Nguyen, H.M.; Fellenius, B.H.; Puppala, A.J.; Nguyen, O.C.; Bheemasetti, T.V. Results of static loading tests on single piles and on pile-supported LPG tanks. Geotech. Geol. Eng. 2018, 36, 3811–3822. [Google Scholar] [CrossRef]
  46. Al-Soudani, W.; Albusoda, B. Evaluating End-Bearing and Skin-Friction Resistance of Test Pipe Pile in Sand Soil. In Proceedings of the Modern Applications of Geotechnical Engineering and Construction, Bagdad, Iraq, 19–20 February 2020. [Google Scholar]
  47. Rusland, R.O. An analysis of static load test on single square pile of 50 × 50 cm2 using finite element method in multi–storey building project, Pluit, North Jakarta. Simetrikal J. Eng. Technol. 2020, 2, 49–62. [Google Scholar] [CrossRef]
  48. Wei, Y.; Wang, D.; Li, J.; Jie, Y.; Ke, Z.; Li, J.; Wong, T. Evaluation of ultimate bearing capacity of pre-stressed high-strength concrete pipe pile embedded in saturated sandy soil based on in-situ test. Appl. Sci. 2020, 10, 6269. [Google Scholar] [CrossRef]
  49. Mihálik, J. The Use of Methods of Geotechnical Survey for Evaluation of Pile Foundations. Ph.D. Thesis, University of Žilina, Žilina, Slovakia, 2022. (In Slovak). [Google Scholar]
  50. Cai, G.; Liu, S.; Tong, L.; Du, G. Assessment of direct CPT and CPTu methods for predicting the ultimate bearing capacity of single piles. Eng. Geol. 2009, 104, 211–222. [Google Scholar] [CrossRef]
  51. Alsamman, O.M. The Use of CPT for Calculating Axial Capacity of Drilled Shafts. Ph.D. Thesis, University of Illinois at Urbana-Champaign, Champaign, IL, USA, 1995. [Google Scholar]
  52. Hu, Z.; McVay, M.; Bloomquist, D.; Horhota, D.; Lai, P. New ultimate pile capacity prediction method based on cone penetration test (CPT). Can. Geotech. J. 2012, 49, 961–967. [Google Scholar] [CrossRef]
  53. Mayne, P.; Saftner, D.; Dagger, R.; Dasenbrock, D. Cone Penetration Testing Manual for Highway Geotechnical Engineers; Georgia Institute of Technology: Atlanta, GA, USA, 2018. [Google Scholar]
  54. Ardalan, H.; Eslami, A.; Nariman-Zadeh, N. Piles shaft capacity from CPT and CPTu data by polynomial neural networks and genetic algorithms. Comput. Geotech. 2009, 36, 616–625. [Google Scholar] [CrossRef]
  55. Zwara, Ł.; Bałachowski, L. Prediction of pile shaft capacity in tension based on some direct CPT methods—Vistula marshland test site. Materials 2022, 15, 2426. [Google Scholar] [CrossRef]
  56. EN 1997–2: 2007; Eurocode 7—Geotechnical Design—Part 2: Ground Investigation and Testing. European Committee for Standardization (CEN): Brussels, Belgium, 2007.
  57. NEN 6743-1: 2006; Geotechniek—Berekeningsmethode voor Funderingen op Palen—Drukpalen. Nederlands Normalisatie Instituut (NEN): Delft, The Netherlands, 2006.
  58. Eslami, A.; Fellenius, B.H. Pile capacity by direct CPT and CPTu methods applied to 102 case histories. Can. Geotech. J. 1997, 34, 886–904. [Google Scholar] [CrossRef]
  59. Bustamante, M.; Gianeselli, L. Pile Bearing Capacity Predictions by Means of Static Penetrometer CPT. In Proceedings of the Second European Symposium on Penetration Testing, ESOPT-II, Amsterdam, The Netherlands, 24–27 May 1982. [Google Scholar]
  60. Bustamante, M.; Frank, R. Design of axially loaded pile–French practice. In Design of Axially Loaded Piles–European Practice, 1st ed.; De Cock, F., Legrand, C., Eds.; A.A. Balkema: Rotterdam, The Netherlands, 1997; pp. 161–176. [Google Scholar]
  61. Briaud, J.; Tucker, L.M. Measured and predicted axial response of 98 piles. J. Geotech. Eng. 1988, 114, 984–1001. [Google Scholar] [CrossRef]
  62. Long, J.H.; Wysockey, M.H. Accuracy of Methods for Predicting Axial Capacity of Deep Foundations. In Proceedings of the OTRC’99 Conference, Analysis, Design, Construction, and Testing of Deep Foundations, Austin, TX, USA, 29–30 April 1999. [Google Scholar]
  63. Amirmojahedi, M.; Abu-Farsakh, M. Evaluation of 18 direct CPT methods for estimating the ultimate pile capacity of driven piles. Transp. Res. Rec. 2019, 2673, 127–141. [Google Scholar] [CrossRef]
  64. Gavin, K.G.; Cadogan, D.; Casey, P. Shaft capacity of continuous flight auger piles in sand. J. Geotech. Geoenvironmental Eng. 2009, 135, 790–798. [Google Scholar] [CrossRef]
  65. Pardoski, K.V. Derivation of CFA Pile Capacity in A Silty Clay Soil Using CPTu. Available online: https://www.geoengineer.org/storage/publication/18438/publication_file/2677/3-39pardapc.pdf (accessed on 16 February 2023).
  66. Cruz, I.R.; Howie, J.A. An Evaluation of Pile Load Capacity Estimates Using CPTu and DMT Methods in Silty Clay in High Prairie, Alberta. In Proceedings of the 61st Canadian Geotechnical Conference and the 9th Joint CGS/IAH-CNC Groundwater Conference, Edmonton, AB, Canada, 21–24 September 2008. [Google Scholar]
  67. Gavin, K.; Kovacevic, M.S.; Igoe, D. A review of CPT based axial pile design in the Netherlands. Undergr. Space 2021, 6, 85–99. [Google Scholar] [CrossRef]
  68. Huybrechts, N.; Maertens, J. Some New Insights with Regard to Load Distribution in Piles, based on a Detailed Interpretation of a Large Number of Instrumented Pile Load Tests. In Proceedings of the Fifth International Symposium on Deep Foundations on Bored and Auger Piles, BAP V, Ghent, Belgium, 8–10 September 2008. [Google Scholar]
Figure 1. Situation of tested piles and CPTu probes.
Applsci 13 02931 g001
Figure 2. Pile load test. (a) Loading and observation equipment during the pile test; (b) scheme of the loading equipment [39].
Applsci 13 02931 g002
Figure 3. Example of evaluation of loading curve for pile No. 5 [40].
Applsci 13 02931 g003
Figure 4. Piezoelectric penetration cone: (a) The cone; (b) scheme of pore pressure measurement: u2: pore pressure; Aa, Ab, Ac, As: cross-section area [50].
Applsci 13 02931 g004
Figure 5. Classification chart for UniCone method. Numbers and letters are noted in Table 1 [22].
Applsci 13 02931 g005
Figure 6. Loading curves for tested piles.
Applsci 13 02931 g006
Figure 7. CPTu record with geological profile and position of tested pile (gray rectangle). h is depth in meters; —18.6 m is overall depth of the CPTu probe.
Applsci 13 02931 g007
Figure 8. Pile bearing capacity based on prediction methods and measurements.
Applsci 13 02931 g008
Figure 9. Regression and 45° lines and coefficients of determination R2 for measured and predicted pile bearing capacity data pairs. (a) UniCone method; (b) LCPC method; (c) EC 7—2 method.
Applsci 13 02931 g009
Figure 10. Statistical analysis of prediction methods: (a) Probability density function for particular prediction method; (b) cumulative probability chart for particular prediction method.
Applsci 13 02931 g010
Table 1. Correlation coefficient Cse according to the zone in classification chart [22].
No. of ZoneSoil TypeAverage Cse (%)
1avery soft sensitive clay8.32
1bsoft clay and silt6.57
2asilty marine and varved clays4.69
2bstiff weathered clay, clay till3.63
3afirm to medium soft silty clay3.10
3bclayey silt, mudstone2.47
4asandy silt, medium dense silt1.58
4bsilty sand, very dense silt1.09
5auniform loose sand0.82
5bmedium dense sand0.61
5cdense sand, gravel–sand mix0.34
Table 2. Geometric characteristics of tested piles and measured piles bearing capacity Qm.
No. of PileBridge
Designation
CPTu ProbePile Diameter
(m)
Pile Length (m)Bearing Capacity Qm
(kN)
1SO—201CPT—11.08.62467
2SO—201CPT—21.08.62132
3SO—201CPT—31.08.62228
4SO—201CPT—41.08.62439
5SO—202CPT—51.08.82900
6SO—202CPT—61.08.81935
7SO—203CPT—71.06.21900
8SO—203CPT—81.05.41807
9SO—204CPT—91.06.21800
Table 3. Bearing capacity components and overall pile bearing capacity.
MethodQp,UniConeQp,LCPCQp,EC7—2
Pile No.Qs
(kN)
Qb
(kN)
Qp
(kN)
Qs
(kN)
Qb
(kN)
Qp
(kN)
Qs
(kN)
Qb
(kN)
Qp
(kN)
1166567123361059894195311616501766
22016859287513461274262133911771516
3196775327211084623170716913751545
4185667125271031516154712912971426
5167181724881256129225482617201746
6178367124531021803182412518211946
7133084921796531294194726218362098
87608971657573217027432839824000
9133810522390767152822954831313180
Notes: Qs: pile shaft bearing capacity; Qb: pile tip bearing capacity; Qp: overall pile bearing capacity.
Table 4. Evaluation of efficiency of prediction methods.
Best Fit Calculation and RegressionStatistic Characteristics of Qp/Qm RatioCumulative
Probability
Log-Normal
Distribution
Overall Rank
Method Qfit/QmR2R1µσR2P50P90R3RL (%)R4RIR
UniCone1.080.7821.070.2011.091.34166.65151
LCPC0.950.8911.080.3021.051.60253.20272
EC 7—20.940.6531.090.5330.902.08333.703123
Notes: R2: coefficient of determination; µ: mean value; σ: sample standard deviation; P50: cumulative probability at 50%; P90: cumulative probability at 90%; RL: 20% reliability level for log-normal distribution; RI: sum of ranks in criteria R1 to R4 (rank index); R: overall rank based on method efficiency.
Disclaimer/Publisher’s Note: The statements, opinions and data contained in all publications are solely those of the individual author(s) and contributor(s) and not of MDPI and/or the editor(s). MDPI and/or the editor(s) disclaim responsibility for any injury to people or property resulting from any ideas, methods, instructions or products referred to in the content.

