
Model Updating for a Continuous Concrete Girder Bridge Using Data from Construction Monitoring

School of Civil Engineering, Southeast University, Nanjing 211189, China
Appl. Sci. 2023, 13(6), 3422; https://doi.org/10.3390/app13063422
Submission received: 31 January 2023
/
Revised: 2 March 2023
/
Accepted: 3 March 2023
/
Published: 8 March 2023
(This article belongs to the Section Civil Engineering)
Abstract
:Finite element (FE) model updating can guarantee the accuracy of the numerical analyses for civil structures. However, two deficiencies currently exist with the traditional FE model updating technique based on the measurements of modal parameters and/or the static structural responses of the built structure with respect to its reference information insufficiency and its non-unique solution generally obtained, hampering its extensive use. It becomes the goal of the whole engineering community to introduce new effective methods for the civil structural FE model update. To this end, an innovative FE model updating method using data from construction monitoring is proposed in this article. With regard to its theoretical novelty, the new method transforms the complicated multi-variable optimization mathematical problem with the traditional FE model updating technique into many simple single-variable parameter identification problems. Under the engineering background of Huangsha Harbor Bridge, a three-span concrete continuous box girder bridge constructed utilizing the symmetric cantilever casting method, the effectiveness and the efficiency of the new model updating practice were validated. It is demonstrated using quantitative data that the abundant data measured on Huangsha Harbor Bridge in construction stages can enhance the reference information for the more accurate FE model updating of the structure, and the uncertain parameters with the initial FE model of Huangsha Harbor Bridge can be progressively and easily identified for the proposed model updating method using many single-variable linear regression models, instead of one complicated multi-variable mathematical or numerical model employed by the traditional model updating approaches, which generally leads to non-unique solutions rendered by normal optimization algorithms.
1. Introduction
Finite element (FE) models are widely used in structural health monitoring, structural safety assessments, structural behavior predictions under in-service conditions and in extreme events, etc. [1]. As a technique to guarantee the fidelity of an FE model before use, FE model updating has been embraced by numerous numerical simulation processes [2]. In nature, the traditional FE model updating is a multi-variable optimization process to simultaneously identify many uncertain parameters with the initial FE model and to achieve the accurate reproduction of the measured modal parameters [3,4,5,6,7] or the measured static structural responses [6,8,9,10] of the built structure at the same time. Although the traditional FE model updating technique is proven to be effective for use [3,4,5,6,8,9], two deficiencies can still be recognized with it, which hamper its usability: (1) Normally, for an effective optimization to take place, the data volume of the referenced structural properties and/or structural responses should be greater than the number of parameters to identify. In this regard, the reference information obtained on the physical truth (i.e., the measured modal parameters or the measured static structural responses of the built structure) is usually insufficient for conducting traditional model updating with a large number of uncertain variables to simultaneously identify. (2) It is found that results of optimization with a large number of variables are generally not unique for the traditional FE model updating practice utilizing one complicated multi-variable mathematical or numerical model, possibly indicating their inveracities (the identified results might be local optimum values).
To date, the construction processes of many large civil structures have been monitored for effective safety assessments and structural control [11,12,13,14,15]. For example, the stress development of the 610 m-high Guangzhou New Television Tower during construction was monitored by Xia et al. [11]; temperature and displacement of the steel roof of Shenzhen Bay Stadium under construction was monitored by Teng et al. [12]; the health conditions of some mass-timber buildings under construction were monitored according to a methodological approach by Baas et al. [13]; an integrative structural health monitoring system was established by Park et al. for the local/global responses of a large-scale irregular building under construction [14]; monitoring of some bridges under construction was reported by Wenner et al. [15]. Therefore, the data with these structures in construction stages are abundant, which can be employed to enhance the reference information for the subsequent FE model updating of these structures. In addition, at each step in the structural construction process, only one or two uncertain parameters should be identified for model updating, which avoids the common unfavorable multi-variable optimization with the non-unique solutions. The long-span continuous girder bridge constructed using the cantilever casting method can be an example to validate the aforementioned scientific notion. For long-span continuous girder bridges constructed using the cantilever casting method, the development of the internal forces at the cantilever segments of the structure is frequently monitored throughout the construction process. This provides the opportunity that one uncertain structural parameter (generally the applied pre-stressed force in each stage) can be identified using construction monitoring data collected in each step for more effective parameter identifications.
Under the engineering background of Huangsha Harbor Bridge, the notion of civil structural model updating using data collected from the construction monitoring is validated in this paper. After the FE model of Huangsha Harbor Bridge is updated through such a practice, the static structural responses obtained from the updated model are compared with the full-scale measurement results and those obtained from a baseline model updated using the traditional model updating method to directly show the effectiveness and the superiority of the proposed model updating practice. To the writers’ knowledge, these works have rarely been conducted and reported by the engineering community before; however, they are of significant practical importance on the structural modeling and analyses of large civil structures.
2. Engineering Background: Huangsha Harbor Bridge
Located in Jiangsu Province, China, Huangsha Harbor Bridge has a total length of 1431 m and a width of 24.5 m. Designed to cross the Huangsha Harbor River, the main bridge is a twin-deck three-span (42 m + 60 m + 42 m) concrete continuous box girder structure with pre-stressing forces applied longitudinally (see Figure 1). The box girder of each deck has a varying single-cell straight cross-section with a width of 12 m (see Figure 2).
From January 2008 to February 2009, the whole super-structure of Huangsha Harbor Bridge was constructed utilizing the symmetric cantilever casting method, except the decks near the side supports. As shown in Figure 1, eight segments are cast on baskets progressively on each side of the two piers (piers #6 and #7). The same construction process is maintained for each side of the main piers, so the temporary T-shaped structures are balanced. To ensure the security and the serviceability of Huangsha Harbor Bridge, construction monitoring and control are undertaken by Southeast University (Nanjing, China) based on stress measurements at fixed ends of cantilevers (A-A, B-B, C-C, and D-D cross-sections in Figure 1).
3. Stress Measurements and Data Updating Based on Grey Theory
3.1. On-Site Stress Measurements for Huangsha Harbor Bridge under Construction
Before the concrete pouring of the 0-blocks above the piers, the vibrating wire stress transducers are attached to longitudinal reinforcing bars arranged on the top and the bottom of the cross-section of fixed ends of cantilevers for stress measurements (see Figure 3). As shown in Figure 2, four transducers are arranged on the corners of one cross-section. Shortly after important construction steps, such as the formwork erection, the concrete pouring, and the pre-stress tension for each block, the stresses are measured where transducers are arranged.
As concrete is a heterogeneous compound material [16], its stress measurement using the vibrating wire stress transducers is a difficult measuring practice, and the measured data usually deviate from the true values due to many adverse effects. To minimize the different adverse effects, the construction monitoring personnel of Huangsha Harbor Bridge employ transducers for long-term stability and easy installation; request cooperation from the construction workers to protect the transducers and the signal wires; test the performance of the transducers regularly for their effectiveness; choose the right time for the first reading to minimize the stress effects due to initial setting of the concrete; reduce the duration from the time of the concrete pouring to the time of the measurement beginning to reduce the effects of the concrete shrinkage and creep. Although the above-mentioned countermeasures are undertaken, it should be admitted that the measured results might still be inaccurate. An adverse influence for the accuracy of the measured data is the temperature effects, which are difficult to eliminate. More precisely, when the temperature of the whole girder is not uniform, the measured stresses inevitably contain the temperature gradient-induced stresses. In the following subsection, a new practice adopted by the authors on the location to compensate for deviation in the measured stress caused by the temperature gradient is introduced.
3.2. Compensation for the Deviation in the Measured Stress Due to the Uneven Temperature
To compensate for the deviation in the measured stress due to the uneven temperature, two temperature sensors were, respectively, arranged on the top and the bottom of each measurement cross-section of the fixed ends of cantilevers to measure the temperature discrepancy between the top and the bottom of the cross-section in each construction stage in real time.
Then, a mathematical formulation to calculate the stress deviation due to the uneven temperature from the measured temperature discrepancy was established based on the FE analyses and the response surface (RS) method. More precisely, a 0-block of Huangsha Harbor Bridge is simulated numerically using 282,811 tetrahedral solid elements with 423,401 nodes on a commercial FE platform first (see Figure 4). The length of the selected 0-block is 10 m; its width is 12 m; its height is 3.5 m. Its detailed geometry is shown in Figure 1 and Figure 2. The material is C50 pure concrete, whose mass density, thermal conductivity, elastic modulus, minor Poisson’s ratio and secant coefficients of thermal expansion are 2500 kg/m3, 1.28 W/(m.K), 3.45 × 10¹⁰ Pa, 0.2 and 1 × 10⁻⁵/K, respectively. In calculating the temperature field, no boundary condition is applied; when calculating the thermal stress field, the bottom of the 0-block is fixed in all directions. Secondly, thermal stress field analysis is performed assuming the temperature changes vertically from 0 °C at the bottom of the box girder to −12.5 °C at the top of the box girder according to Ref. [17]. The calculated temperature field and the calculated longitudinal thermal stress field on the 0-block are shown in Figure 5 and Figure 6, respectively. As can be seen, the temperature changes smoothly in the vertical direction on the concrete structure in Figure 5. According to Figure 6, the maximum longitudinal thermal stress (3.43 MPa) is found at the bottom of the box girder, which is greater than the tensile strength of C50 concrete (2.65 MPa). This indicates that the stress induced by the uneven temperature is significant for Huangsha Harbor Bridge under construction. Multiple thermal stress field analyses are undertaken based on one-factor design and the temperature variation range stipulated in Ref. [17], and the stress at the position of the realistic upper measurement point is extracted for each case, which is listed in Table 1. Then, using data listed in Table 1, a linear regression model (Equation (1)) describing the relationship between the temperature discrepancy (in °C) and the induced stress at upper measurement point (in Pa) is established for use according to the RS method. The significant test results for the established regression model are shown in Table 2. Table 2 has three important results to show that Equation (1) is valid: (1) F = 1.780× 10⁸ > F0.05, p < 0.0001. This shows that the regression model is significant, and the lack of fit term is insignificant. (2) R2 = 1. This proves that the model is accurate, and the experimental error is small. (3) Adequate precision equals 23,532.462. This proves that the signal is sufficient and the fitting cure is valid over the entire design space. Further, the temperature discrepancy against the calculated stress curve is plotted in Figure 7 to further show the rationality of Equation (1). From Figure 7, a linear relationship exists between the temperature discrepancy and the stress.
Stress = +1.54620 − 4174.98819 × Temperature discrepancy
Finally, by feeding the temperature discrepancy measured between the top and the bottom of the measurement cross-section in each construction stage in real time to Equation (1), the stress due to the uneven temperature on the structure was calculated for each construction stage and used to compensate for the deviation in all measured data.
Although the deviation in the measured stress due to the uneven temperature is compensated for, the error for the data obtained could still be as high as 15% when the vibrating wire stress transducer is used over a certain period due to the inherent weaknesses of the measuring technique according to Ref. [18]. Therefore, the structural stress data measured on Huangsha Harbor Bridge should be further updated using an effective approach before use.
3.3. Data Updating
According to Ref. [19], the true stress arrays measured on continuous concrete girder bridges under construction using the symmetric cantilever casting method can be accurately described by mathematical models based on the grey theory. Using the mathematical models based on the grey theory, all the data obtained on Huangsha Harbor Bridge under construction are assessed for their accuracies, and some without the agreement with the grey models are updated accordingly. In addition to the grey theory, there are other approaches that can be utilized to update the measured stress data, such as the interval analysis, the genetic algorithms and other evolutionary approaches. With respect to the interval analysis, the results predicted using the model are given in intervals, but the definite values (stresses) are required by the present data updating. Therefore, the grey theory is preferable in dealing with the present issue, which can predict the definite stresses for use. We suppose that the genetic algorithms and evolutionary approaches are basically optimization methods. For optimization methods to work, surrogate mathematical models have to be established to deal with the inverse mathematical problems, which generally use large samples. However, we do not obtain large stress samples from Huangsha Harbor Bridge under construction, as we have only collected one datum from each transducer in each construction stage, not enough to build usual surrogate models. On the other hand, the grey theory regards all random variables are grey variables within certain variation ranges, and related predictive models can be established based on limited data (small samples) without exploring the uncertainties influencing the system behaviors or separating the system behaviors from the noise behaviors. Therefore, the grey models are also preferable for use in small sample cases, and they are chosen to deal with the present scientific issue of data updating.
3.3.1. Theoretical Background of Grey Theory
Grey systems are those with incomplete known information. A basic viewpoint of grey theory is that all random variables are grey variables within certain variation ranges, and related predictive models can be established based on limited data without exploring the uncertainties influencing the system behaviors or separating the system behaviors from the noise behaviors. Grey variables should be processed following some innovative rules to reveal the inherent laws among them, rather than traditional statistical laws. Accumulated generating operation (AGO) is a fundamental grey-theory-based data processing method, which can transform disordered random sequences into well-ordered regular arrays.
The original sequence and the generated sequence are, respectively, assumed as and . If
is the first-order accumulative sequence of , written as 1-AGO sequence.
Assuming the system characteristic data are , is the neighboring averagely generated sequence of , which can be written as:
The following grey differential equation can be regarded as GM (1,1) model:
Assuming , the parameters with GM (1,1) model satisfy the least square estimation , and the following equation is the whitening differential equation of the GM (1,1) model:
By solving Equation (5), the approximating response of the GM (1,1) model can be obtained:
Therefore, the response of the original data can be obtained using the subtraction operation:
3.3.2. Data Updating Based on GM (1,1) Models
The original time-domain stress sequences measured on the top of the B-B and the C-C cross-sections shortly after the pre-stresses are applied to the constructed segments and compensated for uneven temperature effects and are shown in Figure 8. As can be seen, the stresses mildly increase with the progress of the construction process. Using the first five data from each of the two original stress sequences measured on the physical truth (i.e., data measured shortly after the pre-stresses are applied to segments 0–4), two GM (1,1) models are established. Using the inversion and the prediction abilities of the GM (1,1) models, two predicted stress sequences are obtained and are shown in Figure 8. As can be seen, the stresses measured on the physical truth after the pre-stresses are applied to segments 5–8 are dramatically smaller than the stresses predicted by the GM (1,1) models. This indicates the deficiency in the present stress measurement technique using the vibrating wire stress transducers. To this end, the original measured stress sequences are updated using the predicted stress sequences. The updating process consists of the following steps: (1) establish two stress discrepancy sequences based on the original stress sequence measured on the physical truth and the stress sequence predicted by GM (1,1) model, i.e., and , respectively; (2) compare with ; (3) when , is replaced by to form the updated stress sequence; otherwise, the original value of the measured stress is kept in the updated stress sequence. The updated stress sequences obtained in this way are also shown in Figure 8. As can be seen, the updated stress sequences are extremely close to the values predicted by GM (1,1) models, demonstrating their fidelities. The updated stress sequences are regarded as the reference data in the subsequent model updating.
4. Numerical Simulation Based on MIDAS FE Platform
Based on MIDAS 6.71 FE platform, Huangsha Harbor Bridge is simulated using 58 beam elements with 63 nodes with the help of the modeling assistant module provided by the platform. We admit that the simplified beam FE models cannot satisfactorily simulate all the geometric details of the structures, and, therefore, inevitably contain model structure errors [20]. According to our experiences, their errors can hardly be completely eliminated through traditional parameter identification. However, MIDAS is a specialized FE platform oriented to bridge engineering, and the beam elements provided by the MIDAS platform are different from those provided by other general FE software, which can accurately reflect the realistic sectional properties of the structure. Therefore, the inherent uncertainties associated with the beam model established are greatly reduced on the MIDAS platform. For the reduced modeling workload and the computing efficiency, we finally chose to use the beam model established on the MIDAS platform.
The numerical simulation procedure sequentially includes the basic information (the elevation geometry, the material properties, the division of the structure for construction, and the construction duration) input, the cross-section geometry input and the steel strand information input. The geometry of the structure is modeled in detail in accordance with Figure 1 and Figure 2, and the concrete material model adopted is the uniaxial compression and tension linear elastic constitutive relation. To take into account the influences of the steel strand pre-stressing, the shrinkage and the creep of the concrete, and other effects during the construction stages on the mechanical state of the constructed structure, the model of Huangsha Harbor Bridge is established progressively reflecting each constructional state in time order, including the concrete pouring of the piers, the concrete pouring of the 0 blocks above the piers, the carriage traveling, the concrete pouring and the steel strand tensioning for 1~8 blocks, the closure of T-shaped structures and the structural system transformation. Therefore, the process accurately considers the cumulative influences of the multiple constructional effects. The FE model established for Huangsha Harbor Bridge after concrete segment 5 is poured and the FE model of the finally built Huangsha Harbor Bridge are shown in Figure 9 and Figure 10, respectively. This initial model employs the design parameters of the structure, which might deviate from their actual values.
5. Model Updating Using Data from Construction Monitoring
In this portion of study, the numerical model established in Section 4 is updated using the updated stress sequences measured on B-B and C-C cross-sections presented in Figure 8. The FE model for the stages where the pre-stresses are applied to the constructed segments 1–7 is updated, in turn, by treating the applied pre-stresses as the uncertain parameters to identify.
Taking the model updating for the stage where pre-stresses are applied to segments 1 as an example, the applied pre-stresses are uniformly set at five points in the interval (0.5*design value, 1.5*design value) (i.e., 6.52 × 10⁸ N/m2, 9.78 × 10⁸ N/m2, 1.30 × 10⁹ N/m2, 1.63 × 10⁹ N/m2, and 1.96 × 10⁹ N/m2), and the stresses on the top of the B-B and the C-C cross-sections are calculated using the initial FE model with different applied pre-stresses. The obtained results are 2.56 MPa, 3.11 MPa, 3.66 MPa, 4.21 MPa, and 4.77 MPa, respectively, for the above-mentioned five points of applied pre-stresses. Then, a linear surrogate model reflecting the relationship between the stress on the top of the B-B (or the C-C) cross-section and the applied pre-stress to the segment 1 can be established based on the regression technique using the data obtained above, which can be written as , in which x is the stress on the top of the B-B (or the C-C) cross-section (in Pa) and y is the applied pre-stress to the segment 1 (in Pa). Then, by feeding the stresses measured at the engineering site on B-B and C-C cross-sections (i.e., 4.1 MPa and 6.6 MPa, respectively) to the linear surrogate model obtained, the applied pre-stresses to segments 1 are identified for #6 pier and #7 pier, which are 1.56 × 10⁹ N/m2 and 3.04 × 10⁹ N/m2, respectively. Finally, by substituting the design value of the applied pre-stress to segment 1 in the initial FE model with the identified value, model updating for the stage that pre-stresses are applied to segments 1 is completed.
After the model updating for the stage that pre-stresses are applied to segments 1 is completed, model updating for subsequent construction stages is undertaken progressively following the construction sequence with reference to the stress data measured on the location (see Figure 8). Model updating for subsequent stages basically follows the practice presented above for model updating for the stage that pre-stresses are applied to segments 1, and the identified pre-stresses to segments 1~7 are shown and compared with the initial design value in Figure 11. As can be seen, all the identified pre-stresses are notably greater than the initial design values, especially at the late stages in the construction process. This indicates that the analyses using the initial FE model without model updating might lead to inauthentic results. Finally, the updated numerical model of Huangsha Harbor Bridge is obtained for use by incorporating the identified pre-stresses. It should be emphasized that due to the advantage of the proposed model updating practice, these uncertain parameters with the initial FE model of Huangsha Harbor Bridge are easily and accurately identified using single-variable linear regression models without the need to establish a complicated multi-variable surrogate model and using advanced optimization techniques, e.g., the sensitivity-analysis-based parameter identification.
After model updating, the stress sequences on B-B and C-C cross-sections in accordance with the construction process are calculated using the updated FE model of Huangsha Harbor Bridge and compared with the corresponding stress sequences measured on location in Figure 12. As can be seen, the numerical results for the updated FE model agree well with the full-scale measurement data. This indicates the effectiveness of the proposed model updating practice. In addition, the stress sequences calculated using the initial model without model updating are also added in Figure 12. As can be seen, the numerical results for the initial FE model are noticeably smaller than the full-scale measurement data, suggesting that the structural analyses utilizing the FE model with design parameters might lead to unsafe results.
6. Comparisons between Static Responses of the Numerical Models and Full-Scale Measurement Data
Using the FE model established for the Huangsha Harbor Bridge, with and without model updating, the static responses of the bridge under gravity and all constructional effects are calculated. They are presented in Table 3 and compared with the data measured on the location after Huangsha Harbor Bridge is built and the results calculated using a baseline FE model updated using the traditional method (see Appendix A). As can be seen in Table 3, compared with the results calculated from the initial FE model, the along-bridge altitudes calculated using the FE model updated using the new method are much closer to the full-scale measurement data. In Table 3, most relative errors between the full-scale measurement results and the data from the FE model updated using the new method are no greater than 10%; however, they are generally greater than 10% between the full-scale measurement results and the data from the initial FE model. In addition, the RMS error is 32.74% for the model updated using the new method, and it is 41.07% for the initial model. These all suggest the effectiveness of the proposed model updating approach. With regard to the model updated using the traditional method, it can be found in Table 3 that its accuracy is not much better than the initial model without model updating. Similar to the initial model, most relative errors between the full-scale measurement results and the data from the FE model updated using the traditional method are greater than 10%, and the RMS error is 38.48% for the model updated using the traditional method. These demonstrate the superiority of the proposed model updating approach utilizing data from the construction monitoring to the traditional method using structural responses of the built structure.
7. Conclusions
The findings of the present research concerning model updating for a continuous concrete girder bridge using data from the construction monitoring are summarized below:
- (1)
- The abundant data measured on bridges in construction stages can enhance the reference information for the more effective FE model updating of the structures. In addition, with the proposed model updating method utilizing data from the construction monitoring, the uncertain parameters with the initial FE model of the structure can be progressively and easily identified using many single-variable linear regression models, which are superior to one complicated multi-variable mathematical or numerical model employed by most traditional model updating approaches to simultaneously identify many uncertain parameters, as the latter generally leads to non-unique solutions rendered by normal optimization algorithms.
- (2)
- Based on the engineering case of Huangsha Harbor Bridge, it is demonstrated that the proposed model updating approach is effective in practical use, and it is superior to the traditional model updating method using structural responses of the built structure. It is calculated that the RMS error of static structural responses is 32.74% for the model of Huangsha Harbor Bridge updated using the new method and 41.07% and 38.48% for the initial model without model updating and the model updated using the traditional method, respectively. The improved accuracy of the model updated using the new method can be considered as an advantage of the proposed method compared to the analogue, i.e., the traditional model updating approach based on orthogonal experimental design and support vector regression (SVR). Since Huangsha Harbor Bridge’s FE model is complicated, the sensitivity-analysis-based model updating approach is inapplicable due to its high computational costs, and the surrogate-model-based model updating approach of high computing efficiency is attempted for the traditional model updating approach. Sampling based on orthogonal experimental design and surrogate model establishment based on SVR are undertaken for the traditional model updating to take place. This model updating approach is indicated as the alternative method as a basis for the comparison.
- (3)
- The deviation in the stress measured on the continuous concrete girder bridge due to the uneven temperature can be compensated for using the approach adopted by the present research. In addition, stresses measured in concrete using vibrating wire stress transducers might be inaccurate when the vibrating wire stress transducers are used over a certain period. The stress arrays measured using the technique on continuous concrete girder bridges under construction using the symmetric cantilever casting method can be updated based on the GM (1,1) models.
It should be noted that the during-construction properties change during the construction process for a structure under construction, and the data from the built structure must be different from those measured from the being-built structure. Therefore, the during-construction data are not valid after the construction is completed. However, the whole construction process is simulated by the present study to reflect each construction state, and the FE model of the built structure is generated at the end of the simulation process. Since the monitoring data measured from the being-built structures are only utilized to update the corresponding being-built models, instead of the model of the built structure, the being-built models established for each construction stage should be accurate after model updating. Therefore, the FE model of the built structure should also be accurate after it is established by the present study.
Finally, it should be admitted that although the new model updating approach using data from the construction monitoring is proven to be effective in this article in dealing with FE model updating of Huangsha Harbor Bridge (a three-span concrete continuous box girder bridge constructed utilizing symmetric cantilever casting method), substantial validations are still required to prove its effectiveness in dealing with other structures constructed utilizing other methods. Our future works will focus on this topic.
Funding
This research and the APC were funded by the National Natural Science Foundation of China with grant number [51908124] and the China Postdoctoral Science Foundation with grant number [2016M601793].
Institutional Review Board Statement
Not applicable.
Informed Consent Statement
Not applicable.
Data Availability Statement
The data presented in this study are available on request from the corresponding author.
Acknowledgments
The authors gratefully acknowledge the financial support from the National Natural Science Foundation of China (Grant No. 51908124) and the China Postdoctoral Science Foundation (Grant No. 2016M601793).
Conflicts of Interest
The authors declare no conflict of interest with respect to the research, authorship and/or publication of this article.
Appendix A. Baseline FE Model Updated Using Static Structural Responses of the Built Structure
To validate the effectiveness of the proposed method, the FE model updated using the construction monitoring data in Section 5 should be compared with a traditional baseline FE model updated using structural responses of the built structure. For this purpose, the original FE model of Huangsha Harbor Bridge established in Section 4 is updated again according to the traditional model updating approach in this portion of study. Since Huangsha Harbor Bridge’s FE model is complicated, the sensitivity-analysis-based model updating approach is inapplicable due to its high computational costs [21], and the surrogate-model-based model updating approach of high computing efficiency [6,8,9] is attempted. Sampling based on orthogonal experimental design [22,23,24] and surrogate model establishment based on SVR [25] are undertaken for the traditional model updating to take place, the details of which are as follows.
Appendix A.1. Sampling on the Initial FE Model Based on Seven-Factor Orthogonal Experimental Design
In accordance with the new model updating practice presented in Section 5, the pre-stresses applied to segments 1~7 are treated as uncertain parameters to identify for the traditional model updating for Huangsha Harbor Bridge. To obtain sufficient information with the minimum sampling workload, seven-factor orthogonal experimental design, a common sampling method proved to be effective in various fields [22,23,24] is utilized. According to a preliminary evaluation, the variation range of the parameters is chosen as being (design value, 1.5×design value). Following the principle of seven-factor two-level orthogonal experimental design, eight runs of sampling should be undertaken, which are shown in Table A1.

Table A1.
Sample points based on seven-factor two-level orthogonal experimental design.
| Run | Pre-Stresses Applied to Segment (N/m2) | ||||||
|---|---|---|---|---|---|---|---|
| Segment 1 | Segment 2 | Segment 3 | Segment 4 | Segment 5 | Segment 6 | Segment 7 | |
| 1 | 1.30 × 10⁹ | 1.30 × 10⁹ | 1.30 × 10⁹ | 1.30 × 10⁹ | 1.30 × 10⁹ | 1.30 × 10⁹ | 1.30 × 10⁹ |
| 2 | 1.30 × 10⁹ | 1.30 × 10⁹ | 1.30 × 10⁹ | 1.96 × 10⁹ | 1.96 × 10⁹ | 1.96 × 10⁹ | 1.96 × 10⁹ |
| 3 | 1.30 × 10⁹ | 1.96 × 10⁹ | 1.96 × 10⁹ | 1.30 × 10⁹ | 1.30 × 10⁹ | 1.96 × 10⁹ | 1.96 × 10⁹ |
| 4 | 1.30 × 10⁹ | 1.96 × 10⁹ | 1.96 × 10⁹ | 1.96 × 10⁹ | 1.96 × 10⁹ | 1.30 × 10⁹ | 1.30 × 10⁹ |
| 5 | 1.96 × 10⁹ | 1.30 × 10⁹ | 1.96 × 10⁹ | 1.30 × 10⁹ | 1.96 × 10⁹ | 1.30 × 10⁹ | 1.96 × 10⁹ |
| 6 | 1.96 × 10⁹ | 1.30 × 10⁹ | 1.96 × 10⁹ | 1.96 × 10⁹ | 1.30 × 10⁹ | 1.96 × 10⁹ | 1.30 × 10⁹ |
| 7 | 1.96 × 10⁹ | 1.96 × 10⁹ | 1.30 × 10⁹ | 1.30 × 10⁹ | 1.96 × 10⁹ | 1.96 × 10⁹ | 1.30 × 10⁹ |
| 8 | 1.96 × 10⁹ | 1.96 × 10⁹ | 1.30 × 10⁹ | 1.96 × 10⁹ | 1.30 × 10⁹ | 1.30 × 10⁹ | 1.96 × 10⁹ |
Using data listed in Table A1, samplings are performed by conducting static analyses on the FE model with the parameter values given by the experimental design allocated to the seven uncertain parameters. The along-bridge altitudes are calculated accordingly (see Figure A1), which will be used as the surrogate model’s inputs.
Figure A1.
Sampling results based on orthogonal experimental design.

Appendix A.2. SVR Method
The SVR method is a novel machine learning method based on the statistical learning theory. Assuming that is the input variable, the regression function can be expressed as:
where is the nonlinear mapping vector in the high-dimensional space; and are determined as N-dimensional linear regressors in the high-dimensional feature space.
According to the SVR method, in multi-output cases, the structural risk minimization is equal to the following constrained optimization problem:
where represents the loss function defined in the hyper-spherical zone expression as:
where , , and are the hyper-spherical insensitive zone. When , this problem is reduced to an independent regularized kernel least squares regression for each component. However, for a nonzero , in the solution, all of the outputs are considered to construct an individual regressor, in order to obtain the best global predictions.
According to Teng et al. [25], the main steps of model updating based on the SVR method are: (1) Constructing the samples. More precisely, the samples of the design parameters can be determined based on any experimental design technique, while the responses of the structure can be obtained by FE analysis for each sample. (2) Training the SVR model. The SVR model is trained with the responses and the corresponding design parameters, considered as the inputs and the outputs, respectively. (3) Updating the design parameters. The measured responses are the input to the trained SVR model, while the outputs are the target design parameters.
Appendix A.3. FE Model Updating Based on SVR Models
To update the initial model established in Section 4, data listed in Table A1 and presented in Figure A1 are used to train a SVR model. The along-bridge altitudes calculated for different sampling points are taken as the trained SVR model inputs, and the outputs of the SVR model are the pre-stresses applied to segments 1~7. After training the SVR model, the along-bridge altitudes measured on location (see Table 3) are provided as the inputs to the surrogate model, and identified parameters are 1.5341 × 10⁹ N/m2, 1.4718 × 10⁹ N/m2, 1.5694 × 10⁹ N/m2, 1.6889 × 10⁹ N/m2, 1.4933 × 10⁹ N/m2, 1.6279 × 10⁹ N/m2, and 1.5458 × 10⁹ N/m2 for the pre-stresses applied to segments 1~7, respectively. Using the FE model of Huangsha Harbor Bridge updated using the traditional approach, static analysis was conducted again with the parameter identified by the SVR method. The computed along-bridge altitudes are listed in Table 3 for the required comparison.
References
- Mufti, A. Structural health monitoring of innovative bridge decks. Struct. Infrastruct. Eng. 2005, 1, 119–133. [Google Scholar] [CrossRef]
- Friswell, M.I.; Mottershead, J.E. Finite Element Model Updating in Structural Dynamics; Kluwer Academic: Boston, MA, USA, 1995. [Google Scholar]
- Zhang, Q.W.; Chang, T.Y.P.; Chang, C.C. Finite element model updating for the Kap Shui Mun cable-stayed bridge. J. Bridge Eng. 2001, 6, 285–293. [Google Scholar] [CrossRef]
- Brownjohn, J.M.W.; Xia, P.Q. Dynamic assessment of curved cable-stayed bridge by model updating. J. Struct. Eng. 2000, 126, 252–260. [Google Scholar] [CrossRef] [Green Version]
- Jaishi, B.; Ren, J.X. Structural finite element model updating using ambient vibration test results. J. Struct. Eng. 2005, 131, 617–628. [Google Scholar] [CrossRef]
- Deng, L.; Cai, C.S. Bridge model updating using response surface method and genetic algorithm. J Bridge Eng. 2010, 15, 553–564. [Google Scholar] [CrossRef]
- Aloisio, A.; Alaggio, R.; Fragiacomo, M. Dynamic identification and model updating of full-scale concrete box girders based on the experimental torsional response. Constr. Build. Mater. 2020, 264, 120146. [Google Scholar] [CrossRef]
- Ren, W.X.; Fang, S.E.; Deng, M.Y. Response surface based finite element model updating using structural static responses. J. Eng. Mech. 2011, 137, 248–257. [Google Scholar] [CrossRef]
- Cheng, X.X.; Wu, G.; Zhang, L.; Ma, F.B. A new damage detection method for special-shaped steel arch bridges based on Fractal Theory and the model updating technique. Int. J. Struct. Stab. Dyn. 2021, 21, 2150030. [Google Scholar] [CrossRef]
- De Domenico, D.; Messina, D.; Recupero, A. Quality control and safety assessment of prestressed concrete bridge decks through combined field tests and numerical simulation. Structures 2022, 39, 1135–1157. [Google Scholar] [CrossRef]
- Xia, Y.; Ni, Y.-Q.; Zhang, P.; Liao, W.-Y.; Ko, J.-M. Stress Development of a Supertall Structure during Construction: Field Monitoring and Numerical Analysis. Comput. Aided Civ. Infrastruct. Eng. 2011, 26, 542–559. [Google Scholar] [CrossRef] [Green Version]
- Teng, J.; Lu, W.; Cui, Y.; Zhang, R. Temperature and Displacement Monitoring to Steel Roof Construction of Shenzhen Bay Stadium. Int. J. Struct. Stab. Dyn. 2016, 16, 1640020. [Google Scholar] [CrossRef]
- Baas, E.J.; Riggio, M.; Barbosa, A.R. A methodological approach for structural health monitoring of mass-timber buildings under construction. Constr. Build. Mater. 2021, 268, 121153. [Google Scholar] [CrossRef]
- Park, H.S.; Shin, Y.; Choi, S.W.; Kim, Y. An Integrative Structural Health Monitoring System for the Local/Global Responses of a Large-Scale Irregular Building under Construction. Sensors 2013, 13, 9085–9103. [Google Scholar] [CrossRef] [PubMed] [Green Version]
- Wenner, M.; Kading, M.; Marx, S. Monitoring of bridges under construction. Bautechnik 2018, 95, 44–52. [Google Scholar] [CrossRef]
- Abdal, S.; Mansour, W.; Agwa, I.; Nasr, M.; Abadel, A.; Özkılıç, Y.O.; Akeed, M.H. Application of Ultra-High-Performance Concrete in Bridge Engineering: Current Status, Limitations, Challenges, and Future Prospects. Buildings 2023, 13, 185. [Google Scholar] [CrossRef]
- JTG D60-2015; General Specifications for Design of Highway Bridges and Culverts. CCCC Highway Consultants Co., Ltd.: Beijing, China, 2015. (In Chinese)
- Xiang, M.; Lu, W.; Zhu, H.; Zhou, D. Process control technology during cast-in-place cantilever construction in long span prestressed concrete continuous beam bridge. J. Highw. Transp. Res. Dev. 2004, 21, 71–73. (In Chinese) [Google Scholar]
- Cheng, X.; Han, X.; Miao, C.; Bi, L. Stress prediction and control in cantilever construction of continuous beam bridge based on Grey Theory. World Bridges 2009, 4, 46–49. (In Chinese) [Google Scholar]
- Dai, L.; Cui, M.-D.; Cheng, X.-X. Structural-Health-Monitoring-Oriented Finite Element Model for a Specially Shaped Steel Arch Bridge and Its Application. Math. Comput. Appl. 2023, 28, 33. [Google Scholar] [CrossRef]
- Cheng, X.X.; Dong, J.; Han, X.L.; Fei, Q.G. Structural health monitoring-oriented finite-element model for a large transmission tower. Int. J. Civ. Eng. 2018, 16, 79–92. [Google Scholar] [CrossRef]
- Waldo, W.G.; Katnani, A.D.; Sachdev, H.S. Resist optimization for SOR X-ray lithography using an orthogonal experimental design. In Electron-Beam, X-ray, and Ion-Beam Submicrometer Lithographies for Manufacturing; SPIE: Bellingham, WA, USA, 1992. [Google Scholar] [CrossRef]
- Wang, G.; Ma, X.; Hu, T.; Zhang, D. Experimental and analytical study on factors influencing biomimetic undulating fin propulsion performance based on orthogonal experimental design. Adv. Robot. 2013, 27, 597–609. [Google Scholar] [CrossRef]
- Shao, S.; Li, Z.; Zhang, J.; Gao, K.; Liu, Y.; Jiao, W. Preparation of Ce-MnOX/γ-Al2O3 by high gravity-assisted impregnation method for efficient catalytic ozonation. Chem. Eng. Sci. 2022, 248, 117246. [Google Scholar] [CrossRef]
- Teng, J.; Zhu, Y.-H.; Zhou, F.; Li, H.; Ou, J.-P. Finite element model updating for large span spatial steel structure considering uncertainties. J. Cent. South Univ. Technol. 2010, 17, 857–862. [Google Scholar] [CrossRef]
Figure 1.
Elevation sketch of Huangsha Harbor Bridge (unit: cm).

Figure 2.
Cross-section sketch of Huangsha Harbor Bridge (unit: cm).
Figure 3.
Actual view of an arranged vibrating wire stress transducer.
Figure 4.
Numerical model of a 0-block of Huangsha Harbor Bridge.
Figure 5.
Calculated temperature field on the 0-block (Unit: °C).
Figure 6.
Calculated thermal stress field on the 0-block (Unit: Pa). (a) View from the top; (b) view from the bottom.
Figure 6.
Calculated thermal stress field on the 0-block (Unit: Pa). (a) View from the top; (b) view from the bottom.
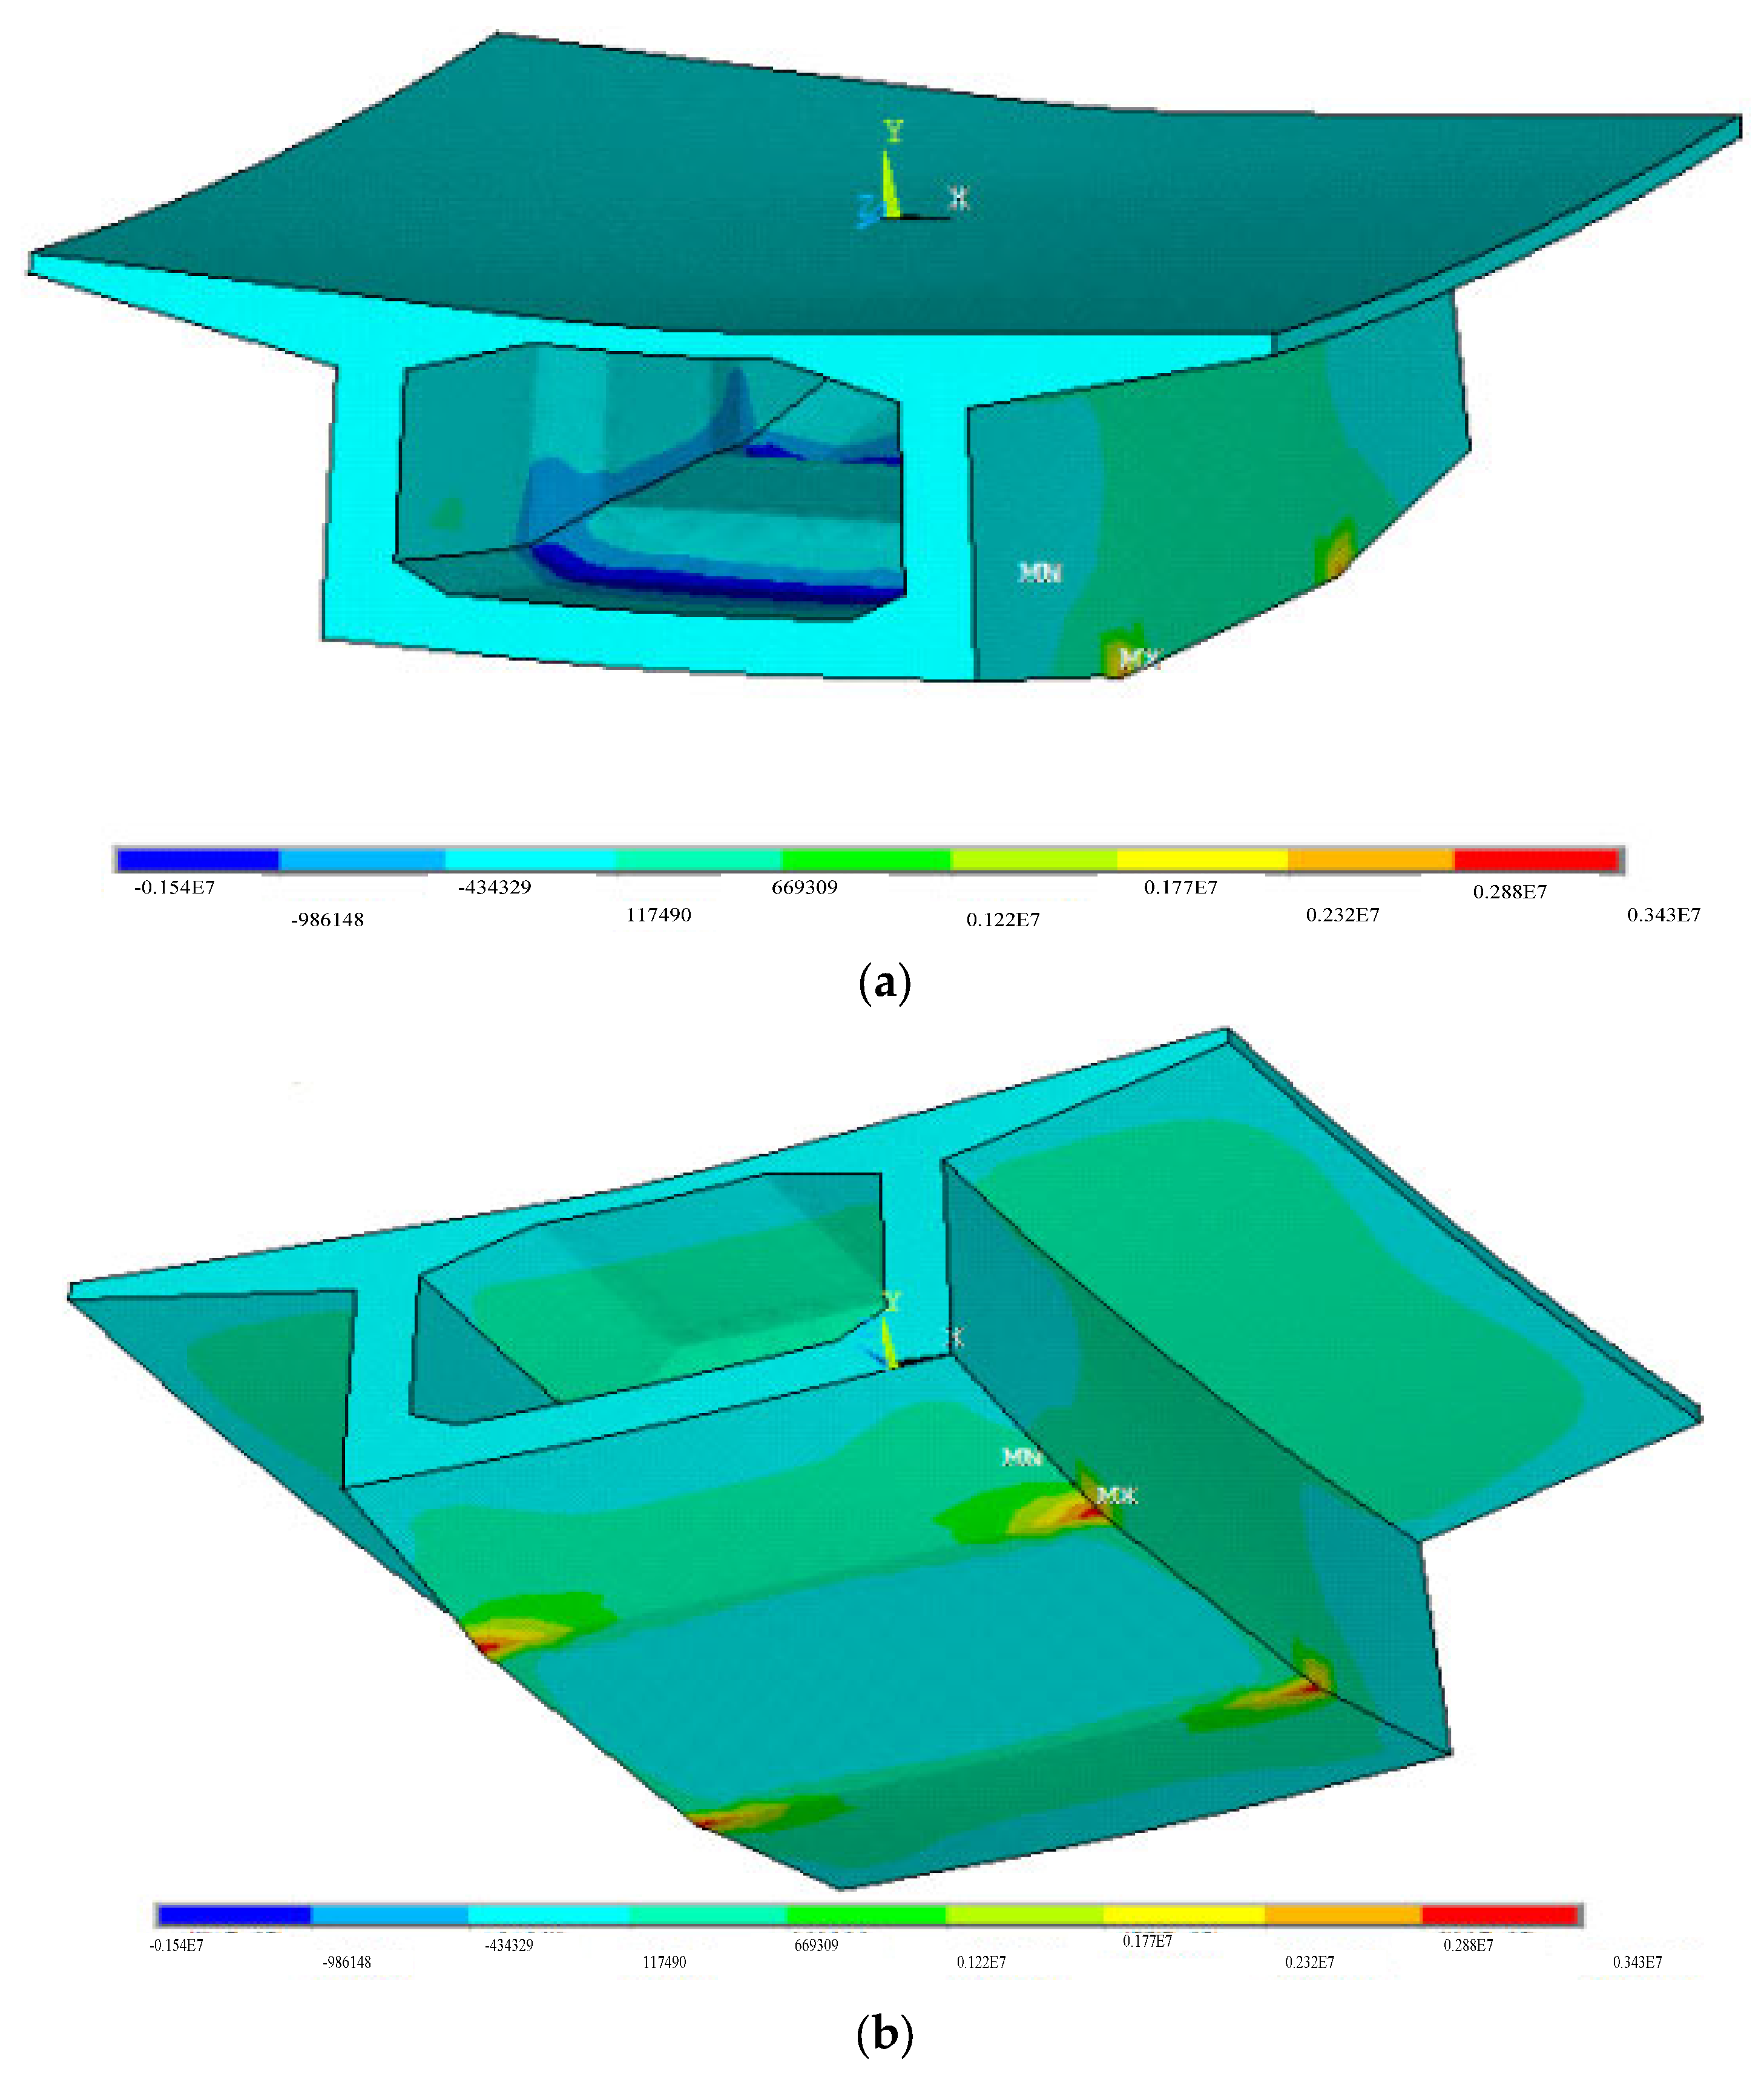
Figure 7.
Temperature discrepancy–stress plot.

Figure 8.
Stress sequences measured on location and predicted by GM (1,1) models. (a) B-B cross-section. (b) C-C cross-section.
Figure 8.
Stress sequences measured on location and predicted by GM (1,1) models. (a) B-B cross-section. (b) C-C cross-section.
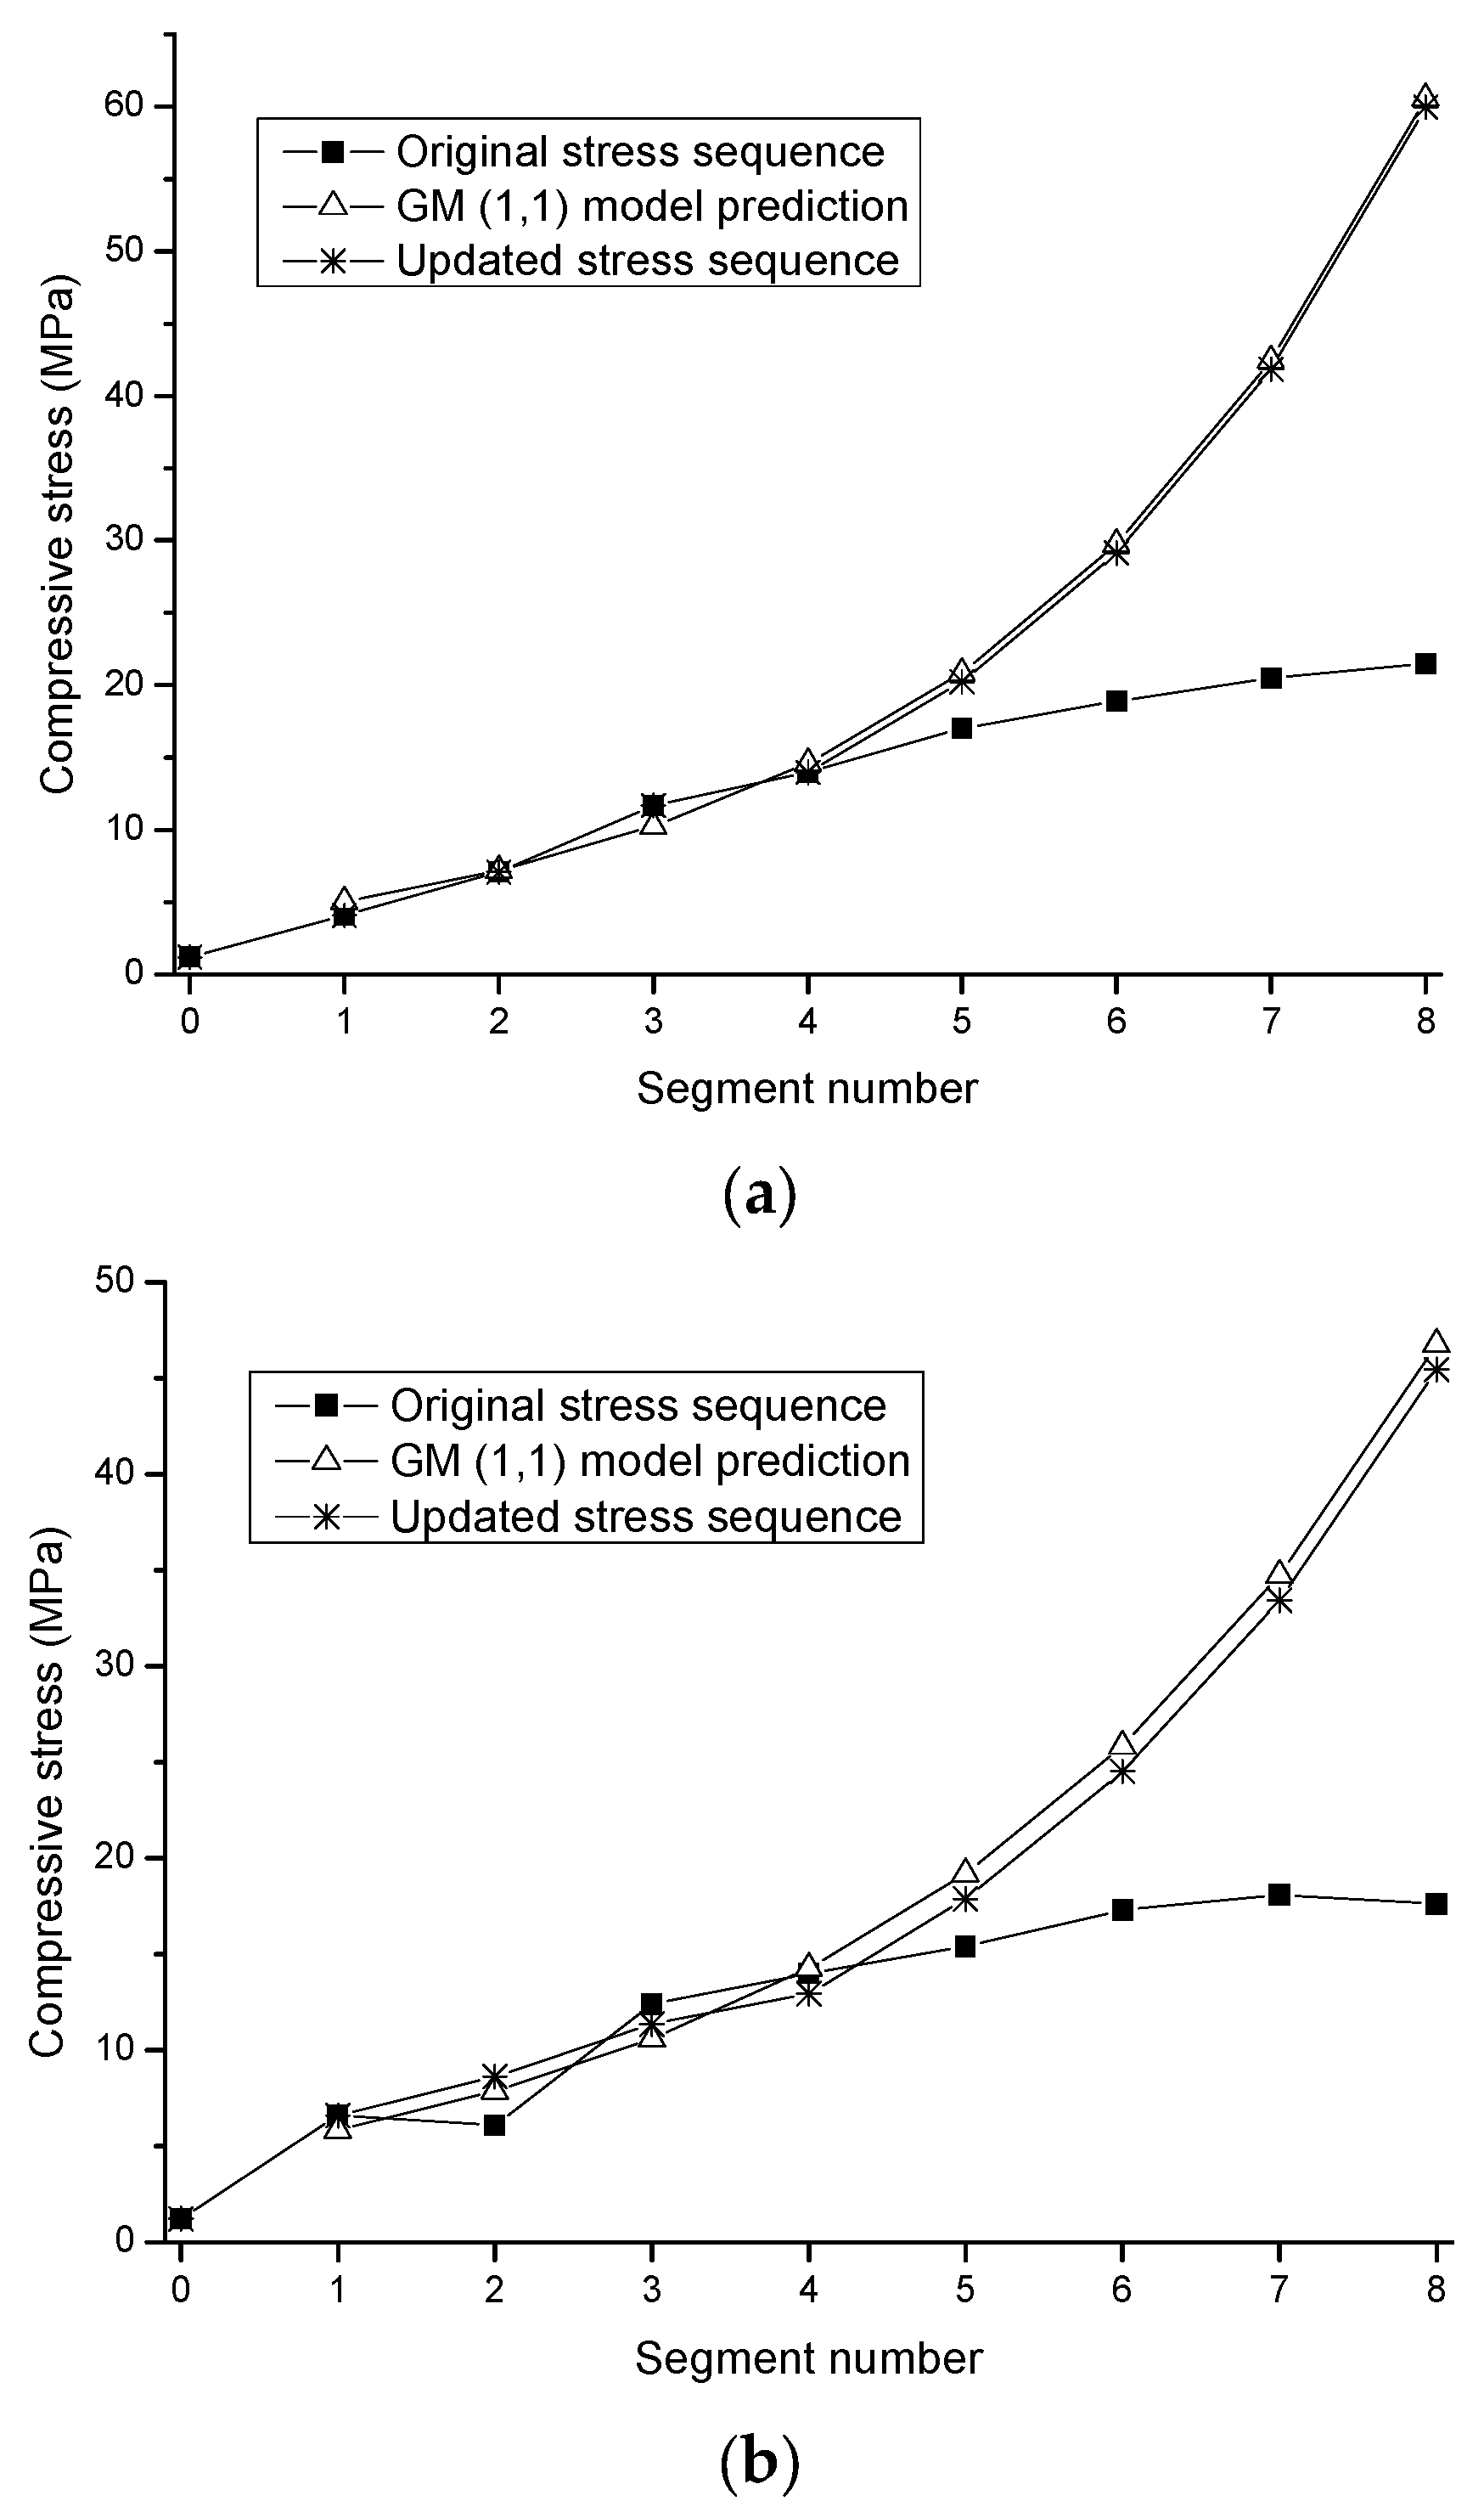
Figure 9.
Numerical model of Huangsha Harbor Bridge at a construction stage.
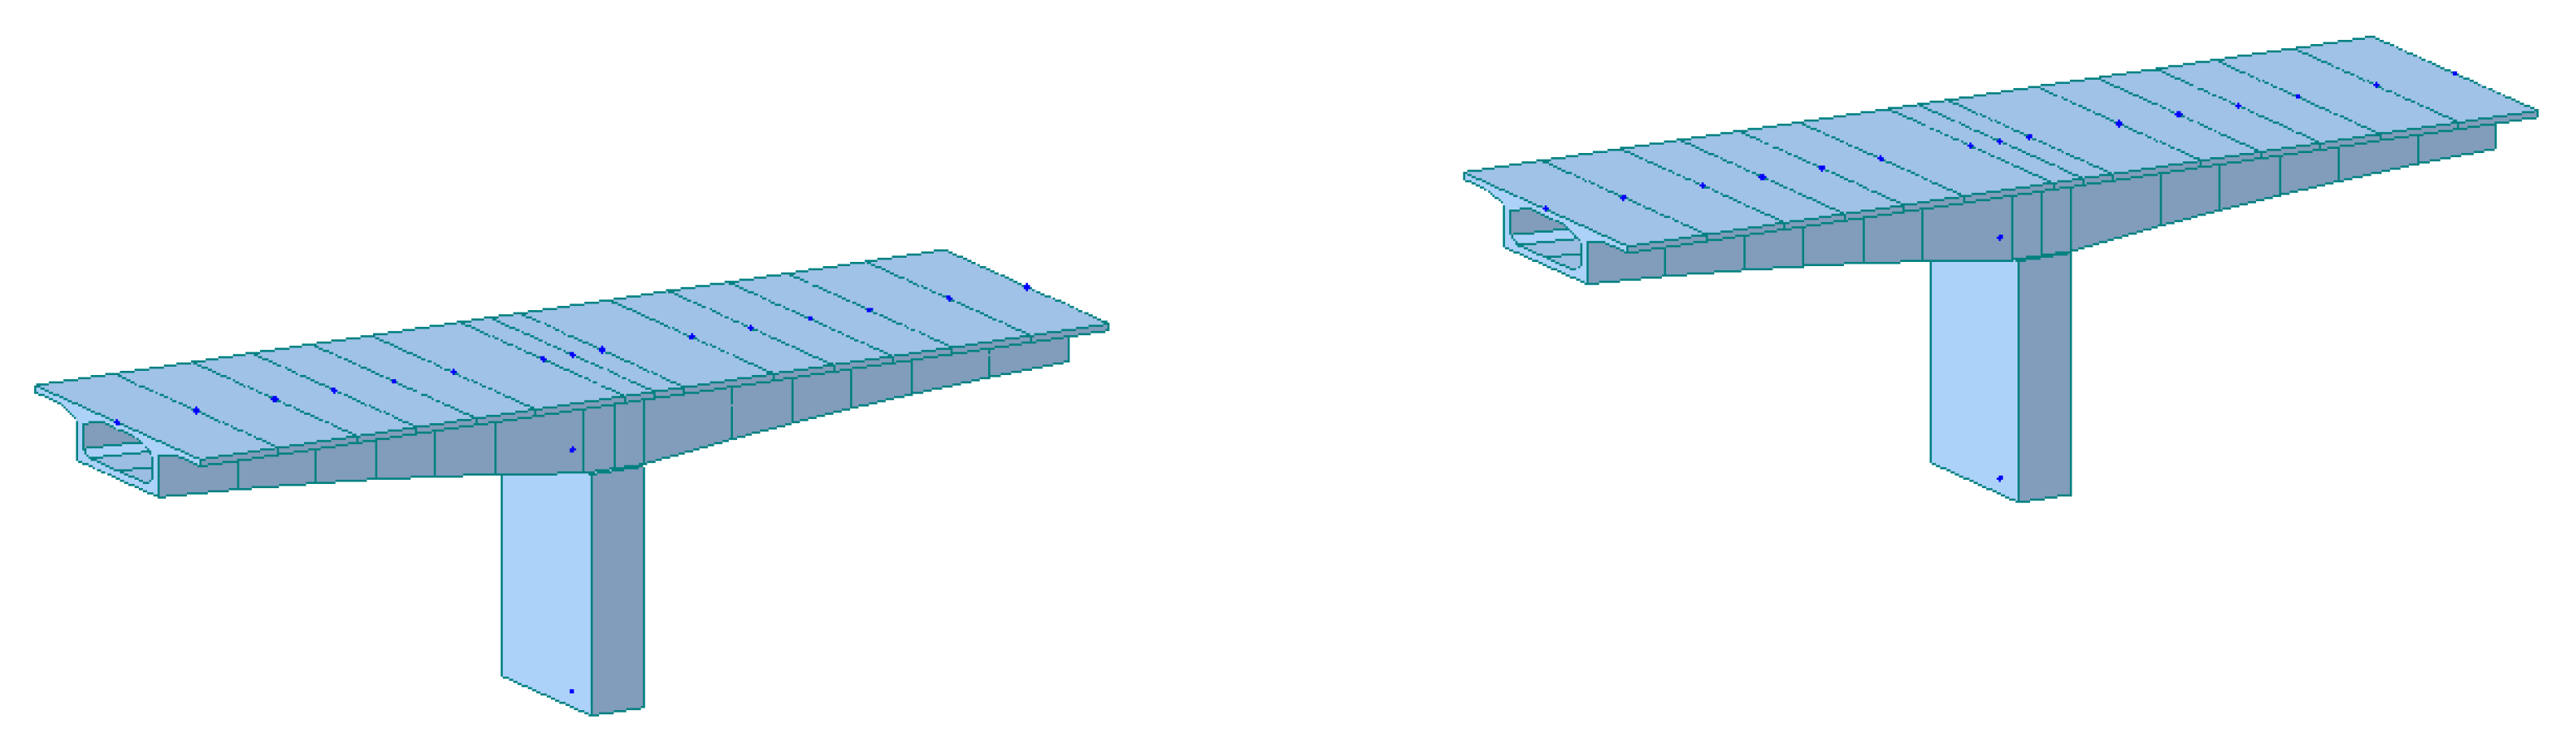
Figure 10.
Numerical model of Huangsha Harbor Bridge after construction.
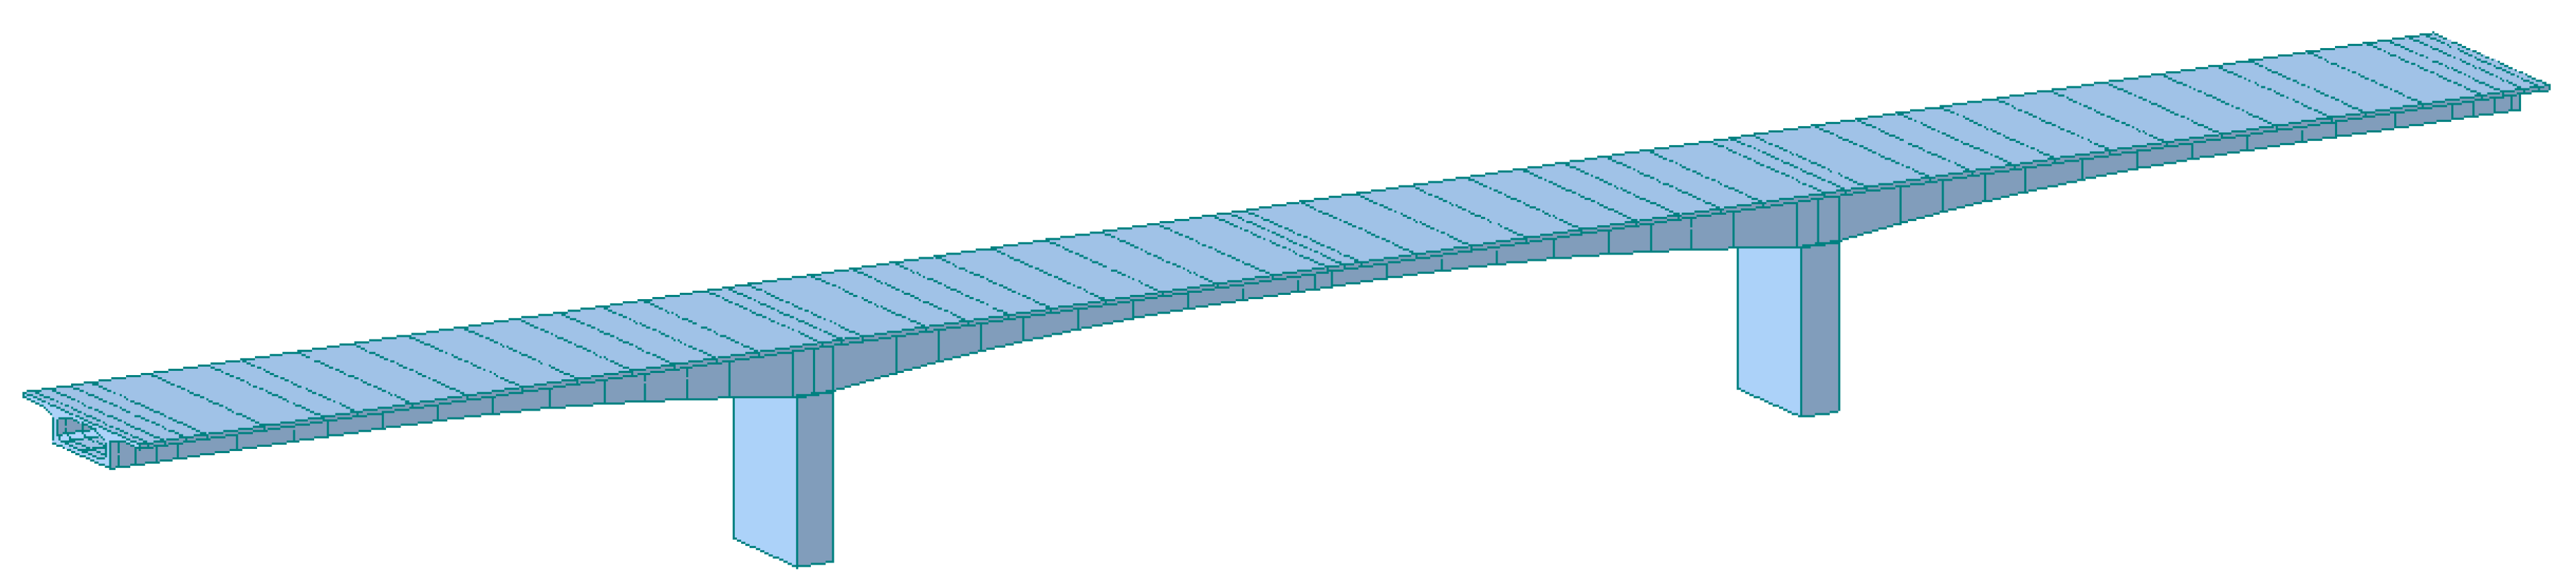
Figure 11.
Design pre-stresses applied to segments 1~7 and the identified values. (a) #6 pier; (b) #7 pier.
Figure 11.
Design pre-stresses applied to segments 1~7 and the identified values. (a) #6 pier; (b) #7 pier.

Figure 12.
Stress sequences calculated using the FE model and measured on location. (a) B-B cross-section; (b) C-C cross-section.
Figure 12.
Stress sequences calculated using the FE model and measured on location. (a) B-B cross-section; (b) C-C cross-section.
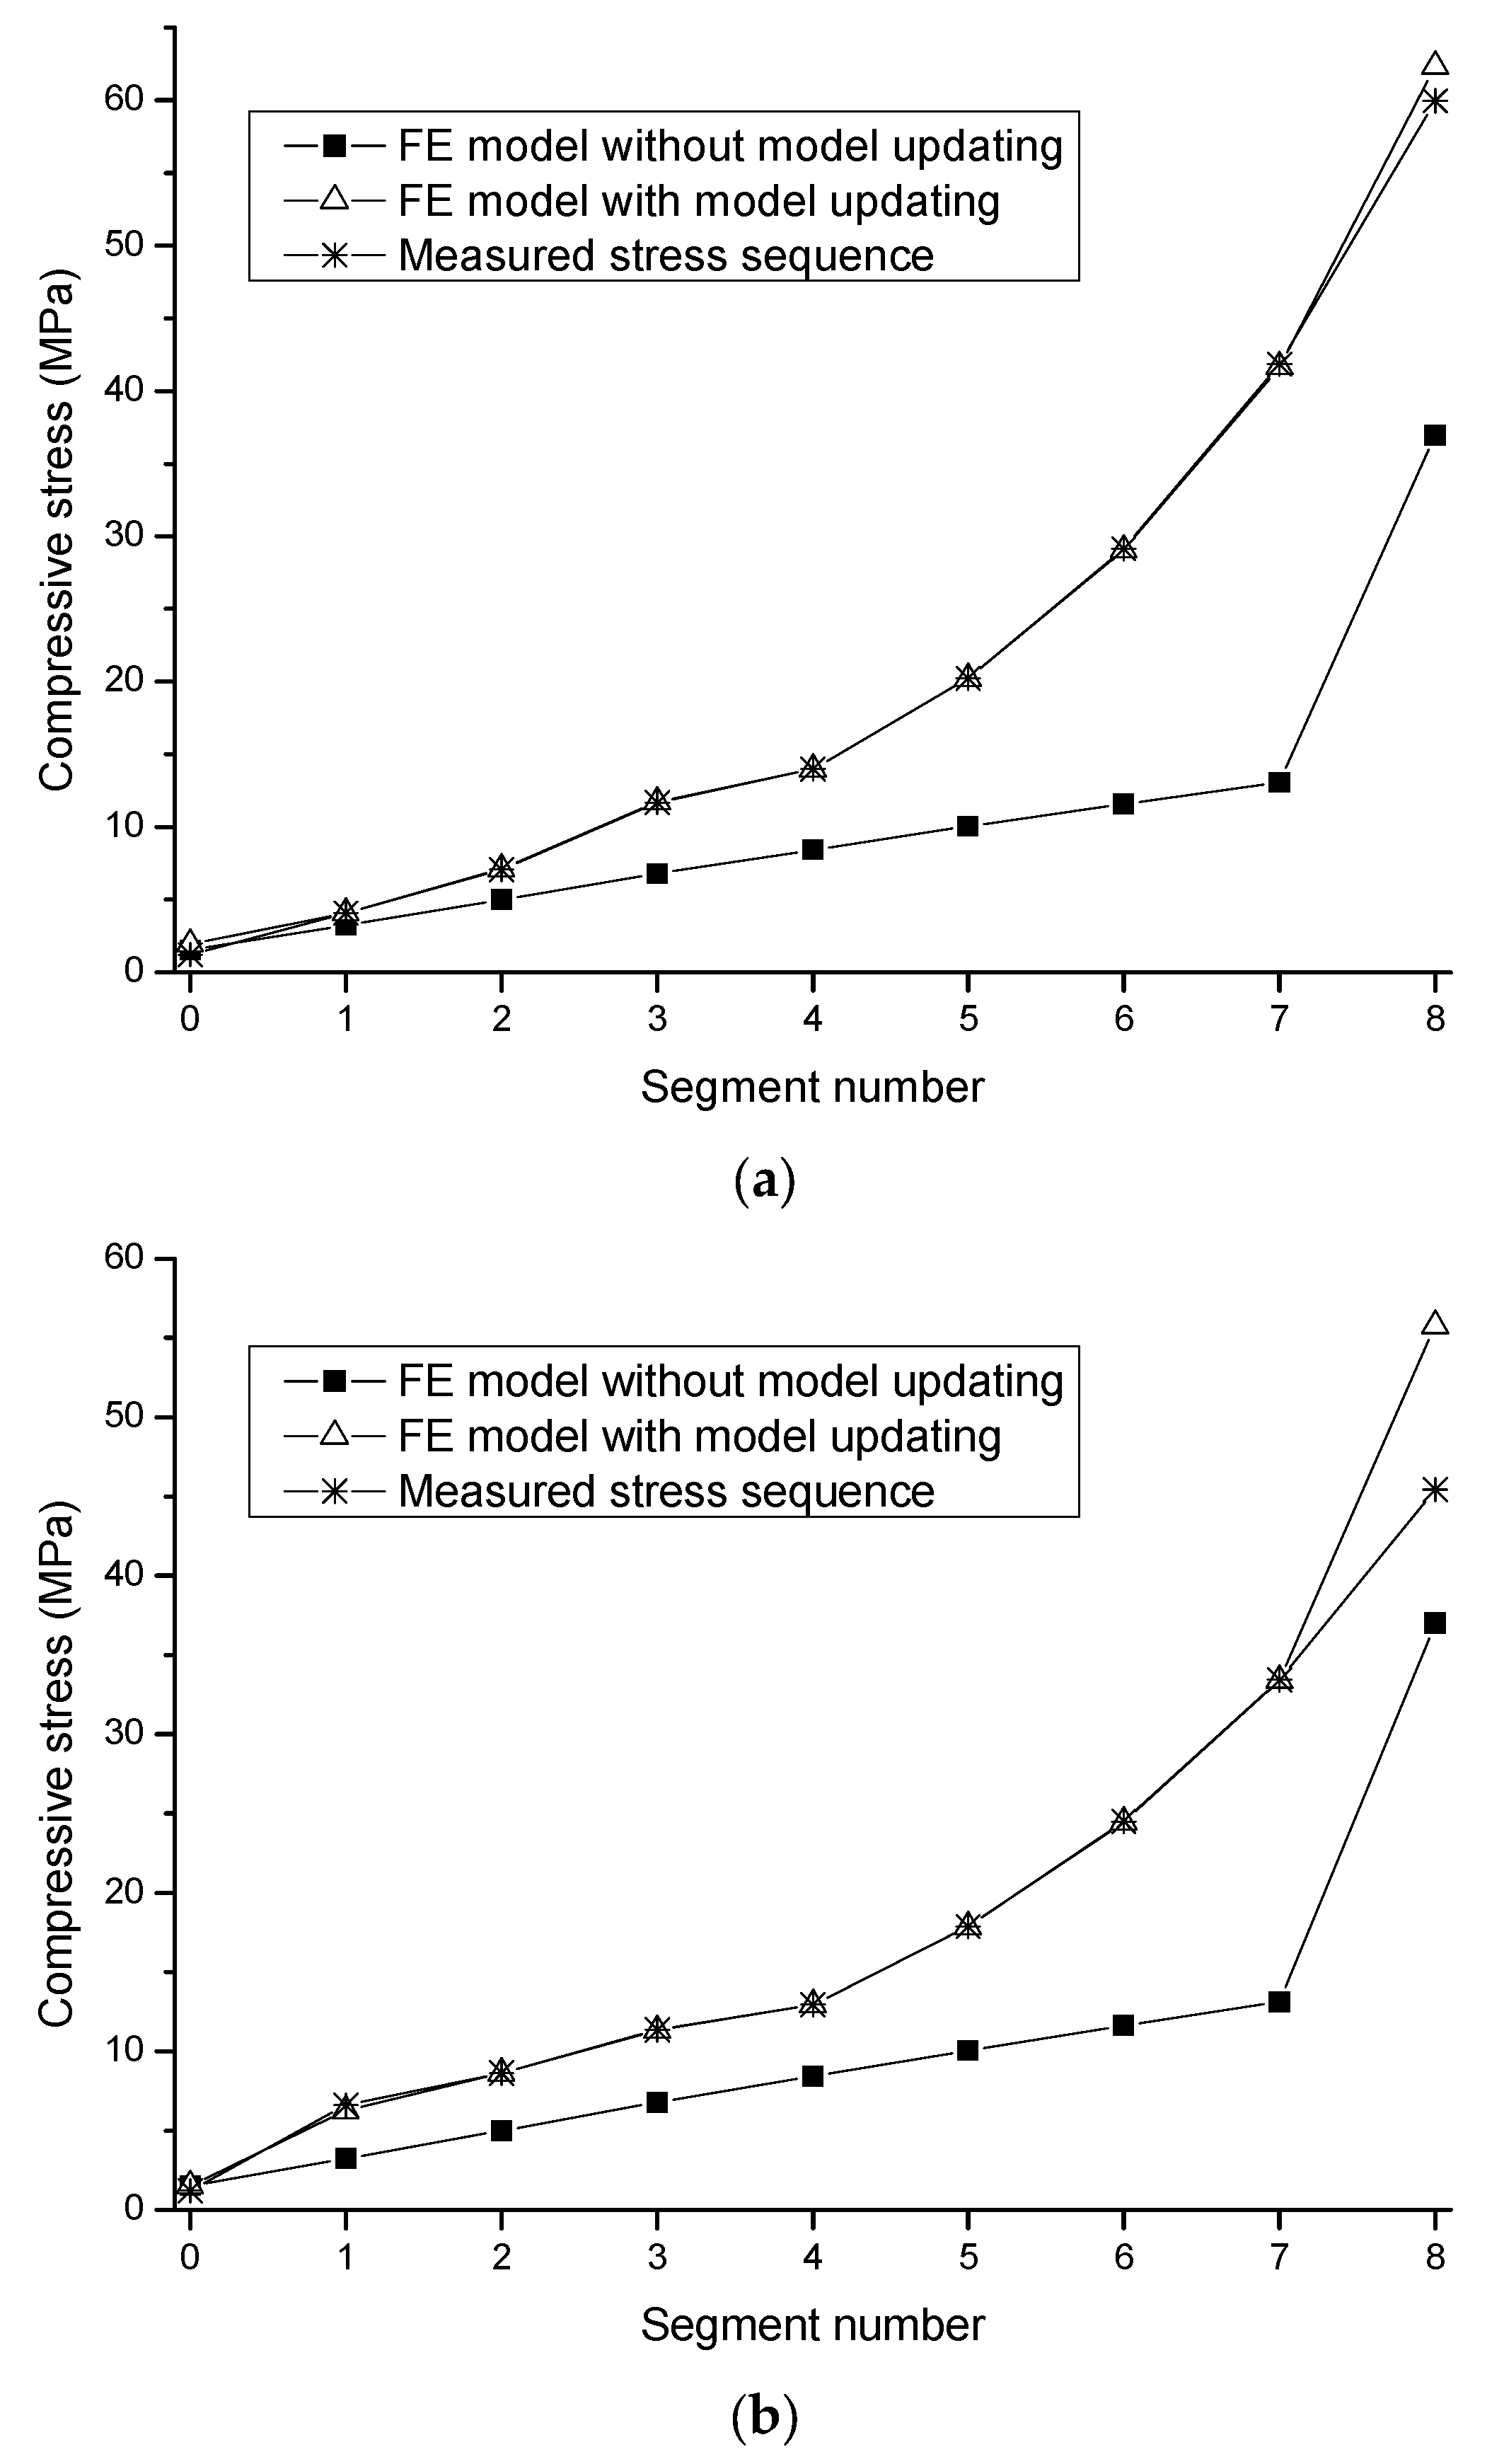
Table 1.
Samples based on one-factor design.
| Run | Temperature Discrepancy (°C) | Stress at Upper Measurement Point (Pa) |
|---|---|---|
| 1 | −3.125 | 13,066.9387 |
| 2 | 6.25 | −26,092.13 |
| 3 | 25 | −104,368.52 |
| 4 | 15.625 | −65,251.1987 |
| 5 | 25 | −104,368.52 |
| 6 | −12.5 | 52,184.26 |
| 7 | −12.5 | 52,184.26 |
Table 2.
Significant test results for the established regression model.
| Factor | Sum of Squares | DF | Mean Square | F Value | Prob > F | R2 | Adequate Precision |
|---|---|---|---|---|---|---|---|
| Regression model (factor) | 2.758 × 10¹⁰ | 1 | 2.758 × 10¹⁰ | 1.780 × 10⁸ | <0.0001 | 1.0000 | 23,532.462 |
| Residual | 774.60 | 5 | 154.92 | ||||
| Lack of fit | 774.60 | 3 | 258.20 | ||||
Table 3.
Along-bridge altitudes of Huangsha Harbor Bridge measured on location and calculated using the FE models.
Table 3.
Along-bridge altitudes of Huangsha Harbor Bridge measured on location and calculated using the FE models.
| Along-Bridge Position (m) | Full-Scale Altitude (m) | Initial Model without Model Updating | Model Updated Using the Proposed Method | Model Updated Using the Traditional Method | |||
|---|---|---|---|---|---|---|---|
| Altitude (m) | Relative Error (%) | Altitude (m) | Relative Error (%) | Altitude (m) | Relative Error (%) | ||
| 0 | −0.00261 | 0 | 100 | 0 | 100 | 0 | 100 |
| 11 | 0.01918 | 0.01926 | 0.42 | 0.01938 | 1.04 | 0.01926 | 0.42 |
| 13 | 0.15796 | 0.15375 | 2.67 | 0.15171 | 3.96 | 0.153715 | 2.69 |
| 16.3 | 0.1679 | 0.12186 | 27.42 | 0.1656 | 1.37 | 0.124063 | 26.11 |
| 19.6 | 0.14583 | 0.09311 | 36.15 | 0.14545 | 0.26 | 0.09616 | 34.06 |
| 22.9 | 0.11277 | 0.06771 | 39.96 | 0.11298 | 0.19 | 0.070769 | 37.24 |
| 26.2 | 0.07171 | 0.04654 | 35.10 | 0.07775 | 8.42 | 0.049133 | 31.48 |
| 29.5 | 0.05565 | 0.02958 | 46.85 | 0.05095 | 8.45 | 0.031481 | 43.43 |
| 32 | 0.03987 | 0.01945 | 51.22 | 0.03375 | 15.35 | 0.020846 | 47.72 |
| 34.5 | 0.01509 | 0.01133 | 24.92 | 0.01972 | 30.68 | 0.012221 | 19.01 |
| 37 | 0.00732 | 0.00506 | 30.87 | 0.00898 | 22.68 | 0.005481 | 25.12 |
| 47 | 0.00522 | 0.00328 | 37.16 | 0.00606 | 16.09 | 0.003676 | 29.58 |
| 49.5 | 0.01044 | 0.00903 | 13.51 | 0.01568 | 50.19 | 0.009899 | 5.18 |
| 52 | 0.02467 | 0.01695 | 31.29 | 0.02889 | 17.11 | 0.018314 | 25.76 |
| 54.5 | 0.0429 | 0.02728 | 36.41 | 0.04565 | 6.41 | 0.029139 | 32.08 |
| 57.8 | 0.07183 | 0.04523 | 37.03 | 0.07252 | 0.96 | 0.04778 | 33.48 |
| 61.1 | 0.10877 | 0.06838 | 37.13 | 0.10877 | 0.00 | 0.071389 | 34.37 |
| 64.4 | 0.14771 | 0.09686 | 34.43 | 0.14324 | 3.03 | 0.099851 | 32.40 |
| 67.7 | 0.16664 | 0.12983 | 22.09 | 0.16644 | 0.12 | 0.131949 | 20.82 |
| 71 | 0.15758 | 0.16697 | 5.96 | 0.15657 | 0.64 | 0.166815 | 5.86 |
| 73 | 0.13736 | 0.13504 | 1.69 | 0.13298 | 3.19 | 0.134976 | 1.74 |
| 76.3 | 0.1363 | 0.10321 | 24.28 | 0.13342 | 2.11 | 0.105379 | 22.69 |
| 79.6 | 0.11823 | 0.0753 | 36.31 | 0.11163 | 5.58 | 0.07832 | 33.76 |
| 82.9 | 0.08417 | 0.05144 | 38.89 | 0.08289 | 1.52 | 0.05448 | 35.27 |
| 86.2 | 0.05511 | 0.0324 | 41.21 | 0.05307 | 3.70 | 0.034968 | 36.55 |
| 89.5 | 0.03805 | 0.01799 | 52.72 | 0.03127 | 17.82 | 0.01987 | 47.78 |
| 92 | 0.01127 | 0.01 | 11.27 | 0.01874 | 66.28 | 0.011376 | 0.94 |
| 94.5 | 0.0055 | 0.00414 | 24.73 | 0.00971 | 76.55 | 0.005016 | 8.80 |
| 97 | 0.00872 | 2.18 × 10 −4 | 97.50 | 0.00276 | 68.35 | 0.000625 | 92.83 |
| 107 | 0.01862 | 0.00743 | 60.10 | 0.01012 | 45.65 | 0.007842 | 57.88 |
| 109.5 | 0.02284 | 0.01474 | 35.46 | 0.02054 | 10.07 | 0.015623 | 31.60 |
| 112 | 0.03907 | 0.02374 | 39.24 | 0.03279 | 16.07 | 0.025126 | 35.69 |
| 114.5 | 0.04429 | 0.03457 | 21.95 | 0.04826 | 8.96 | 0.036474 | 17.65 |
| 117.8 | 0.07723 | 0.05218 | 32.44 | 0.07339 | 4.97 | 0.054785 | 29.06 |
| 121.4 | 0.10344 | 0.07364 | 28.81 | 0.10578 | 2.26 | 0.076721 | 25.83 |
| 124.4 | 0.13011 | 0.09897 | 23.93 | 0.13611 | 4.61 | 0.102044 | 21.57 |
| 127.7 | 0.15504 | 0.12731 | 17.89 | 0.15844 | 2.19 | 0.129533 | 16.45 |
| 131 | 0.15498 | 0.15848 | 2.26 | 0.15742 | 1.57 | 0.158447 | 2.24 |
| 133 | 0.02476 | 0.02351 | 5.05 | 0.02352 | 5.01 | 0.023505 | 5.07 |
| 144 | −0.00145 | 0 | 100 | 0 | 100 | 0 | 100 |
| Expectation | 0.0723 | 0.0544 | 0.0718 | 0.0559 | |||
| Deviation | 0.0583 | 0.0506 | 0.0578 | 0.0508 | |||
| Kurtosis | 1.5761 | 2.3619 | 1.5707 | 2.2658 | |||
| Skewness | 0.3274 | 0.7932 | 0.3417 | 0.7420 | |||
| RMS error | 41.07 | 32.74 | 38.48 | ||||
Disclaimer/Publisher’s Note: The statements, opinions and data contained in all publications are solely those of the individual author(s) and contributor(s) and not of MDPI and/or the editor(s). MDPI and/or the editor(s) disclaim responsibility for any injury to people or property resulting from any ideas, methods, instructions or products referred to in the content. |
© 2023 by the author. Licensee MDPI, Basel, Switzerland. This article is an open access article distributed under the terms and conditions of the Creative Commons Attribution (CC BY) license (https://creativecommons.org/licenses/by/4.0/).
Share and Cite
MDPI and ACS Style
Cheng, X.-X. Model Updating for a Continuous Concrete Girder Bridge Using Data from Construction Monitoring. Appl. Sci. 2023, 13, 3422. https://doi.org/10.3390/app13063422
AMA Style
Cheng X-X. Model Updating for a Continuous Concrete Girder Bridge Using Data from Construction Monitoring. Applied Sciences. 2023; 13(6):3422. https://doi.org/10.3390/app13063422
Chicago/Turabian StyleCheng, Xiao-Xiang. 2023. "Model Updating for a Continuous Concrete Girder Bridge Using Data from Construction Monitoring" Applied Sciences 13, no. 6: 3422. https://doi.org/10.3390/app13063422
Note that from the first issue of 2016, this journal uses article numbers instead of page numbers. See further details here.