Abstract
The soil–rock mixture (SRM), as a heterogeneous and discrete geomaterial, can be widely found in nature and may present difficult design and construction issues for structures within or on top of them. Engineers face a difficult problem when determining the mechanical behavior of geomaterials with SRM, especially those with a high volumetric block proportion (VBP). As it is often very difficult to prepare undisturbed and representative samples of these materials. Thus, this paper proposes a novel method that can generate SRM models with a high VBP and produce a block-matrix interface (BMI) around the rock block, which can simulate unwelded SRM in nature. Then, the finite difference method (FDM) is applied to simulate uniaxial compression tests. The conformity of the numerical simulation results with the experimental results shows that the method is reasonable and effective. In addition, the effect of the strength of the BMI, the thickness of the BMI, and the geometrical shape of the rock blocks on the uniaxial compressive strength (UCS) of the SRM are also investigated. The modelling approach proposed in this paper is able to generate BMI in SRMs and enables the effect of the BMI on the SRMs’ properties to be better investigated in numerical simulations. This method can overcome the difficulties of preparing representative and undisturbed experimental cores while saving cost and improving efficiency. Simultaneously, the method proposed in this paper is promising to be extended to three dimensions.
1. Introduction
As a special geological material, the soil–rock mixture (SRM) is a heterogeneous, discrete, and nonlinear loose soil medium system composed of rock blocks with great strength and size, fine-grained soil, and pores [1]. Accordingly, it presents distinct differences in the strength of the rock blocks and the soil. Due to the existence of rock blocks, SRMs generally show unique meso-structural characteristics. Consequently, its physical and mechanical properties are seriously influenced by matrix strength, proportion of block volume, block orientations, block shapes, block sizes, and the distribution of blocks [2,3,4]. As a common material in nature, SRMs dispersed widely in the project construction. Owing to its special structure and different components, SRMs contribute to widespread construction accidents, such as landslides, collapses, and so on. Hence, studying the physical and mechanical properties of the SRMs has significant value in engineering and theoretical significance.
In recent years, scholars at home and abroad have studied the special geological systems of soil and rock mixtures. In terms of physical experiments, two main approaches are often used to study SRMs. The first approach is to receive data by laboratory tests or in-suit tests. Sun et al. investigated the influence of rocks on fracture evolution in SRM by conducting real-time computed tomography (CT) scanning on SRM and pure soil samples under indoor uniaxial compressive experiments [5,6,7,8,9,10,11]. Shan et al. proposed an X-ray CT images-based Discrete element method (DEM) to generate numerical model of the SRM microstructure [11]. Sun et al. analyzed the fracture evolution of the SRM under uniaxial compression test using real-time computed tomography (CT) scanning [12]. Meng et al. developed an open-source software package for heterogeneous material modeling based on digital image processing [13]. Afifipour et al. utilized artificial (physical) model specimens in a laboratory to obtain the mechanical parameters of different rock block proportions (RBP) under uniaxial compressive testing [14]. Apart from uniaxial compressive test, triaxial test is more common. Xu et al. studied how the mechanical properties and failure characteristics of the SRMs can be affected by the rock block content, sample size, and the different grain size distribution on the of the SRMs in triaxial tests [2,15,16]. Wang et al. used a GDS triaxial test system to measure the seepage characteristics of the SRMs [17]. Relative to laboratory tests, Yao et al. conducted in situ shear tests to study the mechanical characteristics of the SRMs [18,19,20]. According to the experimental data, deriving a formula is the other method. Sonmez et al. developed an empirical approach for the determination of the UCS for a volcaniclastic soil–rock mixture depending on the uniaxial compressive test results [21]. Zhang et al. proposed an empirical approach that could predict the shear strength of the SRMs [22].
Nevertheless, challenges are encountered when preparing representative core specimens for laboratory experiments on undisturbed SRM cores, making it extremely challenging to determine the mechanical characteristics of the SRM as a mixture geomaterial, especially for unwelded SRM. With the rapid development of computer technology, many numerical simulation methods have been utilized to investigate the deformation and mechanical properties of the SRMs. Among them, the finite element method (FEM) [8,23,24,25,26] and the discrete element method (DEM) [1,27,28,29,30] are commonly used. Due to these numerical simulation methods, researchers can model SRMs with high volumetric block proportions (VBP), distinct block shapes, and so on. For example, Li et al. [31], Xu et al. [32], and Wang et al. [33] studied the influence of VBP on the mechanical properties of virtual S-RM and pointed out that the mechanical properties of the SRMs are dominated by different components in different VBP ranges. When the VBP is less than 10% to 20%, the shear strength is mainly controlled by soil. When the VBP is over 70%, the shear strength is dominated by rocks. When the VBP ranges from 20% to 70%, the shear strength ranges between soil and rocks [33].
When studying the effect of the VBP of the SRM on its mechanical properties, it is difficult for existing numerical simulation methods to generate models with a high VBP. Afifipour et al. [14] investigated the different mechanical properties of SRMs with a high VBP by performing uniaxial compression tests on artificial specimens. They found that there is a general decreasing trend in uniaxial compressive strength (UCS), Young modulus, and failure strain. In the literature, SRMs are divided into two categories, the above-mentioned SRMs are classified as unwelded SRMs (or cemented SRMs) due to the low block-matrix contact strength. In view of the above finding, we took the strength of block-matrix interface (BMI) into consideration to investigate the decreasing tendency.
Inspired by all of the above studies, this paper proposes a novel mesoscale modeling method for simulating the mechanical properties of the SRMs with random VBP and structures. This modeling method shares the following advantages: easy generation of samples with a high VBP, full consideration of the effect of the BMI, easy change in the particle’s shape, and so on. Then, the numerical simulation software Fast Lagrangian Analysis of Continua (FLAC3D) using the finite difference method (FDM) was used to analyze the mechanical properties of the SRMs.
2. Sample Preparation and Testing Method
According to the procedures of the method proposed in this paper, a flowchart is presented in Figure 1 to depict the detailed processes of numerical simulation. The brief processes can be divided into following steps: (1) Determine the model size; (2) Generate the SRM model according to grading curve; (3) Import into FLAC3D and conduct the numerical simulation; (4) Discuss the impact of different factors on the stress–strain curve of the SRM.
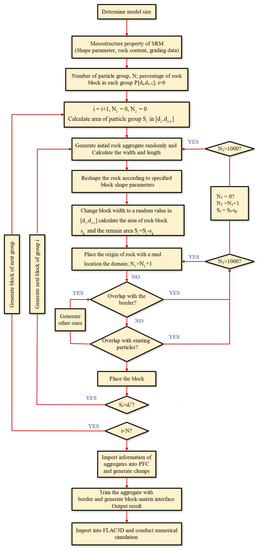
Figure 1.
Flowchart for the generation of random SRM models.
2.1. Model Generation of the SRMs
The model generation of the SRMs is essential in numerical simulations, and the overall mechanical properties of the SRMs are mainly dependent on the shape, VBP, and the thickness of the BMI. Thus, in this work, the significant factors described above must be taken into consideration when generating numerical models. Especially, the effect of the BMI was usually neglected by most scholars in previous studies.
SRMs can generally be viewed as a composite material composed of rock blocks, fine-grained soil, and BMI in the numerical simulation study. Thus, the generation of rock block aggregates is the first step of the model generation of the SRMs. In this study, a clump command provided by the DEM software can be utilized to generate irregular rock block aggregations. A clump is a collection of pebbles that are overlaid and do not deform in relation to one another, exhibiting stiff particle motion. Thus, to simulate rock blocks that obtain greater strength in the SRM model, this approach employs clumps to fill the aggregate templates. Similarly, the rock blocks in SRMs are much stronger and stiffer than the soil matrix; therefore, it is able to simulate rock blocks perfectly using clumps [1].
2.1.1. Irregular Rock Block Aggregate Generation
First of all, the geometries of the aggregate particles need to be generated. Thus, one polygon with random sides will be generated as a boundary of a clump. The method in this study uses a series of random radii and angles in polar coordinates to generate aggregate boundaries based on the Monte Carlo random sampling principle, as shown in Figure 2 [34,35]. Compared with other methods, this method can change the size and shape of an aggregate particle that significantly affects the SRMs mechanical properties via changing radii and angles.
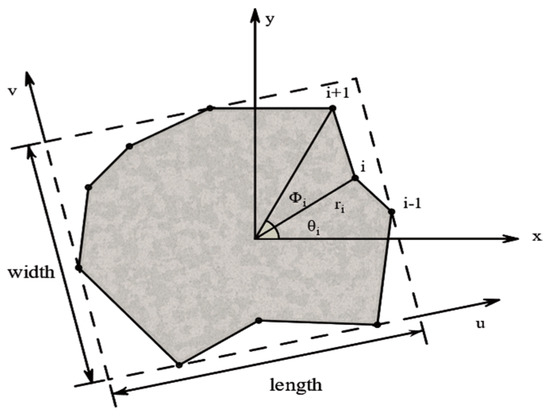
Figure 2.
Illustration of aggregate generation.
2.1.2. Size Distribution
The grading curve is often used to show the relative content of each grain group of rock blocks. Many ideal grading curves can be applied to describe the size distribution of rock blocks. In this paper, the grading curve is given, and the percentage of aggregates whose sizes are in the grading interval of [, ] can be calculated as:
where and are the maximum and the minimum aggregate sizes, respectively.
2.1.3. Generation of Clump and Spatial Location
When finishing the above steps, the next step is to import the file containing the coordinate points of the polygons generated above into the DEM software. Then, the geometry of the aggregate is then set to be used as the boundary of the clump and used as a template for creating the clump. A clump template is not a model object in itself; it serves as a basis for creating clumps in the model with the same shape as the clump template. The facilities to create clumps from clump templates include the ability to rotate, translate, and scale the clumps relative to their template. One can simply replicate a clump from a template. Next, the pebbles are automatically calculated via an approximation of the medial surface of the polygons via the Bubble Pack algorithm of Taghavi [36]. Both convex and concave geometries can be automatically filled via this algorithm in both 2D and 3D. Finally, due to the absolute rigidity of the clumps, all of the clumps will collide freely in the domain until there is no overlap between any two clumps. Then, the rock blocks will redistribute, and the positions of each rock block aggregate such as the coordinates of the vertices and the center of the aggregates will be recorded and output.
To consider the impact of the aggregates coinciding with the boundaries, in this paper, the border effect is also taken into account. A spatial location algorithm, which is based on the traditional method, is employed.
2.2. Generation of the BMI
In most previous studies on SRM, the BMI was neglected, thus the influence of the strength of the BMI on the mechanical properties was ignored. To investigate the cementation effect, a novel BMI generation algorithm based on the Minkowski sum is utilized to wrap a shell around the aggregate. Given two sets of points A and B through a random generation of polygons in Euclidean space, the Minkowski sum can be described as . This algorithm is equivalent to wrapping a shell around the original particle without changing its shape and orientation [37].
Thus, the space between two figures can be viewed as BMI and endowed with different parameters in a numerical simulation to discuss the cementation effect. A treated aggregate can be seen in Figure 3.
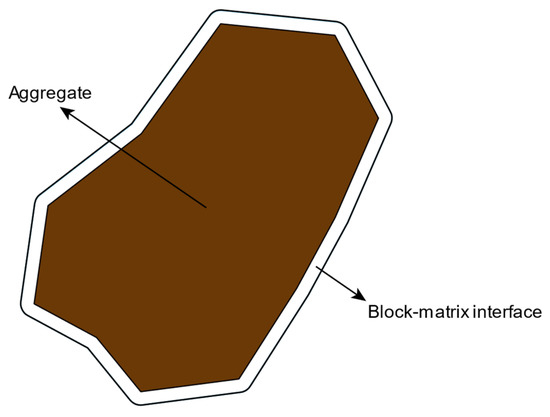
Figure 3.
A treated aggregate with block-matrix interface.
To show the whole procedures of model generation, a sample with a VBP of 60% is presented in Figure 4. (a) Generate the boundary of rock block aggregates according to the grading curve; (b) Create clumps via an approximation of the medial surface of the polygons by DEM; (c) Consider the border effect of the SRM and redistribute the aggregates; (d) Trim the geometry outside the domain using a preprocessing tool; (e) Generate the block-matrix interface based on Minkowski sum; (f) Generation of numerical mesh model.
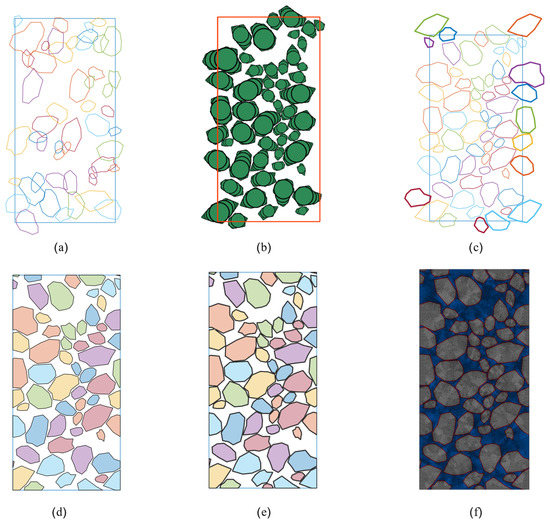
Figure 4.
SRM model with VBP of 60%: (a) Generate the boundary of rock block aggregates; (b) Create clumps; (c) Consider the border effect of the SRM and redistribute the aggregates; (d) Trim the geometry; (e) Generate the block-matrix interface; (f) Generation of numerical mesh model.
3. Results
3.1. Numerical Simulation Model Generation
To investigate the change in the SRM strength with increasing VBP, this paper refers to the laboratory test data by Afifipour et al. [14]. In Afifipour’s paper, there are two kinds of SRM samples with different sizes (150 × 300 mm and 100 × 200 mm) in order to study the possible scale effect on the mechanical behavior of the SRMs. Consequently, the result of this laboratory test shows that there is no significant scale effect on SRMs and confirms Medley’s perspective that the SRM is a scale-independent material based on some field measurements performed on Franciscan mélange [32]. Thus, in this paper, one specimen of the SRM with the size (100 × 200 mm) is generated. The grading curve in Afifipour’s indoor test is applied for this paper, the particle size distribution of rock block aggregates is shown in Table 1, and the grading curve is presented in Figure 5.

Table 1.
The particle size distribution of rock block aggregates.
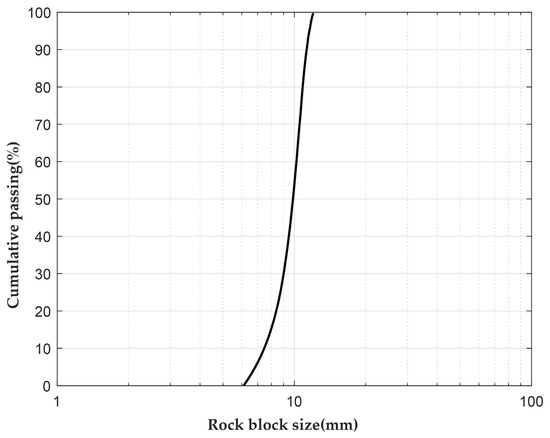
Figure 5.
Size distribution of rock particles prepared for numerical simulation.
According to the above grading curve, rock block aggregate size was set to 6.0 to 12 mm. Five models with a VBP of 50%, 55%, 60%, 65% and 70% were generated, shown in Figure 6.
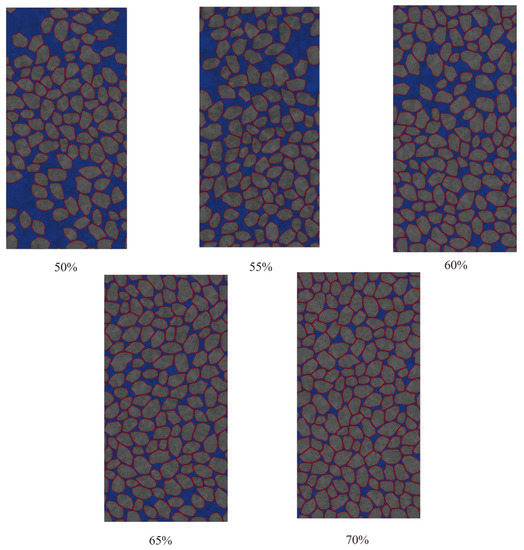
Figure 6.
SRM models with different VBP ranging from 50% to 70%.
3.2. Numerical Simulation of Uniaxial Compression Test with FLAC3D
When the pre-processing of the SRM models is completed, the data of models is going to be imported into FLAC3D to simulate the uniaxial compression test. Some key physical and mechanical parameters of the soil and rock are shown in Table 2. In SRMs, the mechanical characteristics of the rock block, matrix, and BMI are often quite complicated. The rock block is typically the strongest and has a strength ratio to the matrix that is at least larger than two [38]. The matrix is stronger than the junction of the block and matrix but has a lower compression strength than the rock block. When considering the BMI in unwelded SRMs, the strength ratio to the matrix is frequently less than one [39]. Most current studies ignore BMI in SRMs. Evidently, both the presence and strength of the BMI have a great influence on the mechanical properties and failure mode of the SRMs. Due to the lack of relevant parameters in this regard, this paper refers to concrete with similar structure and properties of the SRMs [40]. In concrete, the strength of the interfacial transition zone (ITZ) is usually 0.1–0.9 of the matrix [41]. Therefore, to simulate the cementation properties of the BMI, this paper applied one fifth of the strength parameters of soil to BMI. The result of this numerical simulation is compared with the experimentally obtained UCS value [14]. Meanwhile, the corresponding stress–strain curve is investigated to validate the accuracy and reliability of the simulation in this paper. As shown in the stress–strain curve (Figure 7), the stress–strain curve of numerical simulation is in a good agreement with that of the experimental test, especially in the pre-peak stage. The result clearly indicates that the method in this paper can make a rather reasonable simulation of the mechanical properties of the SRMs under uniaxial compression.
Table 2.
Material parameters of mesoscale concrete model.
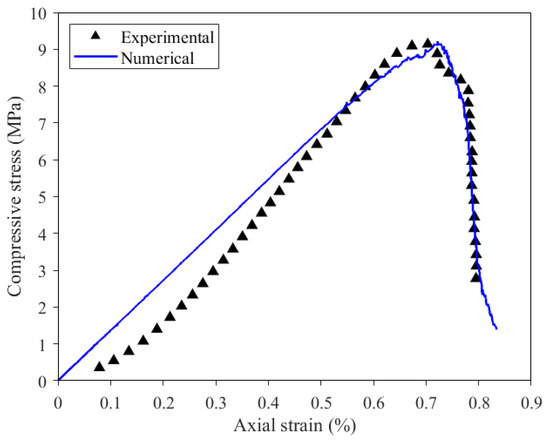
Figure 7.
Stress–strain curves from the experiment and the numerical simulation.
In this paper, five SRM models with a 5% increase in VBP from 50% to 70% each were used for the numerical simulation of uniaxial compression tests. In order to avoid the influence of mechanical parameters on the numerical simulation results, a pure matrix model consisting of soil was generated separately, and a uniaxial compression test was performed to obtain the UCS value of the pure matrix model. Then, this paper utilized the ratio of the UCS value of the SRM model to the UCS value of the pure matrix model to describe the uniaxial compressive strength of the SRM.
An overall declining relationship between the UCS of the SRMs and VBP can be evidently observed from the results. This declining trend can better demonstrate the influence of VBP on uniaxial compressive strength of unwelded SRMs in experiment conducted by Afifipour et al. [14], as shown in Figure 8. However, the decrease in UCS value with VBP from 50% to 55% is relatively flat, then, the UCS value will decrease relatively quickly with a similar trend as the VBP increases. This phenomenon can be explained by the fourth rule related to the relationship between the strength and VBP, which was summarized by Sonmez et al. [42]. As described by the fourth rule, between VBP = 0% and VBP = 100%, the UCSSRM drops from the UCSmatrix to zero since interlocking contact between blocks is unquestionably believed to be nearly nonexistent or extremely low for VBP > 60%.
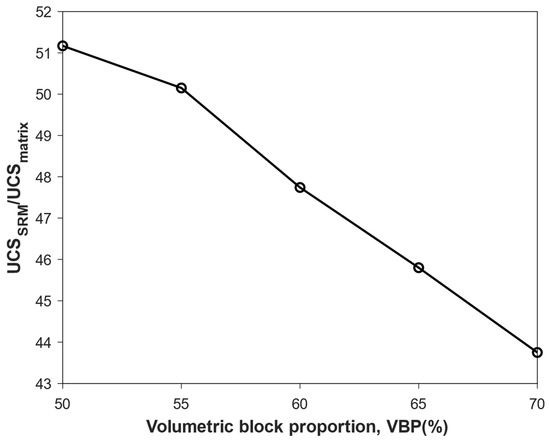
Figure 8.
UCS of the SRM models with different VBP ranging from 50% to 70%.
Simultaneously, in this paper, the simulated findings are compared with the empirical formula to see if the simulated declining trend is plausible, shown in Figure 9. The empirical equation [42] can be described as follows:
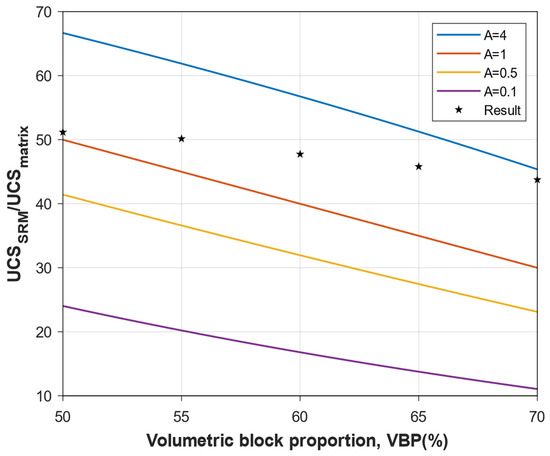
Figure 9.
Comparison chart of simulation results and empirical prediction methods.
UCSbimrock and UCSmatrix are the uniaxial compressive strength of bimrock (block-in-matrix-rocks) and matrix, respectively. In this paper, bimrock is replaced by the concept of the SRM. “A” is a constraining variable that reflects the bond (or contact) strength between blocks and matrix. As shown in the figure, the results of the simulation can fit the empirical equation. As mentioned by Sonmez et al. [42], one may predict the UCS of a SRM by using the UCS of a matrix as a scaling parameter. According to Equation (2) and Figure 9, the normalized UCS of the SRM (relative to that of the matrix) decreases when volumetric block proportions rise. The value of “A” in the proposed empirical equation is controlled by the contact strength between the blocks and the matrix. Unwelded block and matrix contact strength is primarily influenced by the angularity and roughness of blocks and kind of matrix.
4. Analysis of Effect Factors
Numerous factors, such as the strength of the BMI, the thickness of the BMI, and the aggregate shape, can influence the UCS of the SRMs model, and the following sections will discuss these factors in detail. For the convenience of the following discussion, this paper compares SRMs owning VBP in 50%, 60%, and 70% to figure out how these factors influence the UCS value of the SRMs.
4.1. Effect of the Strength of Block-Matrix Interface
As the weakest zone connecting rock blocks and matrix, the BMI plays an indispensable role in directly affecting the strength of the SRMs. Nevertheless, it is challenging to identify the strength parameters of the BMI and manage its strength in laboratory experiments due to the tiny size of the cementing surface. Therefore, this paper assigns different strength parameters to BMI to simulate the effect of its strength on the uniaxial compressive strength of the SRMs from the perspective of numerical simulation. In the traditional numerical simulation of concrete, the different ratio value of the strength between the interface transition zone and mortar were applied [34]. Therefore, the ratio of strength parameters between the BMI and matrix was also adopted in this paper to simulate different BMI strengths.
As presented in Figure 10, with different ratio values of 10%, 20%, 30%, and 40%, the UCS of the SRM is compared. In general, all four groups of models satisfy the above-mentioned law of the effect of VBP on strength (i.e., the higher the volume fraction the lower the strength). Meanwhile, as we can observe that the lower the strength of the cemented surface, the lower the UCS of the SRM at the corresponding volume fraction. From each set of results, the decreasing trend in the UCS in this group of models tends to level off as the strength of the cemented surface increases.
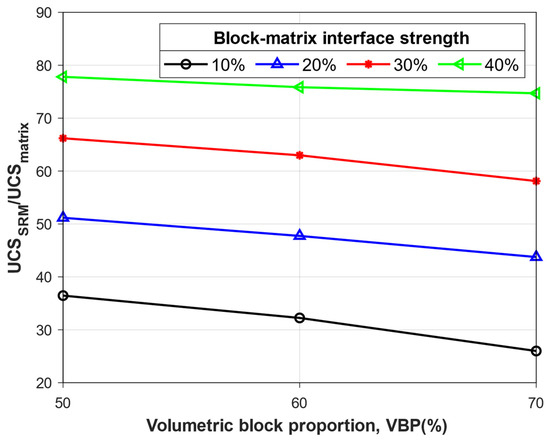
Figure 10.
The trend in UCS of the SRM with different BMI strength.
4.2. Effect of the Thickness of Block-Matrix Interface
Since the effect of BMI on the strength of the SRM is crucial, in addition to the above discussion of the effect of BMI strength on the overall strength, this paper also considers the effect of the thickness of the cemented surface on the UCS of the SRM. Taking advantage of the method of model generation in this paper, three sets of models with different thicknesses of BMI are generated. The thickness of the BMI of these three groups of models is 0.5 mm, 0.6 mm, and 0.7 mm, respectively, models with a VBP of 60%, as presented in Figure 11. While varying the thickness of the BMI, this paper also keeps the positions of rock blocks fixed as a way of avoiding the effect of stone distribution on the strength characteristics.
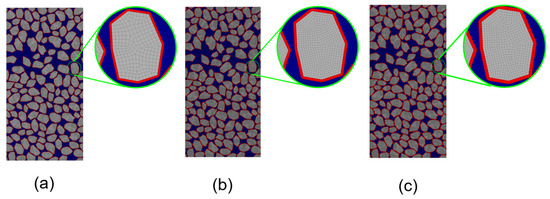
Figure 11.
Models with VBP of 60% with different BMI thickness: (a) 0.5 mm; (b) 0.6 mm; (c) 0.7 mm.
Overall, the general tendency of each group is that the UCS declines with the growth of the VBP, as shown in Figure 12. Then, it can be observed that the UCS of the SRM decreases with the increase in the thickness of the BMI. At the same time, it can be clearly shown that the decreasing trend slows down with increasing thickness. It is noteworthy that the overall decline in strength is more significant than before in the second and third set of models when VBP increases from 60% to 70%. As mentioned above, the rule proposed by Sonmez et al. [33] that block-to-block interlocking contacts are definitely assumed to be almost absent or very few can explain this tendency with more than 60% of VBP.
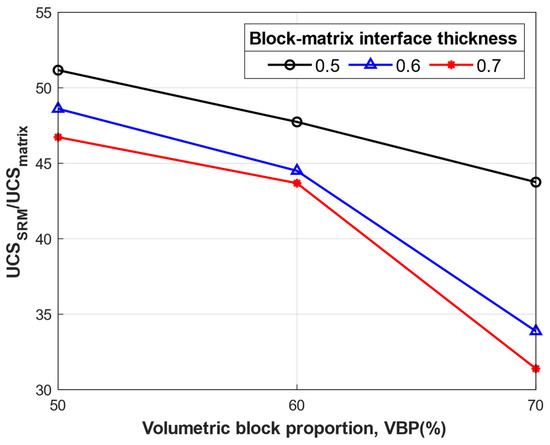
Figure 12.
The trend in UCS of the SRM with different BMI thickness.
4.3. Effect of the Geometrical Shape of Rock Blocks
In SRM, the rock blocks play a crucial role of skeleton which is not a negligible factor affecting the strength of the SRM. In addition to the influence of the features of the BMI on the strength of the SRM, the shape of rock block is also a critical factor that has an impact on the strength of the SRM. Thus, the effect of different rock block shapes on the overall strength of the SRM deserves to be investigated. Except polygons, two other regular and realistic shapes of rock block—circle and oval—are also taken into consideration in this paper.
As clearly shown in Figure 13, the plastic zones of the SRM models with various geometrical block shapes under different volume fractions are compared, when each model is eventually damaged and cannot withstand the pressure. It is clear that the overall plastic zones of the three types of models are located on the BMI around the rock blocks, with overall plastic zones occurring in parts of the soil.
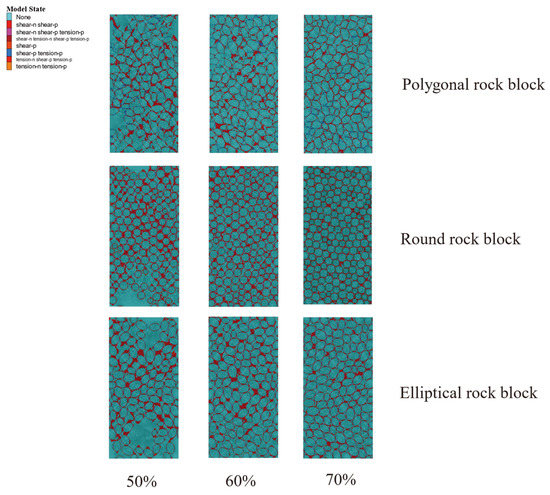
Figure 13.
Plasticity zones for models of different VBP with distinct block shapes.
Then, the UCS of models with three different types of geometrical shapes is compared in Figure 14. It can be easily observed that the general trend in the three groups of models is down as VBP increases. In the meantime, when comparing the same volume fractions from different groups, it is evident that the models with polygonal rock blocks are the strongest, with ellipses coming in second and rounds coming in last. Additionally, from the polygonal to the elliptical group, the decrease in UCS is significant while slight from the elliptical to the round groups.
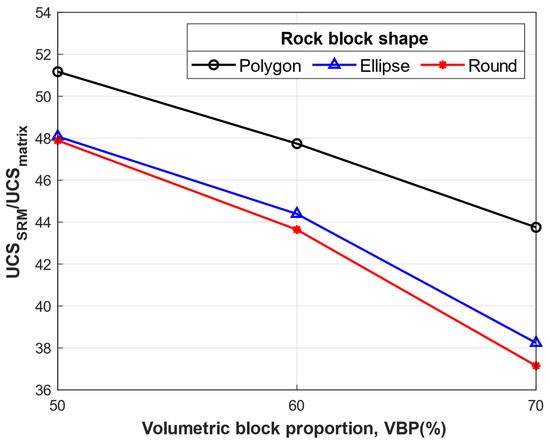
Figure 14.
The trend in UCS of the SRM with different shapes of rock block.
5. Conclusions
Using a unique model generation technique, this paper offers numerical simulations of uniaxial compression experiments for SRMs with various high-volume fractions, having varying BMI strengths, BMI thicknesses, and rock block shapes. The above discussions lead to some conclusions as follows:
(1) Due to the convenience of the model generated in this paper, this paper takes the weakest zones (BMI) into account in the modeling and is able to set the thickness of the BMI, which are ignored by many numerical simulation studies. The variation in the UCS for SRMs with a high VBP and BMI is investigated in this paper. The BMI, the weakest region in the SRM, likewise, rises as VBP does, which is represented in the strength characteristics of the SRM as the UCS falls as the VBP rises. Furthermore, when the VBP exceeds 60%, the UCS of the SRM drops even more significantly as block-to-block interlocking contacts are definitely assumed to be almost absent or very few.
(2) As the weakest zones, the effect of the characteristics of the BMI is also taken into account. The overall UCS of the SRM increases with increasing BMI strength, but, at the same time, its decreasing trend levelled off with increasing volume fraction in each group. Meanwhile, a study of thickness, another characteristic of the BMI, showed that the overall strength of the SRM decreases as the thickness of the BMI increases, but the downward trend also flattens out.
(3) Considering different rock block shapes, this paper finds that the SRM with polygonal rock blocks have the largest UCS for the same VBP, followed by ellipse, and, finally, round, with not much difference between round and ellipse.
It is worth noting that this paper takes BMI into account in numerical simulations, which is the weakest zone in SRMs. Furthermore, the effect of the thickness of the BMI on the overall uniaxial compressive strength is investigated. Simultaneously, the method proposed in this paper is promising to be extended to three dimensions.
Author Contributions
Conceptualization, G.Z.; Methodology, Y.D.; Software, G.Z.; Formal analysis, Y.D.; Data curation, Y.D.; Writing—original draft, Y.D.; Writing—review & editing, G.Z.; Visualization, Y.C.; Supervision, Y.C. All authors have read and agreed to the published version of the manuscript.
Funding
This study was financially supported by the National Natural Science Foundation of China (Grant No. 51709089).
Acknowledgments
The authors would like to thank the valuable suggestions from Chao Wang and Tianbin Xiang.
Conflicts of Interest
The authors declare no conflict of interest.
References
- Gao, W.; Yang, H.; Wang, L.; Hu, R. Numerical simulations of the soil–rock mixture mechanical properties considering the influence of rock block proportions by pfc2d. Materials 2021, 14, 5442. [Google Scholar] [CrossRef] [PubMed]
- Xu, W.-J.; Zhang, H.-Y. Research on the effect of rock content and sample size on the strength behavior of soil-rock mixture. Bull. Eng. Geol. Environ. 2021, 80, 2715–2726. [Google Scholar] [CrossRef]
- Medley, E.; Sanz, P. Characterization of Bimrocks (Rock/Soil Mixtures) with Application to Slope Stability Problems. In Proceedings of the Eurock 2004 and Geomechanics Colloquium, Salzburg, Austria, 7–9 October 2004. [Google Scholar]
- Medley, E.; Goodman, R.E. Estimating the block volumetric proportions of melanges and similar block-in-matrix rocks (bimrocks). In Proceedings of the 1st North American Rock Mechanics Symposium, Austin, TX, USA, 1–3 June 1994; OnePetro: Richardson, TX, USA, 1994. [Google Scholar]
- Sun, X.; Li, X.; Mao, T.; Zheng, B.; Wu, Y.; Li, G. Fracture evolution analysis of soil-rock mixture in contrast with soil by CT scanning under uniaxial compressive conditions. Sci. China Technol. Sci. 2021, 64, 2771–2780. [Google Scholar] [CrossRef]
- Meng, Q.-X.; Wang, H.L.; Xu, W.Y.; Zhang, Q. A coupling method incorporating digital image processing and discrete element method for modeling of geomaterials. Eng. Comput. 2018, 35, 411–431. [Google Scholar] [CrossRef]
- Ren, W.; Yang, Z.; Sharma, R.; Zhang, C.; Withers, P.J. Two-dimensional X-ray CT image based meso-scale fracture modelling of concrete. Eng. Fract. Mech. 2015, 133, 24–39. [Google Scholar] [CrossRef]
- Xu, W.-J.; Yue, Z.-Q.; Hu, R.-L. Study on the mesostructure and mesomechanical characteristics of the soil–rock mixture using digital image processing based finite element method. Int. J. Rock Mech. Min. Sci. 2008, 45, 749–762. [Google Scholar] [CrossRef]
- Ju, Y.; Sun, H.; Xing, M.; Wang, X.; Zheng, J. Numerical analysis of the failure process of soil–rock mixtures through computed tomography and PFC3D models. Int. J. Coal Sci. Technol. 2018, 5, 126–141. [Google Scholar] [CrossRef]
- Wang, Y.; Li, C.; Hu, Y. Use of X-ray computed tomography to investigate the effect of rock blocks on meso-structural changes in soil-rock mixture under triaxial deformation. Constr. Build. Mater 2018, 164, 386–399. [Google Scholar] [CrossRef]
- Shan, P.; Lai, X. Mesoscopic structure PFC∼ 2D model of soil rock mixture based on digital image. J. Vis. Commun. Image Represent. 2019, 58, 407–415. [Google Scholar] [CrossRef]
- Sun, X.; Li, X.; Zheng, B.; He, J.; Mao, T. Study on the progressive fracturing in soil and rock mixture under uniaxial compression conditions by CT scanning. Eng. Geol. 2020, 279, 105884. [Google Scholar] [CrossRef]
- Meng, Q.-X.; Xu, W.-Y.; Wang, H.-L.; Zhuang, X.-Y.; Xie, W.-C.; Rabczuk, T. DigiSim—An Open Source Software Package for Heterogeneous Material Modeling Based on Digital Image Processing. Adv. Eng. Softw 2020, 148, 102836. [Google Scholar] [CrossRef]
- Afifipour, M.; Moarefvand, P. Mechanical behavior of bimrocks having high rock block proportion. Int. J. Rock Mech. Min. Sci. 2014, 65, 40–48. [Google Scholar] [CrossRef]
- Zhang, H.-Y.; Xu, W.-J.; Yu, Y.-Z. Triaxial tests of soil–rock mixtures with different rock block distributions. Soils Found. 2016, 56, 44–56. [Google Scholar] [CrossRef]
- Qian, J.; Yao, Y.; Li, J.; Xiao, H.; Luo, S. Resilient properties of soil-rock mixture materials: Preliminary investigation of the effect of composition and structure. Materials 2020, 13, 1658. [Google Scholar] [CrossRef] [PubMed]
- Wang, P.; Zhang, X. Experimental Study on Seepage Characteristics of a Soil-Rock Mixture in a Fault Zone. Fluid Dyn. Mater. Process. 2022, 18, 271–283. [Google Scholar] [CrossRef]
- Xu, W.-J.; Hu, R.-L.; Tan, R.-J. Some geomechanical properties of soil–rock mixtures in the Hutiao Gorge area, China. Geotechnique 2007, 57, 255–264. [Google Scholar] [CrossRef]
- Coli, N.; Berry, P.; Boldini, D. In situ non-conventional shear tests for the mechanical characterisation of a bimrock. Int. J. Rock Mech. Min. Sci. 2011, 48, 95–102. [Google Scholar] [CrossRef]
- Zhang, Z.-L.; Xu, W.-J.; Xia, W.; Zhang, H.-Y. Large-scale in-situ test for mechanical characterization of soil–rock mixture used in an embankment dam. Int. J. Rock Mech. Min. Sci. 2016, 86, 317–322. [Google Scholar] [CrossRef]
- Sonmez, H.; Gokceoglu, C.; Medley, E.; Tuncay, E.; Nefeslioglu, H. Estimating the uniaxial compressive strength of a volcanic bimrock. Int. J. Rock Mech. Min. Sci. 2006, 43, 554–561. [Google Scholar] [CrossRef]
- Zhang, Z.; Sheng, Q.; Fu, X.; Zhou, Y.; Huang, J.; Du, Y. An approach to predicting the shear strength of soil-rock mixture based on rock block proportion. Bull. Eng. Geol. Environ. 2020, 79, 2423–2437. [Google Scholar] [CrossRef]
- Gao, W.-W.; Gao, W.; Hu, R.-L.; Xu, P.F.; Xia, J.G. Microtremor survey and stability analysis of a soil-rock mixture landslide: A case study in Baidian town, China. Landslides 2018, 15, 1951–1961. [Google Scholar] [CrossRef]
- Napoli, M.L.; Barbero, M.; Ravera, E.; Scavia, C. A stochastic approach to slope stability analysis in bimrocks. Int. J. Rock Mech. Min. Sci. 2018, 101, 41–49. [Google Scholar] [CrossRef]
- Lei, G.; Guo, P.; Hua, F.; Gong, X.; Luo, L. Observed performance and FEM-based parametric analysis of a top-down deep excavation in soil-rock composite stratum. Geofluids 2021, 2021, 6964940. [Google Scholar] [CrossRef]
- Yang, Y.; Sun, G.; Zheng, H. Stability analysis of soil-rock-mixture slopes using the numerical manifold method. Eng. Anal. Bound. Elem. 2019, 109, 153–160. [Google Scholar] [CrossRef]
- Cundall, P.A.; Strack, O.D. A discrete numerical model for granular assemblies. Geotechnique 1979, 29, 47–65. [Google Scholar] [CrossRef]
- Wang, S.; Shi, C.; Xu, W.; Wang, H.L.; Zhu, Q. Numerical direct shear tests for outwash deposits with random structure and composition. Granul. Matter 2014, 16, 771–783. [Google Scholar] [CrossRef]
- Pierce, M.; Mas Ivars, D.; Sainsbury, B. Use of synthetic rock masses (SRM) to investigate jointed rock mass strength and deformation behavior. In Proceedings of the International Conference on Rock Joints and Jointed Rock Masses, Tucson, AZ, USA, 7–8 January 2009. [Google Scholar]
- Yao, Y.; Li, J.; Ni, J.; Liang, C.; Zhang, A. Effects of gravel content and shape on shear behaviour of soil-rock mixture: Experiment and DEM modelling. Comput. Geotech. 2022, 141, 104476. [Google Scholar] [CrossRef]
- Li, C.-S.; Zhang, D.; Du, S.-S.; Shi, B. Computed tomography based numerical simulation for triaxial test of soil–rock mixture. Comput. Geotech. 2016, 73, 179–188. [Google Scholar] [CrossRef]
- Xu, W.-J.; Hu, L.-M.; Gao, W. Random generation of the meso-structure of a soil-rock mixture and its application in the study of the mechanical behavior in a landslide dam. Int. J. Rock Mech. Min. Sci. 2016, 86, 166–178. [Google Scholar] [CrossRef]
- Wang, S.; Li, Y.; Gao, X.; Xue, Q.; Zhang, P.; Wu, Z. Influence of volumetric block proportion on mechanical properties of virtual soil-rock mixtures. Eng. Geol. 2020, 278, 105850. [Google Scholar] [CrossRef]
- Wang, Z.; Kwan, A.; Chan, H. Mesoscopic study of concrete I: Generation of random aggregate structure and finite element mesh. Comput. Struct. 1999, 70, 533–544. [Google Scholar] [CrossRef]
- Meng, Q.; Wang, H.; Xu, W.; Cai, M. A numerical homogenization study of the elastic property of a soil-rock mixture using random mesostructure generation. Comput. Geotech. 2018, 98, 48–57. [Google Scholar] [CrossRef]
- Taghavi, R. Automatic clump generation based on mid-surface. In Proceedings of the 2nd International FLAC/DEM Symposium, Melbourne, Australia, 14–16 February 2011. [Google Scholar]
- Alonso-Marroquín, F.; Wang, Y. An efficient algorithm for granular dynamics simulation with complex-shaped objects. arXiv 2008, arXiv:08040474. [Google Scholar] [CrossRef]
- Sonmez, H.; Gokceoglu, C.; Tuncay, E.; Medley, E.W.; Nefeslioglu, H.A. Relationships between volumetric block proportions and overall UCS of a volcanic bimrock. Felsbau Rock Soil Eng. 2004, 22, 27–34. [Google Scholar]
- Sonmez, H.; Kasapoglu, K.E.; Coskun, A.; Tunusluoglu, C.; Medley, E.W.; Zimmerman, R.W. A Conceptual Empirical Approach for the Overall Strength of Unwelded Bimrocks. In ISRM Regional Symposium—EUROCK 2009; OnePetro: Richardson, TX, USA, 2009; ISRM-EUROCK-2009-2055. [Google Scholar]
- Meng, Q.; Xue, H.; Song, H.; Zhuang, X.; Rabczuk, T. Rigid-Block DEM Modeling of Mesoscale Fracture Behavior of Concrete with Random Aggregates. J. Eng. Mech. 2023, 149, 04022114. [Google Scholar] [CrossRef]
- Jin, L.; Zhang, R.; Du, X. Computational homogenization for thermal conduction in heterogeneous concrete after mechanical stress. Constr. Build. Mater. 2017, 141, 222–234. [Google Scholar] [CrossRef]
- Kalender, A.; Sonmez, H.; Medley, E.; Tunusluoglu, C.; Kasapoglu, K. An approach to predicting the overall strengths of unwelded bimrocks and bimsoils. Eng. Geol. 2014, 183, 65–79. [Google Scholar] [CrossRef]


Disclaimer/Publisher’s Note: The statements, opinions and data contained in all publications are solely those of the individual author(s) and contributor(s) and not of MDPI and/or the editor(s). MDPI and/or the editor(s) disclaim responsibility for any injury to people or property resulting from any ideas, methods, instructions or products referred to in the content. |
© 2023 by the authors. Licensee MDPI, Basel, Switzerland. This article is an open access article distributed under the terms and conditions of the Creative Commons Attribution (CC BY) license (https://creativecommons.org/licenses/by/4.0/).