Article

Performance Analysis of a PEMFC-Based Grid-Connected Distributed Generation System

1
Department of Electrical-Electronics Engineering, Faculty of Technology, Marmara University, Istanbul 34854, Turkey
2
College of Electrical Engineering, Zhejiang University, Hangzhou 310027, China
*
Author to whom correspondence should be addressed.
Appl. Sci. 2023, 13(6), 3521; https://doi.org/10.3390/app13063521
Submission received: 26 January 2023 / Revised: 28 February 2023 / Accepted: 7 March 2023 / Published: 9 March 2023
(This article belongs to the Special Issue Advancing Grid-Connected Renewable Generation Systems 2021-2022)

Abstract

:
Less energy consumption and more efficient use of renewables are among the sustainable energy targets of modern societies. The essential activities to be achieved under these objectives are to increase distributed generation (DG) structures’ applicability. DG systems are small-scale versions of the traditional power grid; they are supported by micro turbines, photovoltaics (PV) modules, hydrogen fuel cells, wind turbines, combined heat and power systems, and energy storage units. The aim of this research is to detail the performance analysis of a proton-exchange membrane fuel cell (PEMFC)-based grid-connected distributed generation system with the help of empirical calculations. To this end, we aimed to establish the system and analyze the performance of the reliable operation of the system with experimental verifications. The findings demonstrate how much power can be generated annually, through real meteorological data, to dispatch to constantly variable loads. While 53.56% of the total energy demand is met by the utility grid, 46.44% of the demand is met by the produced energy i.e., from the DG. The PEMFC-based DG system analyzed in detail in this study was located at Marmara University. According to the results of the performance analysis, significant points of this study will be highlighted to assist the researchers working in this field. Our results are encouraging and can be certified by a larger sample size with neat weather conditions in terms of the percentage of procurement of energy.

1. Introduction

All technological developments have emerged in line with specific needs. Scientists, researchers, engineers, and inventors seek solutions to the problems encountered while working on meeting the needs of people. In response to the problems faced by traditional grids, researchers and scientists have agreed on the need for modernization of traditional systems. The main problems encountered in traditional grids are transmission losses and energy security due to the transfer of the generated energy to loads that are kilometers away. According to the U.S. Department of Energy, modular, small-scale, on-grid, or off-grid systems, consisting of wind turbines, photovoltaic (PV) modules, hydrogen fuel cells, and energy storage units that provide near-load installation, are considered distributed generation (DG) systems [1]. DG systems are able to continue operating during blackouts, which allows flexible and efficient electrical energy distribution with an integration of renewable energy. DGs are designed for small and medium-sized electric power grids to provide energy for dynamic load groups such as organized industrial sites, research and development centers, university campuses, and technoparks [2].
Many definitions are used for DG in the literature. The definition of the nominal value of each distributed power station also differs depending on the country. Due to the variations when defining DG, the following parameters must be determined: the power location area, the capacity of DG, the used technology, and the operation mode. DG requires efficient and cost-effective integration with the existing grid [3]. It can be presumed that the DG is a flexible energy generation system that can operate either connected or independent from the grid, providing installation close to the load groups. This is operated conveniently for flexible and dynamic load groups such as university campuses, educational institutions, and research and development centers. In [4], the design and implementation of a virtual laboratory for microgrids with renewable-based DGs is proposed to realize innovative courses using LabVIEW, Microsoft, and Simulink. That virtual laboratory is presented with the objectives of scalability, interaction, maintainability, and fast response time for a microgrid structure renewable energy sources. Similarly, in [5], lead acid energy storage system technology is used to address cold ambient temperatures using a standalone wind–PV-based DG system. The technical and economic performance of some alternative systems exploiting renewable energy, such as heat pumps and a PV plant, is presented in [6], showing promising energy savings outputs compared to the traditional electrical grids and storage.
In [7], the authors presented the design and implementation of a microgrid teaching laboratory whose structure consists of a wind turbine, PV, battery bank, and DC/DC and DC/AC converters for dispatching the energy from sources and the utility grid to the load side. The design, implementation, and operation of an education laboratory-scale microgrid facilitate the use of renewable energy, which is a crucial improvement in the awareness of green–clean energy technology. Apart from this approach, [8] proposes the implementation of a single-controllable DG structure in the engineering school of the Federal University of Minas Gerais using commercial devices.
Although DGs provide flexibility in energy management, the energy production capacities of the wind turbine and PV modules depends largely on meteorological conditions. Therefore, in the absence of sufficient wind and sun, a third supporting energy generation system is needed. In this study, to use the potential of renewables, a PV, wind, and hydrogen fuel cell energy storage-based hybrid power system is established. The hydrogen fuel cell stack is utilized as a back-up power generation system based on the relevant literature. The hydrogen used by the fuel cell is produced by the electrolyzer operating with the energy produced by renewable energy sources. This ensures a completely clean and sustainable energy conversion [9]. In this study, detailed performance analysis of the proton exchange membrane fuel cell (PEMFC)-based grid-connected DG system is established and analyzed at Marmara University, Faculty of Technology, Istanbul, Turkey.
The rest of the paper is organized as follows: first, DG case studies at different universities are presented in brief. The next section outlines the factors that need to be set up for DG system design in an overview of hybrid microgrid systems. In this section, each component is examined in detail, and its effectiveness is evaluated. The next section provides discussion points on the DG system design, challenges, and operation. The conclusions remarks are presented in the last section to finalize the paper.

2. DG Case Studies at World Universities

One of the best examples of a DG system on a university campus is at the University of California, San Diego (UCSD). The system has an installed capacity of 42 MW and meets 92% of the annual electricity demands of UCSD. An upgraded 22 kW prototype of a concentrated PV system is installed on the UCSD campus, including energy purchase agreements. This green university campus can be assumed to be an illustration of a “lab to market” model. UCSD has been further aiming to increase the utilization of PV production by integrating an energy storage system [10,11]. Another example of a DG system is located at the Illinois Institute of Technology (IIT). This system includes 4 MW gas turbine, wind turbines, and PV modules [12]. A DG case study at Princeton University consists of a 15 MW gas turbine and a 4.5 MW PV plant [13].
The DG system installed at Westlakes Campus of Central Lancashire University in England consists of a 5 kW wind turbine, a 20 kW PV system, a 21.6 kW heat pump, and a 6 kW solar thermal power system. For increasing renewable-based generation, enhancing efficiency, and reducing the energy costs of the Lindow Building of the University of Central Lancashire at its Westlakes Campus, a microgrid system is operated [14]. At the campus of Genoa University in Italy, PV modules, a geothermal heat pump, thermal solar collectors, and a wind turbine on the rooftop of the faculty building are used for power generation. The total energy consumption and production of the centers are monitored in real time to be able to analyze the beneficial effects [15].
In addition to these universities, Hangzhou Dianzi University in China, the University of Nottingham in the UK, Chiang Mai Rajabhat University in Thailand, Technical University of Denmark, Berkeley Lab and New York University in the US have small and medium-scale capacity DG systems [16,17,18,19,20].

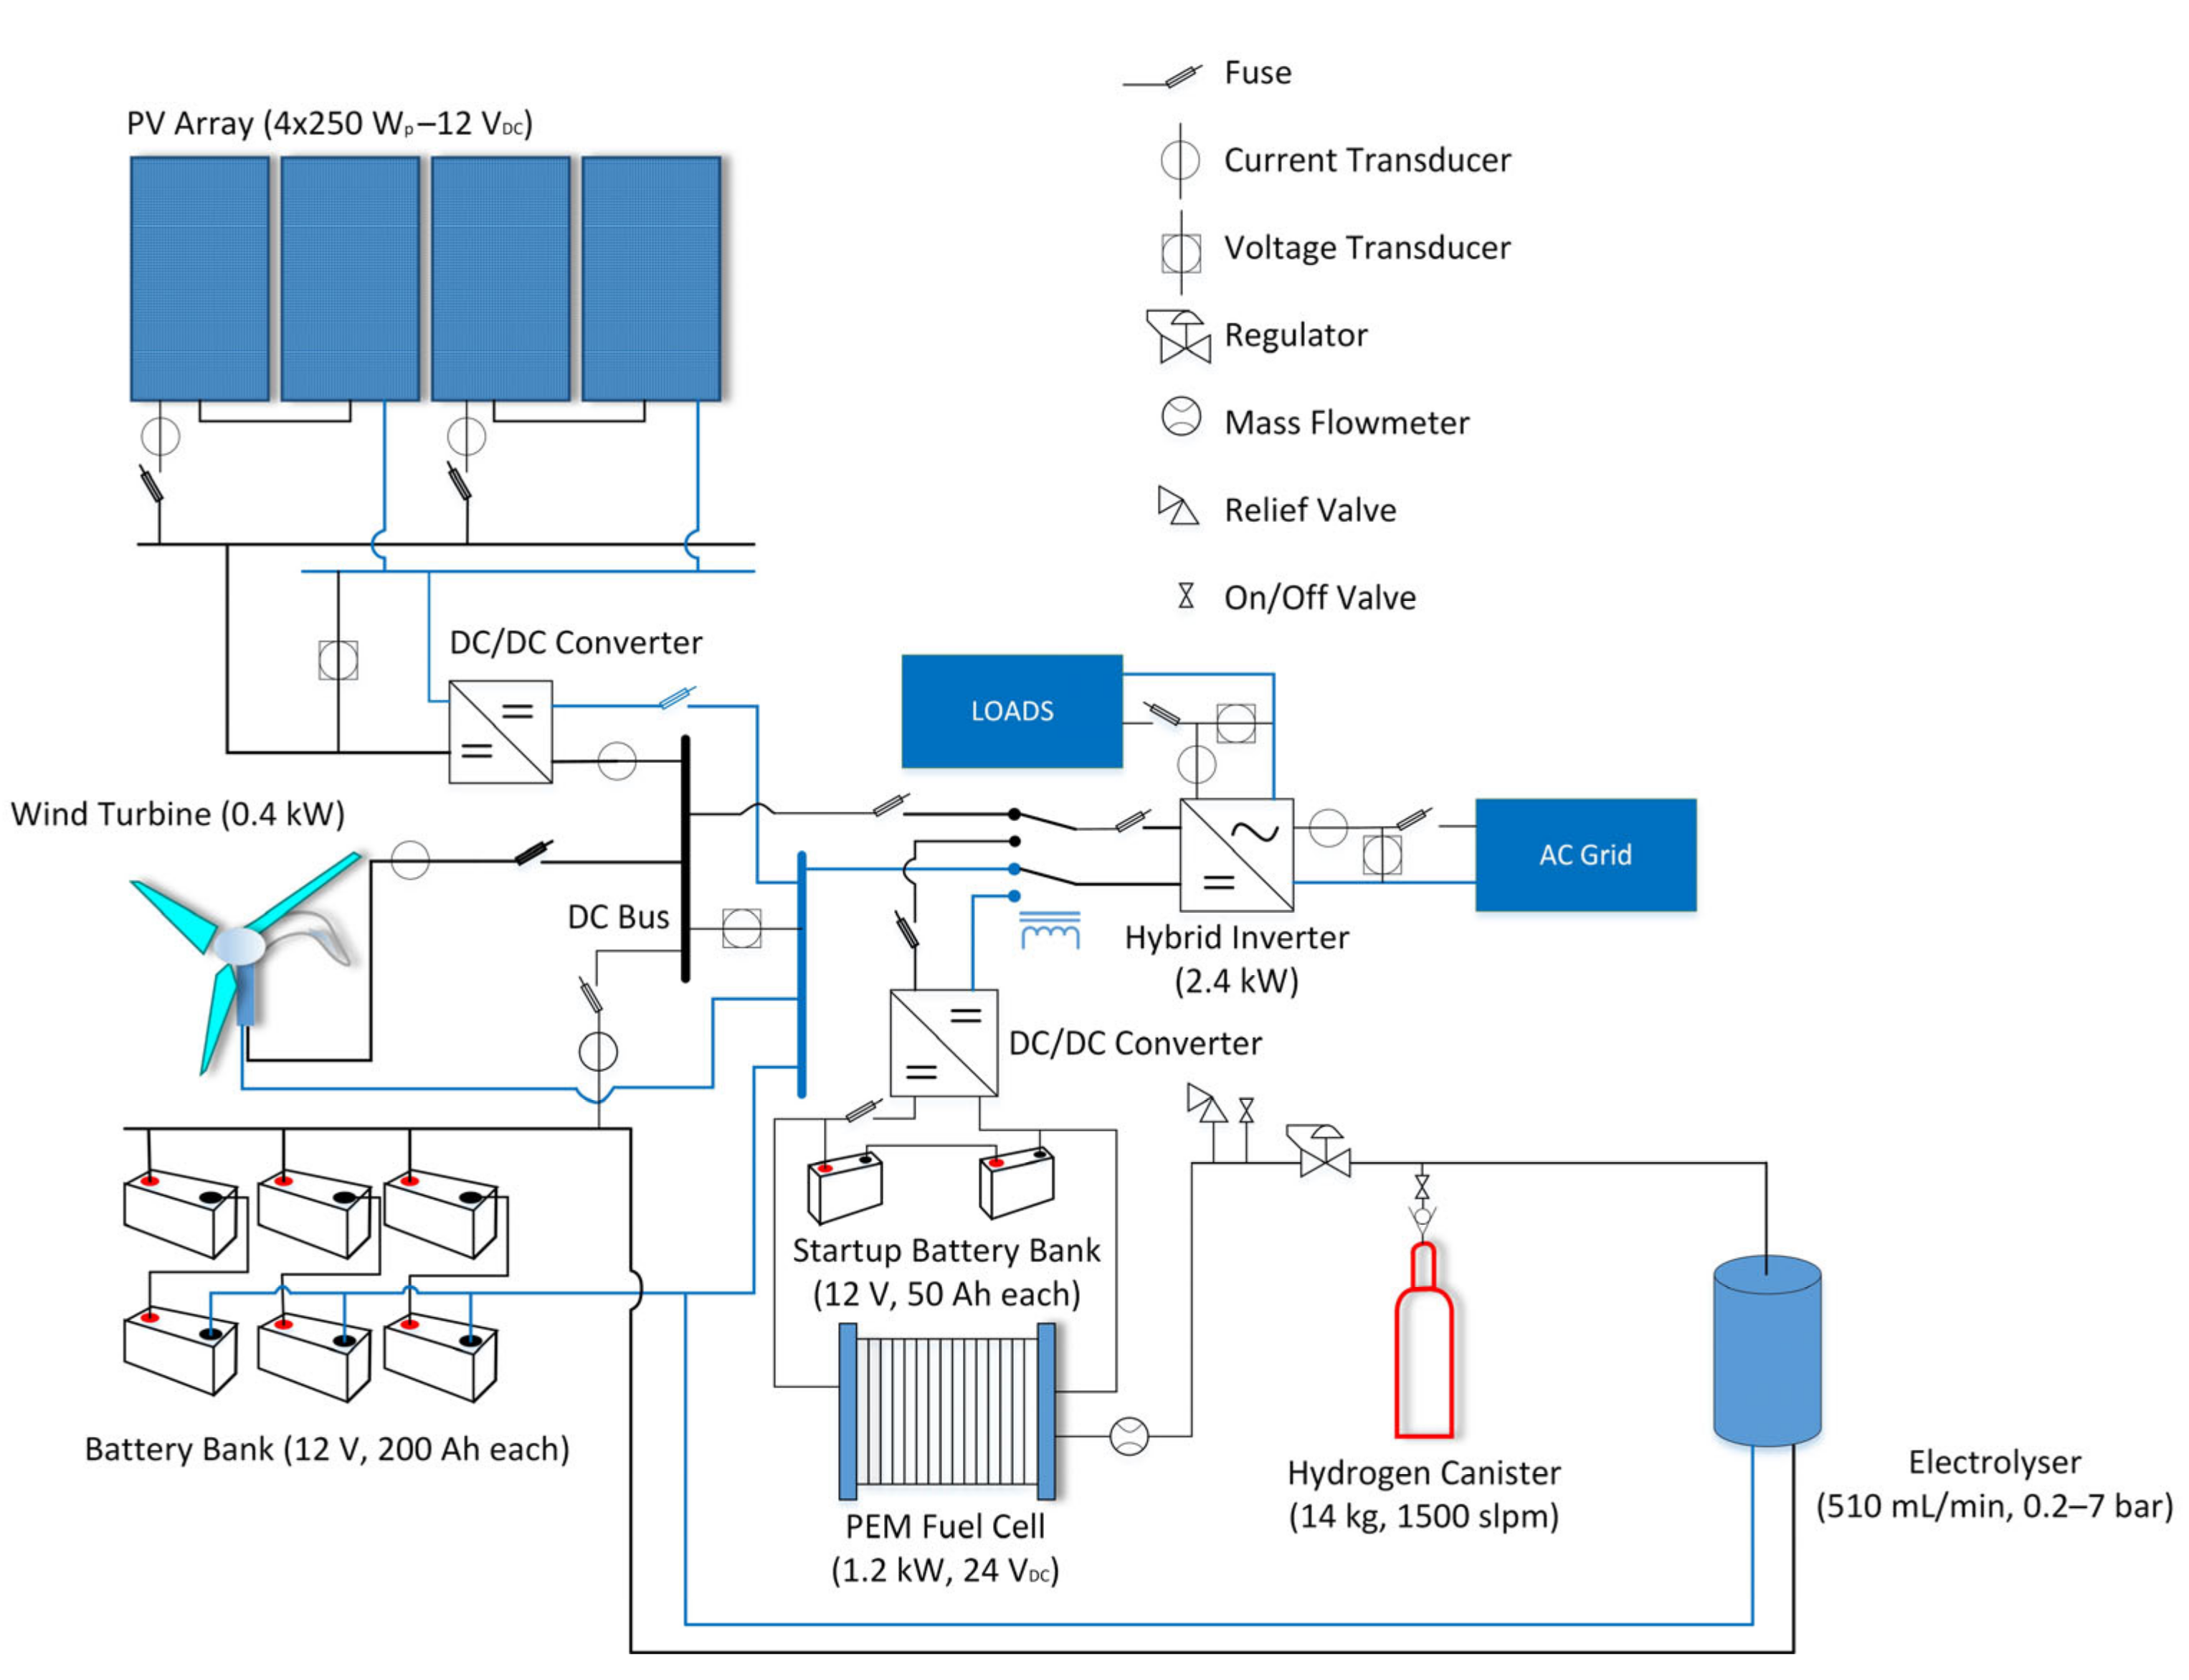
3. Overview of Hybrid Microgrid System

The proposed DG system is established in Marmara University, Faculty of Technology, Istanbul, Turkey. With this system, university researchers and academicians will be supported in the fields of fuel cell technologies, renewable energy systems, power electronics, sustainable energy management, energy managements systems, and hybrid power systems.
The aforementioned components of the DG system are shown in Figure 1 and are as follows: four pieces of PV panels (250 W) exist and create PV modules that are 1000 W rated power. A horizontal axis wind turbine has a 400 W output power with a permanent magnet synchronous machine (PMSM) as a generator. A PEMFC stack operates with a hydrogen generator (electrolyzer) with a 60 sL/h H2 flow, which gives 1200 W output power. To provide H2 to the stack, a low-pressure metal hydride hydrogen tank with 1500 sl is included. It should be mentioned that this stack is triggered by a fuel cell start-up battery with a 2 × 12 V output voltage and 120 Ah current capacity. This stack cabinet also has a 1500 W power-rated electronics load combined with it. A user-friendly interface is embedded into the PEMFC stack.
All these DG elements are connected to the load side with a 2400 W-powered hybrid inverter. As a complementary power source, a battery bank contains six batteries, three connected in parallel and two in series, which are equal to 600 Ah current capacity, 24 V output voltage, and 14.4 kWh energy capacity. To operate the system to meet the desired requirements, a central energy management unit is employed. This energy management system collects data for visualizing and controlling the power flow from the DG to the load side. This energy management system can be controlled by a user interface connected to the system.
The monitoring and control part of the DG system consists of two main parts: energy production and energy storage. The energy production units comprise a wind turbine, PV modules, and PEMFC system. The storage part consists of a battery bank, hydrogen canister, and electrolyzer. A Proton Exchange Membrane (PEM)-type hydrogen fuel cell is used as a backup energy generation system in this hybrid DG structure.
Since the polymer material is used as the electrolyte in the hydrogen fuel cell, these fuel cells are known as PEM cells. The electrodes used are carbon-structured. The most important feature of the PEMFC is that it has a membrane with proton conduction. The polymer membrane used is thin, small, and light. The most commonly used membrane material is Nafion®, manufactured by DuPont (Wilmington, DE, USA). This membrane must be made of a material with high thermal, mechanical, and chemical resistance that is impermeable to water, fuel, oxygen, and other gases in the air. The wind turbine and PV modules on the rooftop of Marmara University, Faculty of Technology, are shown in Figure 2. The laboratory room with the wind turbine, PV modules, stack of hydrogen fuel cells, battery bank, electrolyzer, hydrogen canister (metal hydride tube), and other components is shown in Figure 3.
The wind turbine specifications are given in Table 1.
The Weibull probability density function is generally used to calculate the energy generated from wind turbines, depending on the momentarily variable wind.
f ( v ) = k c v c k 1 exp v c k
where k is the shape parameter, and c is the scale parameter. In the case where much detail is known about the wind regime in a region, the k shape parameter can be set to 2. In this case, the Weibull probability density function is known as the Rayleigh probability density function [21].
f ( v ) = 2 v c 2 exp v c 2
f ( v ) = Π v 2 ύ 2 exp Π 4 v ύ 2
where ύ is an average wind speed in terms of m/s unit, denoted as 4.78 m/s.
According to the Weibull calculations, the wind turbine power curve can be expressed as in Figure 4. The total annual obtained energy from the wind turbine is calculated as 228.493 kWh, as seen in Table 2.
The parameters of the PV module are reported in Table 3. With regards to geographic location, the coordinates of the aforementioned system are located at 40°59′ North Latitude, 29°3′ East Longitude.
δ = 23 , 45 sin 360 365 ( n 81 )
β A = 90 L + δ
P V t i l t = 90 β A
where δ is the solar declination angle, and βA is an altitude angle (the altitude angle is the angle between the sun and the local horizon directly beneath the sun), PVtilt is the optimum PV module tilt angle, fixed at 30°, L is the latitude of the site, and n is number of days.
I t o t a l = I b e a m + I d i f f u s e + I r e f l e c t e d
I b e a m = I B H R B
I B H = I H I D H
H S R = cos 1 ( tan L tan δ )
H S R C = min cos 1 ( tan L tan δ ) , cos 1 [ tan L ( L P V t i l t ) tan δ ]
R B = cos ( L P V t i l t ) cos δ sin H S R C + H S R C sin ( L P V t i l t ) sin δ cos L cos δ sin H S R + H S R sin L sin δ
C = I H I O
I D H I H = 1.390 4.207 C + 5.531 C 2 3.108 C 3
I d i f f u s e = I D H 1 + cos ( P V t i l t ) 2
I O = 24 Π S C 1 + 0.034 cos 360 n 365 cos L cos δ sin H S R + H S R sin L sin δ
I r e f l e c t e d = ρ I H 1 cos ( P V t i l t ) 2
where Itotal is the total daily solar irradiance on the PV module, Ibeam is the beam solar irradiance on the PV module, Idiffuse is the diffuse solar irradiance on the PV module, Ireflected is the reflected solar radiation on the PV module, IH is the total average daily horizontal solar irradiance, IBH is the beam irradiance on the horizontal surface, RB is the beam tilt factor, HSRC is the sunrise hour angle for the collector (when the sun first strikes the collector face, θ = 90°), HSR is the sunrise hour angle (in radians), C is the clearness index, IO is extraterrestrial insolation on a horizontal surface at the site, IH is insolation on a horizontal surface, and ρ is ground reflectivity. The total solar irradiance profile is shown in Figure 5.
To be aware of the potential of the faculty’s location, the 3D Sun-Path program was used to assist in comparing solar altitude, azimuth angles, and zenith angles [22]. The program interface is shown in Figure 6.
E t o t a l = A m o d u l e η m o d u l e I t o t a l P R
where Etotal is the produced total PV output energy (kWh), PR is the performance ratio (0.5~0.9), Amodule is the module area (m2), and ηmodule is the module efficiency (%).
Equation (18) expresses the total annual produced PV energy. By this calculation, the annual average produced energy profile is plotted and illustrated in Figure 7; the total annual PV energy corresponds to 1335.05 kWh. Figure 8 depicts the hourly total produced PV output energy. It can be extracted that generation is higher at noon than at the other times.
The system is established and designed to operate both independently and connected to the grid. The system can be fed by the utility grid, with the aim of hybrid inverter operation when the state of charge (SoC) of battery bank is lower than desired level, as this means the stored energy is not able to meet the load demand. When the battery bank meets the load requirement, the system continues to operate independently of the grid. This energy management scenario in these DG systems ensures the flexibility and sustainability of the systems.
As seen in Table 4, the daily energy requirement was calculated as 14,360 kWh. In this case, the annual average energy demand is 3791.04 kWh. Since the total annual energy demand is 3791.04 kWh, the 2029.497 kWh of energy that cannot be met by production can be supplied from the grid via the hybrid inverter.
A h = n k E d e m a n d v D C D o D
where n represents days of autonomy (n = 2), DoD is the maximum depth of discharge (DoD = 40%), vDC is DC bus voltage (vDC = 24 V), Edemand is total energy demand, k is the temperature correction factor (k = 1.04). Six batteries of 120 Ah each are connected in series and parallel as shown in Figure 2 to obtain nominal 24 V and a total power of 14.4 kWh. The system components are installed in the “Renewable Energy Laboratory” within the Faculty. The lighting and the “plug and play” loads are connected to the DG system. The lighting (armature) loads are shown in Figure 9.
The annual average energy produced from the wind turbine and PV modules is 1563.543 kWh. The PEMFC can generate 198 kWh of energy per year when we estimate that it produces 3 h of average power per day. In this case, the total energy produced from the hybrid microgrid is 1761.543 kWh. By means of the electrolyzer in the system, the hydrogen demand of the hydrogen fuel cell stack can be met. The hydrogen produced by the electrolyzer is stored in the metal hydride canister. The charge pressure of the metal hydride canister is 5 bar, and the discharge pressure is 2–5 bar. The weight is 14 kg, the and capacity is 1500 lt. The empty canister can be fully filled in 50 h. A PEM-type hydrogen fuel cell stack is used in the system. The stack in the system can run for 8 h with a full hydrogen canister at a 250 W average. In order for the hydrogen fuel cell stack to operate at a maximum power of 1200 W, it should be supplied with 13 L of hydrogen per minute. The output flow of the electrolyzer used in the system is 510 mL per minute. Therefore, the produced hydrogen should be stored in order for the heap to operate at a power of 300 W.
A Graphical User Interface (GUI) is used for the hydrogen fuel cell stack used in the system, as shown in Figure 10. With the help of this interface, all inputs and outputs of the system can be monitored and controlled in real time. This GUI is a helpful interface that can also be used for education purposes, such as in post-graduate courses, to boost awareness of this topic. It enables us to try different power electronic connection scenarios for the output.
Additionally, polarization curves of fuel cells for different load characteristics, determination of charge-discharge characteristics of batteries, energy conversion and efficiency analysis, and wind turbine and PV module data were obtained. The input power of the system, the powers used, and the energy losses are shown in a Sankey diagram. This diagram also shows the state of charge of the start-up batteries of the fuel cell stack, as can be seen in Figure 10. The most important parameter of a hydrogen fuel cell is the polarization curve. The polarization curve is a graph showing the change in current of a fuel cell or stack, depending on voltage or power. This curve determines the performance of the cell. Through the GUI, it is possible to monitor the instantaneous polarization curve of the PEMFC Stack, as shown in Figure 11. The GUI of the PEMFC facilitates data acquisition relevant to all variables, as seen in Figure 12.
Figure 13 shows the voltage, current, power and temperature curves of the collected PEMFC stack for approximately one hour (4000 s). The data for the SoC level of the start-up battery and the PEMFC’s DC/DC converter output voltages are shown in Figure 14.

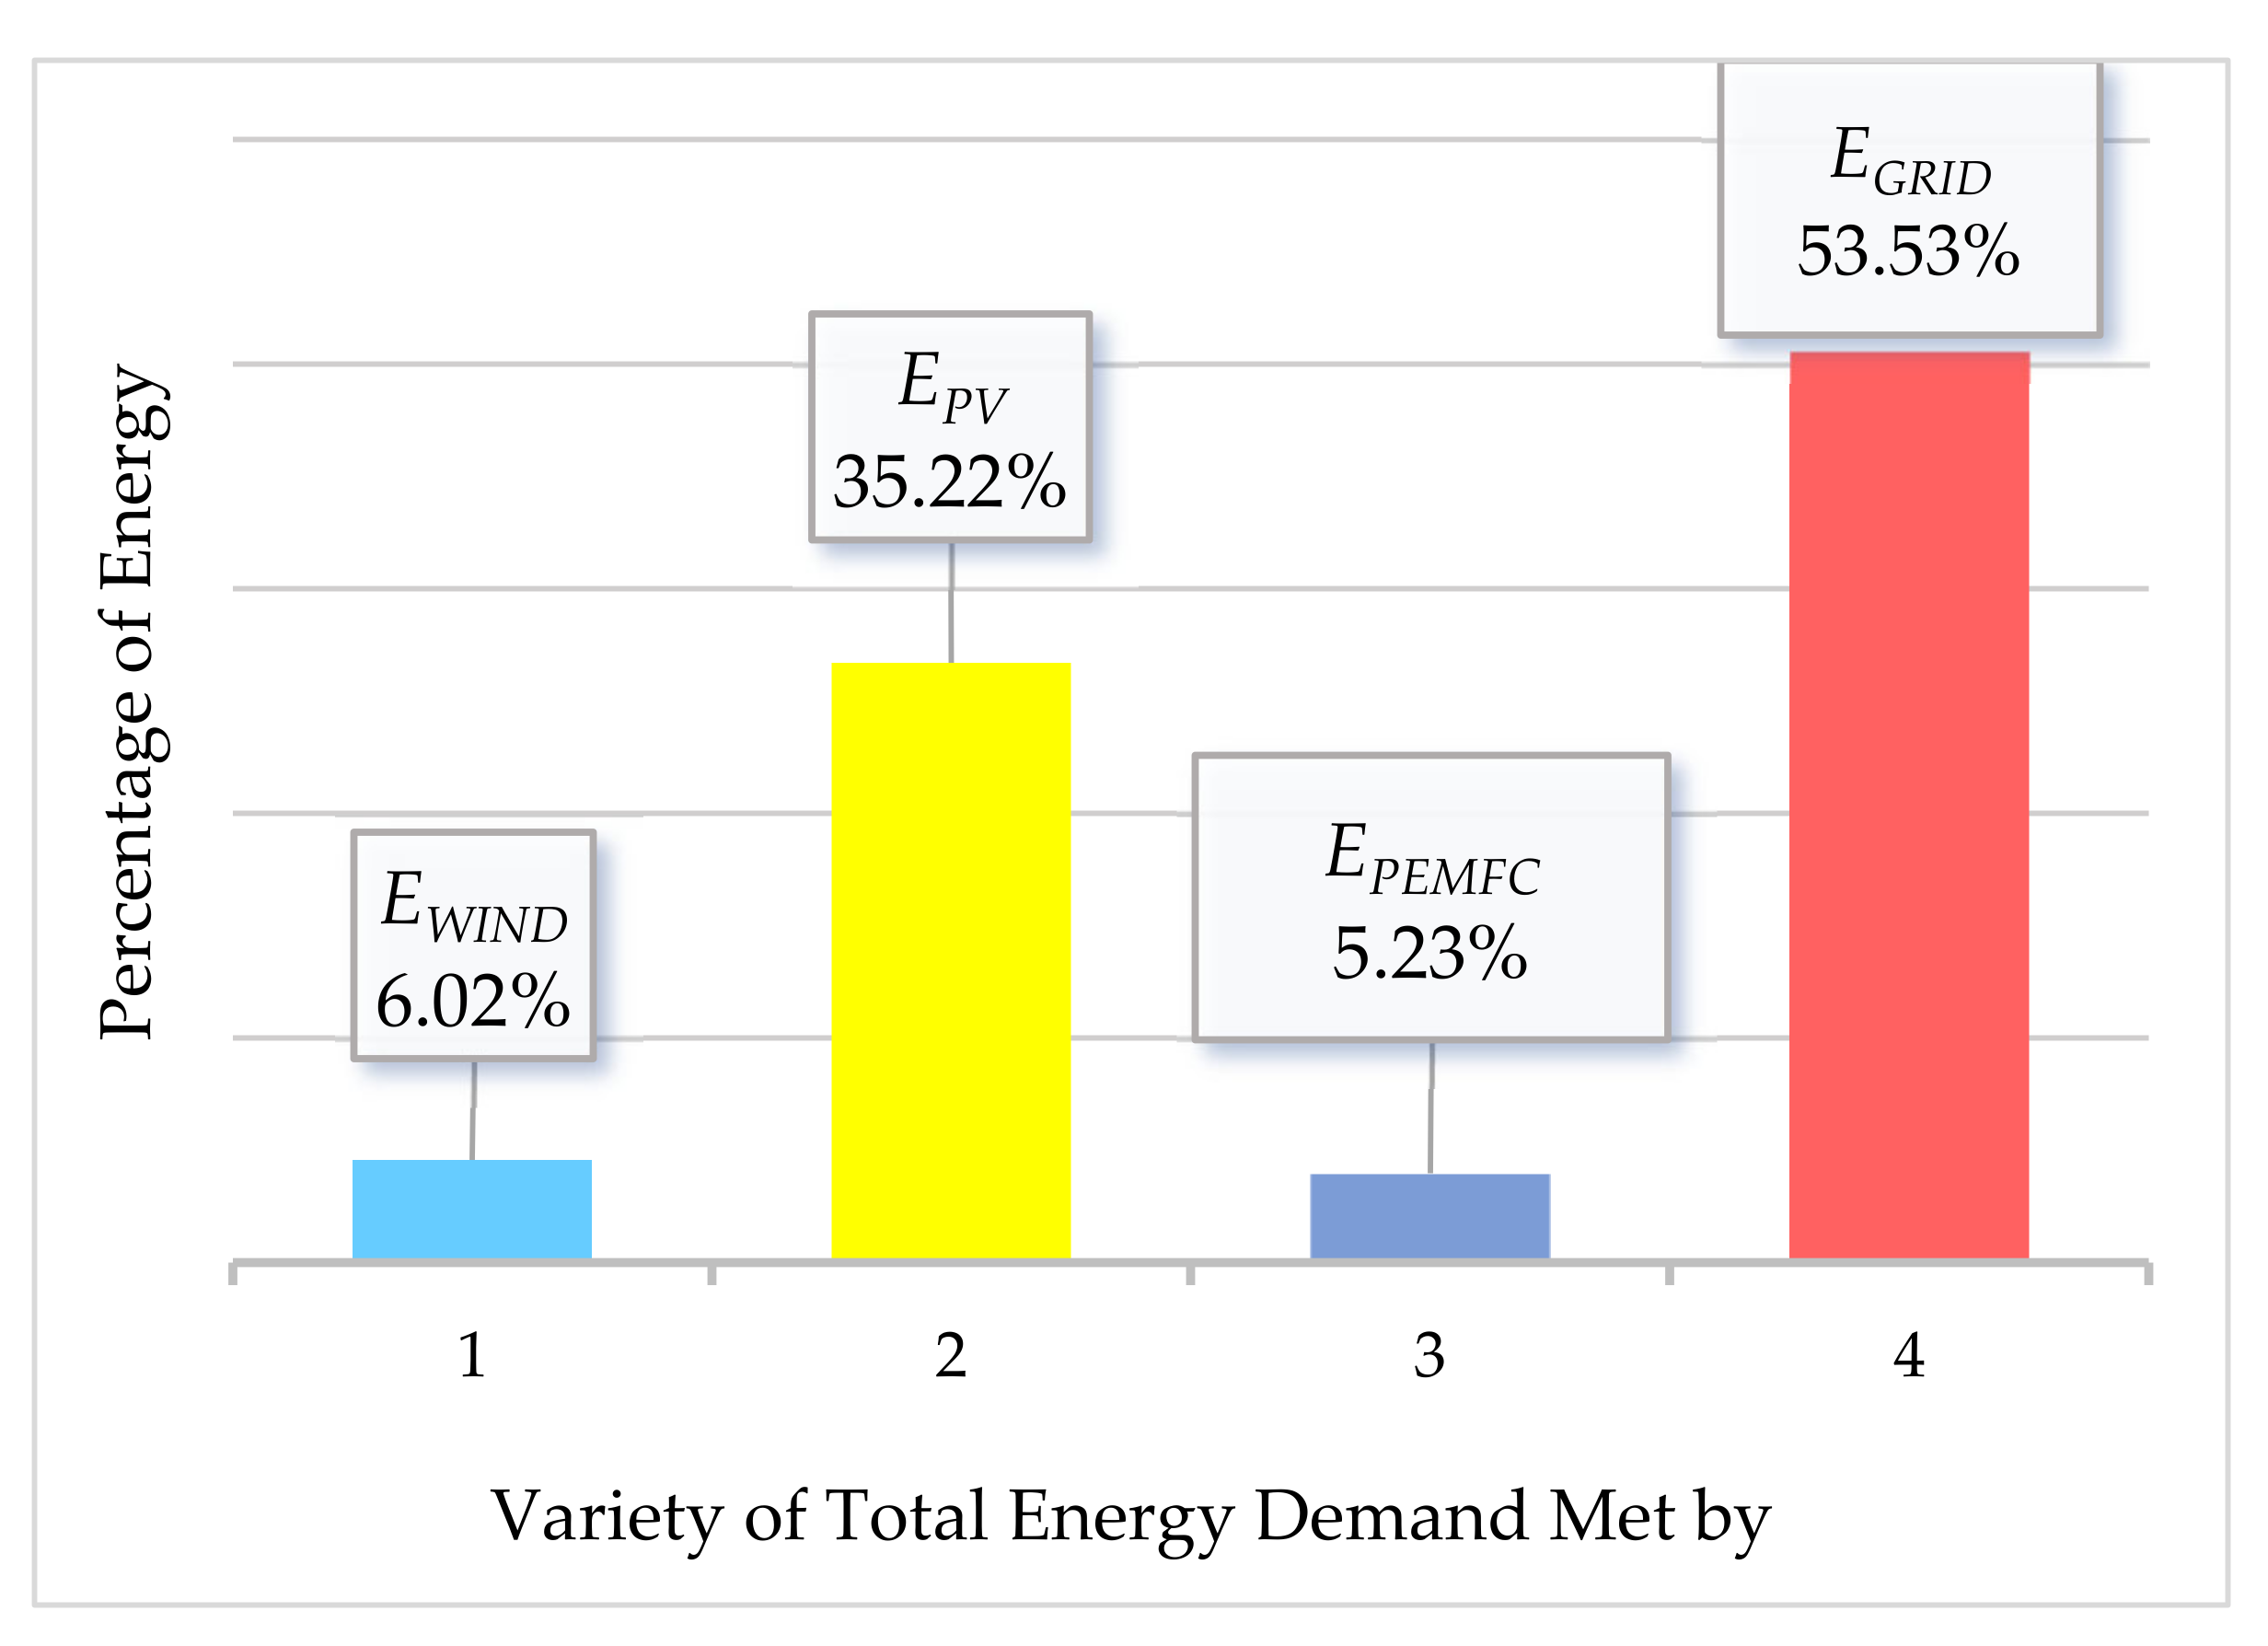
4. Operation Results

The PEMFC-based grid-connected DG system at Marmara University, Faculty of Technology, was analyzed in detail in this study. It was found that 53.53% of the total energy demand was met by the utility grid, while 46.47% of the demand was met by the DG system, as can be seen in Figure 15. As seen in Table 4, the annual average energy demand was calculated as 3791.04 kWh; 2029.497 kWh that could not be met by production could be supplied from the grid via the hybrid inverter. The remaining energy demand was met by the distributed generation, 1761.543 kWh. To this end, we can clarify that 53.53% of the total energy demand is met by the utility grid, while 46.47% of the demand is met by the DG system.
Energy supplied from the utility grid, production of DG systems, and energy demands for the system are given in Table 5. With respect to the energy values of DGs in kWh, most of the demands are met by PV, 35.22% of total production, i.e., nearly 76% of the DG system, as can be seen in Figure 16. The contributions of the wind and PEMFC, (nearly 24% of the DG system) are similar in percentage at 6.02% and 5.23%, respectively.

5. Conclusions

The results and analysis were realized under transient and steady-state conditions. According to the results of the performance analysis, the important points to highlight in order to assist researchers working in this field are as follows. First, it can be extracted that the PV modules are more useful and efficient in urban applications than wind turbines. For example, we see barely 160 W produced by the wind turbine, with a nominal 400 W of power used in this system. The most important reason for this is that the wind turbines installed in places where there are many buildings cannot catch the necessary wind due to its dynamic nature. Another important consequence of the DG system is that the hydrogen required by the fuel cell is supplied by the electrolyzer, which is supplied from renewable energy instead of ready hydrogen tanks. However, the PEM-type fuel cell stack is not suitable for continuous operation if the electrolyzer has a low hydrogen-producing capacity. Although the nominal power of the fuel cell is 1200 W, it is operated with 250 W output power. The energy required for the operation of the electrolyzer is produced entirely from renewable energy. With the increase of the power and size of the electrolyzer, PEMFC’s support for the DG system will increase even more.
The key components of the system are power switching and power electronics components. The frequency of the power switching elements of the inverter used in the system during connection and disconnection from the grid affects the loads in the system. This particularly affects fluorescent lights, which operate with a gas discharge.

Author Contributions

A.N.A. and E.D. wrote the manuscript. E.D. performed the experimental design of the microgrid and data acquisition. A.N.A. operated the system. A.N.A., E.D. and Y.Y. gathered and evaluated the results. A.N.A., E.D. and Y.Y. reviewed the manuscript. All authors have read and agreed to the published version of the manuscript.

Funding

This study was supported by grant from Scientific Research Projects Unit (BAPKO) project number: FEN-E-120314-0069.

Institutional Review Board Statement

Not applicable.

Informed Consent Statement

Not applicable.

Data Availability Statement

Not applicable; however, the data may be requested by reaching out to the authors through email.

Conflicts of Interest

The authors declare no conflict of interest.

References

  1. About Microgrids, Microgrids at Berkeley Lab. Available online: https://building-microgrid.lbl.gov/about-microgrids (accessed on 15 May 2020).
  2. Unamuno, E.; Barrena, J.A. Hybrid AC/DC microgrids—Part I: Review and classification of topologies. Renew. Sustain. Energy Rev. 2015, 52, 1251–1259. [Google Scholar] [CrossRef]
  3. U.S. Department of Energy. Distributed Energy. Available online: http://energy.gov/oe/technology-development/smart-grid/distributed-energy (accessed on 16 May 2020).
  4. Guo, L.; Vengalil, M.; Abdul, N.M.M.; Wang, K. Design and implementation of virtual laboratory for a microgrid with renewable energy sources. Comput. Appl. Eng. Educ. 2021, 30, 349–361. [Google Scholar] [CrossRef]
  5. Zuo, G.; Dou, Y.; Chang, X.; Chen, Y. Design and Application of a Standalone Hybrid Wind–Solar System for Automatic Observation Systems Used in the Polar Region. Appl. Sci. 2018, 8, 2376. [Google Scholar] [CrossRef] [Green Version]
  6. Beccali, M.; Bonomolo, M.; Di Pietra, B.; Leone, G.; Martorana, F. Solar and Heat Pump Systems for Domestic Hot Water Production on a Small Island: The Case Study of Lampedusa. Appl. Sci. 2020, 10, 5968. [Google Scholar] [CrossRef]
  7. Akpolat, A.N.; Yang, Y.; Blaabjerg, F.; Dursun, E.; Kuzucuoglu, A.E. Design implementation and operation of an education laboratory-scale microgrid. IEEE Access 2021, 9, 57949–57966. [Google Scholar] [CrossRef]
  8. Reis, G.L.; Brando, D.I.; Oliveira, J.H.; Araujo, L.S.; Filho, B.J.C. Case Study of Single-Controllable Microgrid: A Practical Implementation. Energies 2022, 15, 6400. [Google Scholar] [CrossRef]
  9. Sun, C.; Leto, S. A novel joint bidding technique for fuel cell wind turbine photovoltaic storage unit and demand response considering prediction models analysis Effect’s. Int. J. Hydrogen Energy 2020, 45, 6823–6837. [Google Scholar] [CrossRef]
  10. Han, Y.; Chen, W.; Li, Q.; Yang, H.; Zare, F.; Zheng, Y. Two-level energy management strategy for PV-Fuel cell-battery-based DC microgrid. Int. J. Hydrogen Energy 2019, 44, 19395–19404. [Google Scholar] [CrossRef]
  11. Washom, B.; Dilliot, J.; Weil, D.; Kleissl, J.; Balac, N.; Torre, W.; Richter, C. Ivory Tower of Power: Microgrid Implementation at the University of California, San Diego. IEEE Power Energy Mag. 2013, 11, 28–32. [Google Scholar] [CrossRef]
  12. Liang, C.; Shahidehpour, M. DC Microgrids: Economic Operation and Enhancement of Resilience by Hierarchical Control. IEEE T Smart Grid 2014, 5, 2517–2526. [Google Scholar] [CrossRef]
  13. Case Study: Microgrid at Princeton University, Consulting-Specifying Engineer. 2015. Available online: http://www.csemag.com/single-article/case-study-microgrid-at-princetonuniversity/a852c6c36420f738c8ecf66de7aa3dd1.html (accessed on 20 May 2020).
  14. The University of Central Lancashire (UCLAN). Available online: http://www.uclan.ac.uk/courses/msc_pgdip_renewable_energy_engineering.php (accessed on 20 May 2020).
  15. Bracco, S.; Delfino, F.; Pampararo, F.; Robba, M.; Rossi, M. Planning and management of sustainable microgrids: The test-bed facilities at the University of Genoa. In Proceedings of the Africon Conference; Pointe aux Piments, Mauritius, 9–12 September 2013, pp. 1–5. [CrossRef]
  16. The Microgrids Group at Berkeley Lab, “Examples of Microgrids”, Berkeley Lab. 2019. Available online: https://building-microgrid.lbl.gov/examples-microgrids (accessed on 20 May 2020).
  17. Davies, R.; Sumner, M.; Christopher, E. Energy storage control for a small community microgrid. In Proceedings of the 7th IET International Conference on Power Electronics, Machines and Drives (PEMD 2014), Manchester, UK, 8–10 April 2014. [Google Scholar] [CrossRef]
  18. Setthapun, W.; Srikaew, S.; Rakwichian, J.; Tantranont, N.; Rakwichian, W.; Singh, R. The integration and transition to a DC based community: A case study of the Smart Community in Chiang Mai World Green City. In Proceedings of the First International Conference on DC Microgrids (ICDCM), Atlanta, GA, USA, 7–10 June 2015; pp. 205–209. [Google Scholar] [CrossRef]
  19. Mihet-Popa, L.; Groza, V.; Isleifsson, F. Experimental testing for stability analysis of distributed energy resources components with storage devices and loads. In Proceedings of the International Instrumentation and Measurement Technology Conference Proceedings, Graz, Austria, 13–16 May 2012; pp. 588–593. [Google Scholar] [CrossRef] [Green Version]
  20. Akpolat, A.N.; Dursun, E. ‘From microgrid to smart grid: A review of campus projects. In Proceedings of the International Engineering, Science and Education Conference, Diyarbakir, Turkey, 1–3 December 2016; pp. 379–387. [Google Scholar]
  21. Masters, G.M. Renewable and Efficient Electric Power Systems; Wiley: Hoboken, NJ, USA, 2014. [Google Scholar]
  22. Marsh, A. 3D Sun-Path. Available online: https://drajmarsh.bitbucket.io/sunpath3d.html (accessed on 1 June 2020).
Figure 1. Overall system diagram.
Applsci 13 03521 g001
Figure 2. Wind turbine and PV modules on the rooftop of the faculty building.
Applsci 13 03521 g002
Figure 3. The DG system components.
Applsci 13 03521 g003
Figure 4. The DG system component (wind turbine).
Applsci 13 03521 g004
Figure 5. Monthly solar irradiance.
Applsci 13 03521 g005
Figure 6. Geographic location of the faculty building and solar positions.
Applsci 13 03521 g006
Figure 7. Total produced PV output energy.
Applsci 13 03521 g007
Figure 8. Total produced hourly PV output energy (kWh).
Applsci 13 03521 g008
Figure 9. The lighting loads in the laboratory.
Applsci 13 03521 g009
Figure 10. GUI of PEMFC Stack, Components, and Sankey diagram.
Applsci 13 03521 g010
Figure 11. The Polarization Curves of the PEMFC.
Applsci 13 03521 g011
Figure 12. Data acquisition screen.
Applsci 13 03521 g012
Figure 13. (a) PEMFC stack voltage, (b) PEMFC stack current, and (c) PEMFC stack temperature (C°).
Applsci 13 03521 g013
Figure 14. (a) Start-up battery SoC levels; (b) PEMFC’s DC/DC converter output voltages.
Applsci 13 03521 g014aApplsci 13 03521 g014b
Figure 15. Grid support and DG energy production.
Applsci 13 03521 g015
Figure 16. The pie chart of power generation and grid support rates of the microgrid for a defined operation.
Applsci 13 03521 g016
Table 1. Wind Turbine Specifications.
SpecificationsUnit
Nominal Power400 W
Swept Area1.07 m2
Cut-in wind speed3.58 m/s
Cut-off wind speed49.2 m/s
Rotor diameter1.17 m
AlternatorPermanent Magnet Brushless
Table 2. Rayleigh probability density functions and wind turbine calculations.
Wind Speed [m/s]Power [W]f (𝒗)Hours/Year at 𝒗Energy [Wh/Year]
1.0600.065569.40
2.0200.11941045.9440
2.9900.15121324.5120
3.5810.15811384.9561620.39852
5.00140.14531272.82817,921.41824
5.99310.11961047.69632,499.52992
6.97510.0893782.26839,848.73192
8.00830.0609533.48444,311.18104
9.001200.0382334.63240,232.80536
10.001460.0221193.59628,357.94208
11.001490.0118103.36815,372.88896
11.991200.0058551.2466140.80818
13.01700.0026823.47681643.376
13.97430.001149.9864427.817376
14.99250.0004523.9595297.4833824
15.9790.0001661.4541613.5091464
17.00100.00005690.4984444.8847512
18.0020.0000180.157680.3169368
Total228,493.0918
Table 3. PV module (polycrystalline cells) specifications.
FeaturesValues (UOM)
Module Efficiency (%)15.71
Cell Efficiency (%)17.9
Peak Power (P)250 Wp
Max Power Voltage (Vmp)30.6 V
Max Power Current (Imp)8.17 A
Open-Circuit Voltage (Voc)38 V
Short-Circuit Current (Isc)8.71 A
Number of Cells60
Dimensions1640 × 990 × 35 mm
Table 4. The load profile of the laboratory.
Loads#Nominal Power [W]Hours of Use/DayEnergy Use/Day [Wh/Day]
Air Conditioning15605 *2800
Electrolyzer14002800
Lighting124810 *5.760
PC2250105000
Total 2.616 14,360
* Discrete time.
Table 5. The DG and energy demands (kWh).
EWindEPVEPEMFCEDG = EWind + EPV + EPEMFCEgridEdemand
228.4931335.0501981761.4532029.4973791.040
Disclaimer/Publisher’s Note: The statements, opinions and data contained in all publications are solely those of the individual author(s) and contributor(s) and not of MDPI and/or the editor(s). MDPI and/or the editor(s) disclaim responsibility for any injury to people or property resulting from any ideas, methods, instructions or products referred to in the content.

