Effect of Carbon and Steel Fibers on the Strength Properties and Electrical Conductivity of Fiber-Reinforced Cement Mortar


Abstract
:1. Introduction
2. Experimental Program
2.1. Experimental Plan
2.2. Materials
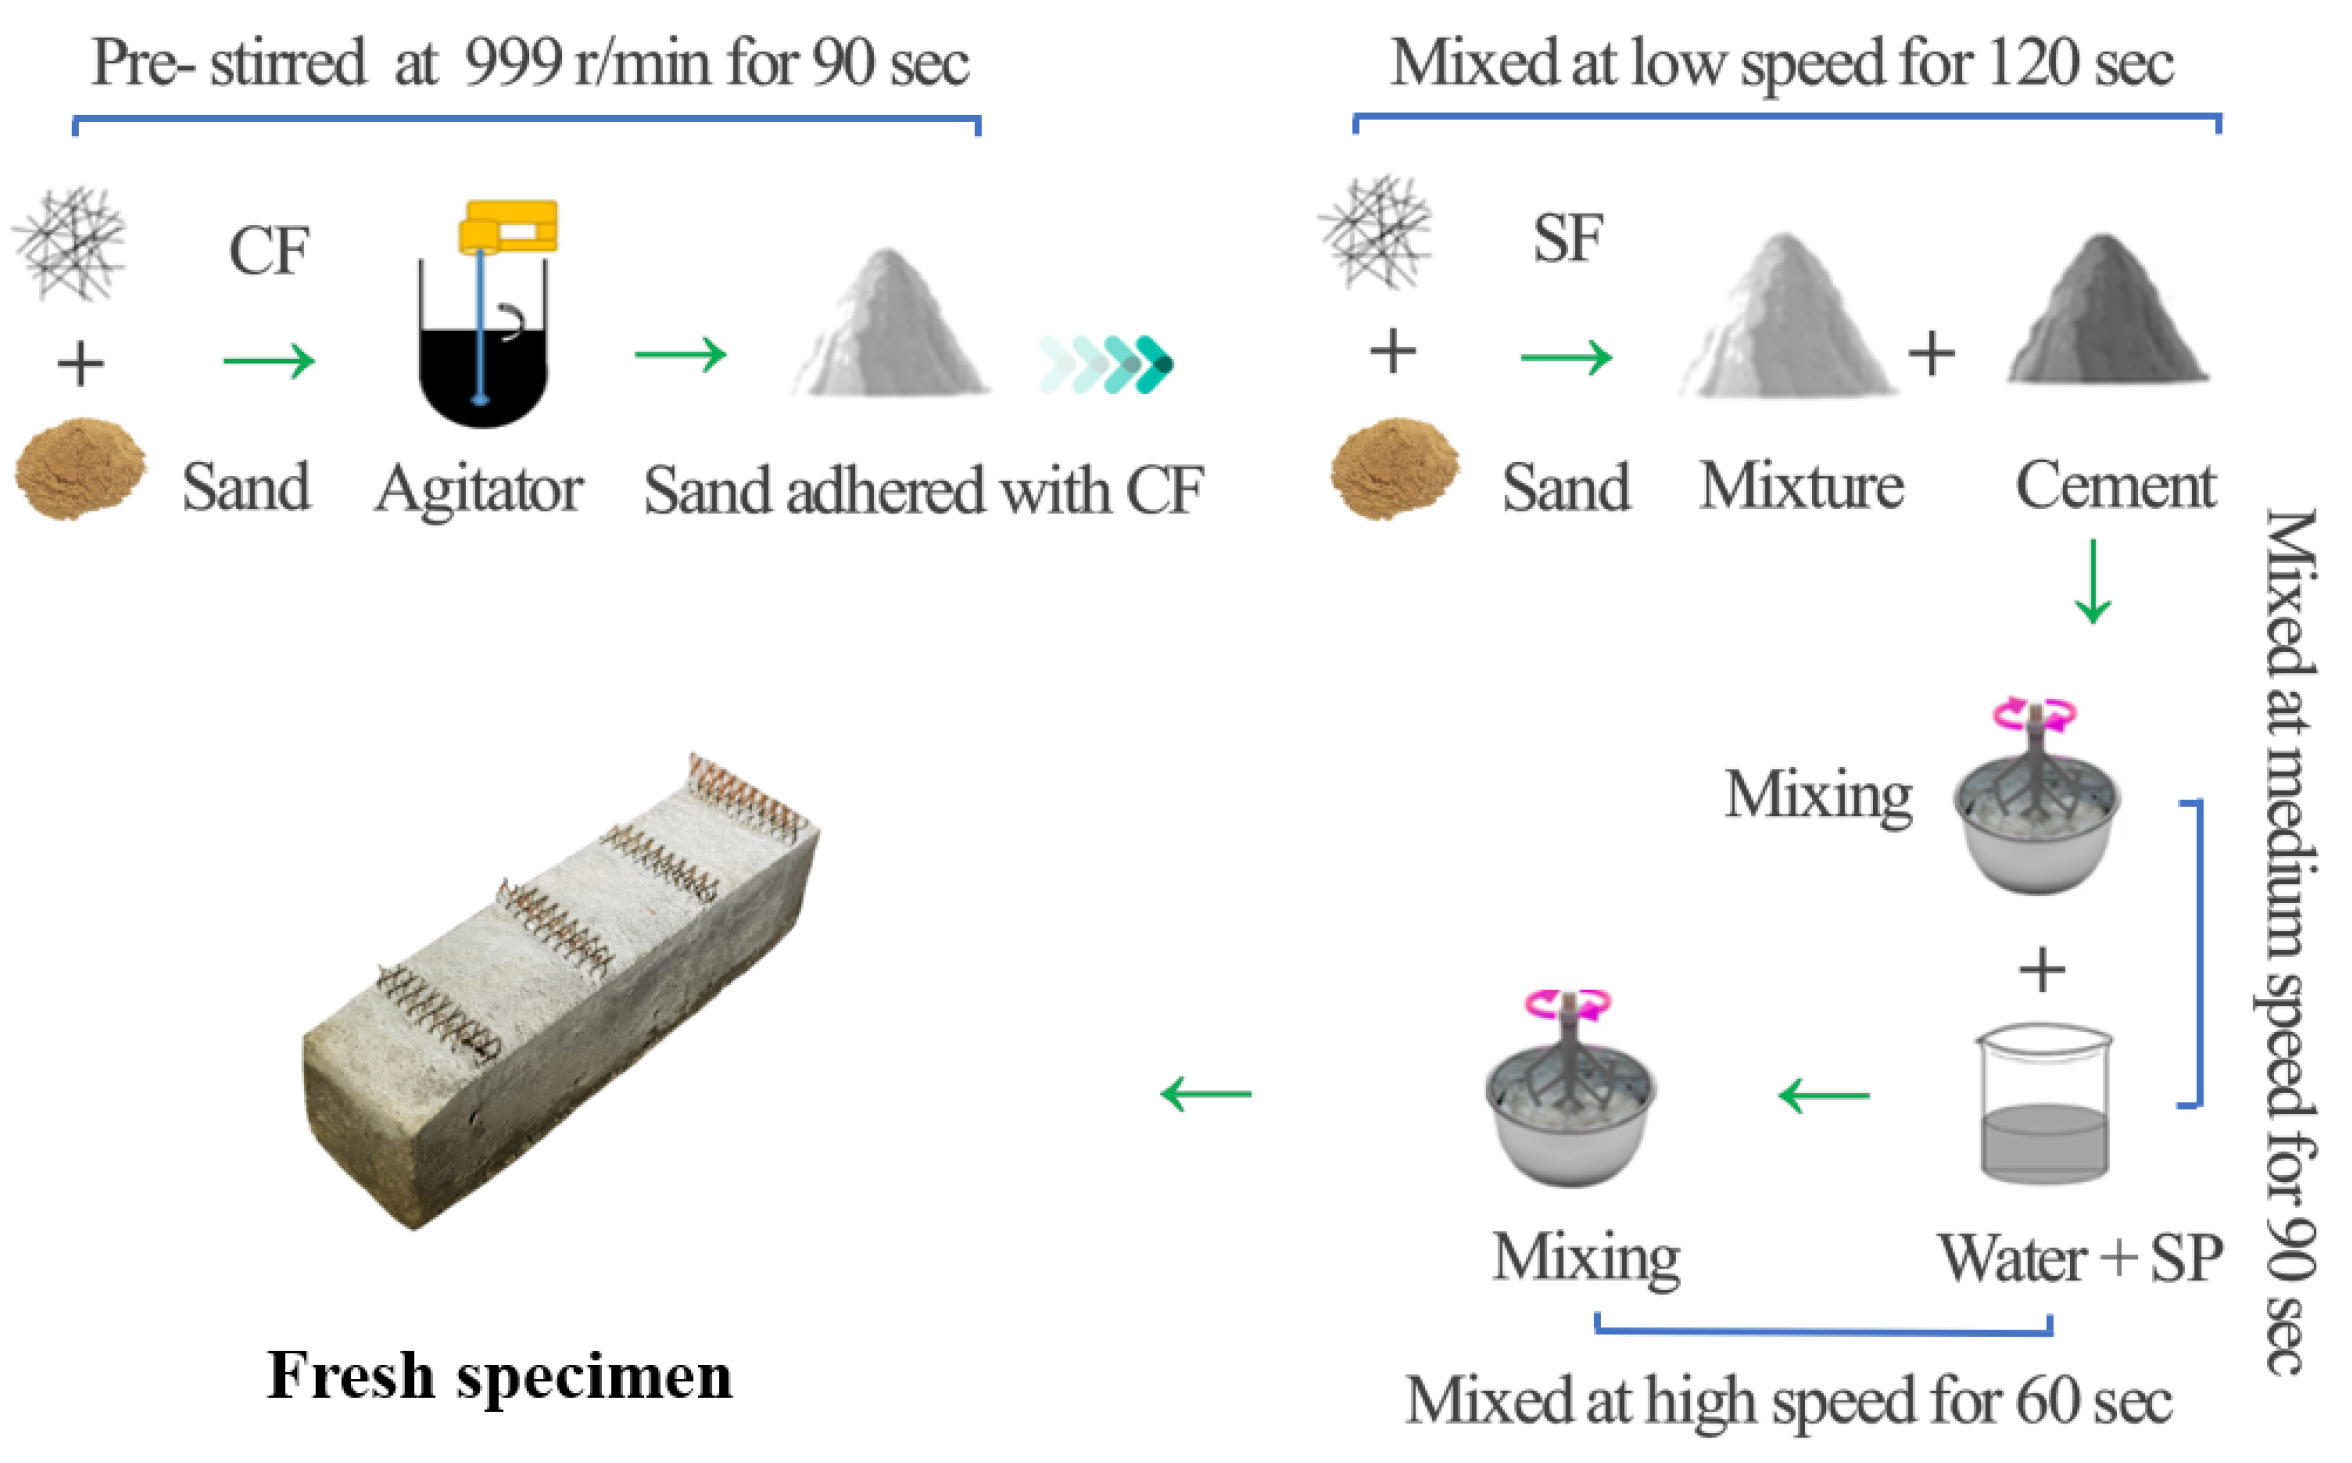
2.3. Mix Proportions, Mixing Method, and Manufacturing Specimens
2.4. Experimental Methods
2.4.1. Flow Test
2.4.2. Unit Weight Test
2.4.3. Air Content Test
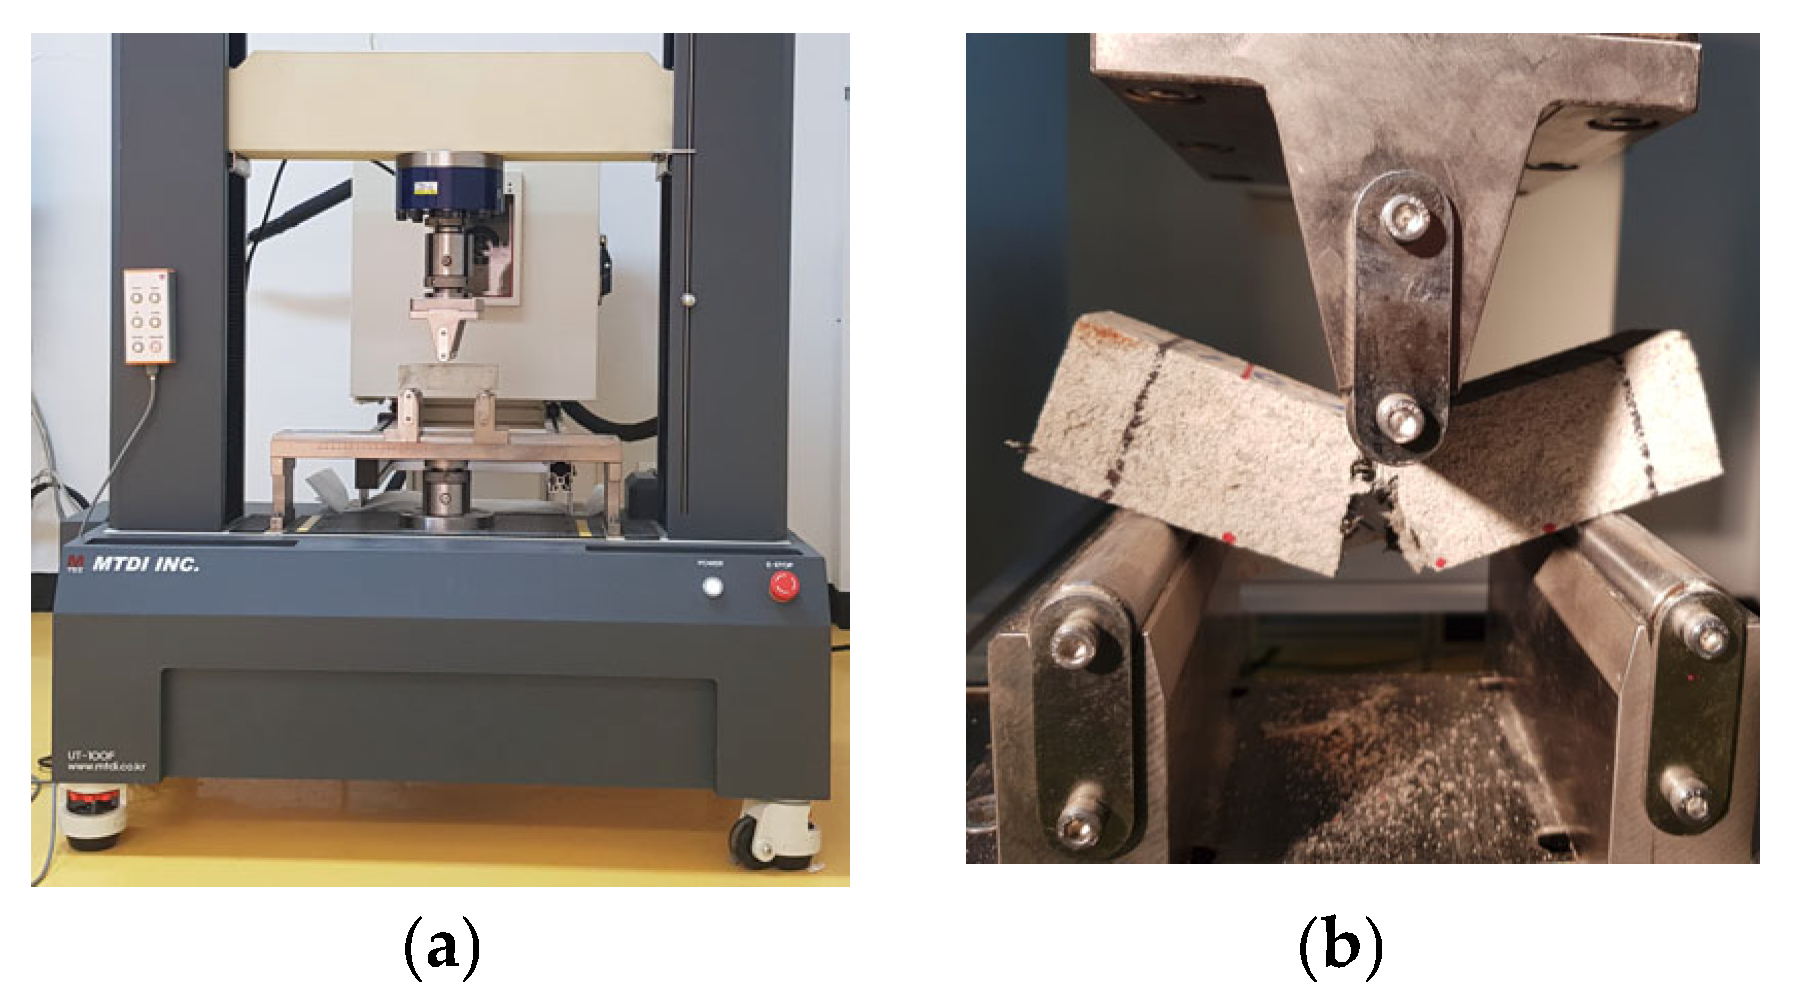
2.4.4. Three-Point Flexural Test
2.4.5. Compressive Test
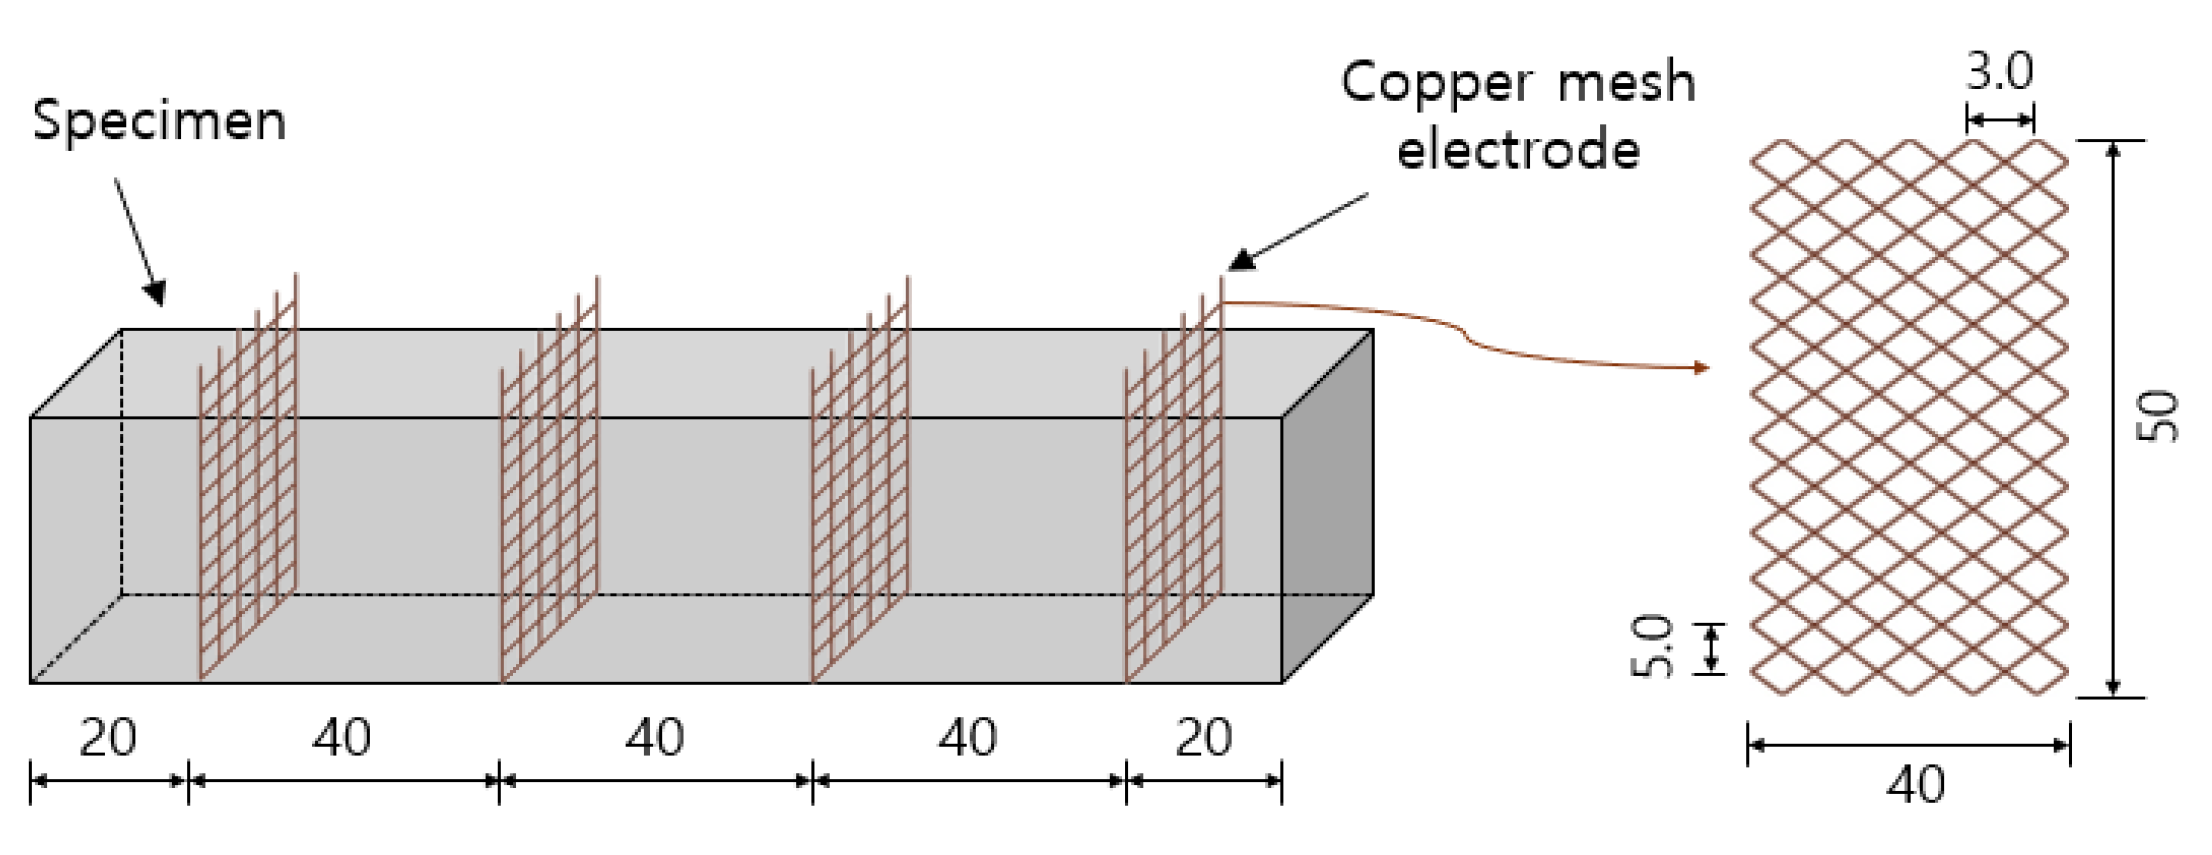
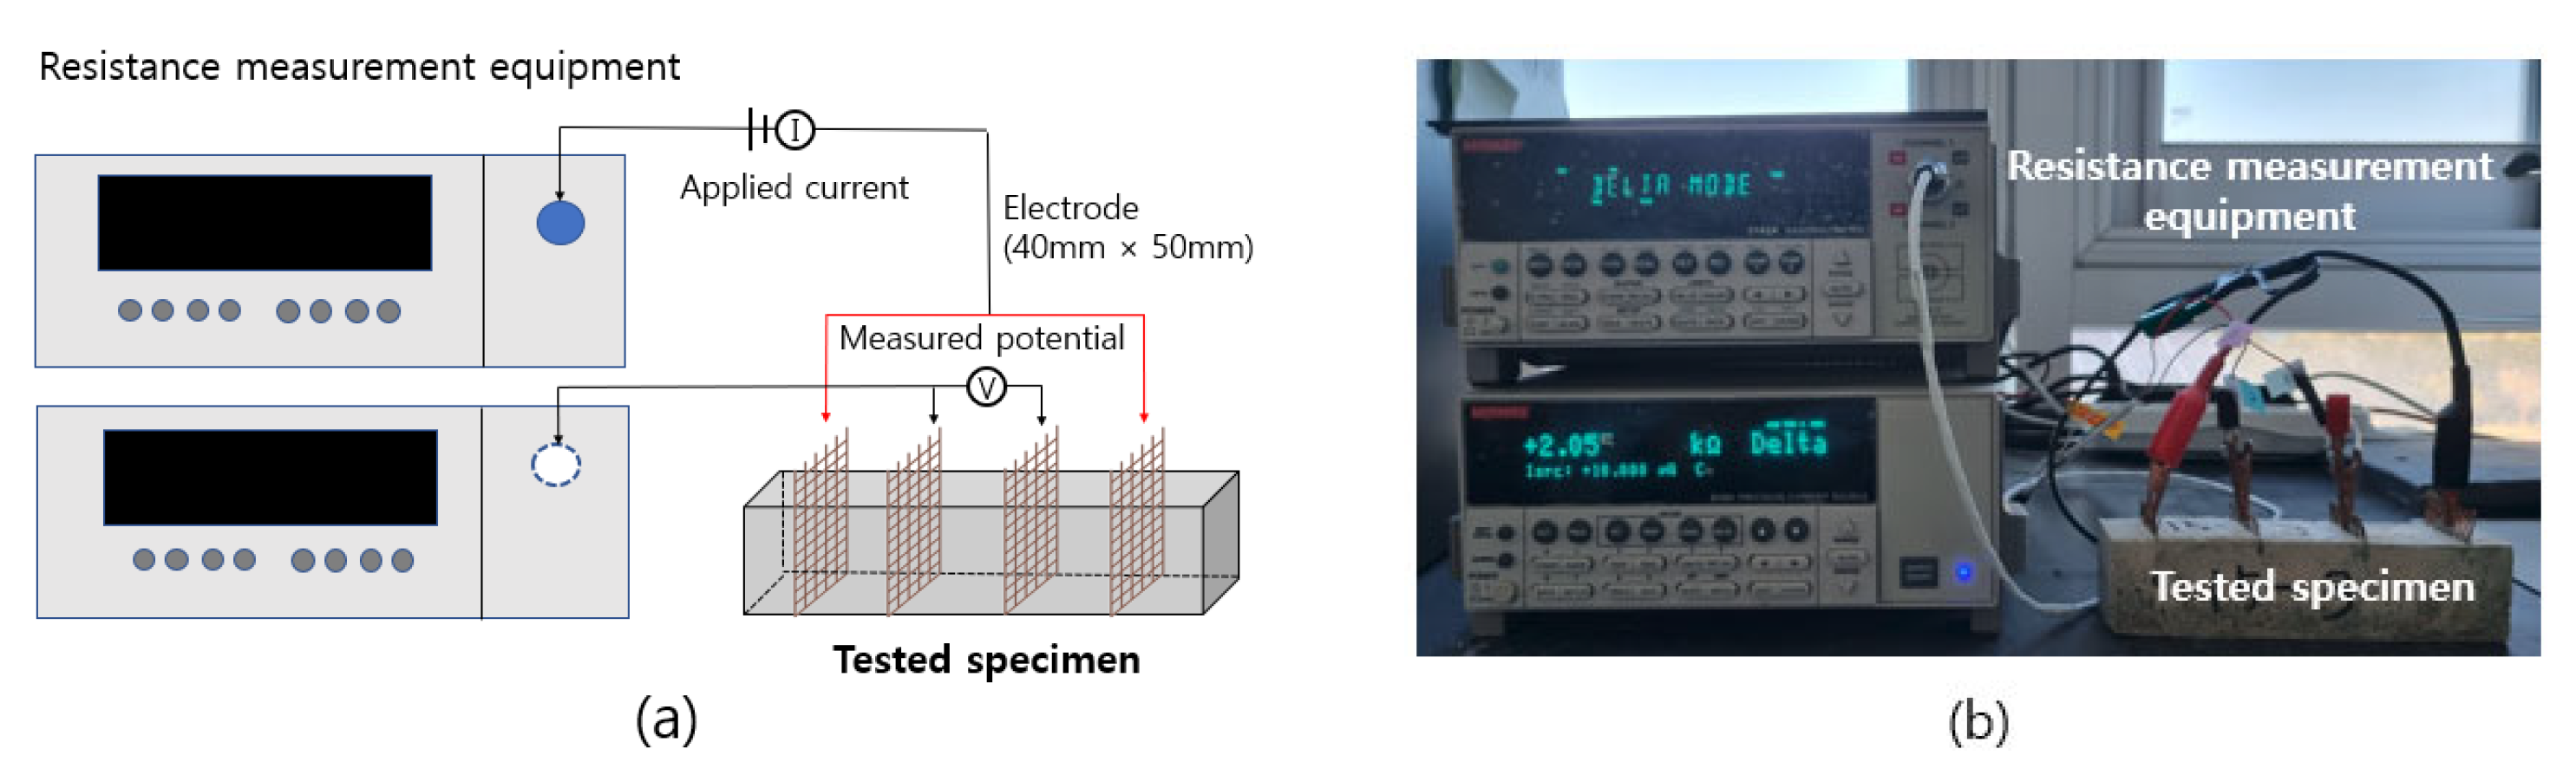
2.4.6. Electrical Resistance Test
2.4.7. Observation by SEM/EDS
3. Results and Discussion
3.1. Properties of Fresh Mortar
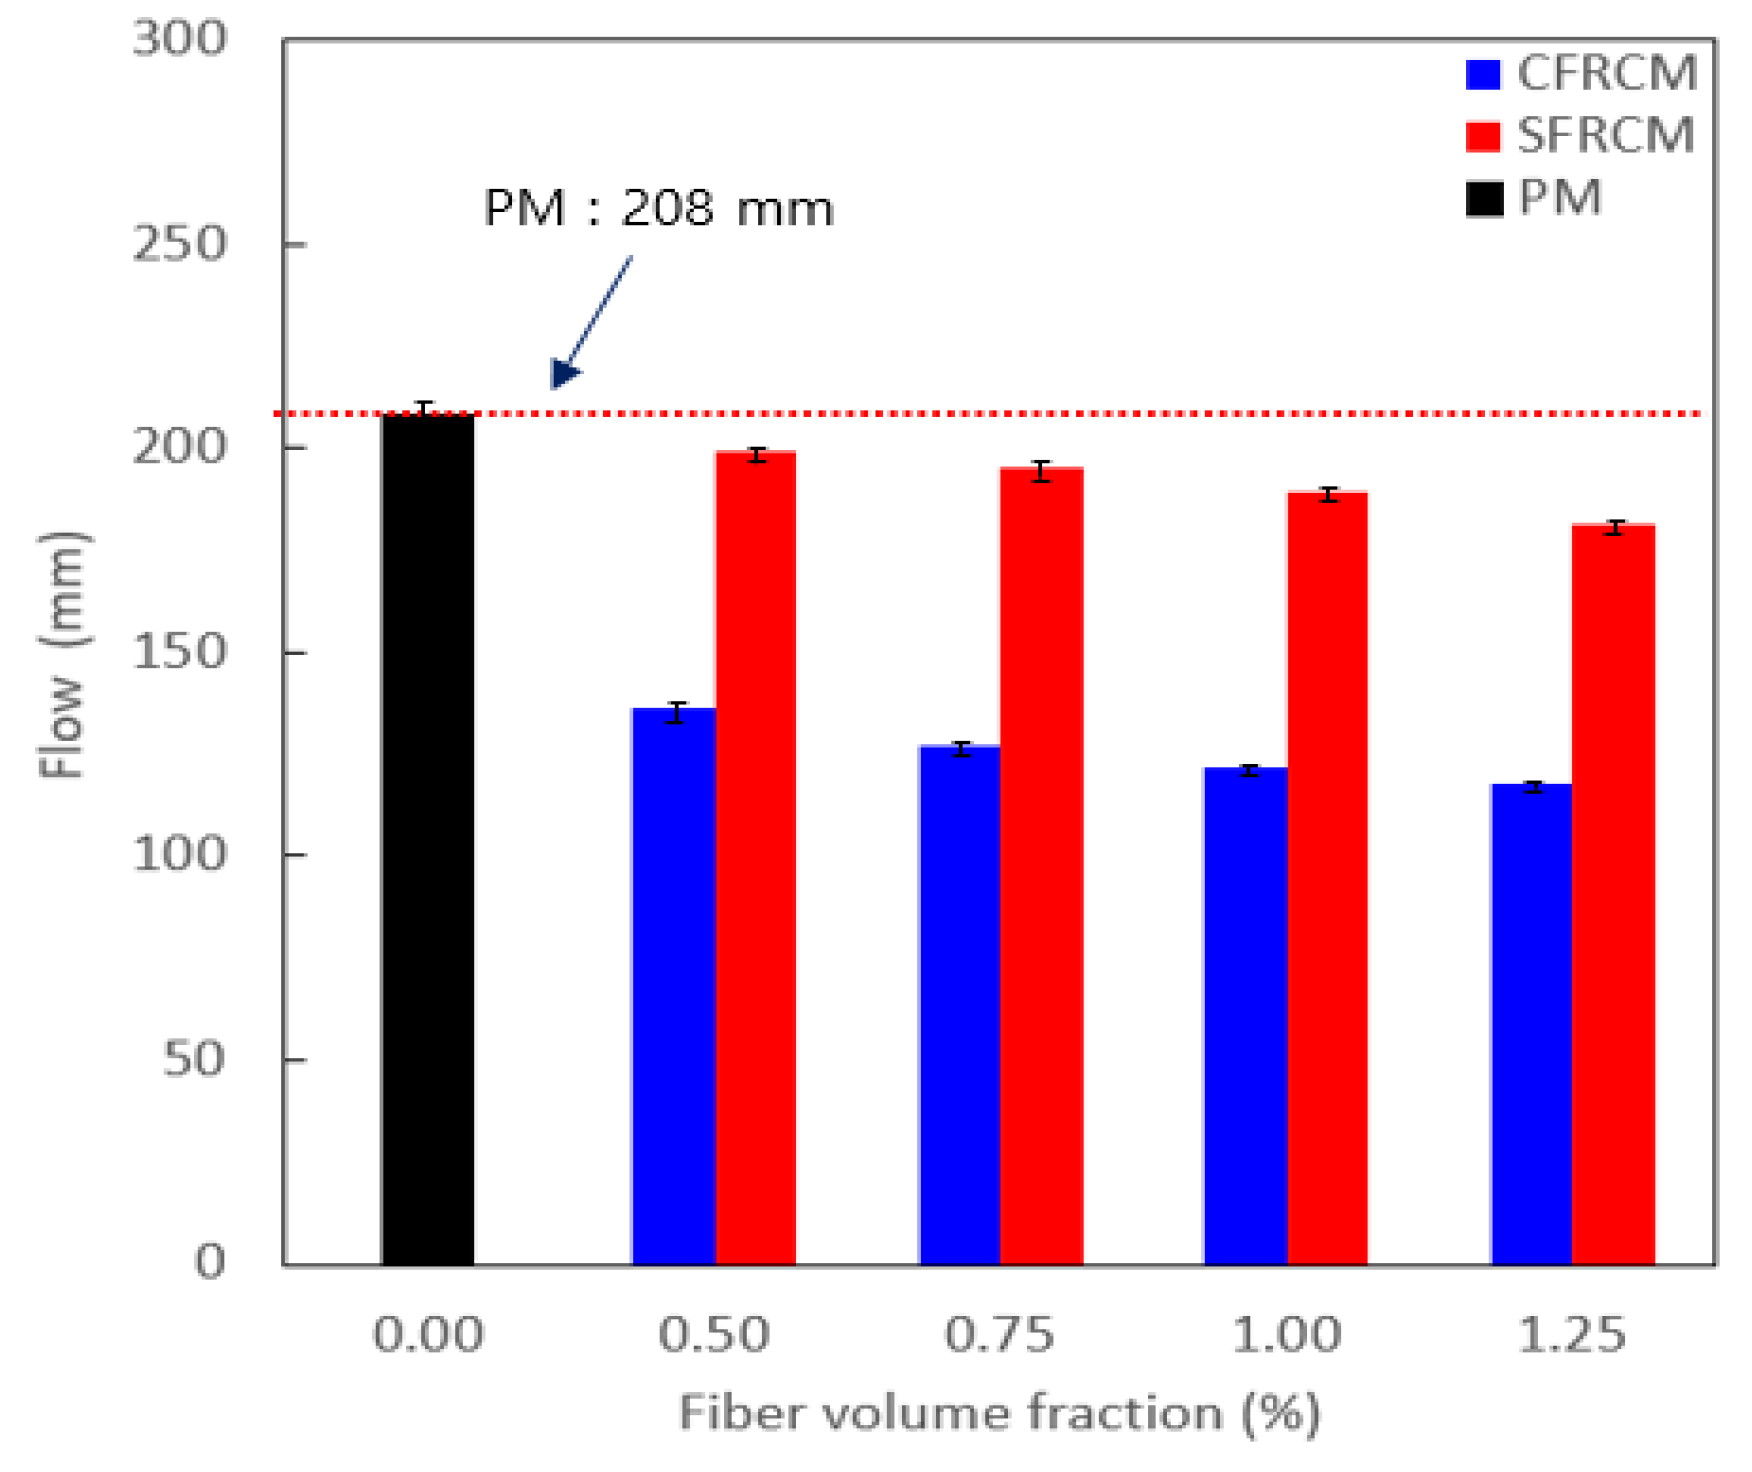
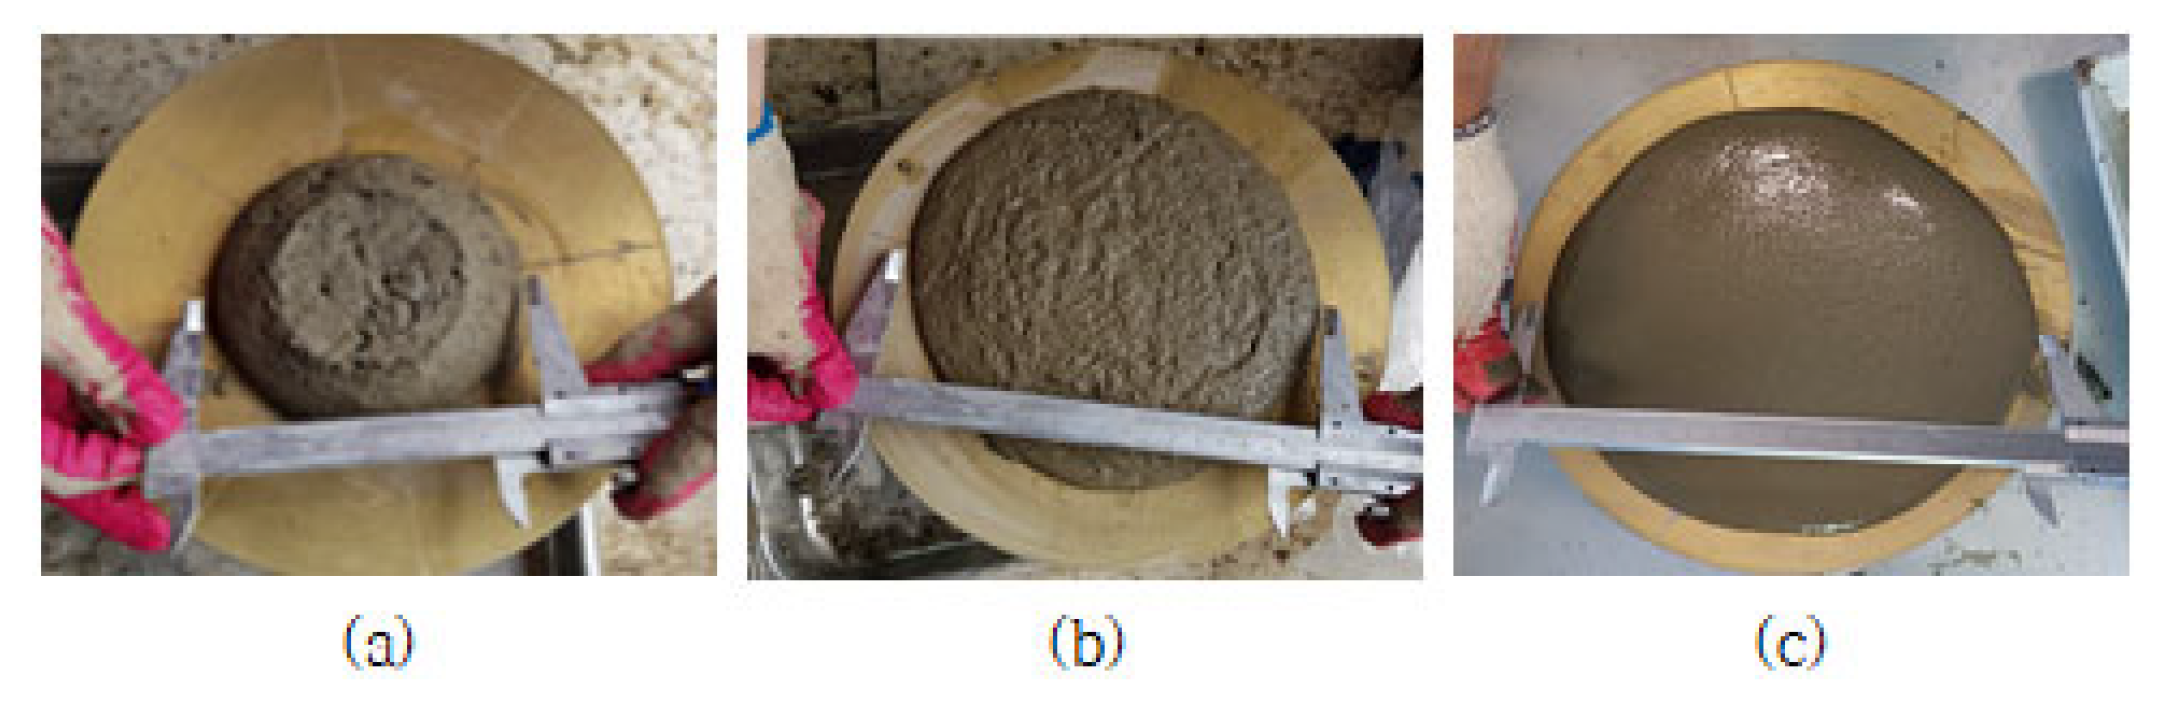
3.1.1. Flow
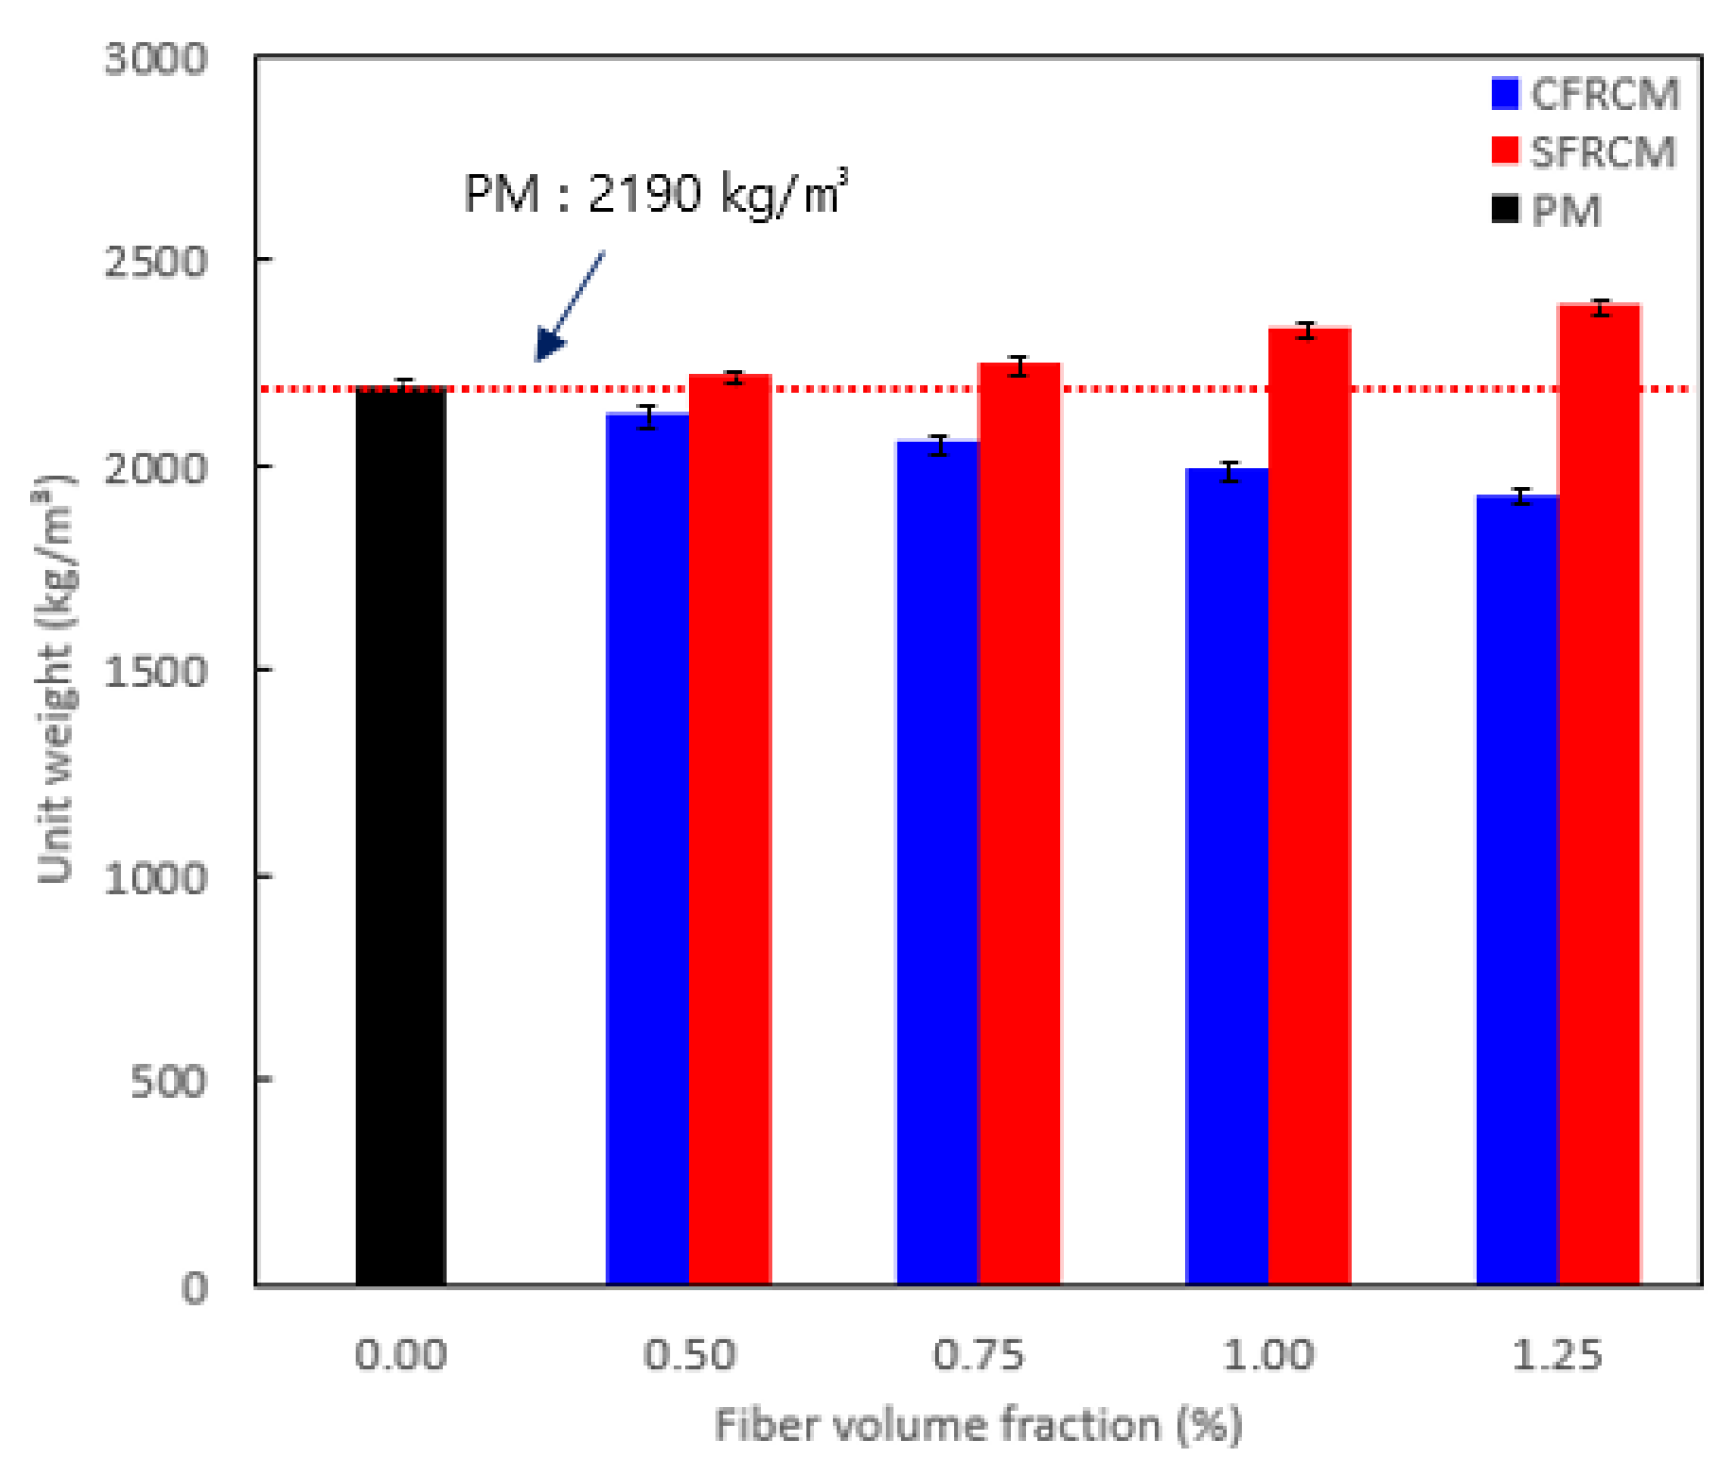
3.1.2. Unit Weight
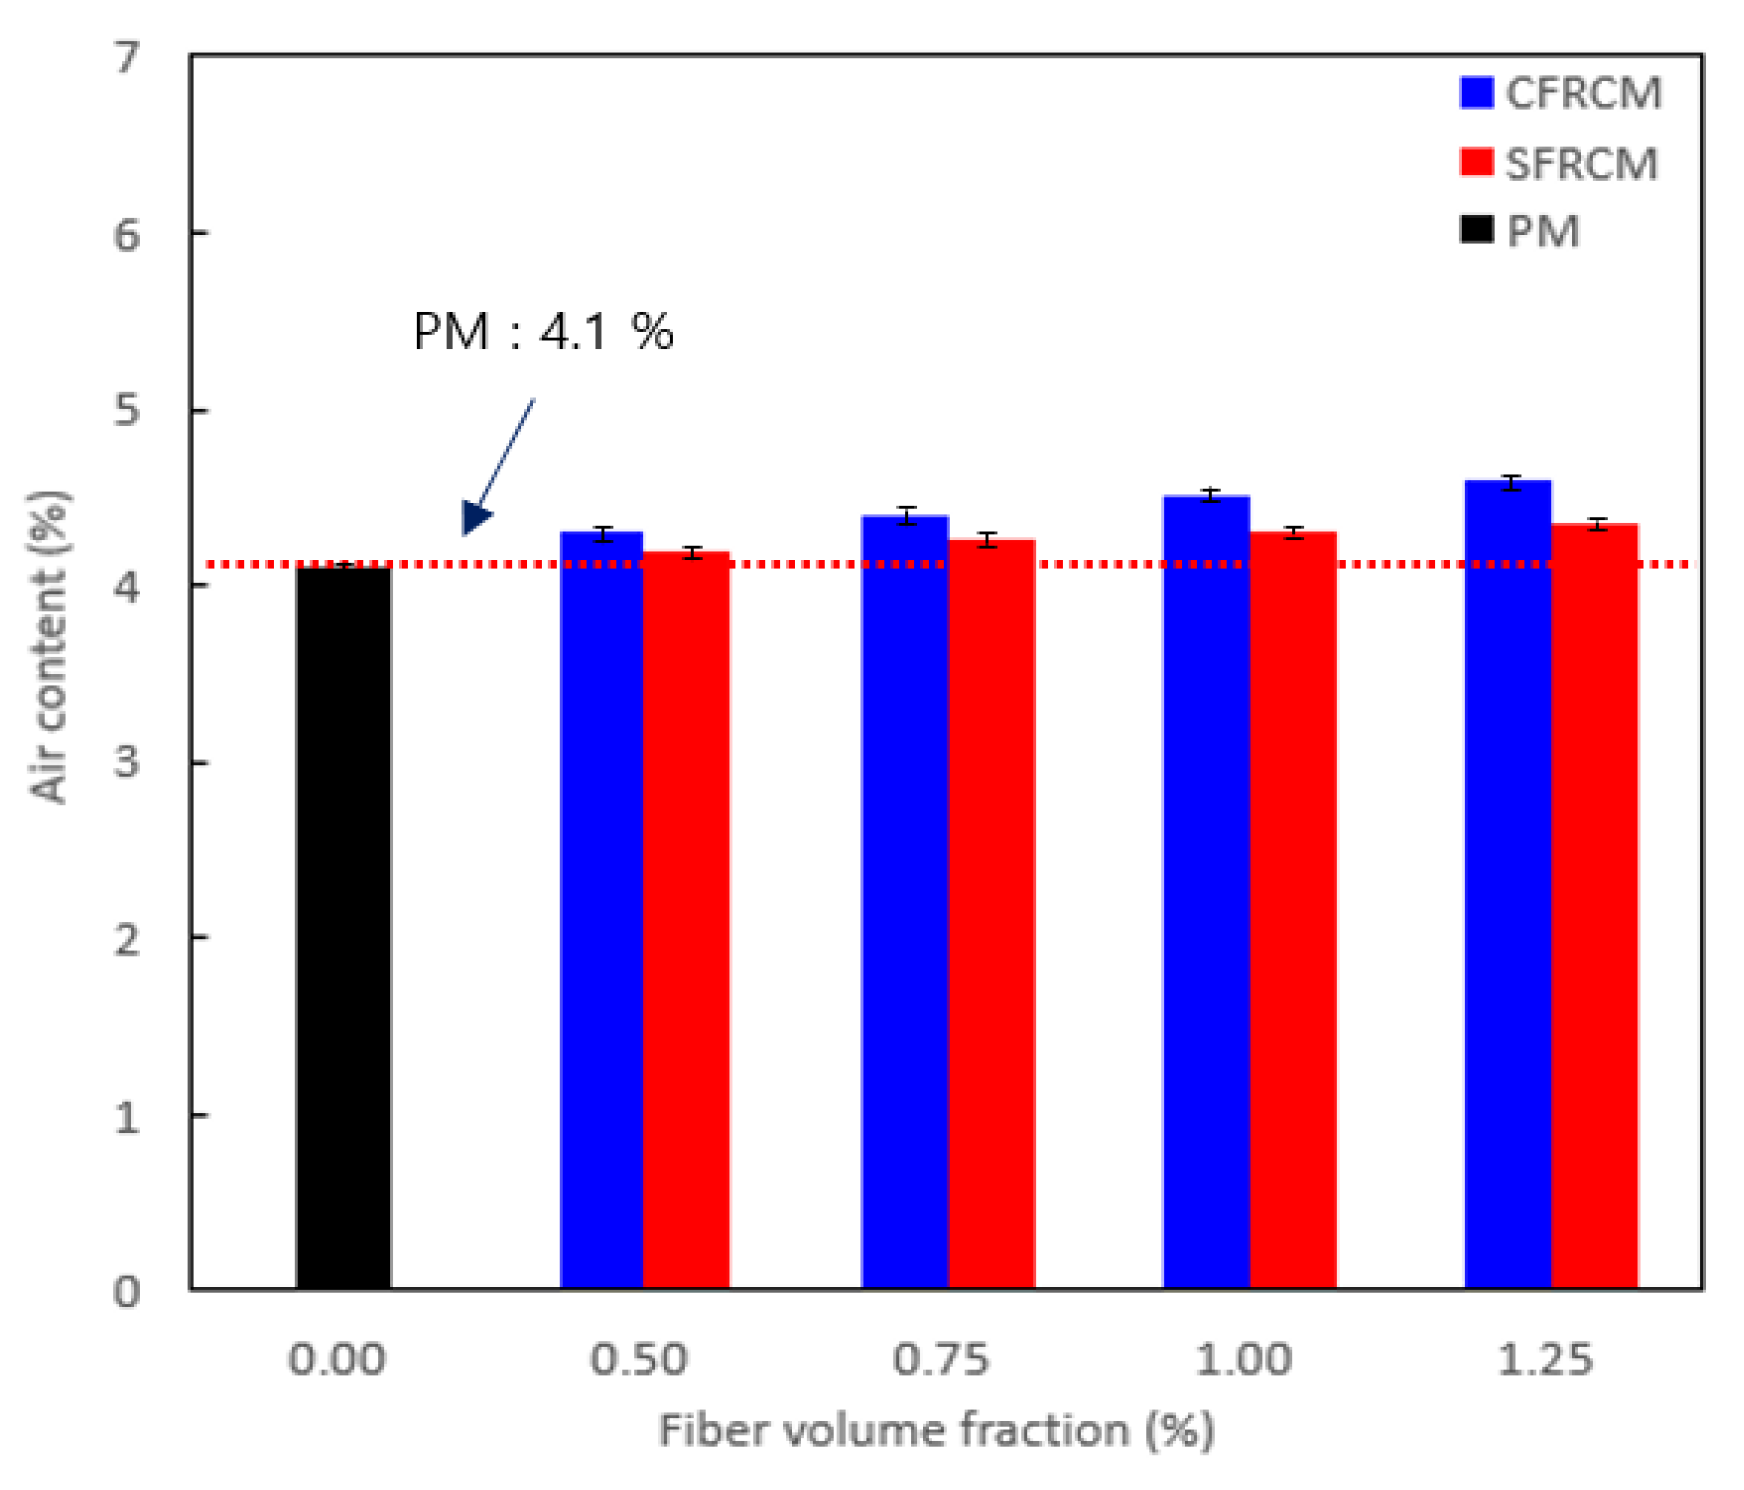
3.1.3. Air Content
3.2. Properties of Hardened Mortar
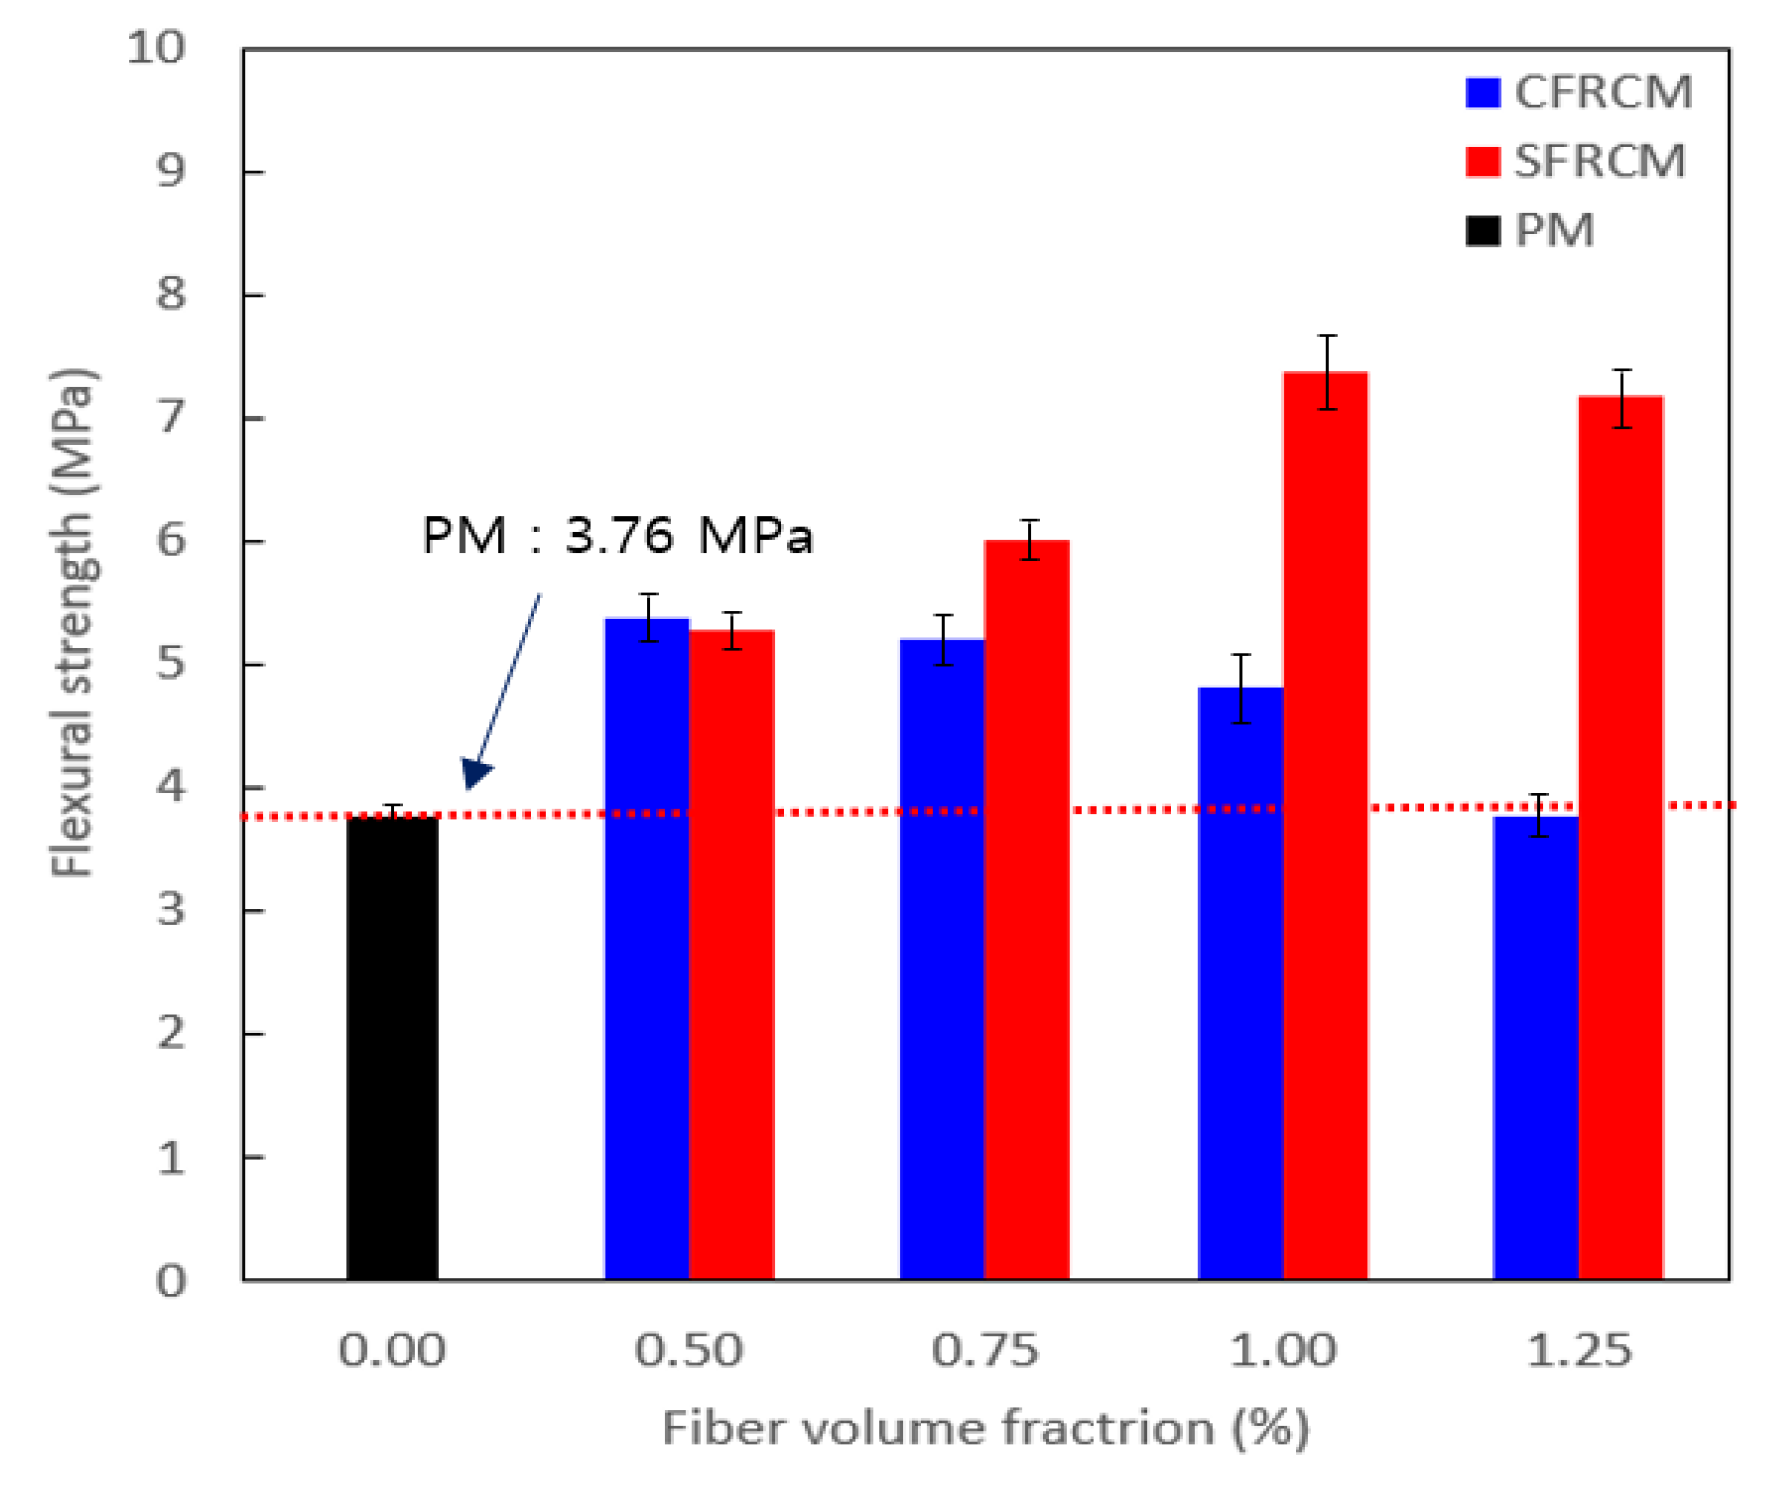
3.2.1. Flexural Strength
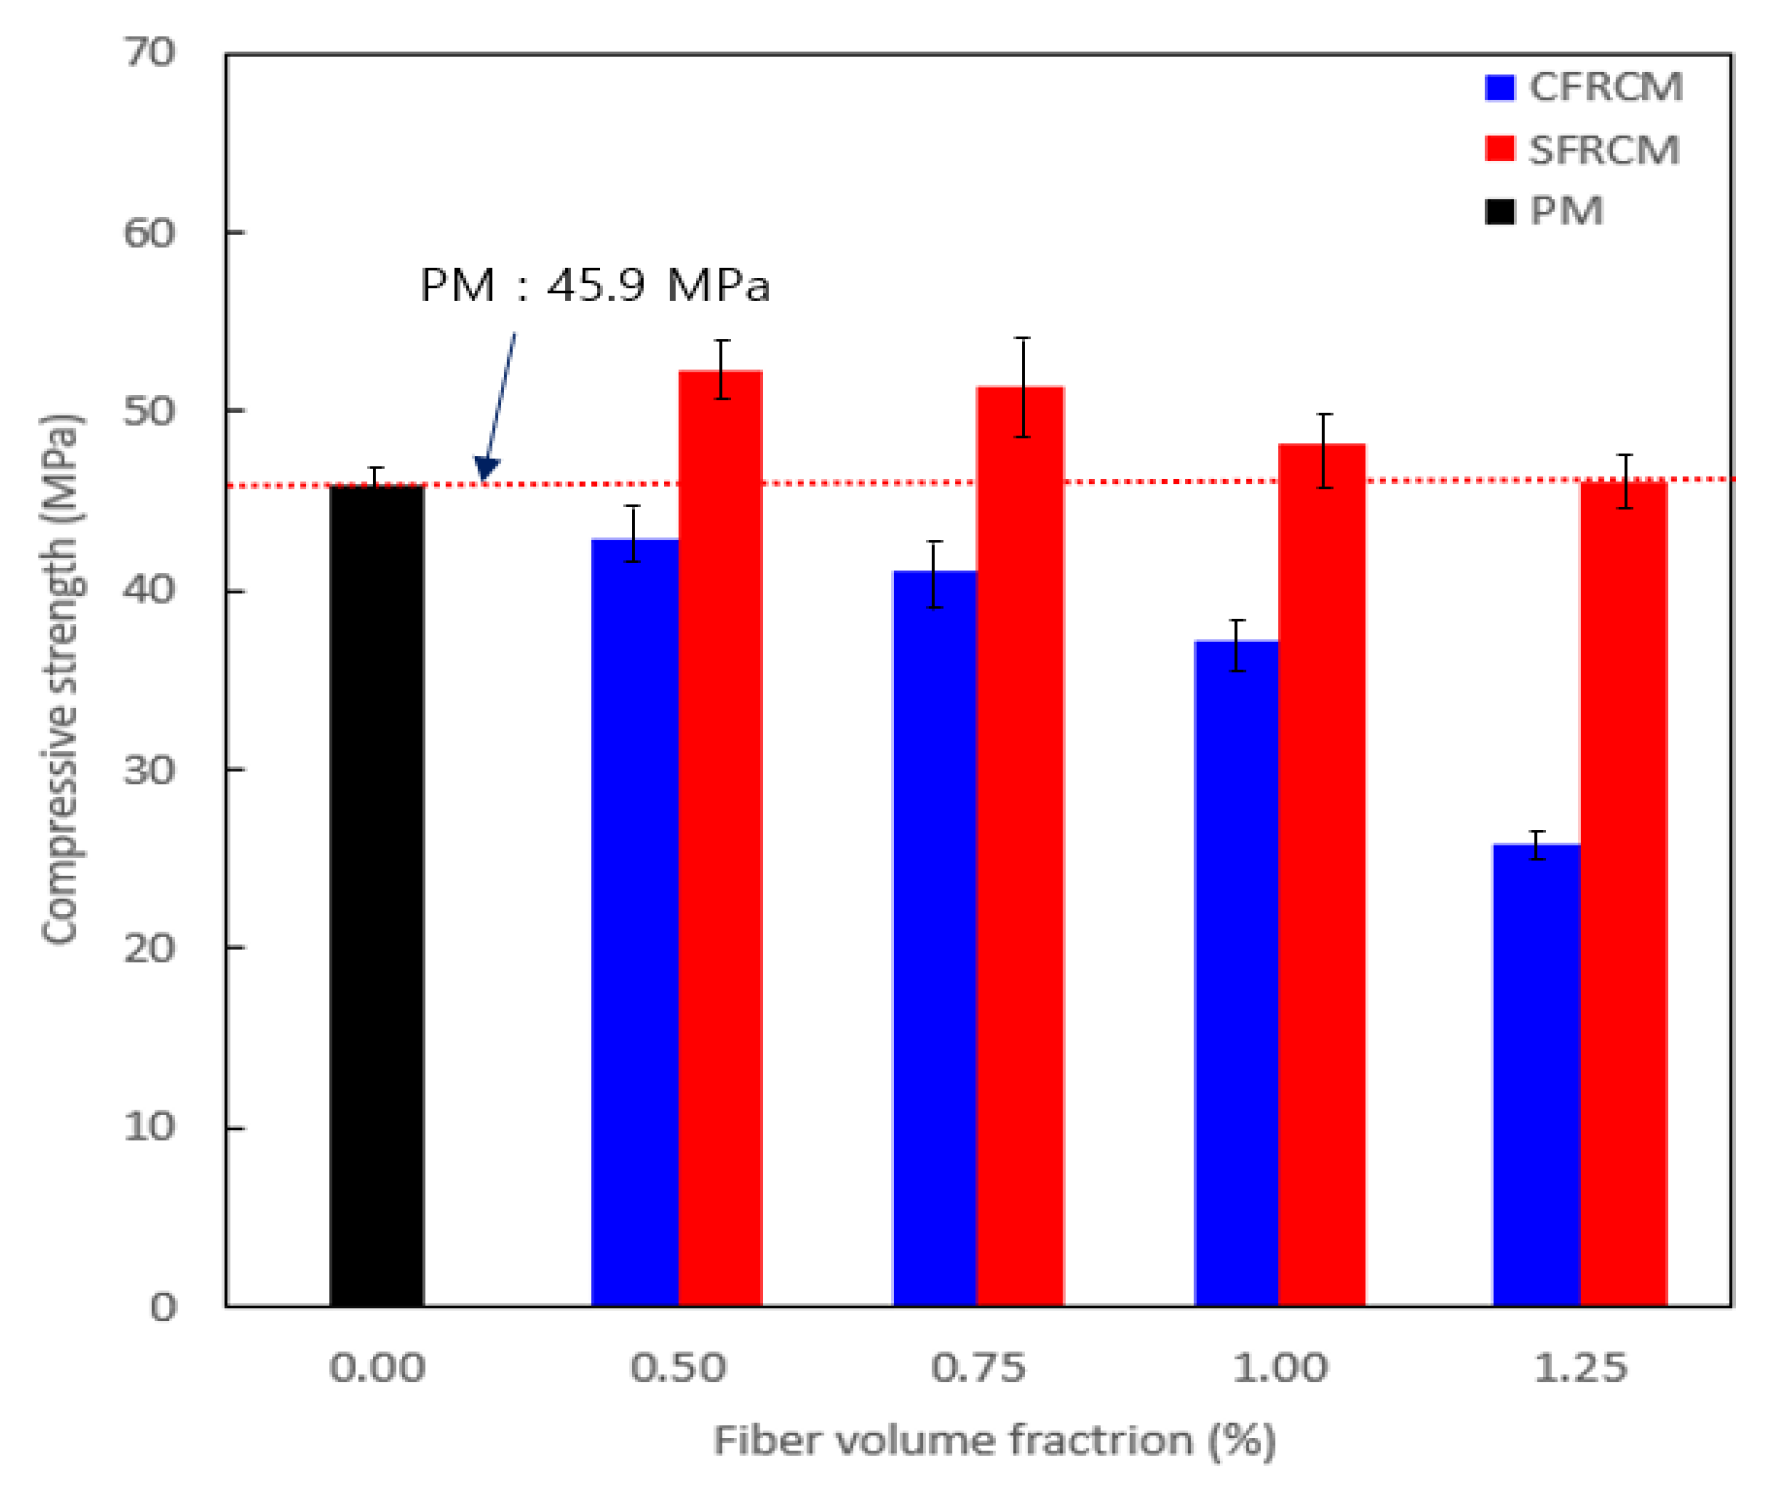
3.2.2. Compressive Strength
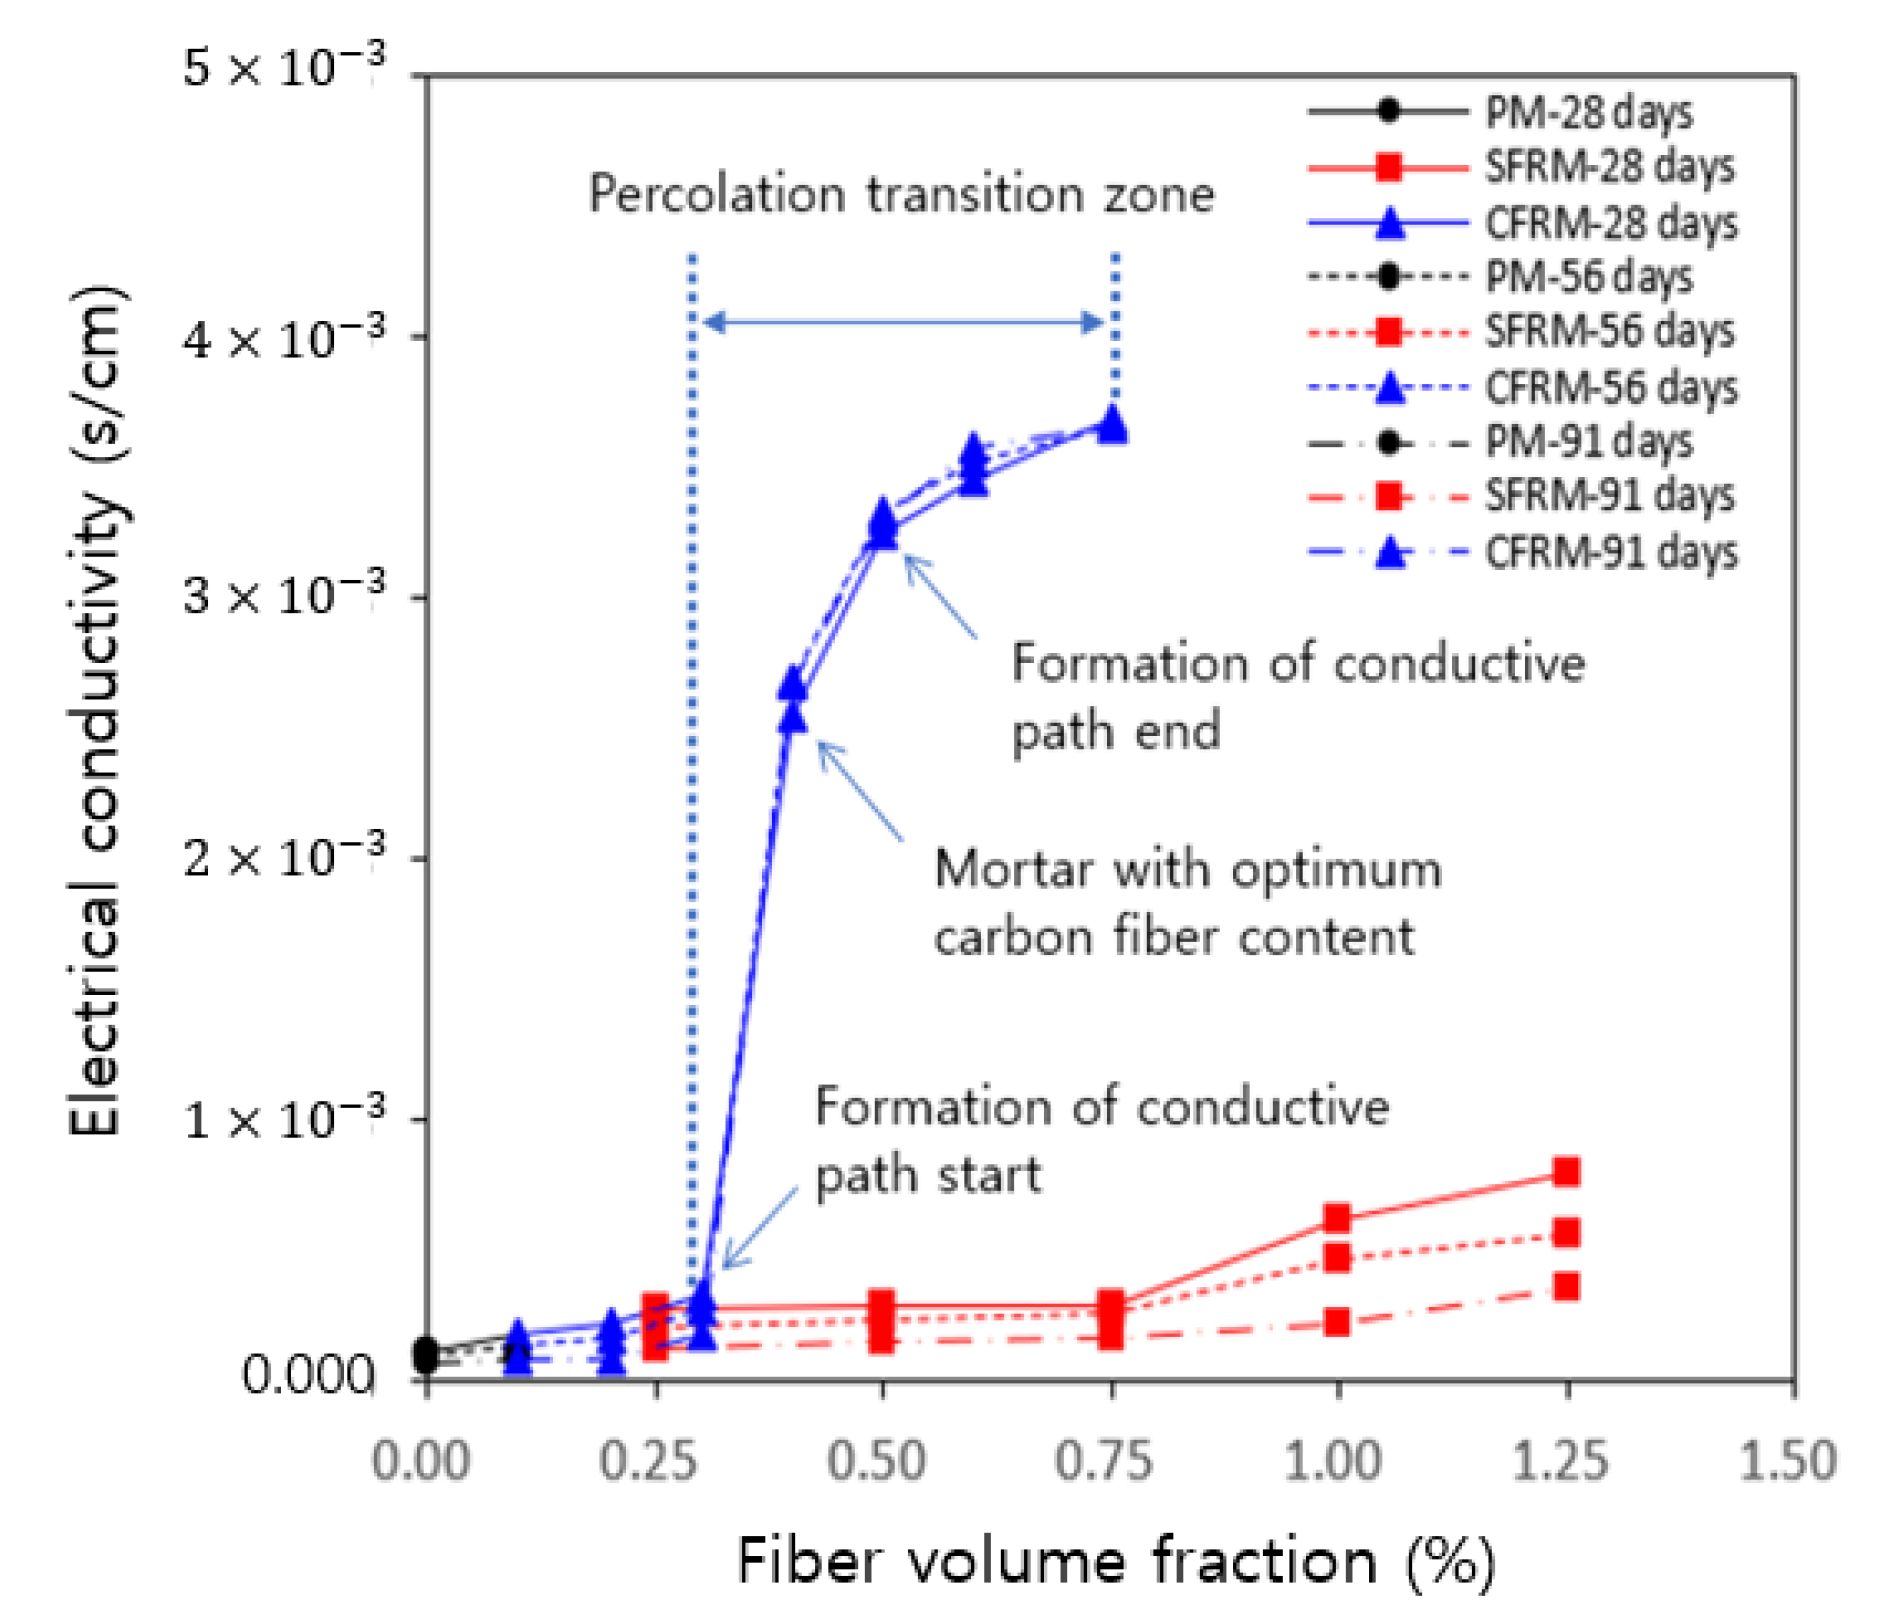
3.3. Electrical Conductivity of the Development CFRCM and SFRCM
3.4. Microstructure Analysis
4. Conclusions
- Although the target flow value of the mixture containing PM and steel fibers was satisfied, it appeared that the flow value was significantly reduced in the case of the carbon fibers compared to PM due to some absorption of mixed water during mixing.
- The unit weight could be reduced by about 3% or more as the volume fraction of carbon fibers increased, and decreased by about 12% or more compared to PM. On the other hand, it was found that the change in the air contents were relatively insignificant regardless of the fiber volume fractions.
- Both conductive CFRCM and SFRCM showed an overall increase in flexural strength compared to PM, and CFRCM had an effect of improving the flexural strength of about 0.3 to 43.1%, whereas SFRCM had a greater effect on improving the flexural strength of about 40.1 to 96.0%.
- The compressive strength of developed conductive SFRCM was generally higher than that of PM, whereas in the case of developed conductive CFRCM, the decreasing tendency was larger as the volume fraction of carbon fibers increased.
- The developed conductive CFRCM and SFRCM were clearly different in terms of electrical conductivity enhancement. In the case of CFRCM, the electrical conductivity increased significantly as the fiber dosages increased. However, incorporation of carbon fibers beyond the percolation threshold (i.e., 0.4%) does not develop conductivity because the conductive path is already formed.
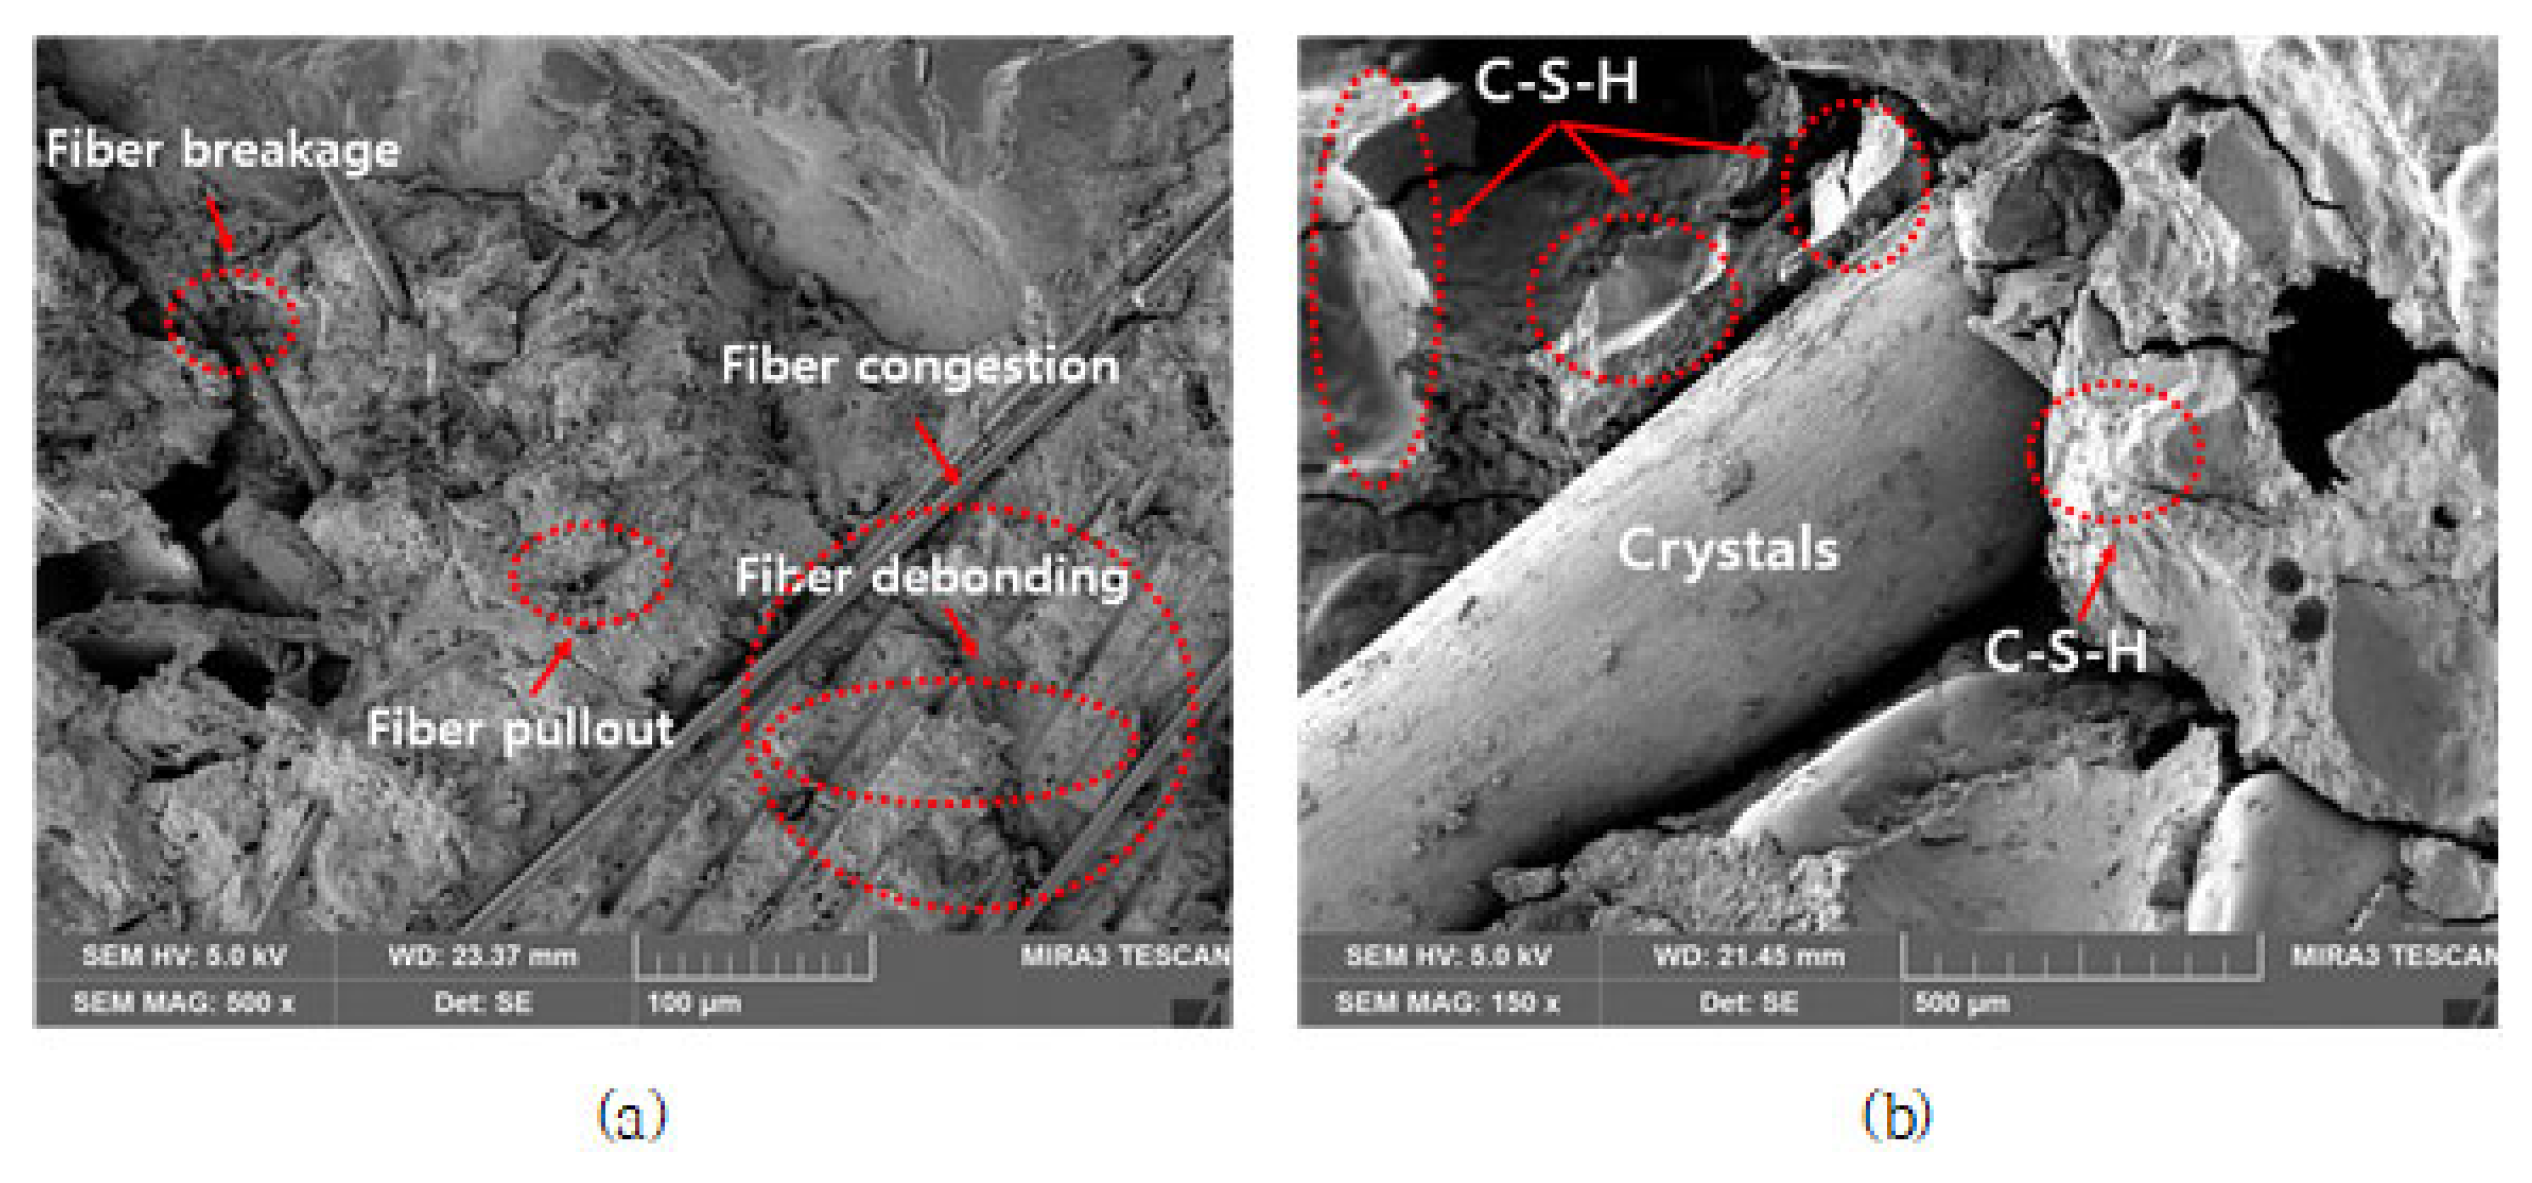
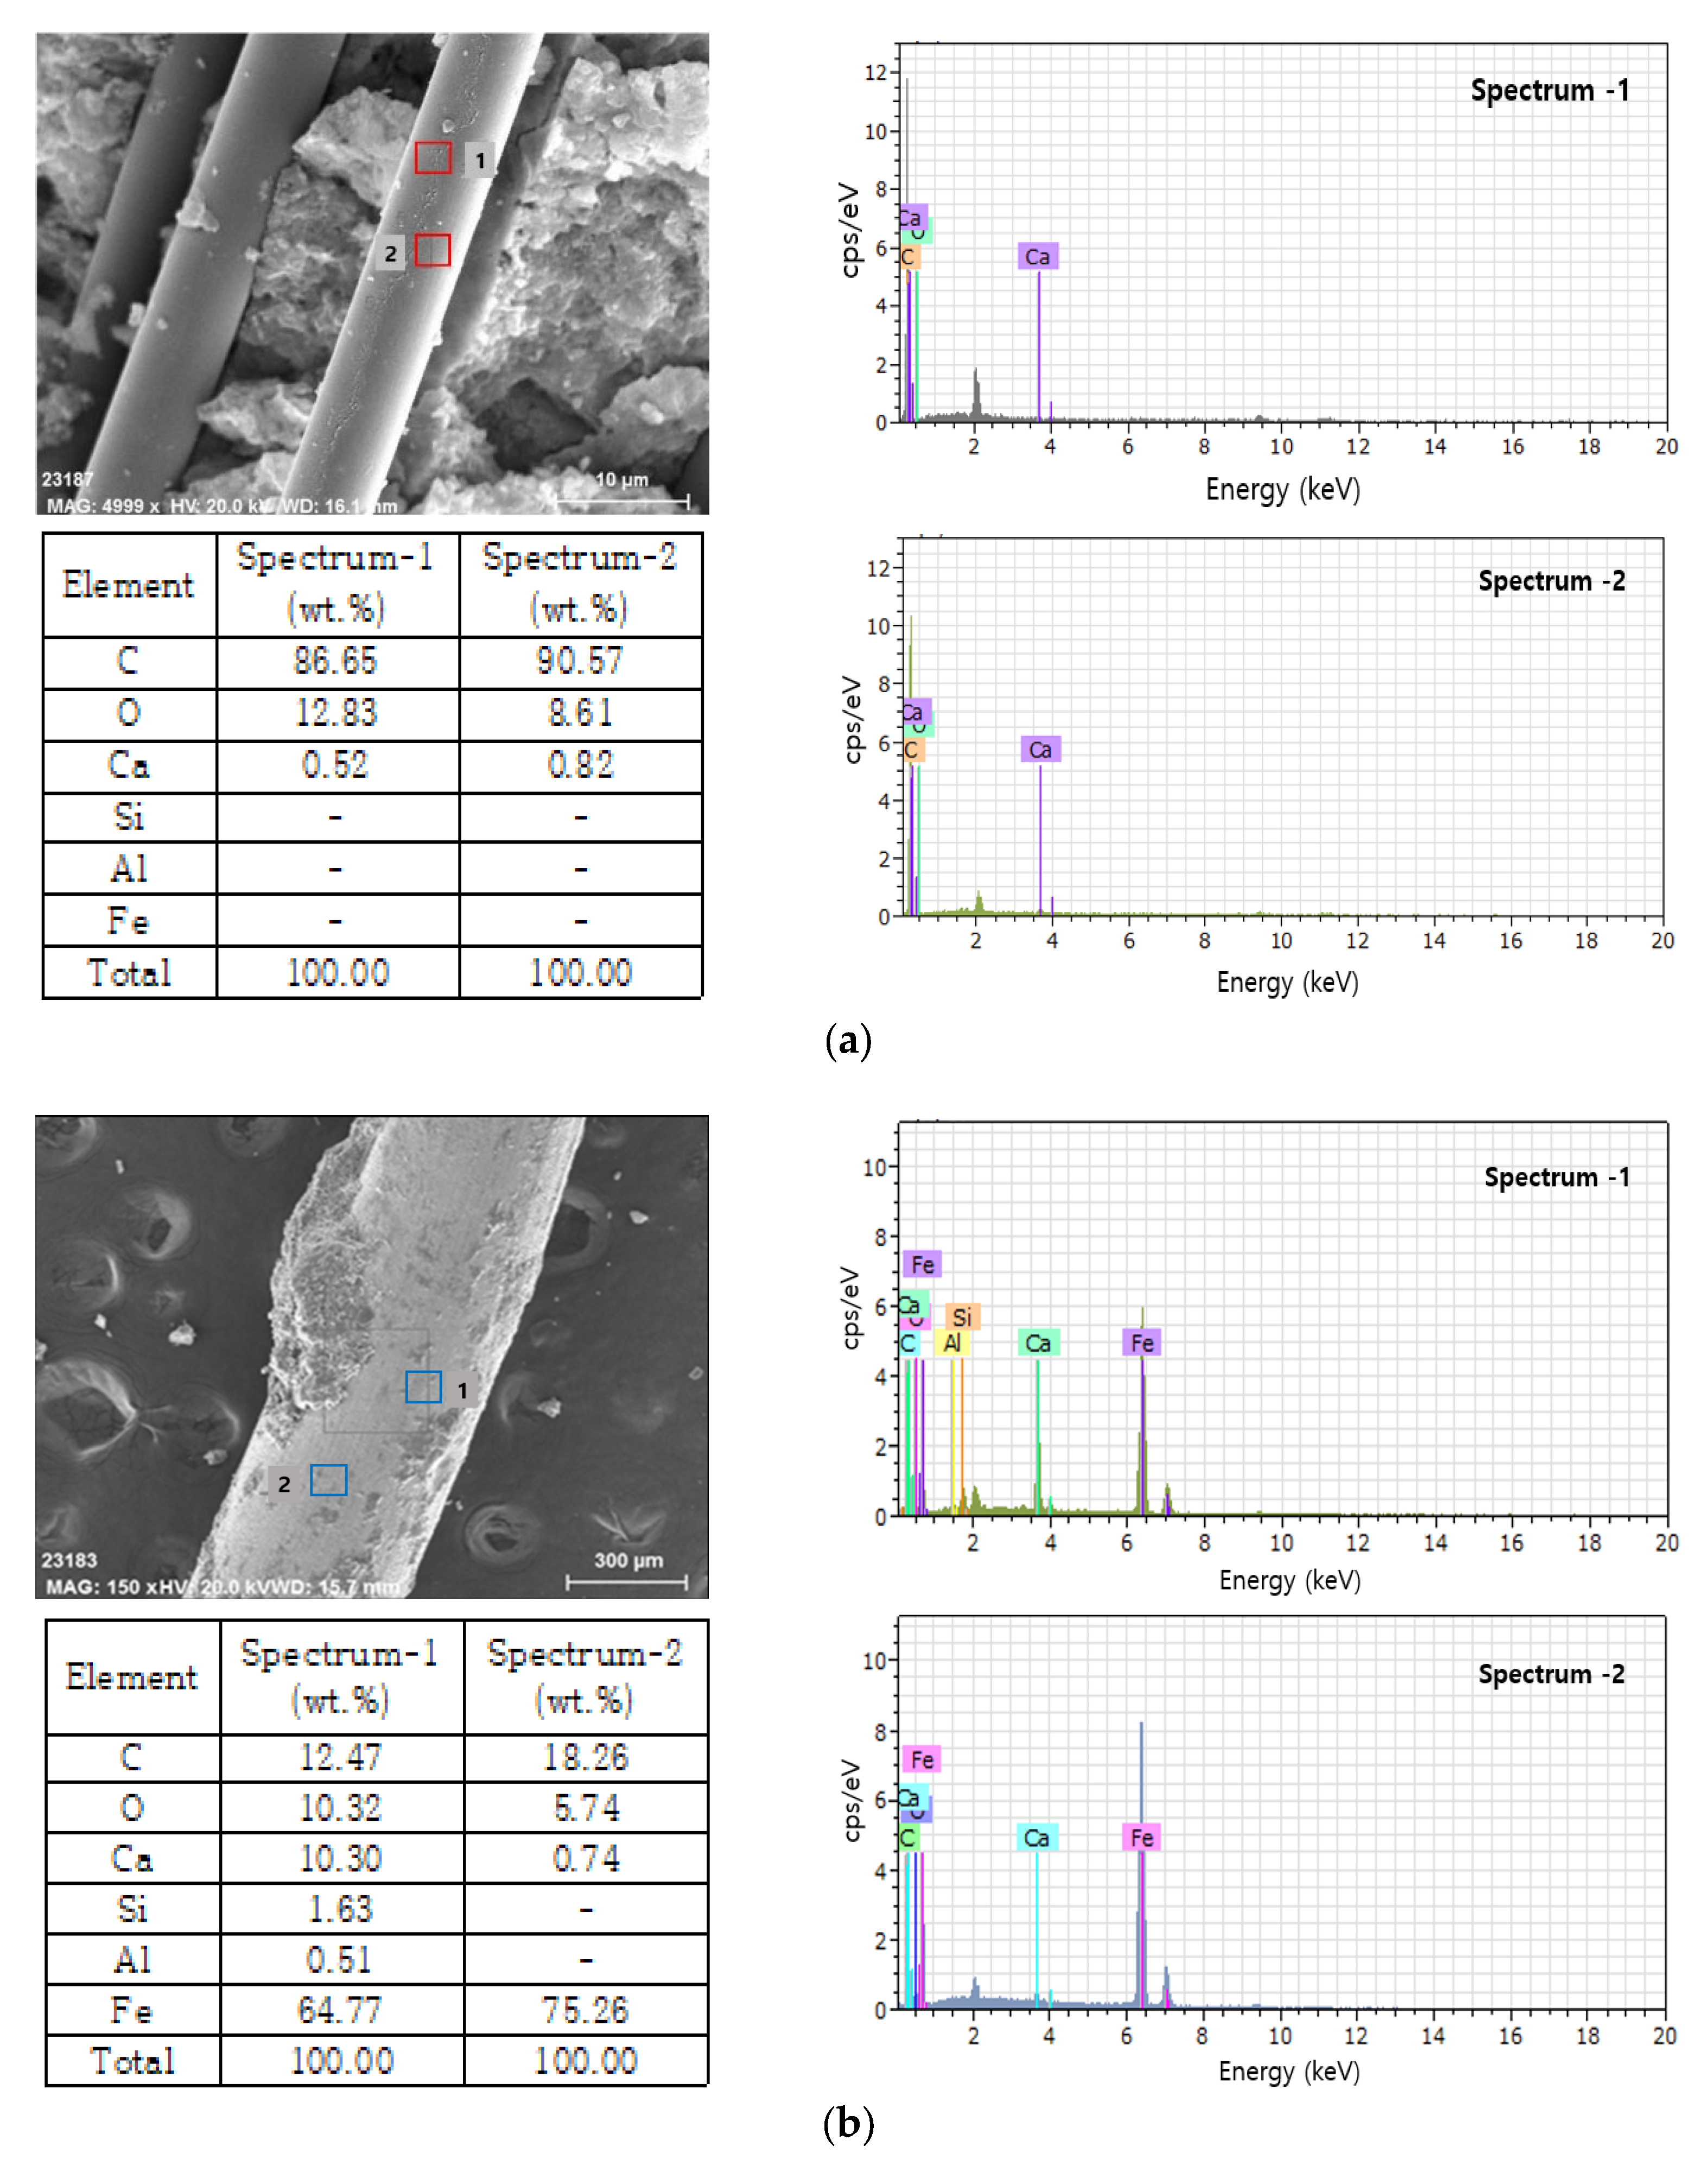
- The results of SEM/EDS analysis showed that in the case of SFRCM containing steel fibers, the interfacial adhesion force was superior to that of CFRCM containing carbon fibers because crystals of hydration product of cement were formed on the fiber surface and C-S-H gels were distributed within the cement mortar.
Author Contributions
Funding
Institutional Review Board Statement
Informed Consent Statement
Data Availability Statement
Acknowledgments
Conflicts of Interest
References
- Ma, Z.; Shen, J.; Wang, C.; Wu, H. Characterization of sustainable mortar containing high-quality recycled manufactured sand crushed from recycled coarse aggregate. Cem. Concr. Compos. 2022, 132, 1–18. [Google Scholar] [CrossRef]
- Li, V.C.; Wang, S.; Wu, C. Tensile strain-hardening behavior of polyvinyl alcohol engineered cementitious composite (PVC-ECC). ACI Mater. J. 2001, 98, 483–492. [Google Scholar]
- ACI 544.2R-89; Measurement of Properties of Fiber Reinforced Concrete (Reapproved 2009). ACI Committee 544: Farmington Hills, MI, USA, 2009.
- Brandt, A.M. Fibre reinforced cement-based (FRC) composites after over 40 years of development in building and civil engineering. Compos. Struct. 2008, 86, 3–9. [Google Scholar] [CrossRef]
- Kim, D.J.; Naaman, A.E.; El-Tawil, S. Comparative flexural behavior of four fiber reinforced cementitious composites. Cem. Concr. Compos. 2008, 30, 917–928. [Google Scholar] [CrossRef]
- Banthia, N.; Sappakittipakorn, M. Toughness enhancement in steel fiber reinforced concrete through fiber hybridization. Cem. Concr. Res. 2007, 37, 1366–1372. [Google Scholar] [CrossRef]
- Zhang, P.; Wang, C.; Gao, Z.; Wang, F. A review on fracture properties of steel fiber reinforced concrete. J. Build. Eng. 2023, 67, 1–23. [Google Scholar] [CrossRef]
- Tran, T.K.; Kim, D.J. High strain rate effects on direct tensile behavior of high performance fiber reinforced cementitious composites. Cem. Concr. Compos. 2014, 45, 186–200. [Google Scholar] [CrossRef]
- Dehghani, A.; Aslani, F. The effect of shape memory alloy, steel, and carbon fibres on fresh, mechanical, and electrical properties of self-compacting cementitious composites. Cem. Concr. Compos. 2020, 112, 103659. [Google Scholar] [CrossRef]
- You, I.H.; Lee, S.J.; Zi, G.S.; Lim, D.H. Influence of carbon fiber incorporation on electrical conductivity of cement composites. Appl. Sci. 2020, 10, 8993. [Google Scholar] [CrossRef]
- Hembach, M.; Möller, H.; Neumann, T.; Volkmer, D. Carbon fibre reinforced cement-based composites as smart floor heating materials. Compos. Part B Eng. 2016, 90, 465–470. [Google Scholar] [CrossRef]
- Yakhlaf, M.; Safiuddin, M.; Soudki, K.A. Properties of freshly mixed carbon fibre reinforced self-consolidating concrete. Constr. Build. Mater. 2013, 46, 224–231. [Google Scholar] [CrossRef]
- Urano, T.; Murakami, K.; Mitsui, Y.; Sakai, H. Study on the size effect of tensile characteristics of carbon fibre-reinforced cement composites. Compos. Part A Appl. Sci. Manuf. 1996, 27, 183–187. [Google Scholar] [CrossRef]
- Khaloo, A.; Raisi, E.M.; Hosseini, P.; Tahsiri, H. Mechanical performance of self-compacting concrete reinforced with steel fibers. Constr. Build. Mater. 2014, 51, 179–186. [Google Scholar] [CrossRef]
- Li, B.; Xu, L.; Chi, Y.; Huang, B.; Li, C. Experimental investigation on the stress-strain behavior of steel fiber reinforced concrete subjected to uniaxial cyclic compression. Constr. Build. Mater. 2017, 140, 109–118. [Google Scholar] [CrossRef]
- Frazão, C.; Barros, J.; Camões, A.; Alves, A.C.; Rocha, L. Corrosion effects on pullout behavior of hooked steel fibers in self-compacting concrete. Cem. Concr. Res. 2016, 79, 112–122. [Google Scholar] [CrossRef] [Green Version]
- Holschemacher, K.; Mueller, T.; Ribakov, Y. Effect of steel fibres on mechanical properties of high-strength concrete. Mater. Des. 2009, 31, 2604–2615. [Google Scholar] [CrossRef]
- Mastali, M.; Dalvand, A. Use of silica fume and recycled steel fibers in self-compacting concrete (SCC). Constr. Build. Mater. 2016, 125, 196–209. [Google Scholar] [CrossRef]
- Barluenga, G.; Hernández-Olivares, F. Cracking control of concretes modified with short AR-glass fibers at early age. Experimental results on standard concrete and SCC. Cem. Concr. Res. 2007, 37, 1624–1638. [Google Scholar] [CrossRef]
- Mebarkia, S.; Vipulanandan, C. Compressive behavior of glass-fiber reinforced polymer concrete. Am. Soc. Civ. Eng. 1992, 4, 91–105. [Google Scholar] [CrossRef]
- Tassew, S.T.; Lubell, A.S. Mechanical properties of glass fiber reinforced ceramic concrete. Constr. Build. Mater. 2014, 51, 215–224. [Google Scholar] [CrossRef]
- Monaldo, E.; Nerilli, F.; Vairo, G. Basalt-based fiber reinforced materials and structural applications in civil engineering. Compos. Struct. 2019, 214, 246–263. [Google Scholar] [CrossRef]
- Shafiq, N.; Ayub, T.; Khan, S.U. Investigating the performance of PVA and basalt fibre reinforced beams subjected to flexural action. Compos. Struct. 2016, 153, 30–41. [Google Scholar] [CrossRef]
- Ralegaonkar, R.; Gavali, H.; Aswath, P.; Abolmaali, S. Application of chopped basalt fibers in reinforced mortar: A review. Constr. Build. Mater. 2018, 164, 589–602. [Google Scholar] [CrossRef]
- Rybin, V.A.; Utkin, A.V.; Baklanova, N.I. Alkali resistance, microstructural and mechanical performance of zirconia-coated basalt fibers. Cem. Concr. Res. 2013, 53, 1–8. [Google Scholar] [CrossRef]
- Alhozaimy, A.M.; Soroushian, P.; Mirza, F. Mechanical properties of polypropylene fiber reinforced concrete and the effects of pozzolanic materials. Cem. Concr. Compos. 1996, 18, 85–92. [Google Scholar] [CrossRef]
- Thong, C.C.; Teo, D.C.L.; Ng, C.K. Application of polyvinyl alcohol (PVA) in cement-based composite materials: A review of its engineering properties and microstructure behavior. Constr. Build. Mater. 2016, 107, 172–180. [Google Scholar] [CrossRef]
- Song, P.S.; Hwang, S.; Sheu, B.C. Strength properties of nylon- and polypropylene-fiber-reinforced concretes. Cem. Concr. Res. 2005, 35, 1546–1550. [Google Scholar] [CrossRef]
- Zhang, P.; Liu, C.H.; Li, Q.F.; Zhang, T.H. Effect of polypropylene fiber on fracture properties of cement treated crushed rock, Compos. Part B Eng. 2013, 55, 48–54. [Google Scholar] [CrossRef]
- Zhang, P.; Li, Q.; Wang, J.; Shi, Y.; Zheng, Y.; Ling, Y. Effect of nano-particle on durability of polyvinyl alcohol fiber reinforced cementitious composite. Sci. Adv. Mater. 2020, 12, 249–262. [Google Scholar] [CrossRef]
- Wang, Y.; Li, V.C.; Backer, S. Tensile properties of synthetic fiber reinforced mortar. Cem. Concr. Compos. 1990, 12, 29–40. [Google Scholar] [CrossRef]
- El-Dieb, A.S.; El-Ghareeb, M.A.; Abdel-Rahman, M.A.; El Sayed, A.N. Multifunctional electrically conductive concrete using different fillers. J. Build. Eng. 2018, 15, 61–69. [Google Scholar] [CrossRef]
- Whittington, H.W.; McCarter, J.; Forde, M.C. The conduction of electricity through concrete. Mag. Concr. Res. 1981, 33, 48–60. [Google Scholar] [CrossRef]
- Kang, S.H. Electrically conductive concrete. J. Korea Concr. Inst. 1998, 10, 34–40. [Google Scholar]
- Belli, A.; Mobili, A.; Bellezze, T.; Tittarelli, F. Commercial and recycled carbon/steel fibers for fiber-reinforced cement mortars with high electrical conductivity. Cem. Concr. Compos. 2020, 109, 103569. [Google Scholar] [CrossRef]
- Yildirim, G.; Sarwary, M.H.; Al-Dahawi, A.; Öztürk, O.; Anil, Ö.; Şahmaran, M. Piezoresistive behavior of CF- and CNT based reinforced concrete beams subjected to static flexural loading: Shear failure investigation. Constr. Build. Mater. 2018, 168, 266–279. [Google Scholar] [CrossRef]
- Yildirim, G.; Öztürk, O.; Al-Dahawi, A.; Ulu, A.A.; Şahmaran, M. Self-sensing capability of Engineered Cementitious Composites: Effects of aging and loading conditions. Constr. Build. Mater. 2020, 231, 117132. [Google Scholar] [CrossRef]
- Li, H.; Xiao, H.G.; Ou, J.P. A study on mechanical and pressure-sensitive properties of cement mortar with nanophase materials. Cem. Concr. Res. 2004, 34, 435–438. [Google Scholar] [CrossRef]
- Chiarello, M.; Zinno, R. Electrical conductivity of self-monitoring CFRC. Cem. Concr. Compos. 2005, 27, 463–469. [Google Scholar] [CrossRef]
- Sarwary, M.H.; Yildirim, G.; Al-Dahawi, A.; Anil, Ö.; Khiavi, K.A.; Toklu, K.; Şahmaran, M. Self-sensing of flexural damage in large-scale steel-reinforced mortar beams. ACI Mater. J. 2019, 116, 209–221. [Google Scholar] [CrossRef]
- Han, B.; Yu, X.; Kwon, E. A self-sensing carbon nanotube/cement composite for traffic monitoring. Nanotechnology 2009, 20, 445501. [Google Scholar] [CrossRef]
- Shi, Z.Q.; Chung, D.D.L. Carbon fiber-reinforced concrete for traffic monitoring and weighing in motion. Cem. Concr. Res. 1999, 29, 435–439. [Google Scholar] [CrossRef]
- Sassani, A.; Arabzadeh, A.; Ceylan, H.; Kim, S.H.; Sajed Sadati, S.M.; Gopalakrishnan, K.; Taylor, P.C.; Abdualla, H. Carbon fiber-based electrically conductive concrete for salt-free deicing of pavements. J. Clean. Prod. 2018, 203, 799–809. [Google Scholar] [CrossRef]
- Wu, J.; Lui, J.; Yang, F. Three-phase composite conductive concrete for pavement deicing. Constr. Build. Mater. 2015, 75, 129–135. [Google Scholar] [CrossRef]
- Sassani, A.; Ceylan, H.; Kim, S.H.; Arabzadeh, A.; Taylor, P.C.; Gopalakrishnan, K. Development of carbon fiber-modified electrically conductive concrete for implementation in Des Moines International Airport. Case Stud. Constr. Mater. 2018, 8, 277–291. [Google Scholar] [CrossRef]
- James, A.; Bazarchi, E.; Chiniforush, A.A.; Aghdam, P.P.; Hosseini, M.R.; Akbarnezhad, A.; Martek, I.; Ghodoosi, F. Rebar corrosion detection, protection, and rehabilitation of reinforced concrete structures in coastal environments: A review. Constr. Build. Mater. 2019, 224, 1026–1039. [Google Scholar] [CrossRef]
- Purba, M.; Purba, A. The effect of conductive cement as an grounding media of electrode on earth resistance. ResearchGate 2019, 7, 1337–1344. [Google Scholar]
- Chiou, J.-M.; Zheng, Q.; Chung, D.D.L. Electromagnetic interference shielding by carbon fibre reinforced cement. Composites 1989, 20, 379–381. [Google Scholar] [CrossRef]
- Jung, M.J.; Lee, Y.S.; Hong, S.G.; Moon, J.H. Carbon nanotubes (CNTs) in ultra-high performance concrete (UHPC): Dispersion, mechanical properties, and electromagnetic interference (EMI) shielding effectiveness (SE). Cem. Concr. Res. 2020, 131, 106017. [Google Scholar] [CrossRef]
- KS L 5111; Flow Table for use in Tests of Hydraulic Cement. Korean Agency for Technology and Standards (KATS): Eumseong County, Republic of Korea, 2017.
- KS F 2409; Standard Test Method for Unit Weight and Air Content (Gravimetric) of Fresh Concrete. Korean Agency for Technology and Standards (KATS): Eumseong County, Republic of Korea, 2016.
- KS L 3136; Testing Method for Air Content of Hydraulic Cement Mortar. Korean Agency for Technology and Standards (KATS): Eumseong County, Republic of Korea, 2015.
- KS L ISO 679; Methods of Testing Cements-Determination of Strength. Korean Agency for Technology and Standards (KATS): Eumseong County, Republic of Korea, 2016.
- Han, B.; Guan, X.; Ou, J. Electrode design, measuring method and data acquisition system of carbon fiber cement paste piezoresistive sensors. Sens. Actuators A Phys. 2007, 135, 360–369. [Google Scholar] [CrossRef]
- Wen, S.; Chung, D.D.L. Double percolation in the electrical conduction in carbon fiber reinforced cement-based materials. Carbon 2007, 45, 263–267. [Google Scholar] [CrossRef]
- Heo, G.H.; Park, J.G.; Song, K.C.; Park, J.H.; Jun, H.M. Mechanical properties of SiO2-coated carbon fiber-reinforced mortar composites with different fiber length and fiber volume fractions. Adv. Civ. Eng. 2020, 2020, 8881273. [Google Scholar] [CrossRef]
- Chen, B.; Wu, K.; Yao, W. Conductivity of carbon fiber reinforced cement-based composites. Cem. Concr. Compos. 2004, 26, 291–297. [Google Scholar] [CrossRef]
- Xie, P.; Gu, P.; Beaudoin, J.J. Electrical percolation phenomena in cement composites containing conductive fibres. J. Mater. Sci. 1996, 31, 4093–4097. [Google Scholar] [CrossRef]
- Chang, D.D.L. Cement reinforced with short carbon fibers: A multifunctional material. Compos. Part B Eng. 2000, 31, 511–526. [Google Scholar] [CrossRef]
- Lee, N.K.; Park, G.J.Y.; Jung, J.J.; Kim, S.W. A study on the electrical conductivity and electromagnetic shielding of high performance fiber reinforced cementitious composites. J. Korea Inst. Struct. Maint. Inspec. 2019, 23, 37–43. [Google Scholar]
- Scrivener, K.L.; Crumbie, A.K.; Laugesen, P. The interfacial transition zone (ITZ) between cement paste and aggregate in concrete. Interface Sci. 2004, 12, 411–421. [Google Scholar] [CrossRef]
- Metha, P.K. Concrete-Structure, Properties, and Materials; Prentice-Hall: Englewood Cliffs, NJ, USA, 1986; pp. 64–69. [Google Scholar]

| Factors | Levels | ||
|---|---|---|---|
| Mixtures | W/C (%) | 45 | |
| C:S (cement: sand) | 1:2 | ||
| Target compressive strength | 35 | ||
| Target flow (mm) | Over 180 | ||
| Mechanical properties (Group I) | Volume fractions (%) | 0.5, 0.75, 1.0, 1.25 | |
| Electrical conductivity (Group II) | Volume fractions (%) | Carbon: 0.1, 0.2, 0.3, 0.4, 0.5, 0.6, 0.75 Steel: 0.25, 0.5, 0.75, 1.0 1.25 | |
| Experimental content | Fresh mortar | · Flow test · Unit weight test · Air content test | |
| Hardened mortar | · Compressive test (MPa): 28 days · Flexural test (MPa): 28 days · Electrical conductivity: 28, 56, 91 days · SEM/EDS analysis | ||
| Density (g/cm3) | Fineness (cm2/g) | SiO2 (%) | Al2O3 (%) | Fe2O3 (%) | CaO (%) | MgO (%) | Na2O (%) | K2O (%) | SO3 (%) | F-CaO (%) | Ignition Loss (%) |
|---|---|---|---|---|---|---|---|---|---|---|---|
| 3.15 | 3710 | 21.47 | 6.21 | 3.70 | 59.24 | 2.08 | 0.13 | 1.08 | 2.48 | 0.57 | 2.87 |
| G-Max (mm) | Unit Weight (kg/m3) | Density (g/cm3) | Absorption (%) | Amount of Passing 0.3 mm Sieve (%) | Fineness Modulus (FM) |
|---|---|---|---|---|---|
| 2≤ | 1490 | 2.65 | 0.1 | 3.0 | 2.40 |
| Density (g/mm3) | Type | Color | pH | Main Ingredient | Brand |
|---|---|---|---|---|---|
| 1.04 | Liquid | Light original or light yellow | 5.0 ± 1.5 | Polycarboxylate | Flowmix 3000E |
| Properties | Carbon Fiber (CF) | Steel Fiber (SF) |
|---|---|---|
| Shape | Straight | Hook-end |
| Length, l (mm) | 6 | 30 |
| Diameters, d (mm) | 0.007 | 0.5 |
| Aspect ratio (l/d) | 857 | 60 |
| Density (t/m3) | 1.8 | 7.85 |
| Tensile strength (MPa) | 4900 | 1100 |
| Elastic modulus (GPa) | 230 | 210 |
| Electrical resistivity (Ω.cm) | 1.6 × 10⁻³ | 1.57 × 10⁻⁴ |
| Type of fibers | Straight | Hook-end |
| Appearances |  | 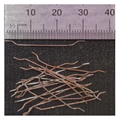 |
| SEM images |  | 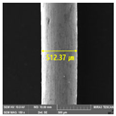 |
| Division | Mix ID | W/C 1 | C/S 2 | Material Dosage (kg/m3) | Fiber Volume Fractions (%) | SP 3 (C×%) | |||
|---|---|---|---|---|---|---|---|---|---|
| Water | Cement | Sand | CF | SF | |||||
| Mechanical properties (Group I) | Carbon50 | 0.45 | 1:2 | 297 | 660 | 1320 | 0.50 | - | 0.5 |
| Carbon75 | 0.75 | - | |||||||
| Carbon100 | 1.00 | - | |||||||
| Carbon125 | 1.25 | - | |||||||
| Steel50 | - | 0.50 | - | ||||||
| Steel75 | - | 0.75 | |||||||
| Steel100 | - | 1.00 | |||||||
| Steel125 | - | 1.25 | |||||||
| Electrical conductivity (Group II) | Carbon10 | 0.45 | 1:2 | 297 | 660 | 1320 | 0.10 | - | 0.5 |
| Carbon20 | 0.20 | - | |||||||
| Carbon30 | 0.30 | - | |||||||
| Carbon40 | 0.40 | - | |||||||
| Carbon50 | 0.50 | - | |||||||
| Carbon60 | 0.60 | - | |||||||
| Carbon75 | 0.75 | - | |||||||
| Steel25 | - | 0.25 | |||||||
| Steel50 | - | 0.50 | |||||||
| Steel75 | - | 0.75 | |||||||
| Steel100 | - | 1.00 | |||||||
| Steel125 | - | 1.25 | |||||||
| PM | 0.45 | 1:2 | 297 | 660 | 1320 | - | - | - | |
| Mixture ID | Fiber Volume Fractions (%) | Average Electrical Conductivity, σ (S/cm) | |||
|---|---|---|---|---|---|
| CF | SF | 28 Days | 56 Days | 91 Days | |
| Carbon10 | 0.10 | - | 1.71 × 10⁻⁴ (12.3 × 10⁻⁵) | 1.37 × 10⁻⁴ (11.8 × 10⁻⁵) | 7.44 × 10⁻⁵ (7.80 × 10⁻⁶) |
| Carbon20 | 0.20 | - | 2.16 × 10⁻⁴ (4.00 × 10⁻⁵) | 1.62 × 10⁻⁴ (3.64 × 10⁻⁵) | 7.67 × 10⁻⁵ (9.01 × 10⁻⁶) |
| Carbon30 | 0.30 | - | 3.25 × 10⁻⁴ (5.54 × 10⁻⁵) | 2.63 × 10⁻⁴ (5.50 × 10⁻⁵) | 1.78 × 10⁻⁴ (3.62 × 10⁻⁵) |
| Carbon40 | 0.40 | - | 2.54 × 10⁻³ (3.37 × 10⁻⁴) | 2.67 × 10⁻³ (2.97 × 10⁻⁴) | 2.66 × 10⁻³ (2.23 × 10⁻⁴) |
| Carbon50 | 0.50 | - | 3.23 × 10⁻³ (9.24 × 10⁻⁴) | 3.32 × 10⁻³ (9.61 × 10⁻⁴) | 3.29 × 10⁻³ (9.69 × 10⁻⁴) |
| Carbon60 | 0.60 | - | 3.45 × 10⁻³ (1.08 × 10⁻³) | 3.51 × 10⁻³ (1.08 × 10⁻³) | 3.57 × 10⁻³ (1.11 × 10⁻³) |
| Carbon75 | 0.75 | - | 3.68 × 10⁻³ (1.13 × 10⁻³) | 3.65 × 10⁻³ (1.15 × 10⁻³) | 3.64 × 10⁻³ (1.19 × 10⁻³) |
| Steel25 | - | 0.25 | 2.65 × 10⁻⁴ (3.76 × 10⁻⁵) | 2.06 × 10⁻⁴ (3.01 × 10⁻⁵) | 1.19 × 10⁻⁴ (2.05 × 10⁻⁵) |
| Steel50 | - | 0.50 | 2.79 × 10⁻⁴ (1.10 × 10⁻⁵) | 2.31 × 10⁻⁴ (1.19 × 10⁻⁵) | 1.49 × 10⁻⁴ (1.40 × 10⁻⁵) |
| Steel75 | - | 0.75 | 2.87 × 10⁻⁴ (3.18 × 10⁻⁵) | 2.58 × 10⁻⁴ (2.89 × 10⁻⁵) | 1.57 × 10⁻⁴ (2.46 × 10⁻⁵) |
| Steel100 | - | 1.00 | 6.12 × 10⁻⁴ (1.21 × 10⁻⁴) | 4.57 × 10⁻⁴ (8.89 × 10⁻⁵) | 2.18 × 10⁻⁴ (5.10 × 10⁻⁵) |
| Steel125 | - | 1.25 | 7.94 × 10⁻⁴ (3.80 × 10⁻⁴) | 5.51 × 10⁻⁴ (1.17 × 10⁻⁴) | 3.57 × 10⁻⁴ (1.41 × 10⁻⁴) |
| PM | - | - | 1.05 × 10⁻⁴ (5.01 × 10⁻⁶) | 8.66 × 10⁻⁵ (6.70 × 10⁻⁶) | 6.18 × 10⁻⁵ (1.18 × 10⁻⁵) |
Disclaimer/Publisher’s Note: The statements, opinions and data contained in all publications are solely those of the individual author(s) and contributor(s) and not of MDPI and/or the editor(s). MDPI and/or the editor(s) disclaim responsibility for any injury to people or property resulting from any ideas, methods, instructions or products referred to in the content. |
© 2023 by the authors. Licensee MDPI, Basel, Switzerland. This article is an open access article distributed under the terms and conditions of the Creative Commons Attribution (CC BY) license (https://creativecommons.org/licenses/by/4.0/).
Share and Cite
Jun, H.-M.; Seo, D.-J.; Lim, D.-Y.; Park, J.-G.; Heo, G.-H. Effect of Carbon and Steel Fibers on the Strength Properties and Electrical Conductivity of Fiber-Reinforced Cement Mortar. Appl. Sci. 2023, 13, 3522. https://doi.org/10.3390/app13063522
Jun H-M, Seo D-J, Lim D-Y, Park J-G, Heo G-H. Effect of Carbon and Steel Fibers on the Strength Properties and Electrical Conductivity of Fiber-Reinforced Cement Mortar. Applied Sciences. 2023; 13(6):3522. https://doi.org/10.3390/app13063522
Chicago/Turabian StyleJun, Hyung-Min, Dong-Ju Seo, Doo-Yeol Lim, Jong-Gun Park, and Gwang-Hee Heo. 2023. "Effect of Carbon and Steel Fibers on the Strength Properties and Electrical Conductivity of Fiber-Reinforced Cement Mortar" Applied Sciences 13, no. 6: 3522. https://doi.org/10.3390/app13063522