Article

Simplified Calculation Model for Contact Resistance Based on Fractal Rough Surfaces Method

1
State Key Laboratory of Reliability and Intelligence of Electrical Equipment, School of Electrical Engineering Hebei University of Technology, Tianjin 300401, China
2
Province-Ministry Joint Key Laboratory of EFEAR, Hebei University of Technology, Tianjin 300401, China
*
Author to whom correspondence should be addressed.
Appl. Sci. 2023, 13(6), 3648; https://doi.org/10.3390/app13063648
Submission received: 24 January 2023 / Revised: 1 March 2023 / Accepted: 10 March 2023 / Published: 13 March 2023
(This article belongs to the Section Electrical, Electronics and Communications Engineering)

Abstract

:
Electrical contact resistance (ECR) is critical to evaluate the stability and reliability of electrical connections. In this paper, a simplified contact model is established for rough surfaces based on the fractal theory and Monte Carlo method, which can overcome the difficulty of constructing the resistance networks for traditional contact models. The model reveals the influence of fractal parameters D and G on the surface morphology and contact characteristics. The established surface method can simulate Gaussian and non-Gaussian isotropic surfaces. Then the contact resistance considering a contaminated film is calculated, which provides a quantitative analysis of the change and the influencing factors. The accuracy of the calculation method in this paper is ensured by comparing the existing experimental data and finite element results. The results show that the contact surface with D of 1.5 has the largest real contact area and the smallest contact resistance. The model has accurate calculation results when dimensionless contact load F* is less than 4 × 10⁻³.

1. Introduction

Electrical contacts are widely used in the connection of various types of electrical equipment. The corresponding ECR is an important indicator to evaluate the stability and reliability of the electrical connection. In an in-service contact situation, any contact surface is not perfectly smooth but relatively rough at the microscopic scale, including processing texture, corrugation, and other geometric features. With two rough surfaces contacted, the real contact area is much smaller than the macroscopic contact area, and the violent current contraction occurs at several discrete contact spots. The shape and distribution of the micro-contact spots and the local shrinkage of the conductive path affect the current distribution, which in turn affects the ECR. Therefore, it is important to model the rough surface and predict discrete contact point areas in the calculation of ECR.
The surface micromorphology modeling method based on numerical simulation has undergone a long period of research. The method uses specific roughness feature parameters with autocorrelation functions to form a Gaussian or non-Gaussian simulated rough surface. From the early Greenwood-Williamson model to the latter random theory of rough surfaces and the elliptical contact statistical model, the construction methods of rough surfaces cannot overcome the dependence on the detection accuracy of measuring instruments [1]. The essential characteristic parameters D and G for characterizing surface morphology were proposed by Majumdar et al., which provided a new thought for subsequent morphological studies [2]. S. Ge found that the parameter D is varied with a negative exponential function of the conventional roughness parameter Ra [3]. Thomas studied anisotropic surfaces based on fractal theory and found that the fractal parameters are sensitive to the direction of surface scratches [4]. Kang pointed out that surface micromorphology has non-smooth and multi-scale characteristics. It is also explained that the microform of the part can be characterized by fractal dimensions with different parameters [5]. Jackson constructed 3D rough surfaces based on modified two-variable Weierstrass-Mandelbrot (W-M) fractal functions [6]. M. Chui compared the advantages and disadvantages of different rough surface simulation methods, which designed a simulation method that effectively converted the autocorrelation function and nonlinear equation system [7], but cannot effectively simulate non-Gaussian surfaces.
Rough surfaces are usually constructed to study contact properties and current transport properties. When two rough surfaces are contacted, the actual contact occurs through a portion of the asperities, that is, several discrete contact areas on the contact surface. The earliest model of rough surface contact was constructed by Archard in 1957 [8], in which the real rough contacting surface is simplified into a multilayer hemisphere. It was found that the real contact area is proportional to the contact load. However, the model neglected the effect of the actual surface morphology, which led to difficulties in application and errors of contact resistance. Based on the classical Hertz contact theory, Greenwood and Willianson established an elastic contact model [9], which lays the theoretical foundation for statistical surface contact properties. Some scholars have further extended the application of G-W models such as contact stiffness [10,11], sliding contact [12], and contact damping [13,14]. Although the elastic-plastic deformation and multi-scale of asperities are considered, it is not clear how the topography of the contact surface depends on the resolution of the measuring instrument. Another method is the contact model by fractal geometry theory. Based on the two-dimensional W-M function and the island area distribution law, Majumdar and Bhushan [2] built a classical M-B fractal contact model and revealed an analytical solution of the real contact area with the contact load.
Nevertheless, the M-B model makes many ideal assumptions, such as no transition state for the elastic-plastic deformation of the asperity, the asperity base being rigid, and adjacent asperities being independent of each other. Subsequent researchers revised and supplemented the M-B contact model. Persson constructed a multiscale contact model, which describes the process of several contact patches merging into a larger contact area as the compression increases [15]. The process can be described by a diffusion equation that characterizes the real contact area versus contact pressure. The M-E model proposed by Morag and Etsion solves the problem of contradicting the order of asperity deformation with the classical Hertz theory [16]. In addition, Yuan built a scale-dependent elastic-plastic contact ME correction model. They pointed out that the mechanical properties of a single asperity are related to its frequency index, and extended the conclusions to the entire surface [17]. Tong [18] and Hu [19] studied the asperity dislocation contact (contact angle not 0) from two perspectives: the molecular dynamics model and finite element simulation, respectively. The results show that there is a significant difference between the friction coefficient of dislocation contact and forward contact.
Although the contact models constructed in the above literature are experimentally verified with certain accuracy, it is difficult to construct a suitable contact resistance network for the solution of ECR. The reason is that the actual surface has complex structure and strong coupling between adjacent contact spots. Most scholars use finite element and experimental methods to study contact resistance and analyze the working state of contact resistance under different physical factors [20,21,22]. However, from the point of view of the mathematical model construction of contact resistance, the contact surface must be simplified and the key contact properties of the rough surface must be preserved as much as possible.
The aim of the research is to develop a simplified calculation model for the contact resistance of rough surfaces. The rough surface is constructed based on fractal theory and the Monte Carlo method to simulate Gaussian and non-Gaussian isotropic surfaces. The sinusoidal asperities are used as the basic contact unit of the rough surface which can quantitatively analyze the contact load with respect to the real contact area and contact resistance. Then, the effects of various morphological parameters on the contact characteristics are compared and analyzed. Finally, the finite element contact model is built based on the reverse modeling technique, which verifies the accuracy of the proposed computational model under small contact loads. The research in the paper can provide a useful reference for the reliability verification and optimization design of electrical contacts.

2. Modeling

2.1. Rough Surface Morphology Structure

The contact between two rough surfaces is usually simplified to a rigid ideal surface and an equivalent rough surface. The equivalent rough surface has the morphological characteristics and material properties of the two surfaces. From the two-dimensional W-M function, a cosine wave-like asperity is a basic unit of the rough surface model. It is assumed that the coupling effect between adjacent asperity and the strain-hardening effect of the material during the contact is neglected, and the tangential cross-section profile of the asperity is circular. Then, the profile height curve of the asperity before deformation can be described as
z ( x ) = G D 1 l 2 D cos π x l , l 2 < x < l 2
where: D is the fractal dimension (1 < D < 2); G is the characteristic scale parameter reflecting the profile curve; l is the asperity base diameter; δ is the asperity height under the base diameter of l, satisfying δ = G D−1 l 2-D.
Asperities of different scales with base diameter l satisfy the island area distribution law above sea level and the Monte Carlo method [23]
N ( L l ) = ( l max l ) D
The base diameter li and the corresponding height δi of the asperity at different scales can be expressed by the following equation
l i = l min ( 1 R i ) 1 / D = ( l min l max ) l max ( 1 R i ) 1 / D
δ i = G D 1 [ ( l min l max ) l max ( 1 R i ) 1 / D ] 2 D
where lmax and lmin correspond to the maximum and minimum asperity base diameters, respectively, Ri is the random number, i = 1, 2, 3,…, N, and N is the total number of random numbers generated, satisfying N = [(lmax/lmin)D]. The asperity corresponding to lmax is called the first level asperity, and the rest of the asperities are arranged sequentially according to the size of the base diameter. The range of the random number Ri is
0 R i 1 ( l min l max ) D
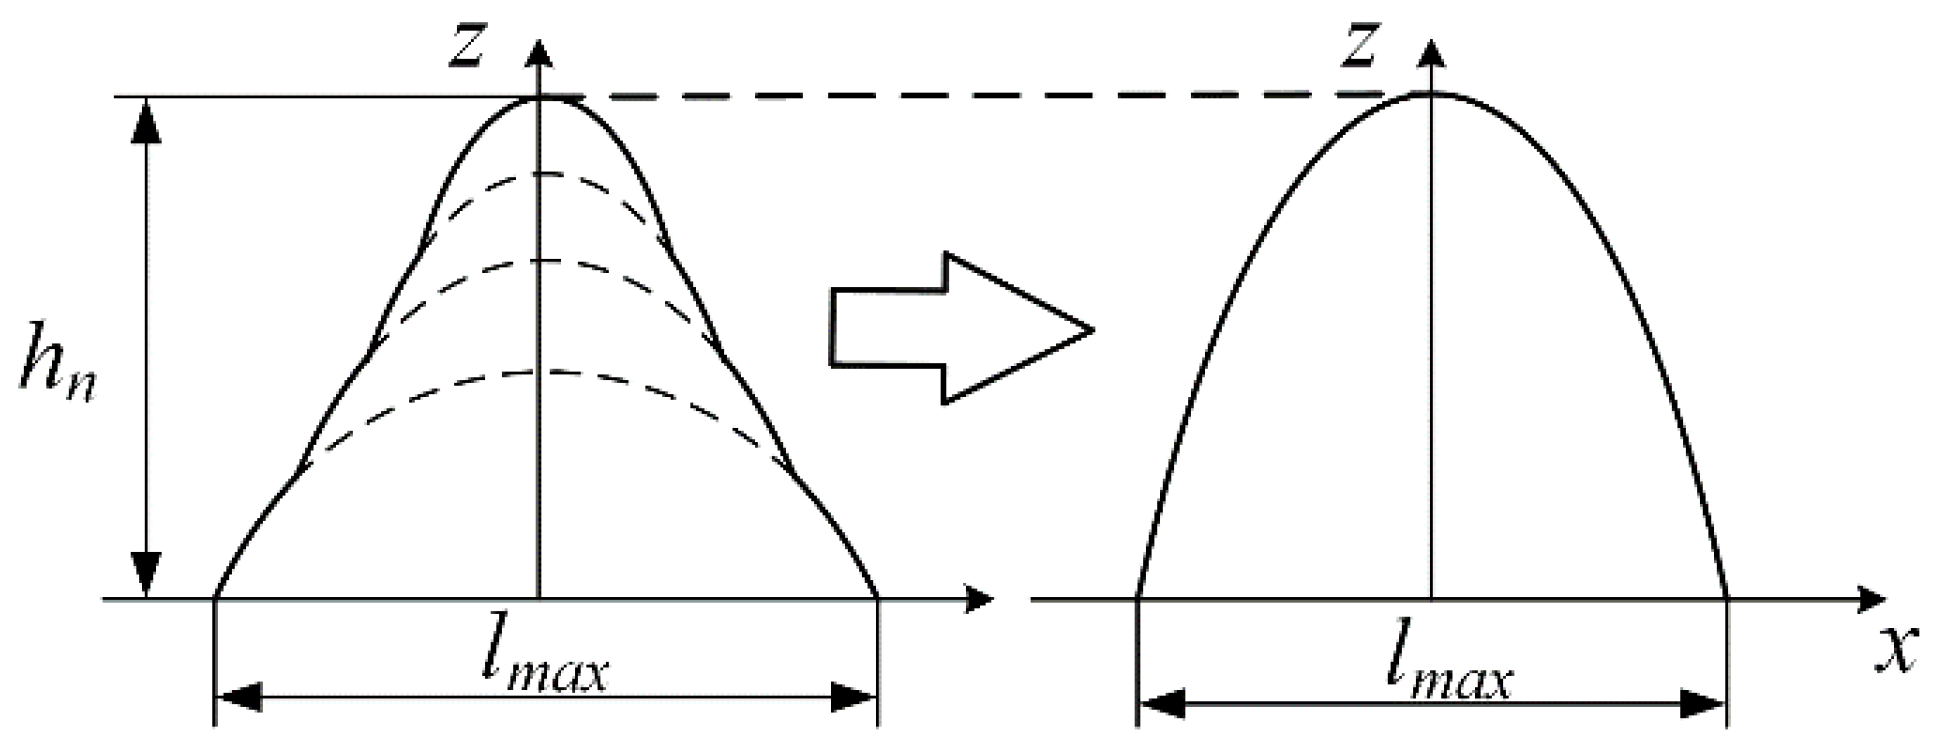
An asperity set is formed by stacking asperities of different scales with cosine functions of contours. The asperity corresponding to lmax is stacked as the base of the asperity set, and the asperity of the second level is stacked on top of the asperity of the first level until a total of N asperity sets of different levels are stacked. Figure 1 illustrates the stacked structures of the asperity set obtained for the specific number of layers. The height of the N level asperity set obtained through stacking is represented by hN and can be expressed as
h N = G ( D 1 ) l max ( 2 D ) + m = 1 N 1 δ i
It is worth noting that hN, as the highest point of the simulated surface, should be equal to the maximum height difference Sz (maximum height of the surface, Sz) of the measured surface. Based on Equation (6), the lmax is determined by iterative solution.
The asperity sets are reconstructed concerning the contour height of the actual surface. The surface and the asperity sets satisfy the same height distribution law, as shown in Figure 2. Theoretically, surfaces of any height distribution can be simulated by simply adjusting the replication multiplication factor. The total number of asperity sets on the reconstructed simulated surface is N1, as distinguished from the number of asperity sets at different scales N.
The equivalent rough surface consists of several asperity sets with different stacked layers in the plane according to the Monte Carlo method. In this model, a square-shaped macroscopic contact base surface with a side length of L is used. The asperity set is randomly distributed on the plane and does not intersect with the boundary. The coordinates (x(i), y(i)) of the circle center of the base of the asperity set can be expressed as
{ x ( i ) = 0.5 l max + ( L l max ) R a 1 y ( i ) = 0.5 l max + ( L l max ) R a 2
where Ra1 and Ra2 are two random numbers between 0 and 1. The coordinates (x(i), y(i)) satisfy 0.5lmaxx(i), y(i) ≤ L − 0.5lmax and are randomly distributed.
From the assumptions of Equation (7), it is clear that the asperity sets are independent of each other. If the adjacent asperities sets overlap, the position coordinates are regenerated. The non-overlapping criteria can be realized by comparing the distance between the center adjacent asperity sets and the base diameter lmax
( x ( i ) x ( j ) ) 2 + ( y ( i ) y ( j ) ) 2 l max   0   <   i , j     and     i j
The algorithm proposed in this paper is summarized in a flowchart, as shown in Figure 3. The entire calculation process is divided into two parts: the first part determines the parameters of the asperity set by fractal theory, and the second part determines the distribution of asperity set positions by the Monte Carlo method. This approach retains both fractal characteristics and randomness, allowing for rapid simulation of both Gaussian and non-Gaussian rough surfaces.

2.2. Contact Properties

The contact properties of the asperity set have a direct impact on the mechanical properties of the entire surface. To investigate the relationship between the total contact load and the actual contact area between rough surfaces, it is essential to study the contact properties of a single asperity set. The asperity set, which is a multilayer stacked structure, can be approximated as a sinusoidal asperity structure with the same height and base length, as shown in Figure 4.
Based on finite elements, the contact characteristics of a three-dimensional sinusoidal contact asperity can be described by a fitting equation for the contact area versus contact load [24]
A = { A J G H 1 ( 1 [ p ¯ p * ] 1.51 ) + A J G H 2 [ p ¯ p * ] 1.04 p ¯ p * < 0.8 A J G H 2 p ¯ p * 0.8
where: A is the real contact area of a single asperity; p ¯ is the average contact pressure of a sinusoidal asperity, which satisfies p ¯ = F/lmax2, F is the contact load of this sinusoidal asperity; p* is the average contact pressure of asperity fully deformed, which satisfies p* = √2πE* hN/lmax. E* is the equivalent sinusoidal asperity Young’s modulus, which can be obtained from the Poisson’s ratio and elastic modulus v1, v2, and E1, E2 of the two original contact surfaces by the formula E* = E1E2/(E2(1 − v 1 1 ) + (E2(1 − v 2 1 )). AJGH1 and AJGH2 are the first contact area and the second contact area of the sinusoidal asperity contact model, which satisfy
{ A J G H 1 = 2 π ( l max ) 2 [ 3 8 π p ¯ p * ] 2 / 3 A J G H 2 = ( l max ) 2 ( 1 3 2 π [ 1 p ¯ p * ] )
Figure 5 depicts a single sinusoidal asperity in contact with a rigid plane. The dashed line represents the original contour of the asperity, while the solid line represents the deformed contour of the asperity. The contact area between the asperity set and the rigid plane is an ideal circle, with ri is the radius of the asperity contact spot, and d is the distance of the rigid plane from the base plane of the asperity, the real contact area of the asperity is Ai = π r i 2 .
For a sinusoidal asperity contact structure, the contact spot radius ri can be calculated from the following equation [25]
r i = ( h i d 0.75 0.5 ) l max 2 0 d 1 3 h i
The radius ri and area Ai of the contact spot of the sinusoidal asperity in the plane can be calculated by specifying the distance d between the rigid plane and the base plane. The contact load Fi can be obtained from Equation (9). Extending to the entire contact plane, all sinusoidal asperities in the plane with height greater than d are in contact with the rigid plane, and their contact areas and contact loads can be calculated from Equations (9) and (11). The real contact area Ar and the total contact load F of the plane are the sums of the real contact area and the contact load of the contacting asperities, respectively, denoted as
{ A r = i = 1 n π r i 2 F = i = 1 n F i
where: n′ is the number of contacting asperities.

2.3. Contact Resistance Model

According to the classical shrinkage resistance theory [26], the shrinkage resistance Rc of a sinusoidal asperity with base diameter lmax and contact spot radius ri can be approximated as
R c = [ ρ 2 r i ] [ R c o ¯ + s F ( d r i ) ]
where
s F = 4 π ( 2 r i l max ) [ 1 2 r i l max ]
R c o ¯ = 1 1.41581 ( 2 r i l max ) + 0.063 ( 2 r i l max ) 2 + 0.15261 ( 2 r i l max ) 3 + 0.19998 ( 2 r i l max ) 4
where: ρ is the equivalent rough surface substrate material resistivity, ρ = ρ1 + ρ2, ρ1 and ρ2 are the two original contact material resistivity; sF is the contractional slope; R co ¯ is the classical contraction resistance fitting formula.
When the electrical contact surface is exposed to high humidity and severe pollution for a long time, the asperities may be covered with a contaminated film layer, such as sulfide film, oxide film, and other surface films. The presence of the contaminated film layer will further affect the current distribution in the contraction region, generating another additional resistance, called the film resistance Rf
R f = ρ f d c π r i 2
where: ρf is the resistivity of the contaminated film layer; dc is the thickness of the contaminated film layer.
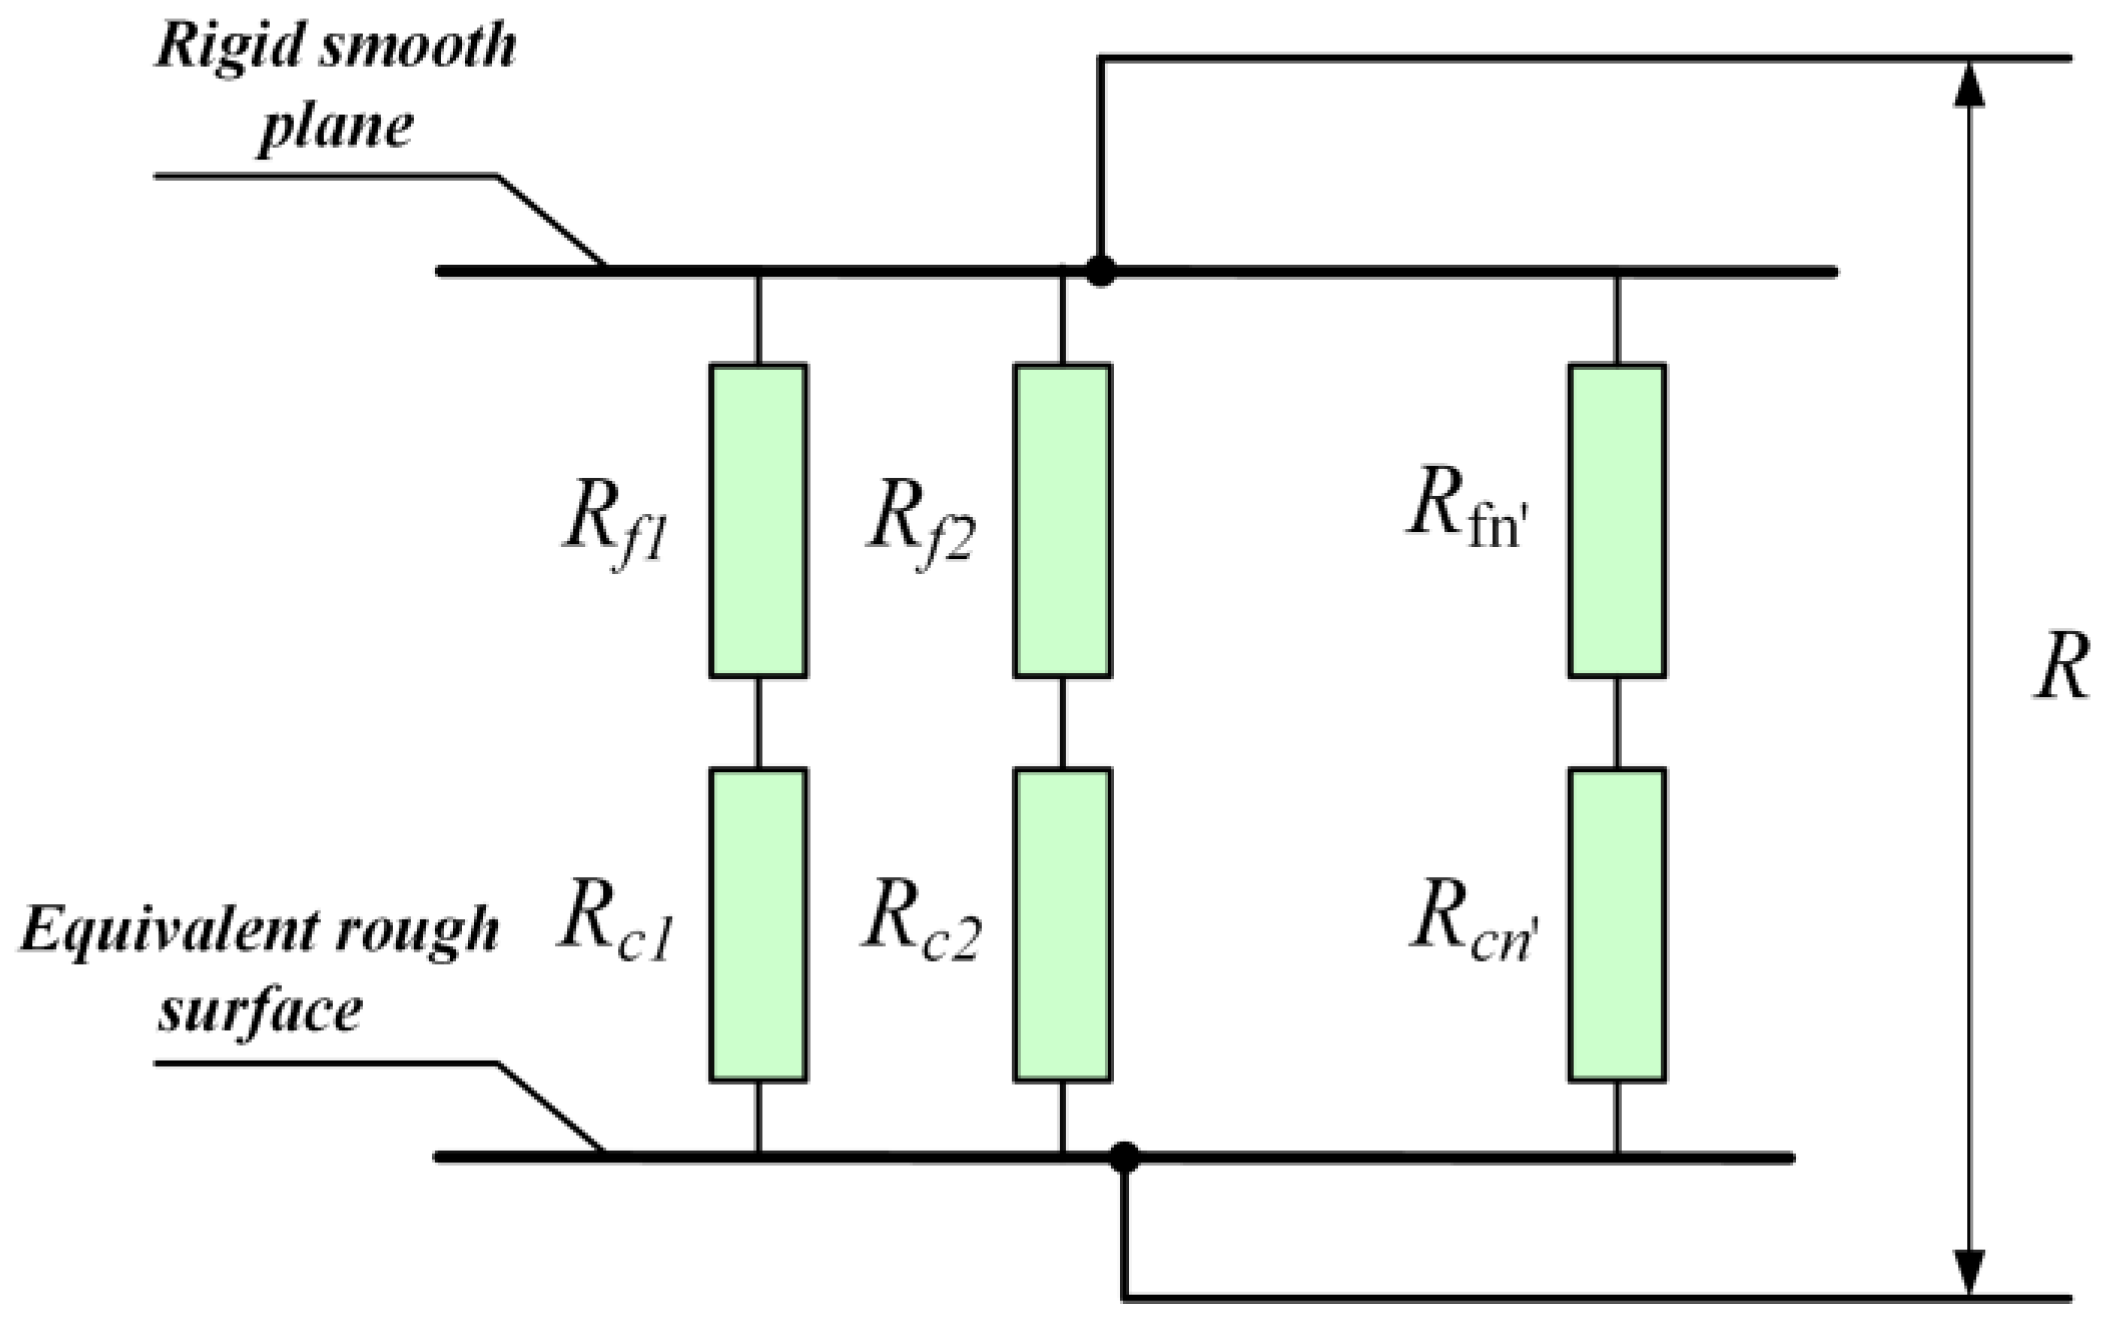
The contraction resistance and film resistance on the asperity are connected in series within the circuit, whereas the asperities of different scales are connected in parallel on the plane. The equivalent circuit model for the contact resistance is shown in Figure 6, which has a total contraction resistance of R
R = 1 i = 1 n 1 R i
where Ri is the contact resistance of sinusoidal asperities of different scales, satisfying Ri = Rci + Rfi.

3. Results and Analysis

3.1. Surface Morphological Analysis

The method for simulating surface morphology proposed in Section 2.1 is analyzed. The morphological features of the asperity set are determined by the two-dimensional W-M function. Subsequently, the Monte Carlo method is used to construct the rough surface and simulate the three-dimensional rough surface morphology under different fractal parameters, as shown in Figure 7. Both parameters, D and G, are found to be negatively correlated with the height of the rough surface profile. The range of values of G under different surfaces is much larger than that of D (1 < D < 2), which has a greater effect on the height of the asperity than that of D as a power. According to N = [(lmax/lmin)D], the fractal dimension D is positively correlated with the number of asperity sets. The increase in D leads to a decrease in the distance between the asperities and the rough surface becomes more complex. Furthermore, a decrease in G causes a significant reduction in the surface profile height. However, the effect of parameter G on the surface complexity is not significant. Therefore, the characteristic scale parameter G reflects the height of the rough surface profile and determines the degree of flatness and roughness of the surface.

3.2. Contact Characteristics Analysis

Based on the mathematical model, the contact characteristics and contact resistance of the rough surface are studied, and the specifically calculated parameters are shown in Table 1. To facilitate the analysis, Ar, F, and R are normalized into dimensionless quantitates, A r * = Ar/L2, F* = F/(E × L2), R* = RL2/(ρ + ρf). The calculated results were compared and analyzed with experimental data from Bhushan [27], which used real contact area measurements based on dual-beam interference technology.
Figure 8a shows that at the fractal dimension D less than 1.5, the increase in D leads to increase the contact rate and improves the contact properties of the material surface. When D is greater than 1.5, the size of larger contacts decreases, while the increase in the number of small asperities on the rough surface is much faster than the decrease in the size of large asperities, and the proportion of large asperities contacts increases rather than decreases. Small-size asperities cannot contact the rigid plane and the actual contact area gradually decreases. Figure 8b shows that A r * increases linearly with the increase in F* when the fractal dimension D is a constant value. With constant F*, the actual contact area decreases as the characteristic scale G increases. The reason for this phenomenon is that the size of G determines the flatness and roughness of the overall surface, and the larger the G, the greater the difference in asperity amplitude. Under the same contact load, the presence of higher asperities causes a large number of low asperities to fail to make contact, which, in turn, reduces the overall contact area. Therefore, improving the machining accuracy and reducing the roughness of the contact part surface is beneficial to enhancing the contact performance.
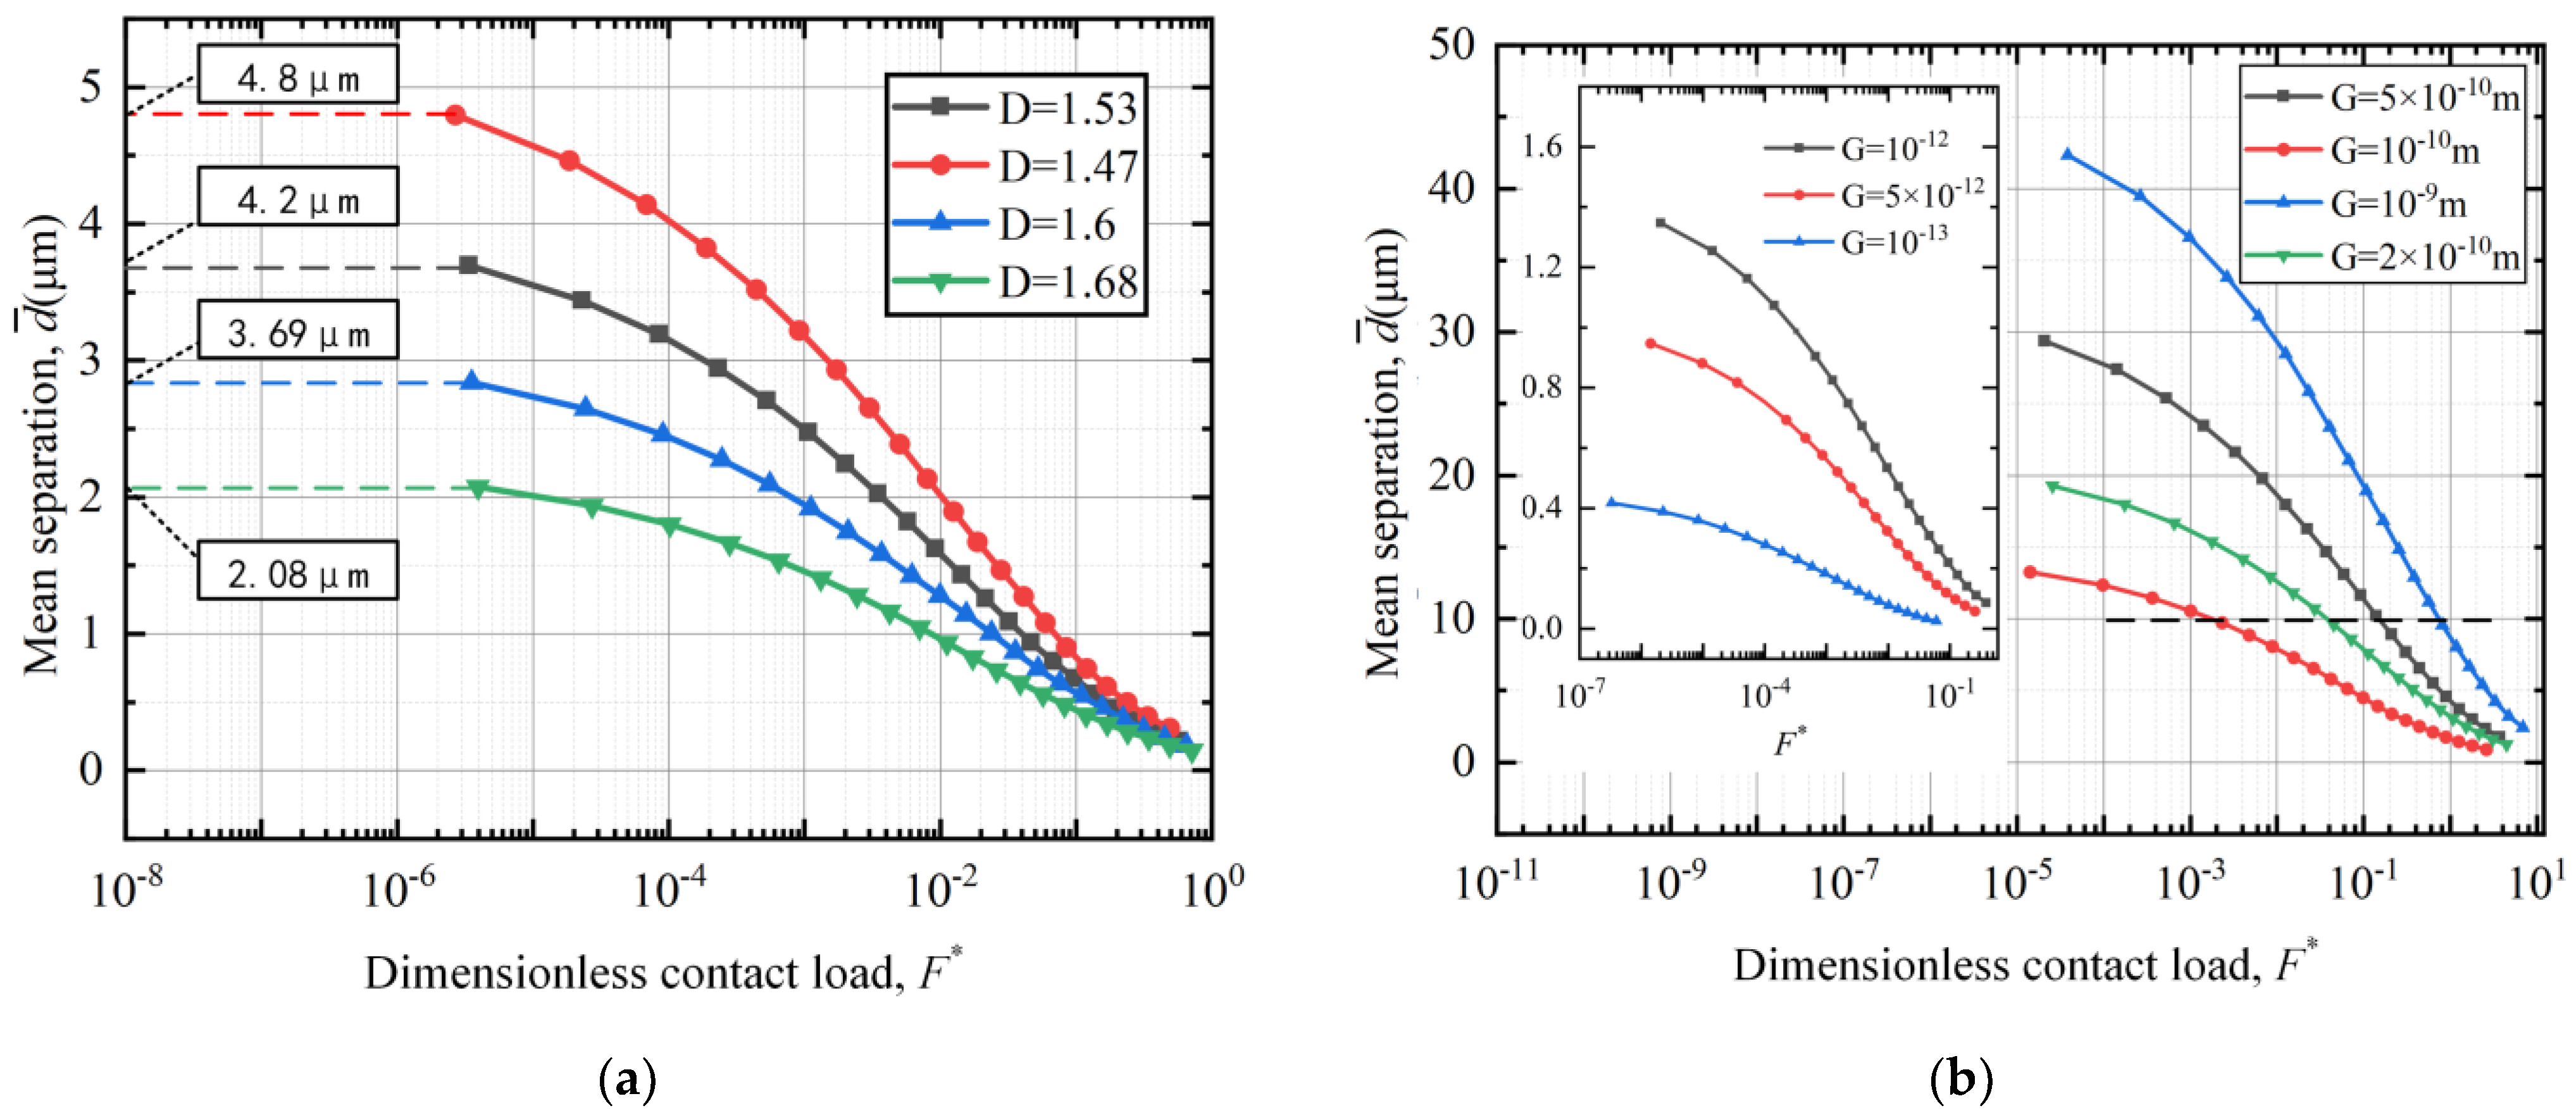
Figure 9 shows the variation in the average contact separation with contact pressure for different fractal parameters. As shown in Figure 9a, there exists an optimal value of the fractal dimension (D = 1.5), corresponding to the maximum mean separation. At high loads, the results corresponding to different fractal dimensions tend to be consistent. However, the effect of the characteristic scale parameter G on the average contact separation is rather different, as shown in Figure 9b. The contact pressure at lower d can vary by several orders of magnitude at most. This result becomes more significant as G decreases.
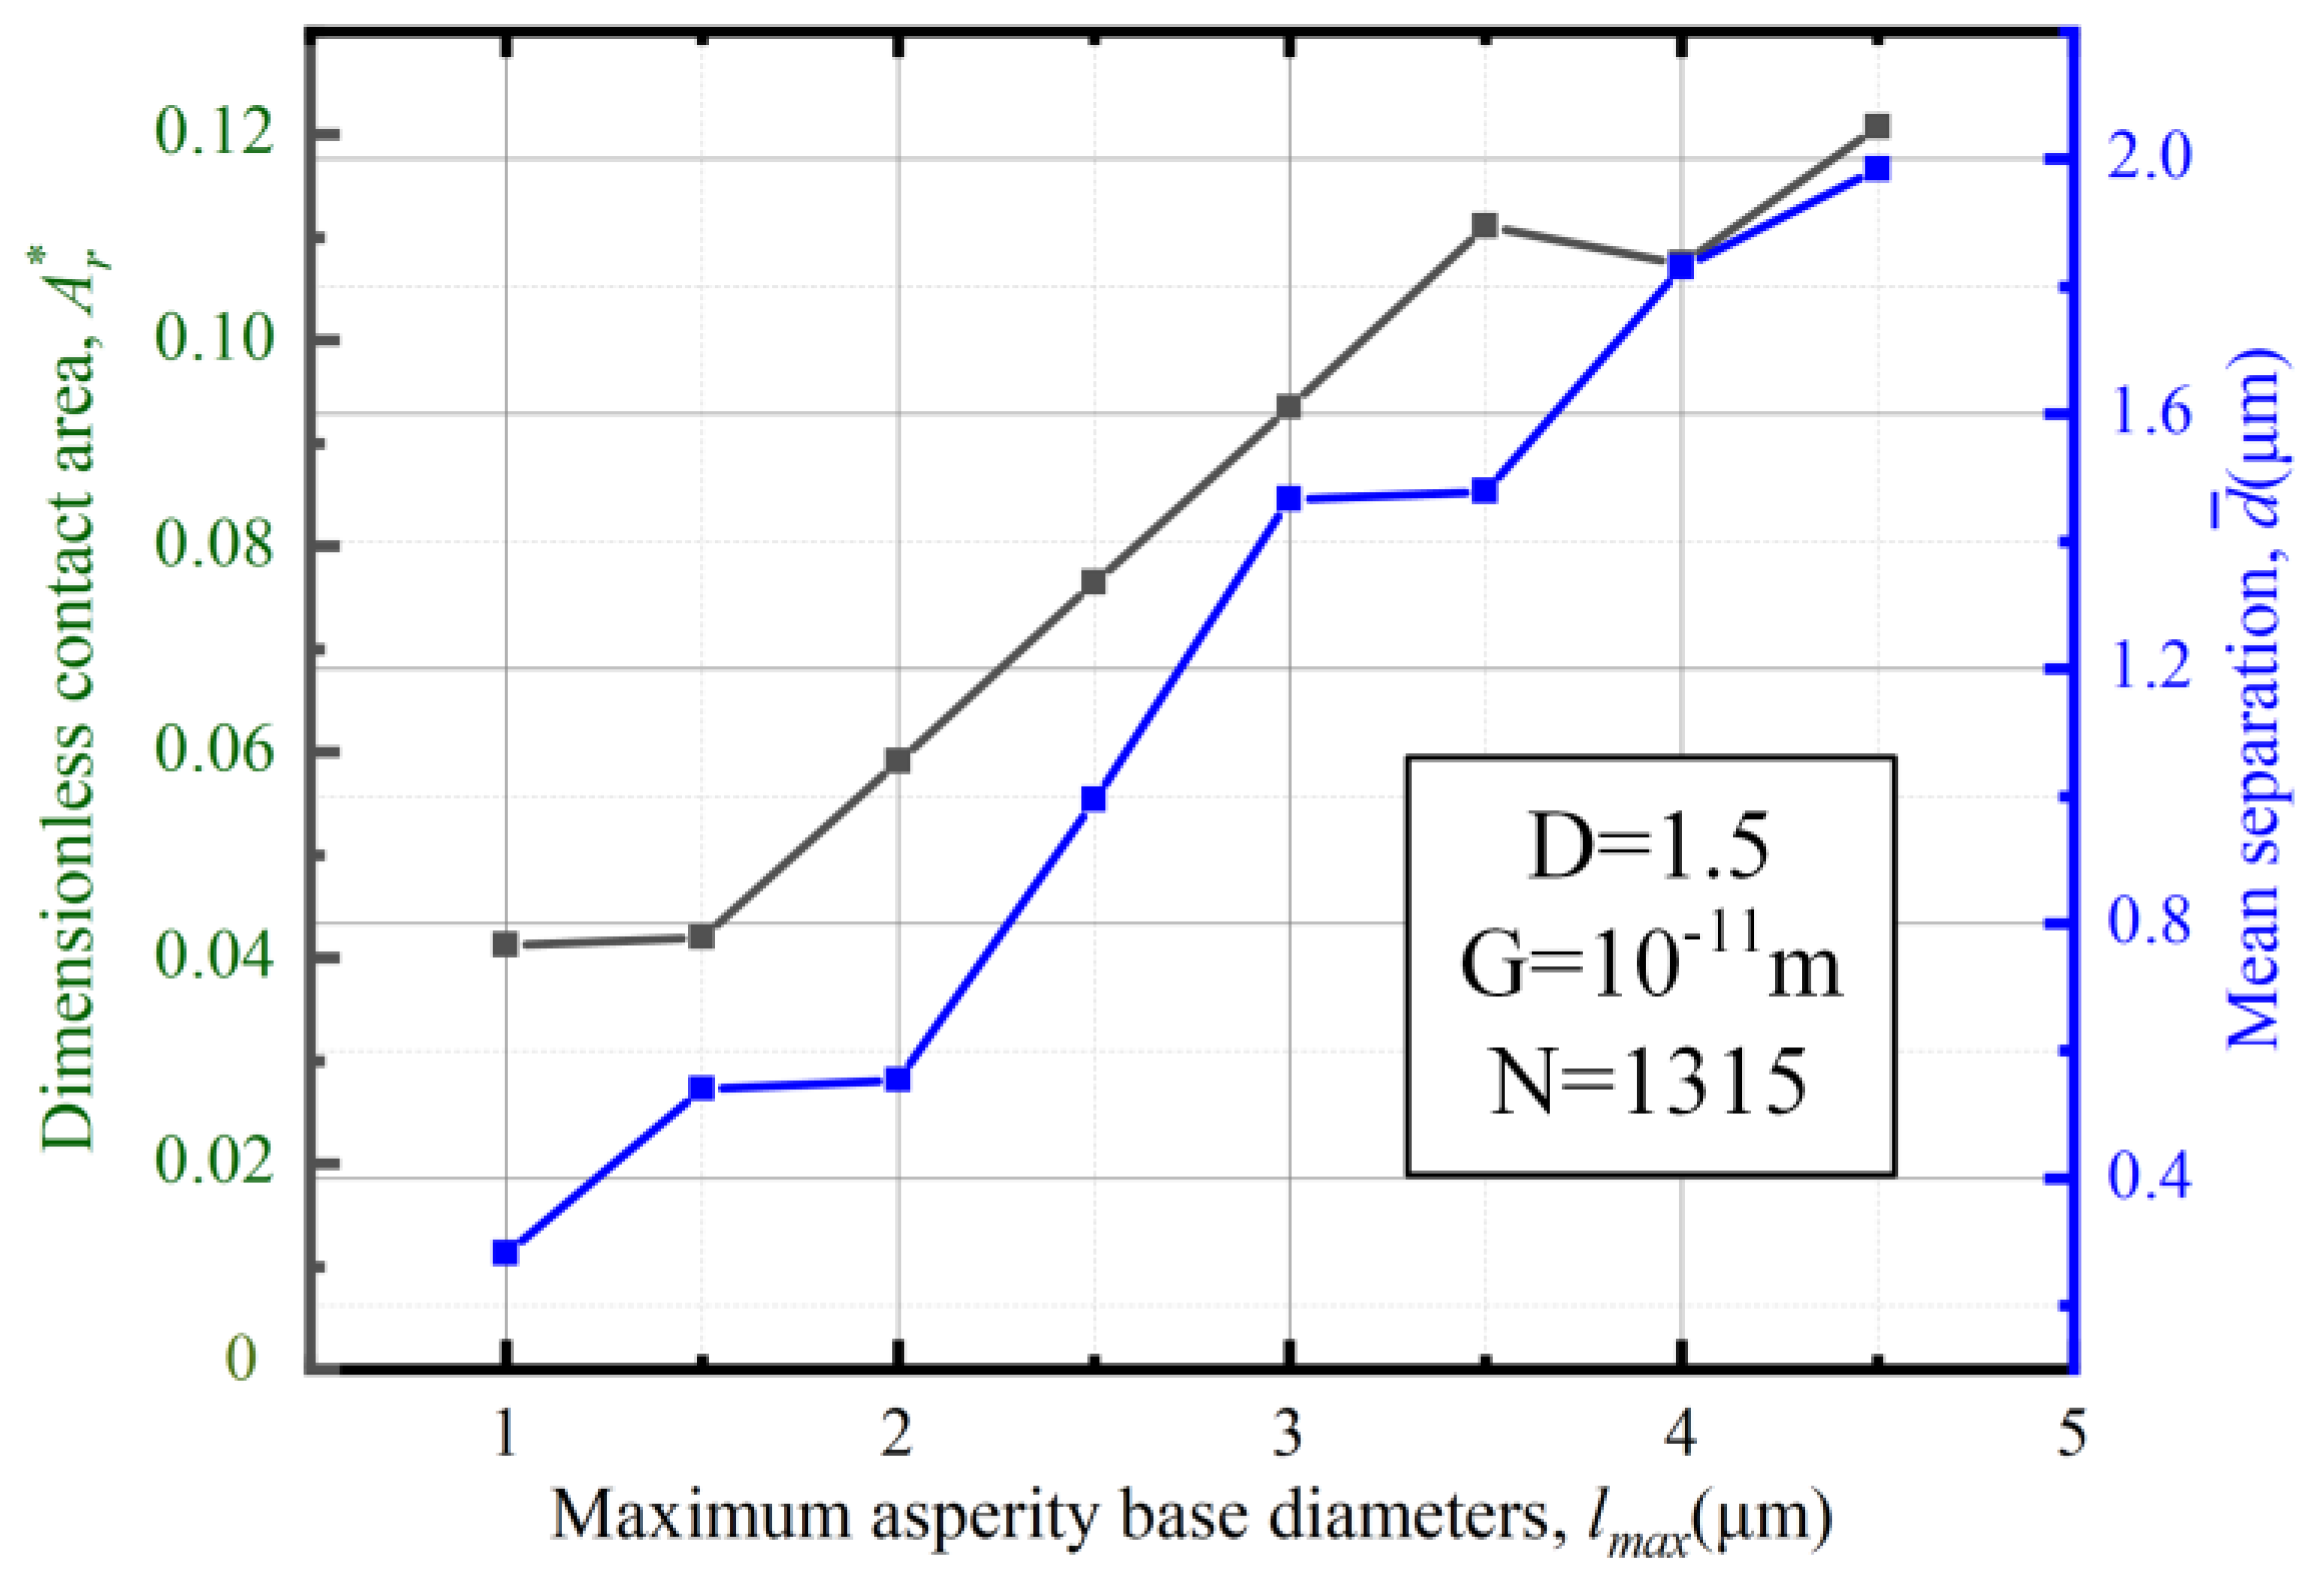
The asperity base diameters will significantly affect the contact mechanical properties of the rough surface. As shown in Figure 10, the increase in lmax expands the scale of all the asperity sets in the plane, leading to an increase in the average contact separation. According to Equations (9) and (10), the asperity set scale leads to an increase in the proportion of elastic deformation, and the surface is more likely to be contact deformed.
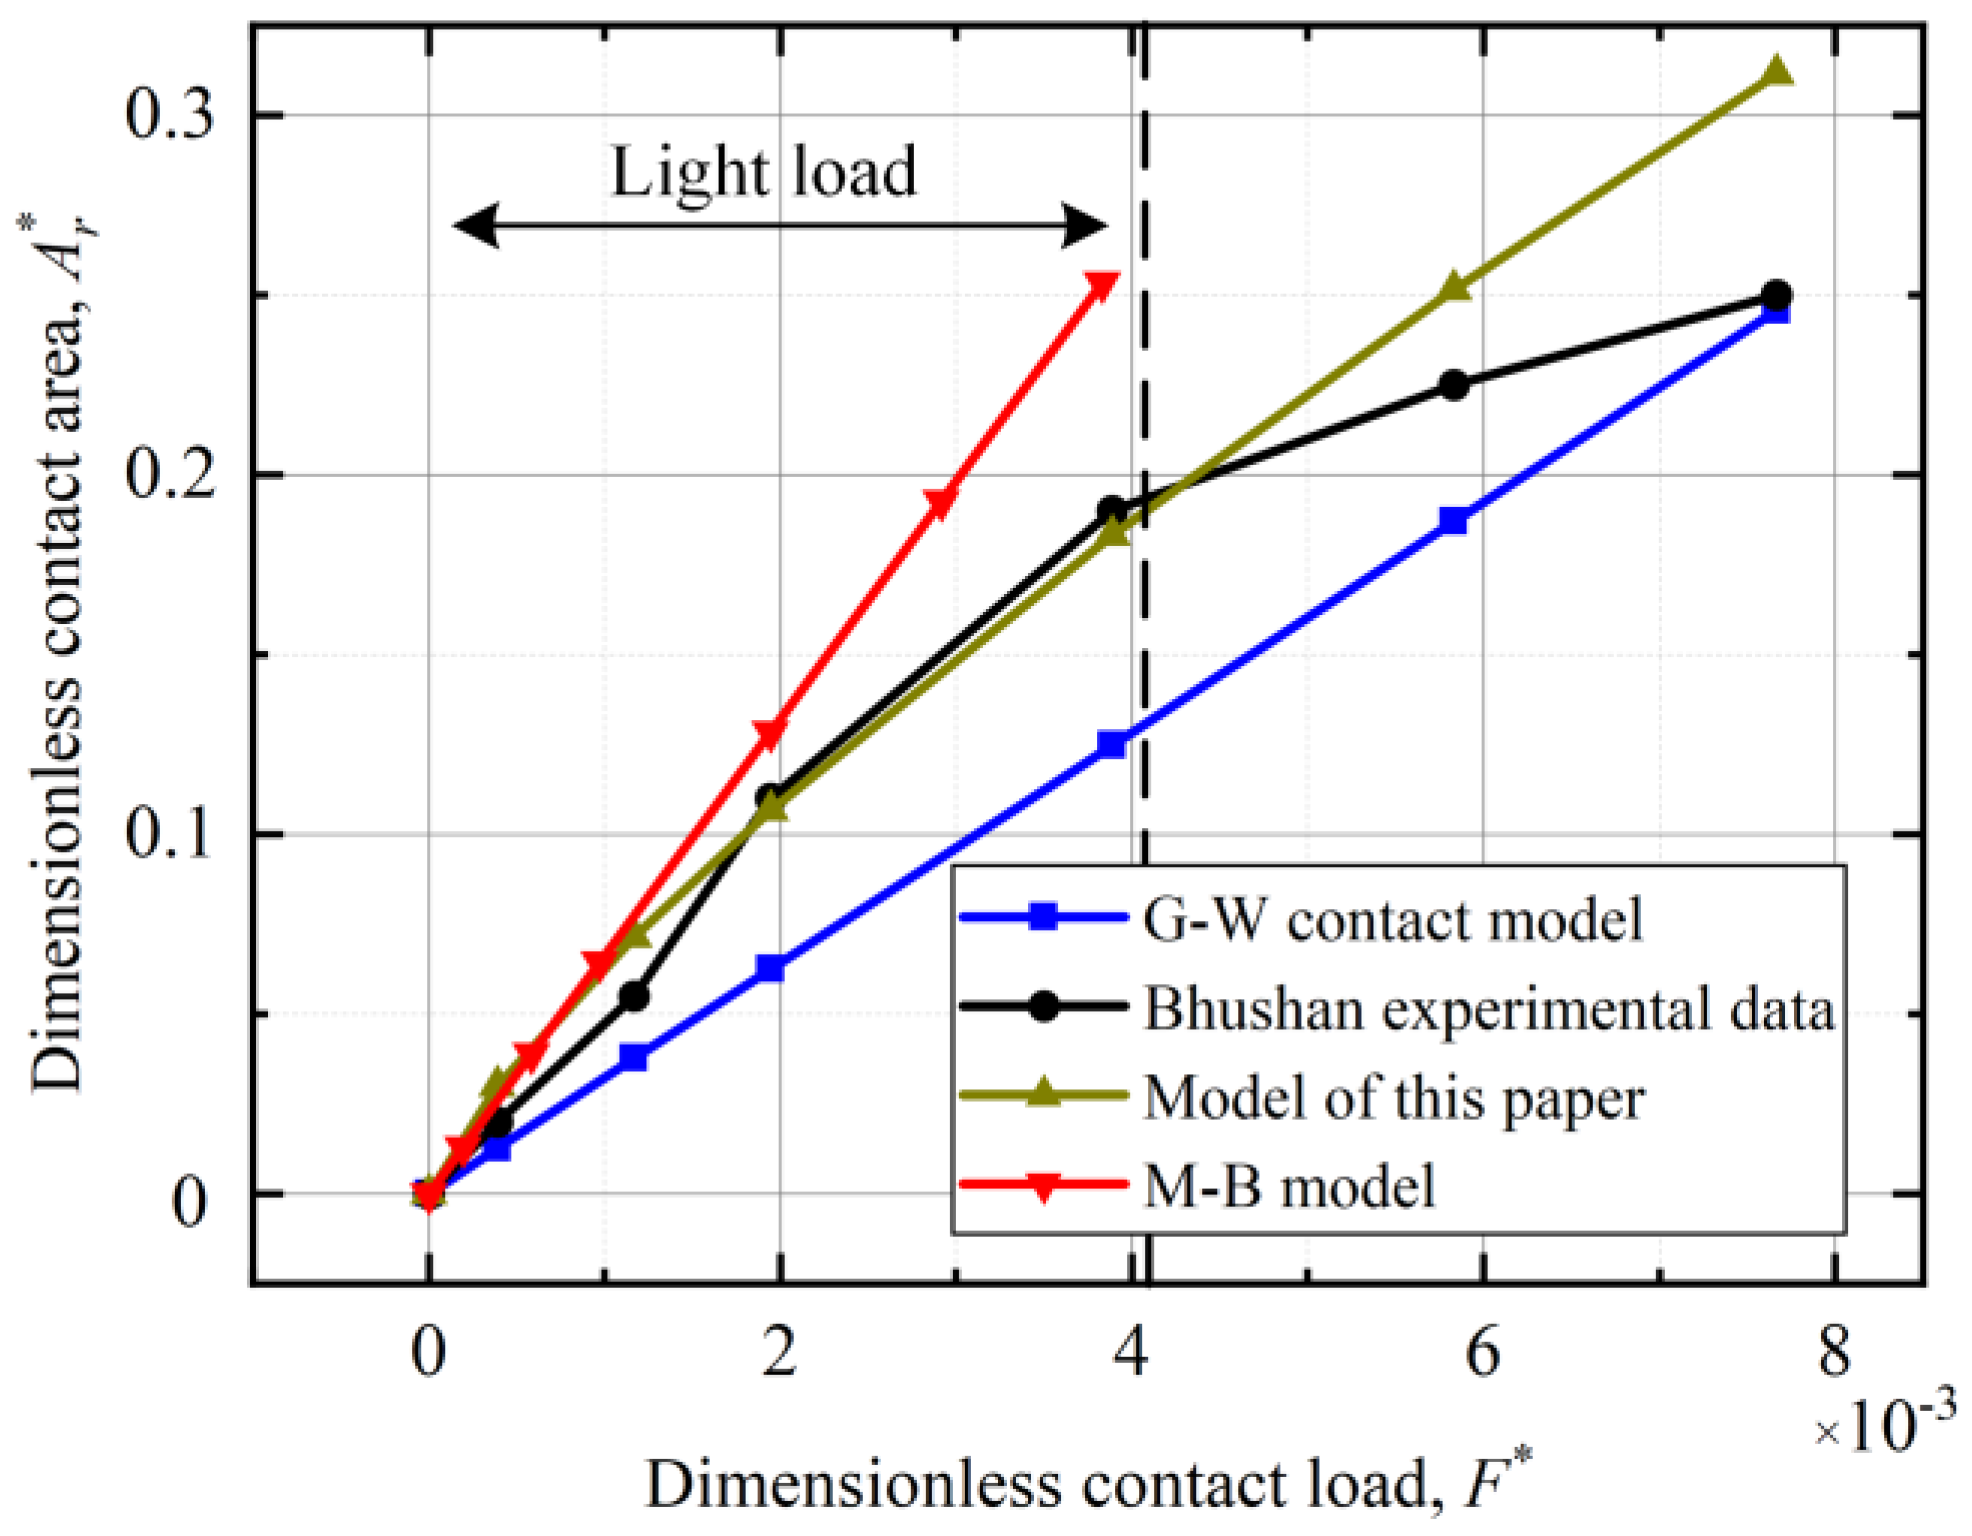
To verify the accuracy of the proposed contact model, the contact load and contact area data calculated from the model were compared with the G-W model [9], M-B model [2], and Bhushan experimental data [27], as shown in Figure 11. The surface morphology and material parameters were set to D = 1.53, G = 4 × 10⁻¹³ m, L = 10−4 m2, and E* = 50 GPa. The predicted data of the model proposed in this paper and the experimental data were found to be in general agreement. Under light loads of F*, which were no greater than 2 × 10⁻³, the M-B model agreed well with the experimental data. However, as the load increased, the M-B model deviated from the experimental data to some extent. The reason for this deviation is that in real contact, the protrusions on two rough surfaces may disappear or merge into larger contact spots, which indicates strong coupling between contact areas. The contact model with asperity as the smallest unit is difficult to effectively characterize the contact morphology state under heavy load. The G-W model mainly focuses on elastic contact, ignoring local plastic deformation and underestimating the real contact area. Similar to the M-B model, the model proposed in this paper ignores the interaction between contacting asperities, which is reflected in the calculation results with high accuracy for medium and light loads. However, its simplified contact analysis helps to extend the model to different applications.

3.3. Contact Resistance Analysis and Finite Element Verification

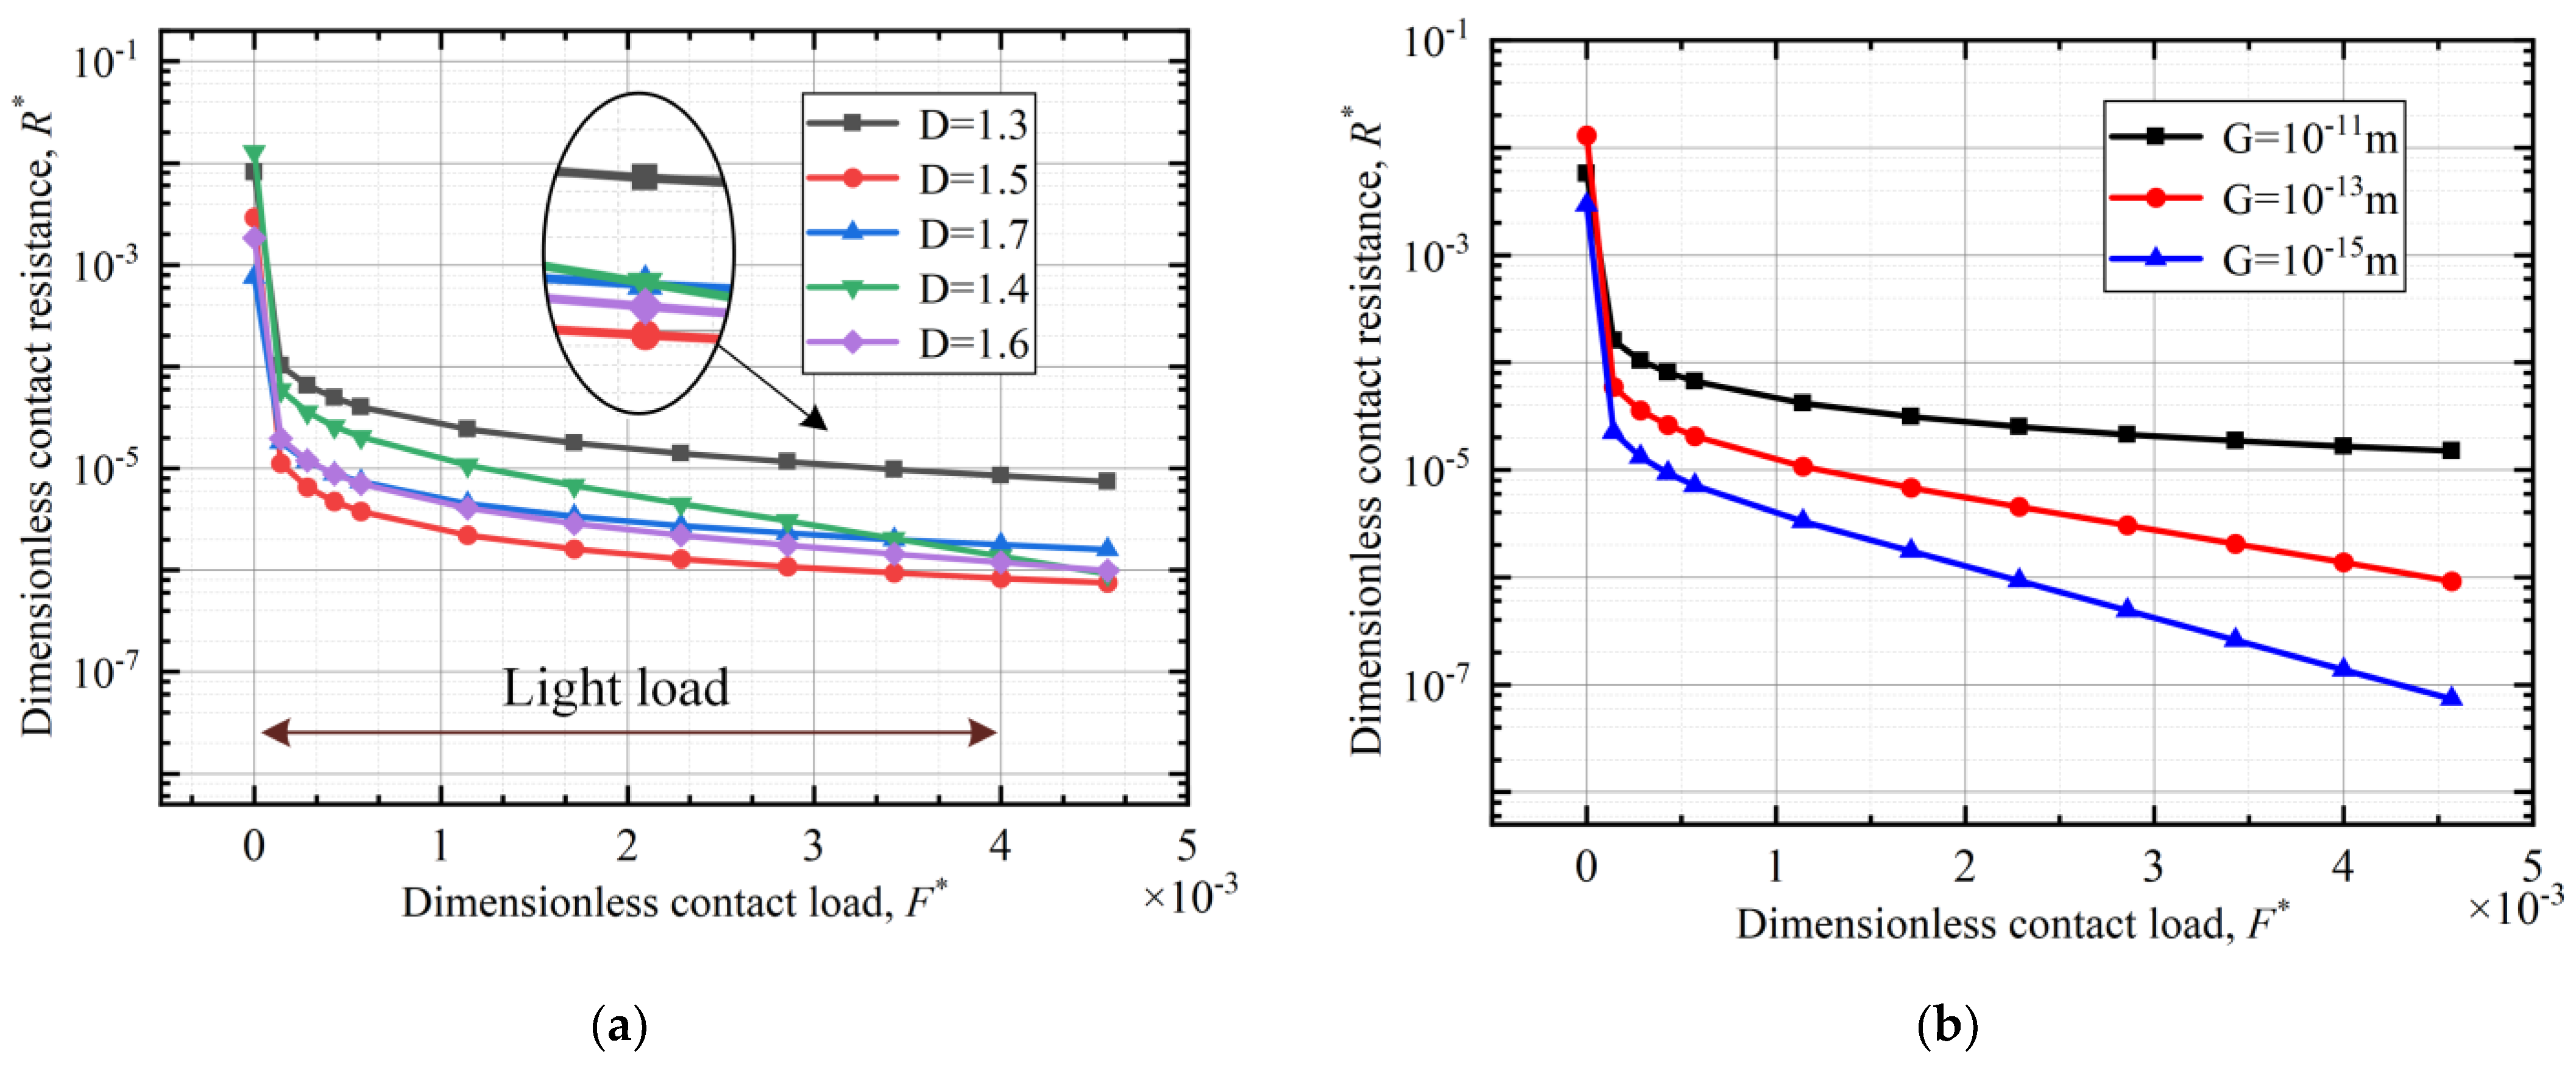
Figure 12a illustrates that contact resistance tends to decrease with the increase in contact load, and the contact resistance reaches the local minimum with D = 1.5; this finding supports the established principle that a smaller real contact area leads to larger contact resistance. In Figure 12b, we observe that the characteristic scale parameter G has a much greater influence on the contact resistance than the fractal dimension D. This is attributed to G being positively correlated with the maximum height difference of the profile. When the height difference decreases, the number of contact asperities increases, leading to a greater number of parallel branches in the electric contact network. As a result, the resistance at the contact interface decreases.
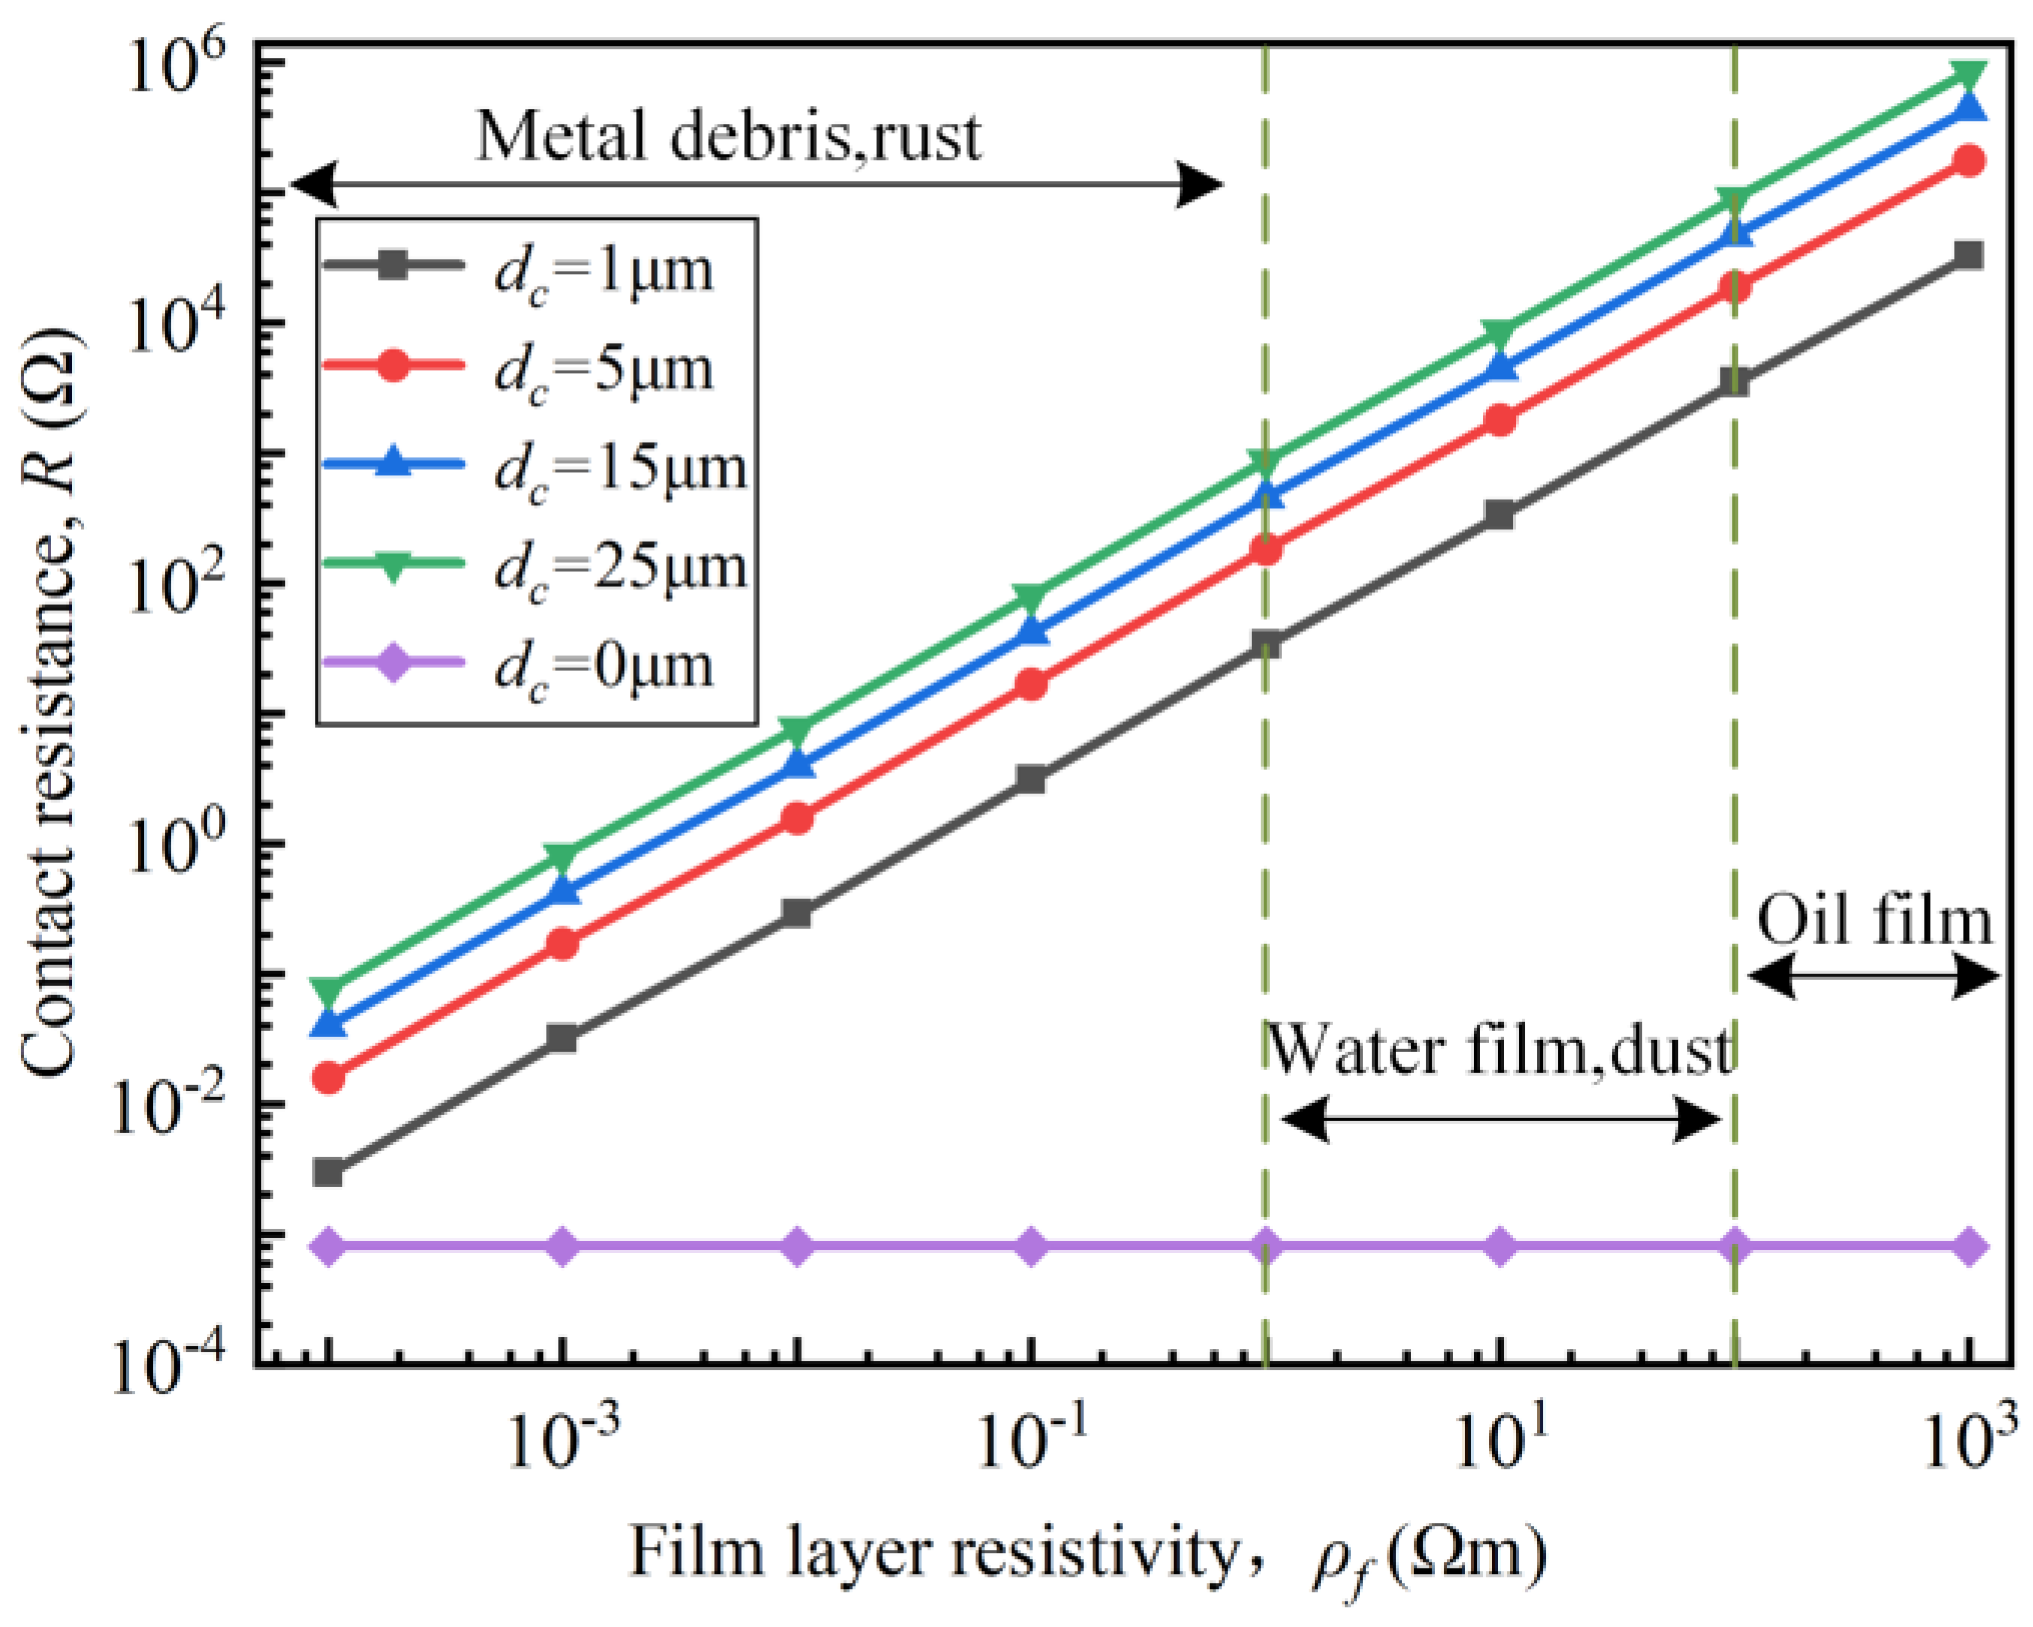
Figure 13 shows the variation in contact resistance R with the resistivity ρf of the contaminated film layer for surface parameters D = 1.53, G = 10−9 m, and dimensionless contact load F* = 1.29. When the electrical contact surface is completely clean and ideal pure metal contact occurs, the contact resistance caused by the current line contraction is R = 8.05 × 10⁻⁴ Ω. When the contaminated film meets dc = 1 μm and ρf = 10−4 Ωm, the contact resistance R = 29.1 × 10⁻⁴ Ω, which is of the same order of magnitude as the metal contact resistance. With the increase of film resistivity and thickness, the film resistance will be dominated by the total contact resistance.
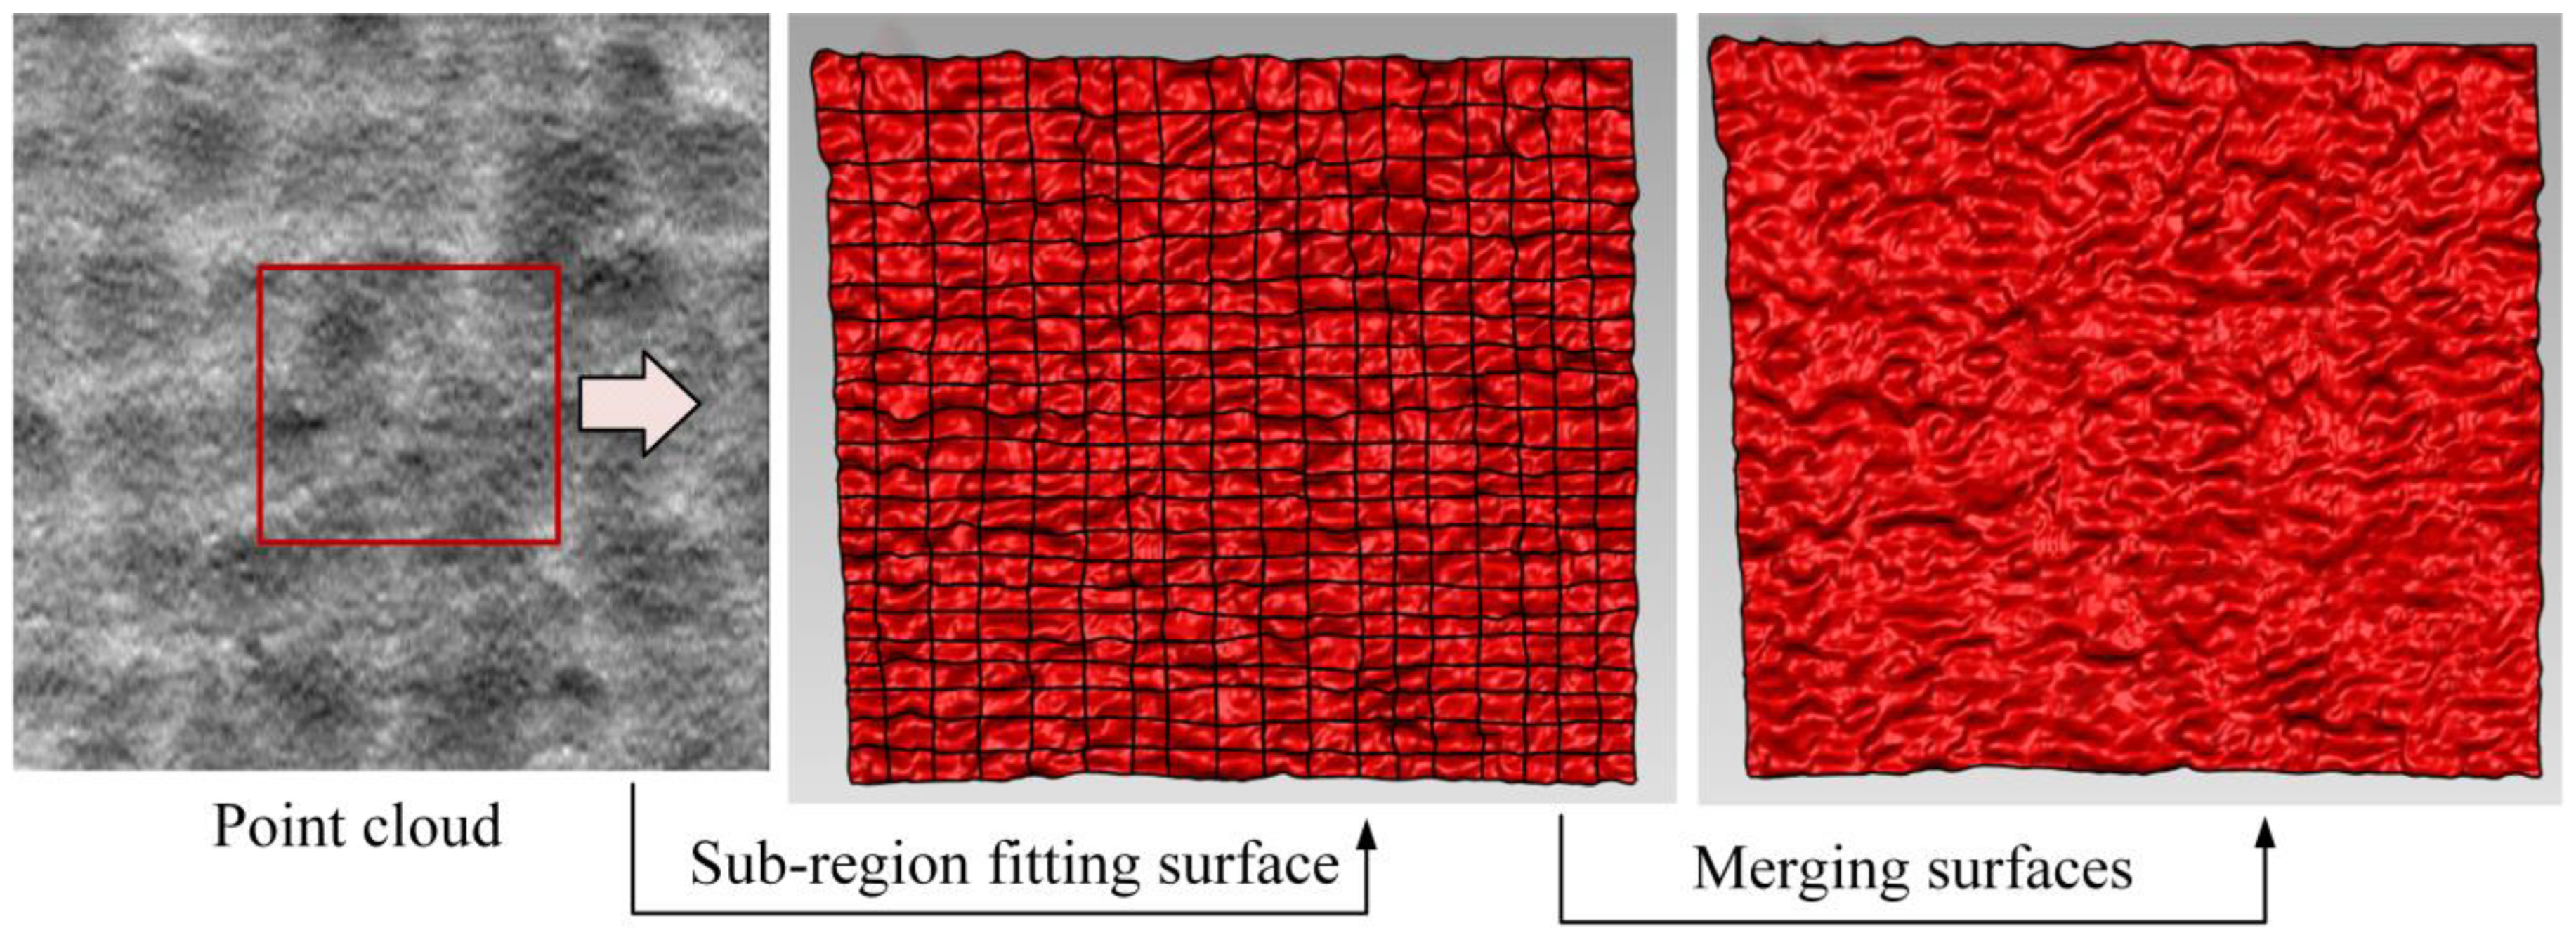
The 3D point cloud data is obtained based on the equivalent rough surface simulation method proposed in Section 2.1. These point cloud data are fitted to the surface, then patched and denoised to achieve surface model reconstruction, as shown in Figure 14. The rough body material is made of aluminum [28], with the following material parameters: E* = 69 Gpa, υ = 0.33, σs = 276MPa. The contact model uses the Augmented Lagrangian method to enhance contact and limit penetration between surfaces. A smooth displacement along the Z-axis and a constant voltage are applied to the top surface of the rough body. Constant boundary conditions are applied to the bottom surface of the rigid body and do not consider small displacement slips in the x and y axes of the rough body. The contact surface consists of 150 by 100 nodes, resulting in 149 by 99 elements. The mesh is created using the moving node method, and it becomes increasingly coarser away from the surface.
Figure 15 shows the variation in contact resistance with fractal parameters for different contact loads. It can be observed that the model proposed in this paper agrees well with the finite element simulation under small loads, with some deviations under large loads. The contact resistance is minimized at D = 1.5 and has a linear relationship with G on the double logarithmic axis. It is worth mentioning that the results of the finite element model may be inaccurate when the surface is relatively flat (i.e., when G is small).
The reason is when the height difference between the point clouds is small and the surface is flat at the macro level, fitting the point clouds to generate solid surfaces results in the loss of a significant number of morphological features. Figure 16 demonstrates the reverse modeling approach employed in this study. While the accuracy of the method is improved by merging surfaces through fitting subregions, it still leads to the loss of some morphological features, which is more pronounced when dealing with flat surfaces.

4. Conclusions

Based on fractal theory and the Monte Carlo method, a computational model taking into account the contact characteristics and contact resistance between rough contact surfaces is proposed in this paper. The conclusions are as follows:
(1) The rough surface follows certain rules: as the fractal dimension D increases, the surface becomes finer. Additionally, when the characteristic parameter G increases, the height difference of the surface profile also increases. This observation aligns with the law proposed by the traditional W-M function.
(2) When the fractal dimension D equals 1.5, and under a given contact load, the rough surface exhibits the largest effective contact area and the smallest contact resistance, demonstrating optimal contact characteristics. The relationship between contact load and the effective contact area is approximately linear. In both experimental and finite element verification, the contact model presented in this paper demonstrates relatively high accuracy when F* is less than 4 × 10⁻³. However, under heavy load conditions, there is a certain deviation due to a lack of consideration of the multiscale coupling of asperities.
(3) The existence of oxide film in the rough surface will increase the contact resistance by several orders of magnitude.
Since contact resistance plays a key role in the thermal performance and expected in-service time of electrical contacts, the model serves as a valuable reference for the reliability verification and optimal design of electrical equipment with multiple contacts. The surface simulation and contact analysis described in this study can be extended to other transport properties of rough surfaces, including frictional wear, heat transfer, and radiation.

Author Contributions

Conceptualization, C.Z. and B.Y.; methodology, C.Z. and B.Y.; software, B.Y.; validation, C.Z. and Y.L.; formal analysis, B.Y.; data curation, B.Y.; writing-original draft, B.Y.; visualization, B.Y.; writing-review and editing, C.Z.; supervision, C.Z., Y.L. and Q.Y.; project administration, C.Z.; funding acquisition, C.Z. and Q.Y. All authors have read and agreed to the published version of the manuscript.

Funding

This work was supported in part by the National Natural Science Foundation of China, (No. 52277008, 92066206), and the Funds for Creative Research Groups of Hebei Province, (No. E2020202142). Supported by State Key Laboratory of Reliability and Intelligence of Electrical Equipment (No. EERI_OY2020008).

Institutional Review Board Statement

Not applicable.

Informed Consent Statement

Not applicable.

Data Availability Statement

Not applicable.

Conflicts of Interest

The author declares no conflict of interest.

References

  1. Whitehouse, D.J.; Archard, J.F. The properties of random surfaces of significance in their contact. A Math. Phys. Sci. 1970, 316, 97–121. [Google Scholar]
  2. Majumdar, A.; Bhushan, B. Fractal model of elastic-plastic contact between rough surfaces. J. Tribol.-Trans. Asme 1991, 113, 1–11. [Google Scholar] [CrossRef]
  3. Ge, S.R. The fractal behavior and fractal characterization of rough surfaces. Tribology 1997, 17, 73–80. [Google Scholar]
  4. Thomas, T.R.; Rosén, B.-G.; Amini, N. Fractal characterization of the anisotropy of rough surfaces. Wear 1990, 232, 41–50. [Google Scholar] [CrossRef]
  5. Kang, M.C.; Kim, J.S.; Kim, K.H. Fractal dimension analysis of machined surface depending on coated tool wear. Surf. Coat. Technol. 2005, 193, 259–265. [Google Scholar] [CrossRef]
  6. Jackson, R.L. An Analytical Solution to an Archard-Type Fractal Rough Surface Contact Model. Tribol. Trans. 2010, 53, 543–553. [Google Scholar] [CrossRef]
  7. Chui, M.W.; Feng, Y.Q.; Wang, W.; Li, P.L. Numerical simulation method of 3D gaussian rough surface. Surf. Technol. 2013, 42, 63–65. [Google Scholar]
  8. Archard, J.F. Elastic deformation and the laws of friction. Proc. R. Soc. London Ser. A Math. Phys. Sci. 1957, 243, 190–205. [Google Scholar]
  9. Greenwood, J.A.; Williamson, J.P.B. Contact of nominally flat surfaces. Proc. R. Soc. London Ser. A Math. Phys. Sci. 1966, 295, 300–319. [Google Scholar]
  10. Zhang, X.L.; Chen, Y.H. The model of normal contact stiffness of joint interfaces incorporating elastoplastic deformation mechanism. J. Vib. Eng. 2015, 28, 91–99. [Google Scholar]
  11. Chen, Q.; Xu, F. Research on fractal model of normal contact stiffness between two spheroidal joint surfaces considering friction factor. Tribol. Int. 2016, 97, 253–264. [Google Scholar] [CrossRef]
  12. Song, Z.; Komvopoulos, K. Contact mechanics analysis of oscillatory sliding of a rigid fractal surface against an elastic–plastic half-space. Philos. Mag. 2014, 94, 3215–3233. [Google Scholar] [CrossRef]
  13. Fu, W.P.; Lou, L.T. Theoretical model for the contact stiffness and damping of mechanical joint surface. J. Mech. Eng. 2017, 53, 73–82. [Google Scholar] [CrossRef]
  14. Zhang, X.L.; Wen, S.H. Fractal model of tangential contact damping of plane joint interfaces with simulation. J. Xi’an Jiaotong Univ. 2011, 45, 74–213. [Google Scholar]
  15. Persson, B.N.J.; Bucher, F.; Chiaia, B. Elastic contact between randomly rough surfaces: Comparison of theory with numerical results. Phys. Rev. B 2002, 65, 184106. [Google Scholar] [CrossRef] [Green Version]
  16. Morag, Y.; Etsion, I. Resolving the contradiction of asperities plastic to elastic mode transition in current contact models of fractal rough surfaces. Wear 2007, 262, 624–629. [Google Scholar] [CrossRef]
  17. Yuan, Y.; Cheng, Y.; Liu, K.; Gan, L. A revised Majumdar and Bushan model of elastoplastic contact between rough surfaces. Appl. Surf. Sci. 2017, 425, 1138–1157. [Google Scholar] [CrossRef]
  18. Tong, Y.; Müller, M.; Ostermeyer, G.P. Investigations on the dynamic influence of the contact angle on frictional sliding processes between rough surfaces using NURBS and mortar-based augmented Lagrangian method. Tribol. Int. 2021, 158, 106889. [Google Scholar] [CrossRef]
  19. Hu, J.; Song, H.; Sandfeld, S.; Liu, X.; Wei, Y. Multiscale study of the dynamic friction coefficient due to asperity plowing. Friction 2021, 9, 822–839. [Google Scholar] [CrossRef]
  20. Berman, D.; Walker, M.J.; Krim, J. Contact voltage-induced softening of RF microelectromechanical system gold-on-gold contacts at cryogenic temperatures. J. Appl. Phys. 2010, 108, 044307. [Google Scholar] [CrossRef]
  21. Brown, C.; Rezvanian, O.; Zikry, M.A.; Krim, J. Temperature dependence of asperity contact and contact resistance in gold RF MEMS switches. J. Micromech. Microeng. 2009, 19, 025006. [Google Scholar] [CrossRef] [Green Version]
  22. Broue, A.; Fourcade, T.; Dhennin, J. Validation of bending tests by nanoindentation for micro-contact analysis of MEMS switches. J. Micromech. Microeng. 2010, 20, 085025. [Google Scholar] [CrossRef]
  23. Zhou, M.Q.; Yu, B. A Monte Carlo method for simulating fractal surfaces. Phys. A Stat. Mech. Its Appl. 2007, 386, 176–186. [Google Scholar] [CrossRef]
  24. Krithivasan, V.; Jackson, R.L. An analysis of three-dimensional elasto-plastic sinusoidal contact. Tribol. Lett. 2007, 27, 31–43. [Google Scholar] [CrossRef] [Green Version]
  25. Zhou, M.Q.; Yu, B. Fractal model for thermal contact conductance. J. Heat Transf. 2008, 130, 101301. [Google Scholar] [CrossRef]
  26. Lau, Y.Y.; Yang, W. A higher dimensional theory of electrical contact resistance. J. Appl. Phys. 2009, 105, 124902. [Google Scholar] [CrossRef]
  27. Bhushan, B. The real area of contact in polymeric magnetic media—II: Experimental data and analysis. ASLE Trans. 1985, 28, 181–197. [Google Scholar] [CrossRef]
  28. Ross, R.B. Metallic Materials Specification Handbook; Springer Science & Business Media: Berlin, Germany, 2013. [Google Scholar]
Figure 1. Asperity sets with different scale stacking structures.
Applsci 13 03648 g001
Figure 2. Height interval distribution of asperity set reconstruction.
Applsci 13 03648 g002
Figure 3. Calculation flowchart for simulated surfaces.
Applsci 13 03648 g003
Figure 4. Equivalent schematic diagram of the asperity set.
Applsci 13 03648 g004
Figure 5. Single sinusoidal asperity contact model.
Applsci 13 03648 g005
Figure 6. Contact resistance equivalent circuit model.
Applsci 13 03648 g006
Figure 7. The 3D rough surface under different D and G.
Applsci 13 03648 g007
Figure 8. Variation relationship between A r * and F* for different fractal parameters: (a) G = 10−11 m, D = 1.3–1.7; (b) D = 1.53, G = 10−11–10−15 m.
Applsci 13 03648 g008
Figure 9. The effect of different fractal parameters on the mean separation. (a) G = 10−11 m; (b) D = 1.5.
Applsci 13 03648 g009
Figure 10. Variation in contact area and mean separation with lmax.
Applsci 13 03648 g010
Figure 11. Comparison of model theoretical values and experimental data.
Applsci 13 03648 g011
Figure 12. Variation relationship between F* and R* for different fractal parameters: (a) G = 10−11 m, D = 1.3–1.6; (b) D = 1.53, G = 10−11–10−15 m.
Applsci 13 03648 g012
Figure 13. Variation in ρf versus R.
Applsci 13 03648 g013
Figure 14. Reverse modeling to obtain computational domain, (a) solid model of the contacting bodies; (b) finite-element mesh.
Applsci 13 03648 g014
Figure 15. Comparison of contact resistance calculation and finite element analysis: (a) G = 10−11 m; (b) D = 1.53.
Applsci 13 03648 g015
Figure 16. Loss of morphological features in reverse modeling.
Applsci 13 03648 g016
Table 1. Contact model calculation parameters.
ParametersRange of ValuesParametersRange of Values
D1.3~1.7G/m10−9~10−15
lmax/m10−6~5 × 10−6lmin/m10−8~5 × 10−8
L/m5 × 10−4E*/Pa5.064 × 1010
ρ/(Ωm)4.317 × 10−8ρf/(Ωm)10−4~103
dc/μm0.1~25
Disclaimer/Publisher’s Note: The statements, opinions and data contained in all publications are solely those of the individual author(s) and contributor(s) and not of MDPI and/or the editor(s). MDPI and/or the editor(s) disclaim responsibility for any injury to people or property resulting from any ideas, methods, instructions or products referred to in the content.