Abstract
There is currently a growing interest in replacing the internal combustion engine with electric motors in transportation applications. However, there are different problems related to electric motors for this application. One of them is the oversizing of the energy decoupling system since to ensure that the decoupling capacitor can store the power fluctuations, the capacitance required by the system is usually oversized. This leads to preference for the use of capacitors with construction technologies that have a lower lifetime than the remaining elements of the propulsion system, directly affecting the reliability of the system. In this article, the energy flow handled by the decoupling capacitor is analyzed considering the critical case of operation of an induction motor to minimize the capacitance required by the propulsion system; emphasizing the conditions that generate a higher energy return, from the motor mode of the electric machine to the decoupling capacitor. From the energy analysis, an equation for the capacitor calculation is obtained, involving proportionality factors that relate to the different operating powers, reducing up to 62.2% of the capacitance value required by the decoupling system, under conditions of maximum energy return in motor mode, compared to existing equations in the literature.
1. Introduction
Currently, there is an increasing global concern to reduce greenhouse gas emissions produced by the transportation sector while improving energy efficiency. The migration to the use of electric motors in traction applications [1,2,3,4], which offer several advantages, including significantly higher efficiency than internal combustion engines [5,6,7,8], has been proposed as an option. Within electric motors, three-phase induction motors are of particular interest due to their simplicity, robustness, low cost, low maintenance, and high reliability compared to DC motors [9,10,11,12]. However, the adoption rate of electric vehicles is still low due to the short lifetime of some of the elements that compose the propulsion system (Figure 1) [13,14,15,16].

Figure 1.
Electric vehicle propulsion system.
Regarding the reliability and lifetime of the propulsion system, several studies address strategies to improve the design and selection of these elements, for example in [17] and [18] strategies that contribute to the improvement of the reliability of the battery element belonging to the propulsion system are presented. Another weak point of the propulsion system, due to its short lifetime, is the decoupling element.
The decoupling element has the function of storing energy to damp the fluctuation between the constant power of the DC source and the power present in the load (Figure 2). However, this fluctuation can cause a variation of the DC voltage and a reduction in the system performance [1,19,20], which represents an affectation to the optimal system performance. Because of the negative impact of the aforementioned fluctuation, the importance of the decoupling system addressed in this paper is emphasized, as constant power demand is required to improve system performance [21,22].
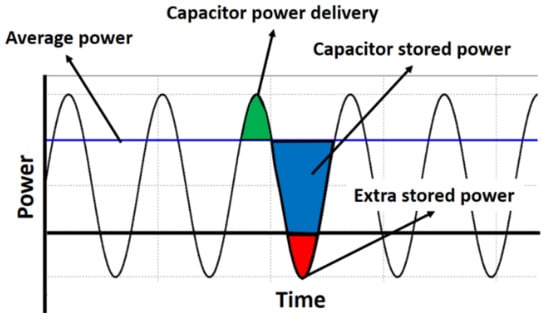
Figure 2.
Instantaneous power using the motor as a load.
The decoupling element is usually oversized by selecting high capacitances to ensure its correct operation in various working scenarios. This leads to the use of electrolytic capacitors due to their high-power density and low cost. However, this capacitor construction technology has a low lifetime compared to the other elements of the propulsion system [19,23,24,25,26,27].
Therefore, several studies have been carried out with alternatives to reduce the size of the decoupling element to select a different construction technology for the capacitor that has a longer lifetime and at the same time has a positive impact on the reliability of the system [28,29]. However, most strategies to minimize the decoupling capacitance require adding additional topology to the system, such as passive filters and active filters [30,31,32,33]. Passive filters include an electrolytic capacitor connected to the DC supply, a series inductance, or coupled filters [34,35,36]. As performed in [30], which adds two notch filter design techniques, the first modulated by triangular and sawtooth carriers and the second passive filter that reduces the current in the nominal operating region. As well as, in some works, a three-port ripple topology is added which allows the capacitor to be reduced [31].
Adding an extra topology or element to the system to perform the function of reducing the capacitance of the decoupling system can negatively affect the robustness, cost, and reliability of the system. Therefore, it is important to explore alternatives that allow the capacitance to be reduced without negatively affecting the system as a whole, which emphasizes the importance of the analysis developed in this article.
The main contribution of this paper is to obtain a minimum capacitance equation necessary to guarantee the minimization of the size of the decoupling system capacitor in the electric vehicle propulsion system, which performs the function of absorbing the power fluctuations of the system. The equation was obtained through an analysis of the power flow in the power electronic converters of the system. The analysis focused on identifying the critical scenario where the highest energy return occurs in the motor operation mode of the electric vehicle, considering the existence of different operation modes of the electric machine, including regenerative braking (generator mode), for which topologies are added to the system for energy management and storage, as reported in previous works [15,37,38]. The developed equation considers the critical case of operation to guarantee the correct operation of the system in working schemes with lower demand than this, avoiding oversizing and at the same time minimizing the minimum capacitance required by the decoupling system without the need to design and implement an extra topology that performs this function in comparison with the options reported in the literature.
The article is organized as follows: Section 2 presents the methodology for selecting the case study, and the mathematical procedure to obtain the minimum capacitance. Subsequently, Section 3 presents the simulation results using the capacitance equation obtained in conjunction with the power system and in addition, the analysis of the simulation results using the developed equation in comparison with existing equations in the literature is presented. Finally, Section 4 presents the conclusions reached in the development of this work.
2. Energy Flow Analysis of the Study Case
In this section, the methodology for the selection of the study case is described. The system operating conditions are defined to obtain the minimum capacitance equation. Likewise, the definition and mathematical development of the equation are presented.
2.1. Case Study Selection
For the selection of the case study, an evaluation of the behavior of the energy flow in the system under different operating profiles of the electric vehicle is performed. The purpose of this is to carry out a comparison between the points with the highest energy return, to subsequently select the operating profile that represents the critical point with the highest energy stored by the decoupling system, which will be used for the development of the mathematical equation proposed in this article. The methodology used for the selection of the case study is listed below:
- The analysis is delimited to the motor operation mode of the electric machine.
- The operation profile to be analyzed (torque variation or speed variation at constant load) is selected.
- The analysis of the power flow behavior in the selected profile is carried out, starting from the inverter current.
- The point with the highest energy return in the working profile is identified.
- The results of the previous point are obtained in both operation profiles.
- A comparison is made of the points of highest energy return obtained in both work profiles (torque variation or speed variation at constant load).
- The critical case with the highest level of energy return obtained from the previous step is selected.
- Mathematical development is performed considering the selected critical case.
The mathematical development of the capacitance required by the decoupling system, using the critical point resulting from the abovementioned comparison, guarantees the correct operation of the system in less demanding work scenarios since it ensures that the calculated capacitor can operate in the case of a higher energy return. For the analysis of the operation profiles of the electric vehicle, a three-phase induction motor is used as load, whose specifications are shown in Table 1, for accurate and consistent results with the application.

Table 1.
Motor specifications.
2.1.1. Torque Variation
In this first operation profile, different slopes in the operation of the electric vehicle are emulated since these situations require different motor powers. For this purpose, a load variation technique is used to simulate the variation of the conditions of use of the electric vehicle.
For the analysis, different levels of torque variation are used to evaluate the power behavior of the system. These levels range from the nominal torque of the motor up to 10% of the motor (Figure 3) and are essential to simulate high and low power demand situations in the vehicle applications.
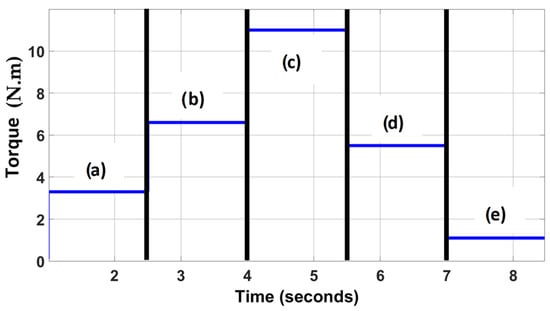
Figure 3.
Torque variation steps: (a) 30% of rated torque; (b) 60% of rated torque; (c) at full load; (d) 50% of rated torque; and (e) 10% of rated torque.
Figure 4 shows the inverter current (iinv) at different intervals of the electric vehicle operation. It can be observed that there are intervals in which there is an energy return, which means that the current is negative. Emphasizing that the purpose of the variations presented is to observe the interval in which the greatest amount of energy is returned to the source.
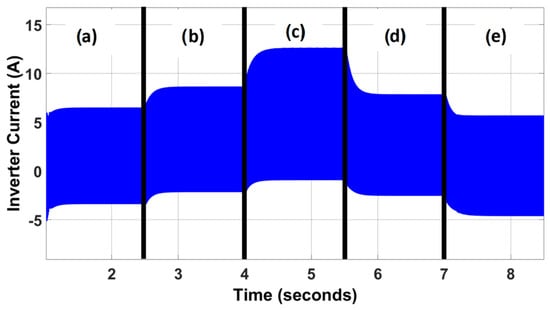
Figure 4.
Inverter current, varying torque: (a) at 30% of rated torque; (b) at 60% of non-minimum torque; (c) at full load; (d) at 50% of rated torque; and (e) at 10% of rated torque.
The previous figure is important because it allows observation of the direction and magnitude of the electric current flowing through the inverter, which provides information about the energy behavior of the system. With the data provided in Figure 3 and Figure 4, it is emphasized that for this work scenario, the highest level of current return to the capacitor is presented at the moment of varying the torque from 50% to 10% of the nominal load.
2.1.2. Speed Variation at Constant Load
In this operation profile, the speed variation at a constant load is performed, which consists of modifying the speed of the electric motor while maintaining a constant load. This is done to observe the behavior of the energy under frequency and voltage variations.
To perform this operation profile, different voltage and frequency levels are applied to the electric motor, trying to maintain a constant load. In this way, the behavior and performance of the motor under different operating conditions can be evaluated. Figure 5 shows the inverter current obtained at different test speeds at constant load, which allows observation of the variation of the current as a function of the speed of the electric motor.
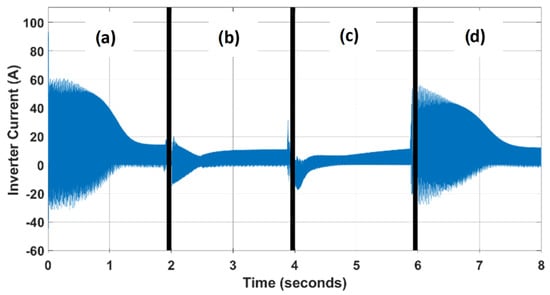
Figure 5.
Inverter current, constant load at variable speed. With speed steps from: (a) 0% to 100%; (b) 100% to 80%; (c) 80% to 35%; (d) 35% to 90%.
To perform the speed variation at constant load, previously defined speed variation steps are used. These steps are shown in Figure 6 and represent the different frequency and voltage levels applied to the electric motor used as load.
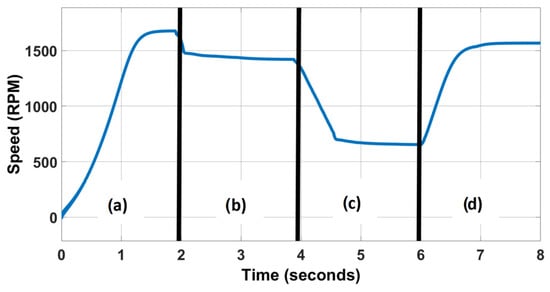
Figure 6.
Speed variation ranges from: (a) 0% to 100%; (b) 100% to 80%; (c) 80% to 35%; (d) 35% to 90%.
Considering the information shown in Figure 5 and Figure 6, it can be observed that in this operating profile, the highest current return from the inverter to the decoupling capacitor occurs when varying from the idle state to the rated speed. Realizing a comparison between the critical point obtained in the first scenario (torque variation) and the critical point obtained in this second operation profile, the critical point that occurs when the speed of the electric motor is varied from the idle state to reach 100% of the nominal speed in the shortest possible time, under the conditions established in the work, is selected as a case study, from which the mathematical equation of minimum capacitance developed in this article is based.
To develop the required minimum capacitance equation, it is necessary to identify the critical intervals of the returned power, in the previously selected case study. Subsequently, simulations were performed with the specifications shown in Table 2, to obtain the signal patterns of the inverter and the DC-link in these critical intervals.

Table 2.
Design specifications used for the analysis.
The waveform pattern of the inverter current and capacitor voltage (VC) waveforms are shown in Figure 7, zooming in on Figure 8.
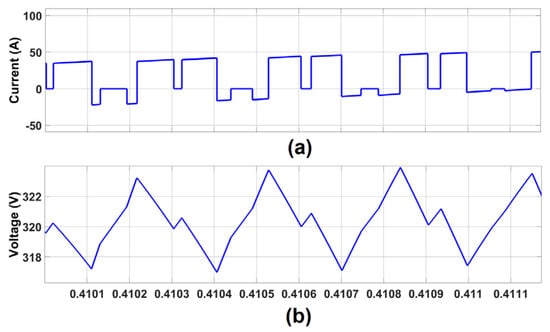
Figure 7.
Capacitor voltage waveform pattern (a); inverter current (b) in the critical case.
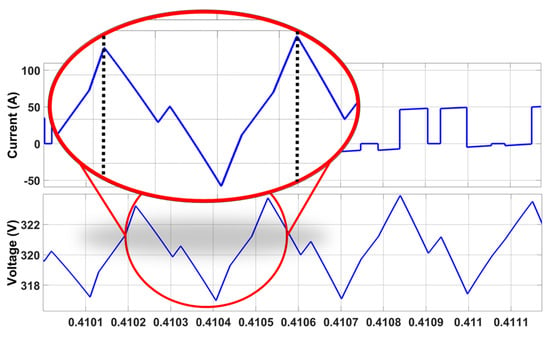
Figure 8.
Inverter current zooming in on the critical case.
From Figure 8, it can be seen that the pattern is directly affected by the switching signals. However, it was detected that a certain pattern is followed every six intervals. For this reason, the signal is sectioned to deduce the capacitance in the largest ripple presented (worst case), Figure 9, Table 3 defines the intervals. Observing that in sections four, five, and six is when the steepest positive slopes are presented, this indicates that these are the moments in which more energy is returned.
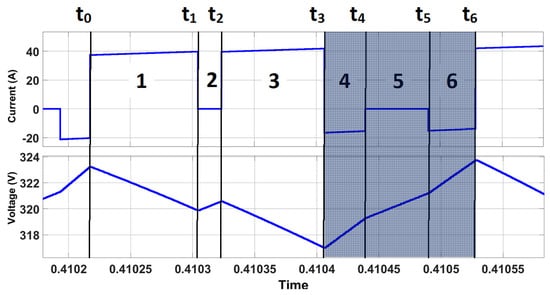
Figure 9.
Maximum energy return intervals.

Table 3.
Distribution of sections and intervals in the critical case.
2.2. Development of a Mathematical Model
For the analysis and mathematical development of the proposed capacitance equation, the analysis of the currents presented in Figure 10 are used as a starting point.
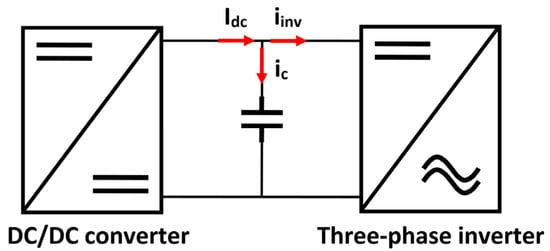
Figure 10.
Identification of study currents.
The development of the calculation of the minimum capacitance required is addressed in Equations (1)–(19), which start from Kirchhoff’s current law, taking as reference the incoming and outgoing currents in the decoupling circuit, as well as the operating mode of the load [39,40]. Subsequently, the data pertaining to the critical case of operation, which is characterized by the highest energy return to the decoupling circuit, is addressed. This analysis neglects the effects of heating and degradation of the DC-link.
Using Kirchhoff’s law of nodes, obtaining:
where IDC is the DC–DC converter current; iC is the capacitor current and iinv is the inverter current.
Knowing that the capacitor current is equal to the capacitance multiplied by the derivative of the voltage across the capacitor concerning time (2). Substituting (2) in (1) we obtain (3):
where C is the decoupling capacitance; is the ratio of voltage change with respect to time.
The capacitance C is solved from (3) and (4) assuming the derivatives as an increase in voltage value, C is obtained with (5).
Subsequently, the ratio of the nominal power of the system with the power of the case study is determined, in which the critical point of returned energy is carried out because under this circumstance the capacitor must be able to handle the maximum variation. The above relation is performed employing proportionality factors, obtaining (6).
where K is the general proportionality factor; Pnom s is the nominal power of the system and Pmáxreq is the worst-case power (case study).
Deducting Pmáxreq from (6) (7) and (8) are obtained:
where Imáxreq is the worst case current (study case) and VDC is the DC–DC converter voltage. Equaling (7) and (8) we obtain (9). From this, the maximum current required in the worst case is obtained according to (10).
Considering the intervals discussed at the end of the previous section where the case study was selected. It is solved of (11), considering the study times, obtaining (12):
However, as presented in Figure 9 the current Imáxreq5 of the intervals t4 and t5 are zero. Considering this solution (12) is obtained (13).
To obtain the inverter current in terms of power, (10) is substituted into (13), and (14) is obtained:
The proportionality factors K4 and K6 have a negative value derived from the direction of the current, which is returned from the load to the source.
Subsequently, it is sought to obtain a relationship between the intervals used in (14), concerning the inverter switching frequency used. This is because when varying said frequency, the duration of the intervals used in the capacitance equation developed is modified.
Through the analysis of the intervals in which the critical case occurs under the conditions established in the work. as well as the influence of the modulation in them, is obtained (15), which is used to calculate the time in which the maximum energy of the critical case is returned. Equation (15) represents the ratio of the complete interval, from T0 to T6 concerning the switching frequency.
where fsw is the modulation switching frequency.
Once the dimension of the interval increment is defined, the relation concerning t4 and t6 where the energy return occurs was determined, with (16) and (17), respectively. Equations (16) and (17) show the relation between the inverter switching frequency and the intervals in which energy is returned to the decoupling system. This returned energy is added to the energy managed by the DC-link, resulting in the critical case of maximum energy storage by the DC-link (critical case).
Equations (15)–(17) are used to determine the exact duration of the intervals when the switching frequency in the inverter varies.
Finally, substituting (14) in (5) and considering (18), the required capacitance equation is obtained with (19).
The negative sign of the K-factors represents the energy returned from the load to the source, which is added to the energy delivered by the source and together they represent the total energy stored in the link capacitor at that instant.
3. Results
This section presents simulation results to validate the capacitance equation developed in this work, considering the selected critical operating case when the highest energy return occurs. This occurs when the motor accelerates from 0% to 100% of its rated speed at maximum load in the shortest possible time, using the established design specifications (Table 4) for the three-phase full-bridge inverter with SPWM modulation using a modulation index of 0.9 and a switching frequency of 3300 Hz. These specifications contribute to establishing the operating limits of the critical case mentioned and thus delimit the analysis of the system behavior through the graphs and results presented in this paper. The schematic diagram of the system is shown in Figure 11.

Table 4.
Design specifications used.

Figure 11.
Schematic system diagram.
In this work, because it works with a multiphase DC boost converter (five phases), the switching frequency of each phase is 50 kHz, so the output presents a signal with a frequency of 250 kHz, which compared to the switching frequency of the inverter designed (3.3 kHz) is considerably higher, so the behavior of the waveform concerning the switching of the converter does not interfere significantly with the objective of the analysis of the power flow between the decoupling capacitor and the inverter, addressed in this article.
To carry out the validation of the minimum required capacitance equation obtained in this work, presented at the end of the previous section, the following steps are performed:
- Average values of K-parameters are proposed to be used in (19).
- Voltage ripples are proposed and used in (19) together with the K parameters obtained in the previous step and minimum required capacitance values are obtained.
- The simulation of the complete system is carried out using the minimum required capacitance values obtained.
- The voltage ripples are obtained by simulation using the minimum capacitance value obtained previously.
- The error percentage between the values initially proposed and the values obtained using (19) is calculated.
Firstly, to obtain the K parameters of (19), different 3 HP motors were simulated, considering the selected application and critical case. The obtained values are presented in Table 5.

Table 5.
K parameters obtained.
The average value of these parameters K in the case study is used in the capacitance equation of (19), resulting in (20), (21), and (22):
Emphasizing that the obtained values belong to the critical case selected and to the proposed application.
Subsequently, different voltage ripples are proposed to verify the good performance of the capacitance equation developed. Table 6 shows different proposed voltage ripples and the minimum capacitances obtained using these values in (19).

Table 6.
Proposed voltage ripples and obtained minimum capacitance.
The calculated capacitance under the different proposed voltage ripples is implemented in the complete system. Figure 12 shows the voltage ripples obtained using the different capacitance values calculated with the developed equation. The purpose is to compare the initially proposed voltage ripples with those obtained using the minimum required capacitance equation developed in this work, to obtain a percentage error between them.

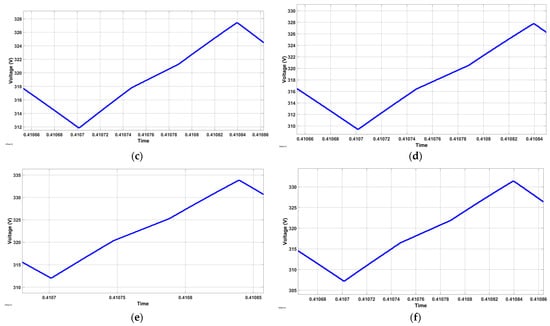
Figure 12.
Voltage ripples obtained in simulation, using the capacitance with the proposed equation: (a) 3%; (b) 4%; (c) 5%; (d) 6%; (e) 7%; (f) 8%.
Considering the voltage ripple values obtained in simulations using the theoretically developed minimum required capacitance values, a comparison with the initially proposed voltage ripple is carried out; Figure 13 presents this comparison.
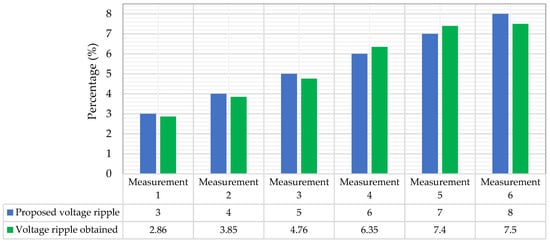
Figure 13.
Comparison between proposed voltage ripples and voltage ripples obtained with developed minimum capacitance equation.
The data in the previous table were used to calculate the error percentages between what was proposed and what was obtained in simulations under the minimum capacitance equation developed, obtaining the results shown in Table 7.

Table 7.
Percentage error between proposed voltage ripples and ripples obtained in simulation.
As shown in Table 7, the highest error percentage obtained using the proposed equation is 6.25%, with respect to the proposed initial value of voltage ripple.
Once the correct operation of the equation has been validated, Table 8 shows a comparison between the capacitance value obtained using the proposed equation and the capacitance value required using the following existing equations in the literature [30,31], respectively.

Table 8.
Capacitance values using existing equations and the proposed equation, with a 3% voltage ripple.
The minimum capacitance value required by the system using the equation developed in this paper is lower by 2.6 and 1.51 times, compared with [30] and [31], respectively.
Is important to emphasize that the developed equation can be applied in different applications only by modifying the proportionality factors. For example, for applications or scenarios where an induction motor service factor of 1.25 is required (whose specifications are described in the previous section), only the proportionality factors are recalculated, resulting in (25), (26), and (27); these factors are used in the minimum capacitance equation developed in this paper, resulting in (28), proposing a voltage ripple of 3%.
Finally, the process to achieve the transfer of the analysis and the developed equation is listed below:
- Select the application for which the induction motor will be used. Select the application for which the induction motor will be used to obtain the design specifications for the system.
- Identify the study intervals. That is the intervals of maximum energy return to the decoupling system.
- Calculate the proportionality factors through (6), considering the intervals established in the previous point.
- Substitute the obtained values of proportionality factors and the design specifications of the selected application in the developed main equation of minimum required capacitance (19).
4. Conclusions
This paper presents a solution to avoid oversizing the decoupling system belonging to the electric vehicle propulsion system by using an equation that optimally calculates the minimum capacitance required for the decoupling element, analyzing the energy flow in the system’s power electronic converters.
The equation is based on the critical scenario of the highest energy return in the electric vehicle motor mode operation, which occurs when the motor speed varies from 0% to 100% of its rated speed, at maximum load, in the shortest possible time, ensuring the correct operation in less demanding scenarios. Employing this equation reduced the capacitance required in the decoupling system by 49.9% to 62.2%, compared to existing equations in the literature. In addition, errors of 3.75% to 6.25% were obtained between what was obtained theoretically and in simulation using the equation proposed in conjunction with a full three-phase bridge inverter with SPWM modulation using a modulation index of 0.9, and a switching frequency of 3300 Hz.
The implementation of the equation developed allows selecting and using capacitors with more reliable technologies and with a longer useful life in the decoupling element belonging to the propulsion system, and at the same time avoiding its oversizing, which has a positive impact on the performance of the electric vehicle propulsion system.
Finally, it is important to emphasize that the minimum capacitance equation developed in this paper is easily scalable for its implementation in different working schemes, broadening its application spectrum.
Author Contributions
Conceptualization, M.P.-S., G.C.-L. and L.M.C.-S.; methodology, L.M.C.-S., M.P.-S., G.C.-L., L.H.-G.; software, L.M.C.-S., Y.R.-S., G.C.-L.; validation, L.M.C.-S., M.P.-S., G.C.-L. and L.H.-G.; formal analysis, L.M.C.-S., M.P.-S., Y.R.-S., G.C.-L.; investigation, M.P.-S., L.H.-G., G.C.-L.; resources, L.H.-G., Y.R.-S., O.U.J.-S., G.C.-L.; data curation, Y.R.-S., O.U.J.-S., G.C.-L.; writing—original draft preparation, L.M.C.-S., M.P.-S., Y.R.-S., G.C.-L.; writing—review and editing, L.M.C.-S., M.P.-S., L.H.-G., G.C.-L.; visualization, Y.R.-S., O.U.J.-S., G.C.-L.; supervision, M.P.-S., L.H.-G., Y.R.-S., G.C.-L.; project administration, M.P.-S., L.H.-G., G.C.-L.; funding acquisition, M.P.-S., L.H.-G., O.U.J.-S., G.C.-L. All authors have read and agreed to the published version of the manuscript.
Funding
This research received no external funding.
Institutional Review Board Statement
Not applicable.
Informed Consent Statement
Not applicable.
Data Availability Statement
The data obtained in this study are available on request from the authors.
Conflicts of Interest
The authors declare no conflict of interest.
References
- Reddy, K.J.; Natarajan, S. Energy sources and multi-input DC-DC converters used in hybrid electric vehicle applications–A review. Int. J. Hydrog. Energy 2018, 43, 17387–17408. [Google Scholar] [CrossRef]
- Wang, C.; Xiong, R.; He, H.; Ding, X.; Shen, W. Efficiency analysis of a bidirectional DC/DC converter in a hybrid energy storage system for plug-in hybrid electric vehicles. Appl. Energy 2016, 183, 612–622. [Google Scholar] [CrossRef]
- Langbroek, J.H.; Cebecauer, M.; Malmsten, J.; Franklin, J.P.; Susilo, Y.O.; Georén, P. Electric vehicle rental and electric vehicle adoption. Res. Transp. Econ. 2019, 73, 72–82. [Google Scholar] [CrossRef]
- Nakamoto, Y.; Nishijima, D.; Kagawa, S. The role of vehicle lifetime extensions of countries on global CO2 emissions. J. Clean. Prod. 2019, 207, 1040–1046. [Google Scholar] [CrossRef]
- Luin, B.; Petelin, S.; Al-Mansour, F. Microsimulation of electric vehicle energy consumption. Energy 2019, 174, 24–32. [Google Scholar] [CrossRef]
- Tran, T.-V.; Edouard, N.; Mikati, K.; Pellerey, P.; Assaad, B. Optimal design and experimental prototype testing of a low-cost machine for city battery electric vehicle. In Proceedings of the 2018 IEEE Energy Conversion Congress and Exposition (ECCE), Portland, OR, USA, 23–27 September 2018; pp. 3886–3892. [Google Scholar]
- Szántó, A.; Kiss, J.; Mankovits, T.; Szíki, G.Á. Dynamic Test Measurements and Simulation on a Series Wound DC Motor. Appl. Sci. 2021, 11, 4542. [Google Scholar] [CrossRef]
- Szíki, G.Á.; Szántó, A.; Mankovits, T. Dynamic modelling and simulation of a prototype race car in MATLAB/Simulink applying different types of electric motors. Int. Rev. Appl. Sci. Eng. 2021, 12, 57–63. [Google Scholar] [CrossRef]
- Kapustin, A.; Terentiev, A. Rational Lifetime of a Vehicle in Terms of Ensuring Security of Its Design. Transp. Res. Procedia 2017, 20, 254–260. [Google Scholar] [CrossRef]
- Cheng, S.; Li, C.; Chai, f.; Gong, H. Research on Induction Motor for Mini Electric Vehicles. Energy Procedia 2012, 17, 249–257. [Google Scholar] [CrossRef]
- Guan, Y.; Zhu, Z.Q.; Afinowi, I.A.A.; Mipo, J.C.; Farah, P. Difference in maximum torque-speed characteristics of induction machine between motor and generator operation modes for electric vehicle application. Electr. Power Syst. Res. 2016, 136, 406–414. [Google Scholar] [CrossRef]
- Joseph, J.J.; Juliha, J.; Josh, F. Review on the recent development of the power converters for electric vehicle. In Proceedings of the 2017 2nd International Conference on Communication and Electronics Systems (ICCES), Coimbatore, India, 19–20 October 2017; pp. 641–644. [Google Scholar]
- Hu, H.; Harb, S.; Kutkut, N.H.; Shen, Z.J.; Batarseh, I. A single-stage microinverter without using eletrolytic capacitors. IEEE Trans. Power Electron. 2012, 28, 2677–2687. [Google Scholar] [CrossRef]
- Gao, Z.; LaClair, T.; Ou, S.; Huff, S.; Wu, G.; Hao, P.; Boriboonsomsin, K.; Barth, M. Evaluation of electric vehicle component performance over eco-driving cycles. Energy 2019, 172, 823–839. [Google Scholar] [CrossRef]
- Cao, J.; Emadi, A. A New Battery/UltraCapacitor Hybrid Energy Storage System for Electric, Hybrid, and Plug-In Hybrid Electric Vehicles. IEEE Trans. Power Electron. 2012, 27, 122–132. [Google Scholar] [CrossRef]
- Husain, I. Electric and hybrid vehicles: Design fundamentals; CRC Press: Boca Raton, FL, USA, 2010. [Google Scholar]
- Loganathan, M.K.; Mishra, B.; Tan, C.; Kongsvik, T.; Rai, R.N. Multi-Criteria decision making (MCDM) for the selection of Li-Ion batteries used in electric vehicles (EVs). Mater. Today Proc. 2020, 41, 1073–1077. [Google Scholar] [CrossRef]
- Loganathan, M.K.; Tan, C.M.; Sultana, S.; Hsieh, I.Y.L.; Kumaraswamidhas, L.A.; Rai, R.N. Parametric performance analysis of battery operated electric vehicle. In Proceedings of the 2021 International Conference on Sustainable Energy and Future Electric Transportation (SEFET), Hyderabad, India, 21–23 January 2021; pp. 1–6. [Google Scholar]
- Wen, H.; Xiao, W.; Wen, X.; Armstrong, P. Analysis and Evaluation of DC-Link Capacitors for High-Power-Density Electric Vehicle Drive Systems. IEEE Trans. Veh. Technol. 2012, 61, 2950–2964. [Google Scholar] [CrossRef]
- Rachev, E.; Petrov, V. DC link capacitor selection for DC-DC converters. In Proceedings of the 2020 12th Electrical Engineering Faculty Conference (BulEF), Varna Town, Bulgaria, 9–12 September 2020; pp. 1–5. [Google Scholar]
- Meral, M.E.; Çelik, D. Mitigation of DC-link voltage oscillations to reduce size of DC-side capacitor and improve lifetime of power converter. Electr. Power Syst. Res. 2021, 194, 107048. [Google Scholar] [CrossRef]
- Sher, H.A.; Addoweesh, K.E.; Khan, Y. Effect of short circuited DC link capacitor of an AC–DC–AC inverter on the performance of induction motor. J. King Saud Univ.-Eng. Sci. 2016, 28, 199–206. [Google Scholar] [CrossRef]
- Sridharan, S.; Kikuchi, J. DC-Link Capacitor Sizing in HEV/EV e-Drive Power Electronic System from Stability Viewpoint; SAE Technical Paper 2020-01-0468; SAE: Warrendale, PA, USA, 2020. [Google Scholar] [CrossRef]
- He, P.; Khaligh, A. Comprehensive analyses and comparison of 1 kW isolated DC–DC converters for bidirectional EV charging systems. IEEE Trans. Transp. Electrif. 2016, 3, 147–156. [Google Scholar] [CrossRef]
- Li, Y.; Liu, M.; Lau, J.; Zhang, B. A novel method to determine the motor efficiency under variable speed operations and partial load conditions. Appl. Energy 2015, 144, 234–240. [Google Scholar] [CrossRef]
- Moreno-Basaldúa, E.A.; Morales-Saldaña, J.A.; Loera-Palomo, R. Design methodology for quadratic step-up dc-dc converters based on non-cascading structures. In Proceedings of the 2016 13th International Conference on Power Electronics (CIEP), Guanajuato, Mexico, 20–23 June 2016; pp. 210–215. [Google Scholar]
- Heydari-Doostabad, H.; Hosseini, S.H.; Ghazi, R.; Donnell, T.O. Pseudo DC-Link EV Home Charger With a High Semiconductor Device Utilization Factor. IEEE Trans. Ind. Electron. 2022, 69, 2459–2469. [Google Scholar] [CrossRef]
- Yao, F.; Wang, B.; Li, Z.; Peng, Y. Reliability study on DC-link capacitor in fault states of VSI in elective vehicle. J. Eng. 2019, 2544–2550. [Google Scholar] [CrossRef]
- Li, Q.; Jiang, D. DC-link Current Analysis of Three-Phase Two-Level VSI Considering AC Current Ripple. IET Power Electron. 2017, 11, 202–211. [Google Scholar] [CrossRef]
- Krein, P.T.; Balog, R.S.; Mirjafari, M. Minimum Energy and Capacitance Requirements for Single-Phase Inverters and Rectifiers Using a Ripple Port. IEEE Trans. Power Electron. 2012, 27, 4690–4698. [Google Scholar] [CrossRef]
- Hussain, M.; Talha, M.; Raihan, S.; Butt, O.; Butt, T.; Ashfaq, M. Simulative Study to Reduce DC-Link Capacitor of Drive Train for Electric Vehicles. Energies 2022, 15, 4499. [Google Scholar] [CrossRef]
- Sridharan, S.; Kimmel, J.; Kikuchi, J. DC-Link Capacitor Sizing Considerations for HEV/EV e-Drive System. SAE Tech. Pap. 2017. Available online: https://www.sae.org/publications/technical-papers/content/2017-01-1234/ (accessed on 14 February 2023).
- Mnati, M.J.; Abed, J.K.; Bozalakov, D.V.; Van den Bossche, A. Analytical and calculation DC-link capacitor of a three-phase grid-tied photovoltaic inverter. In Proceedings of the 2018 IEEE 12th International Conference on Compatibility, Power Electronics and Power Engineering (CPE-POWERENG 2018), Doha, Qatar, 10–12 April 2018; pp. 1–6. [Google Scholar]
- Monteiro, V.; Afonso, J.L. A Unified Topology for the Integration of Electric Vehicle, Renewable Energy Source, and Active Filtering for the Power Quality Improvement of the Electrical Power Grid: An Experimental Validation. Electronics 2022, 11, 429. [Google Scholar] [CrossRef]
- Schäfer, J.; Kolar, J.W. Three-Port Series-Resonant DC/DC Converter for Automotive Charging Applications. Electronics 2021, 10, 2543. [Google Scholar] [CrossRef]
- Barlini, D. DC-Link Decoupling Circuit for Parallel Inverters. European Patent 12156390.2, EP 2631104A1, 2013. Available online: https://worldwide.espacenet.com/patent/search/family/045656326/publication/EP2631104A1?q=12156390.2 (accessed on 14 February 2023).
- Farhadi, M.; Mohammed, O. Energy Storage Technologies for High-Power Applications. IEEE Trans. Ind. Appl. 2016, 52, 1953–1961. [Google Scholar] [CrossRef]
- Naseri, F.; Farjah, E.; Ghanbari, T. An Efficient Regenerative Braking System Based on Battery/Supercapacitor for Electric, Hybrid, and Plug-In Hybrid Electric Vehicles With BLDC Motor. IEEE Trans. Veh. Technol. 2017, 66, 3724–3738. [Google Scholar] [CrossRef]
- Gillespie, T. Fundamentals of Vehicle Dynamics; SAE International: Warrendale, PA, USA, 2021. [Google Scholar]
- Guzzella, L.; Sciarretta, A. Vehicle Propulsion Systems; Springer: Berlin/Heidelberg, Germany, 2007; Volume 1. [Google Scholar]
Disclaimer/Publisher’s Note: The statements, opinions and data contained in all publications are solely those of the individual author(s) and contributor(s) and not of MDPI and/or the editor(s). MDPI and/or the editor(s) disclaim responsibility for any injury to people or property resulting from any ideas, methods, instructions or products referred to in the content. |
© 2023 by the authors. Licensee MDPI, Basel, Switzerland. This article is an open access article distributed under the terms and conditions of the Creative Commons Attribution (CC BY) license (https://creativecommons.org/licenses/by/4.0/).