
Artificial Intelligence Approach for Early Detection of Brain Tumors Using MRI Images


Abstract
:1. Introduction
2. Materials and Methods
2.1. Materials
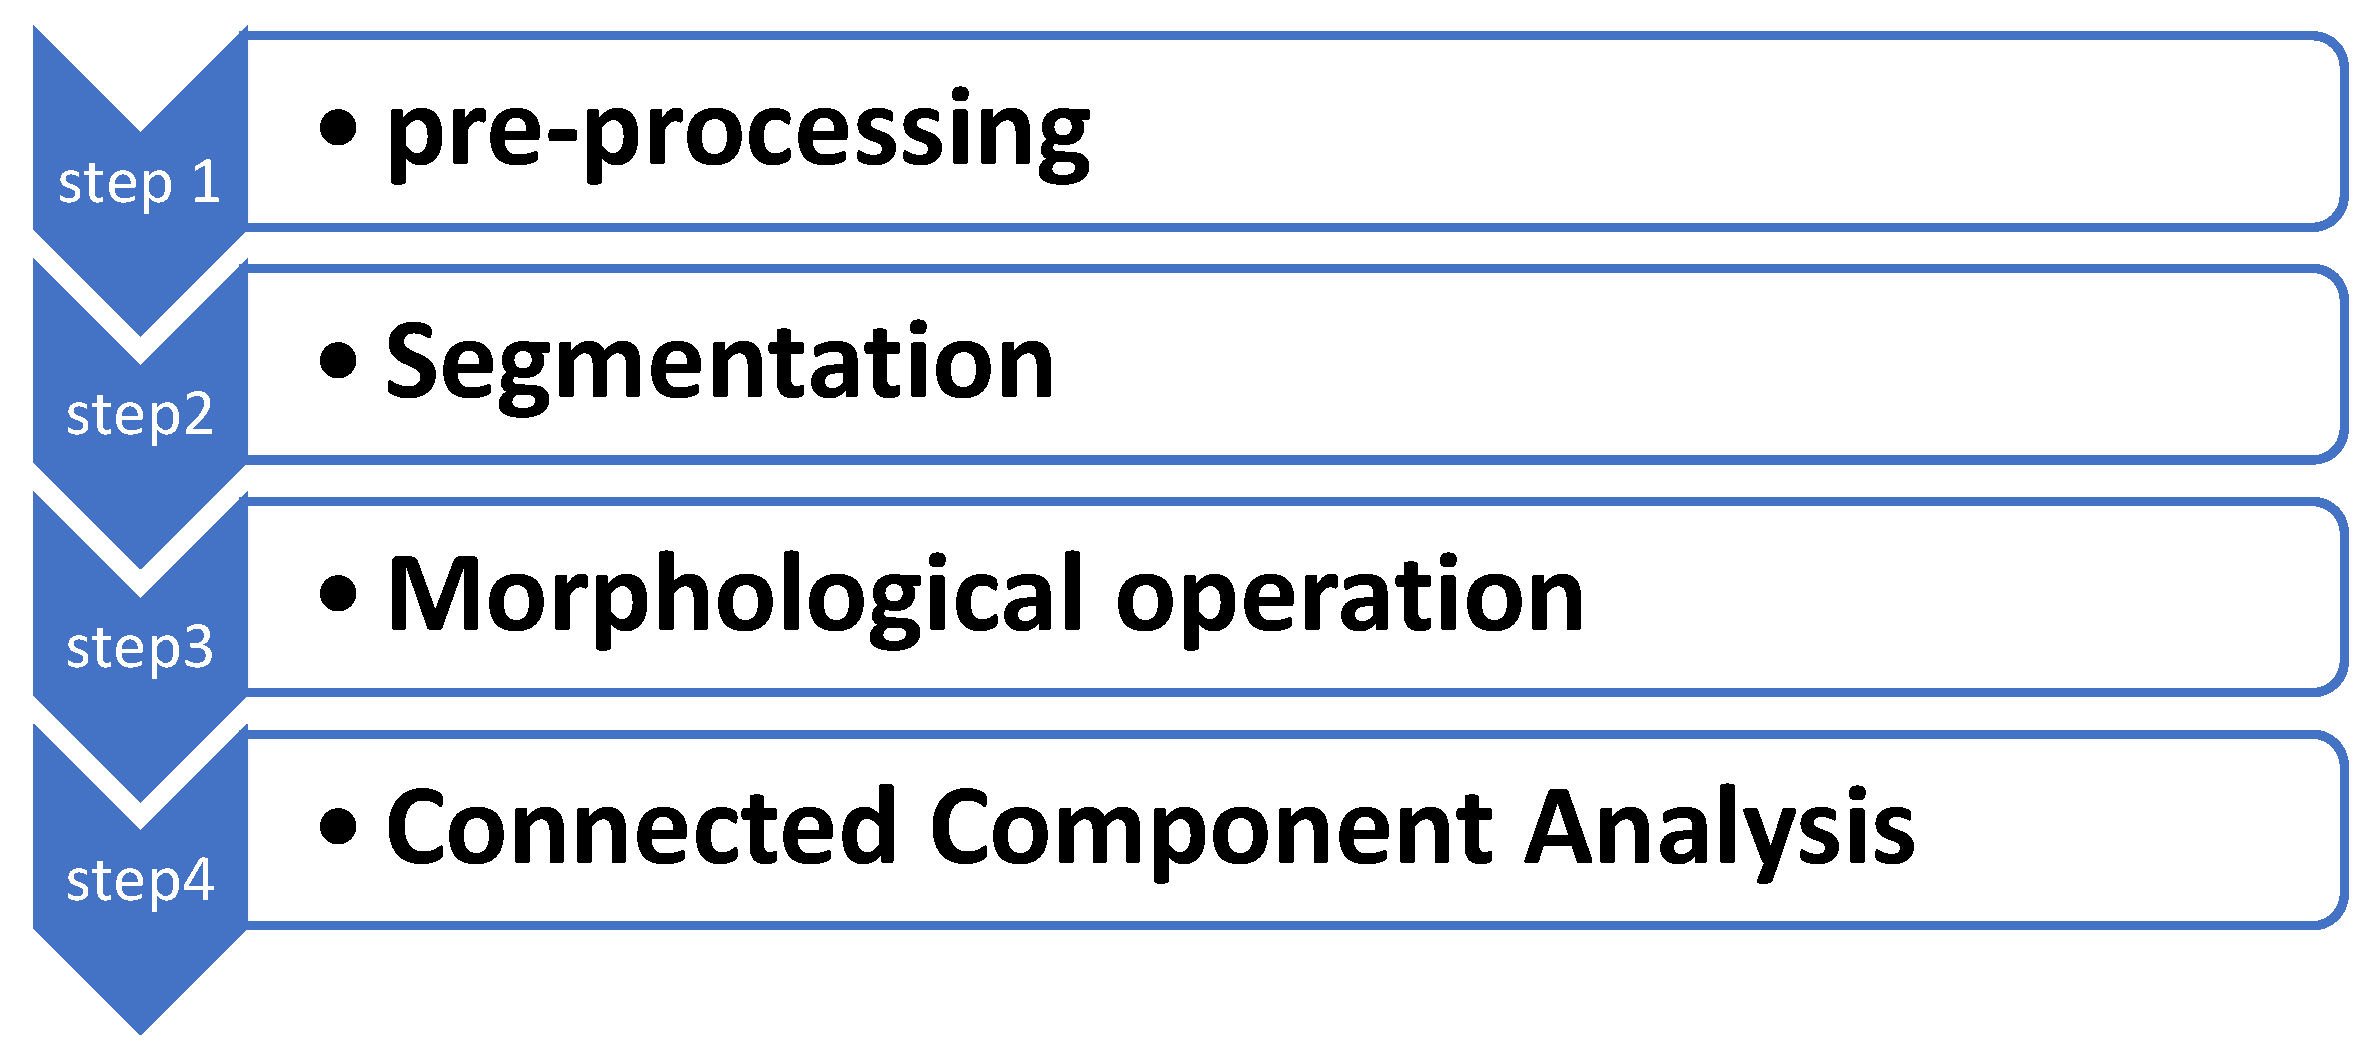
2.2. Methods
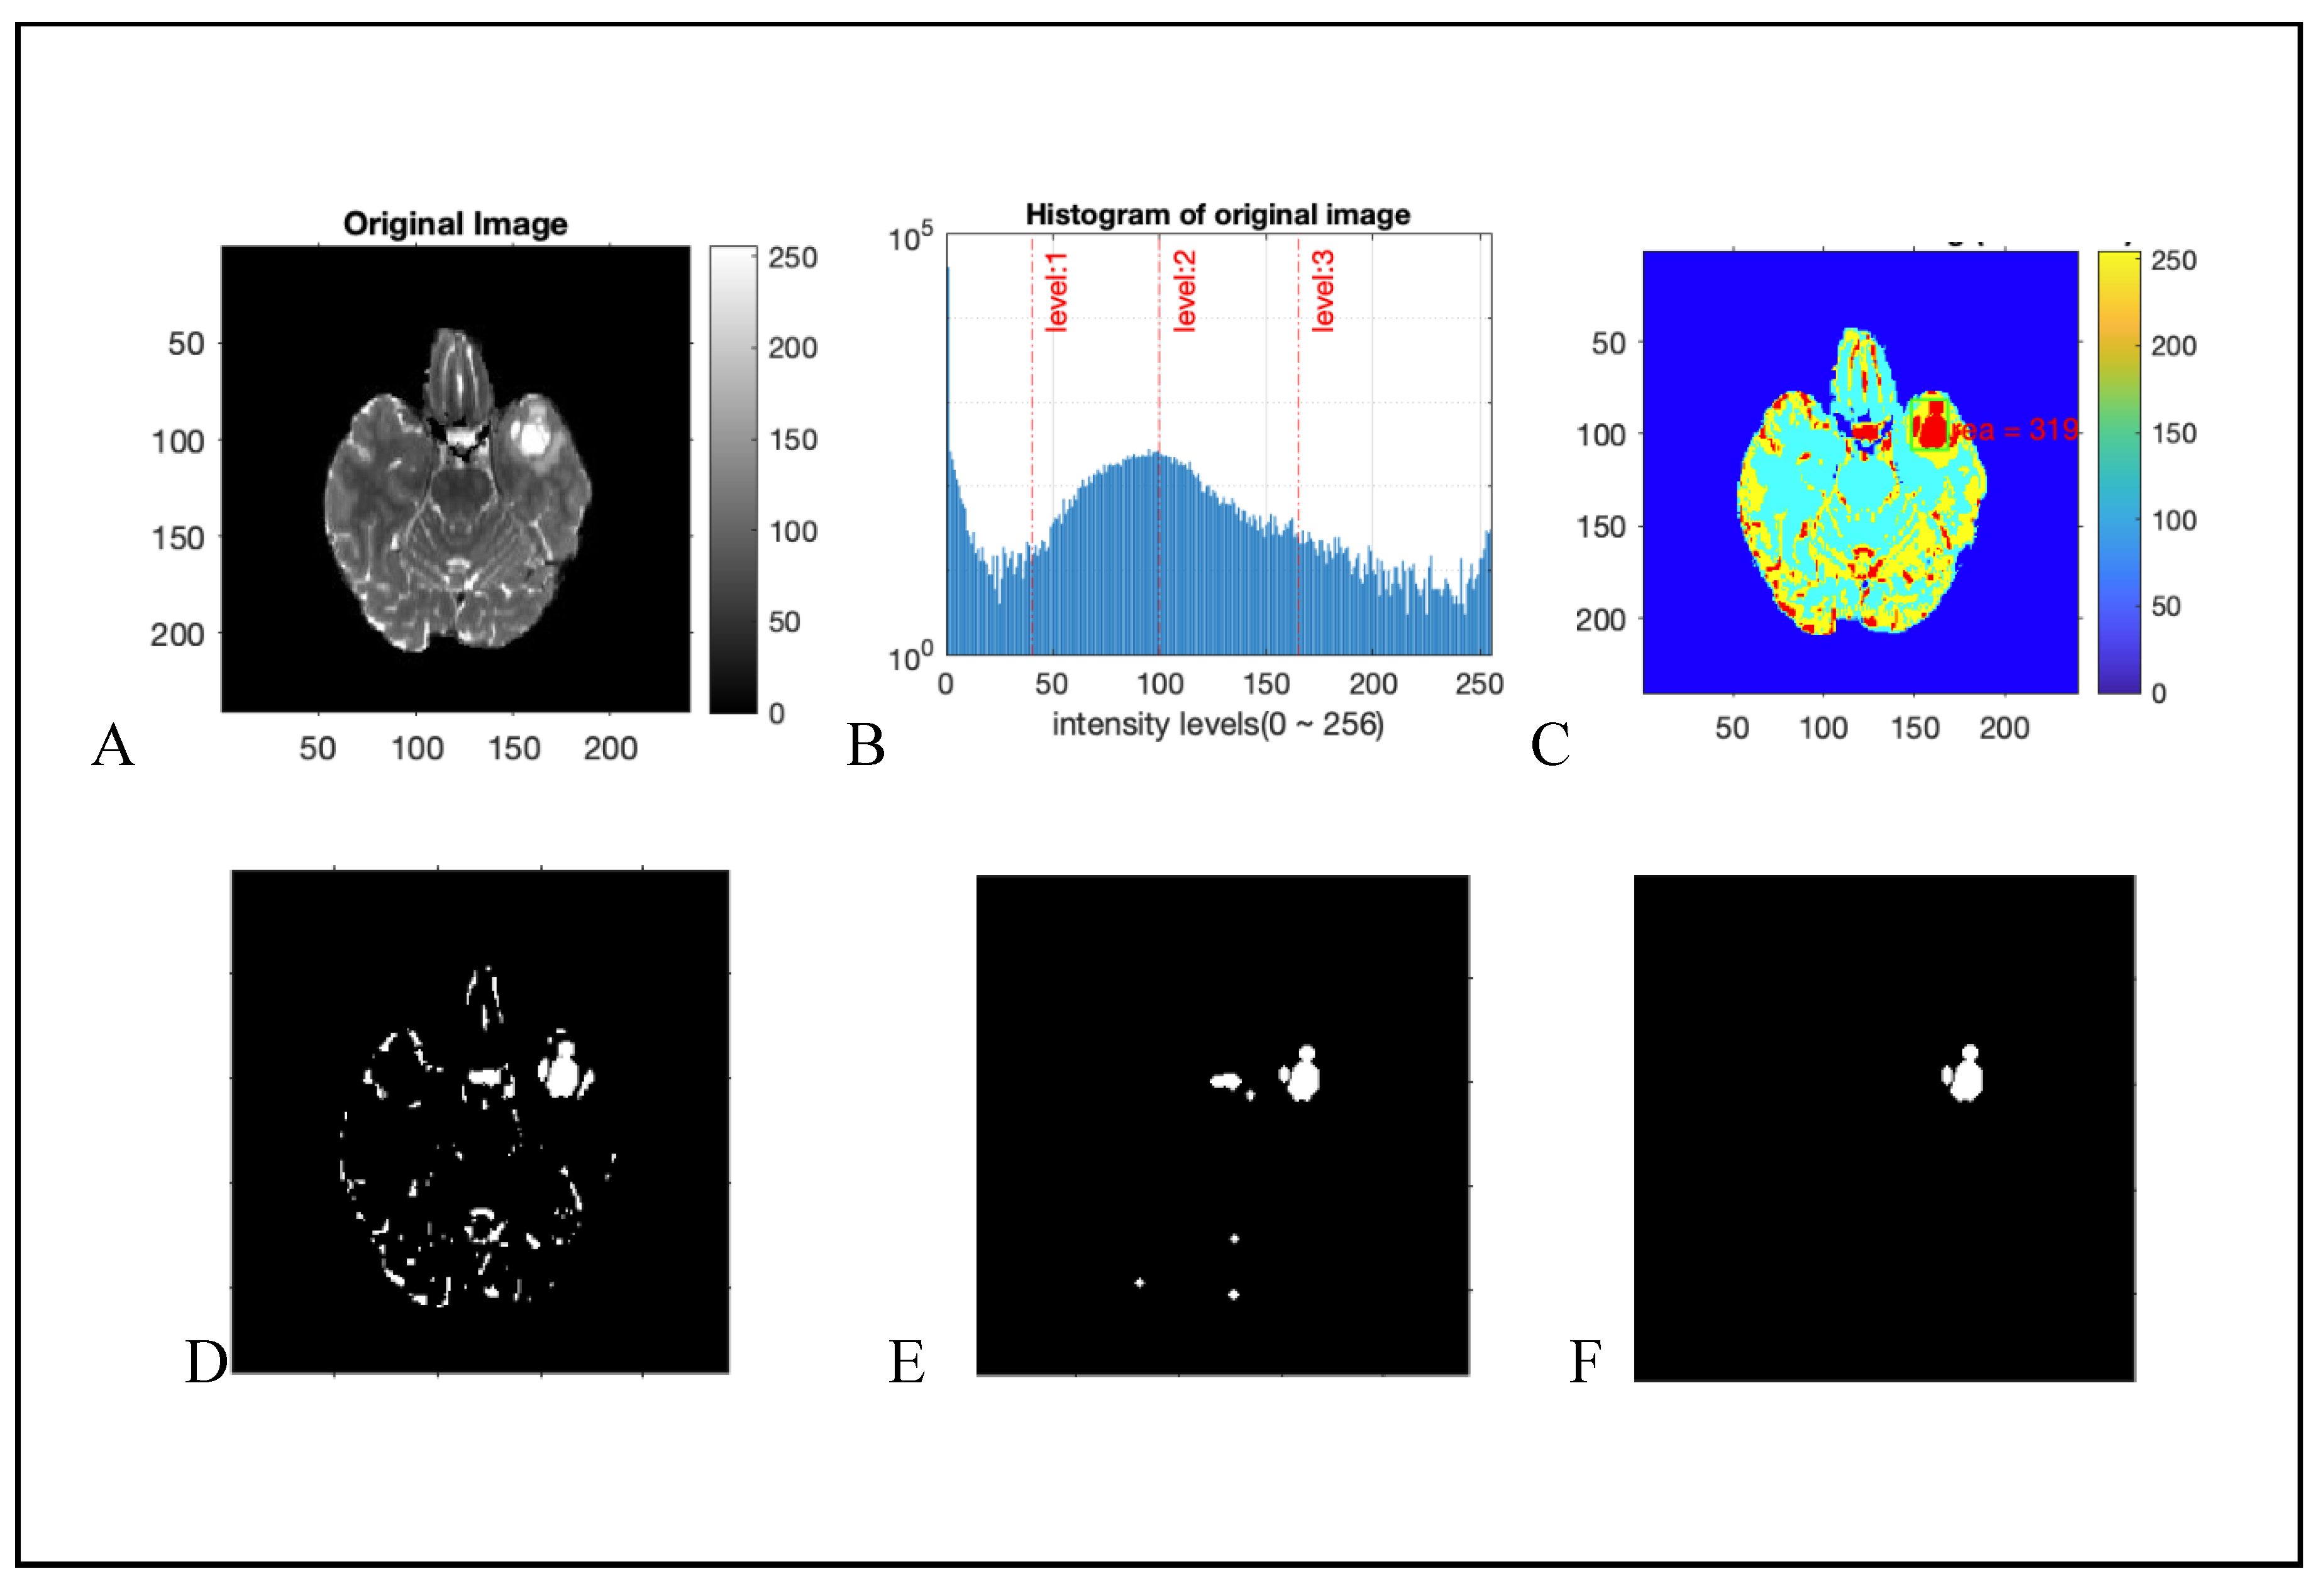
2.2.1. Pre-Processing
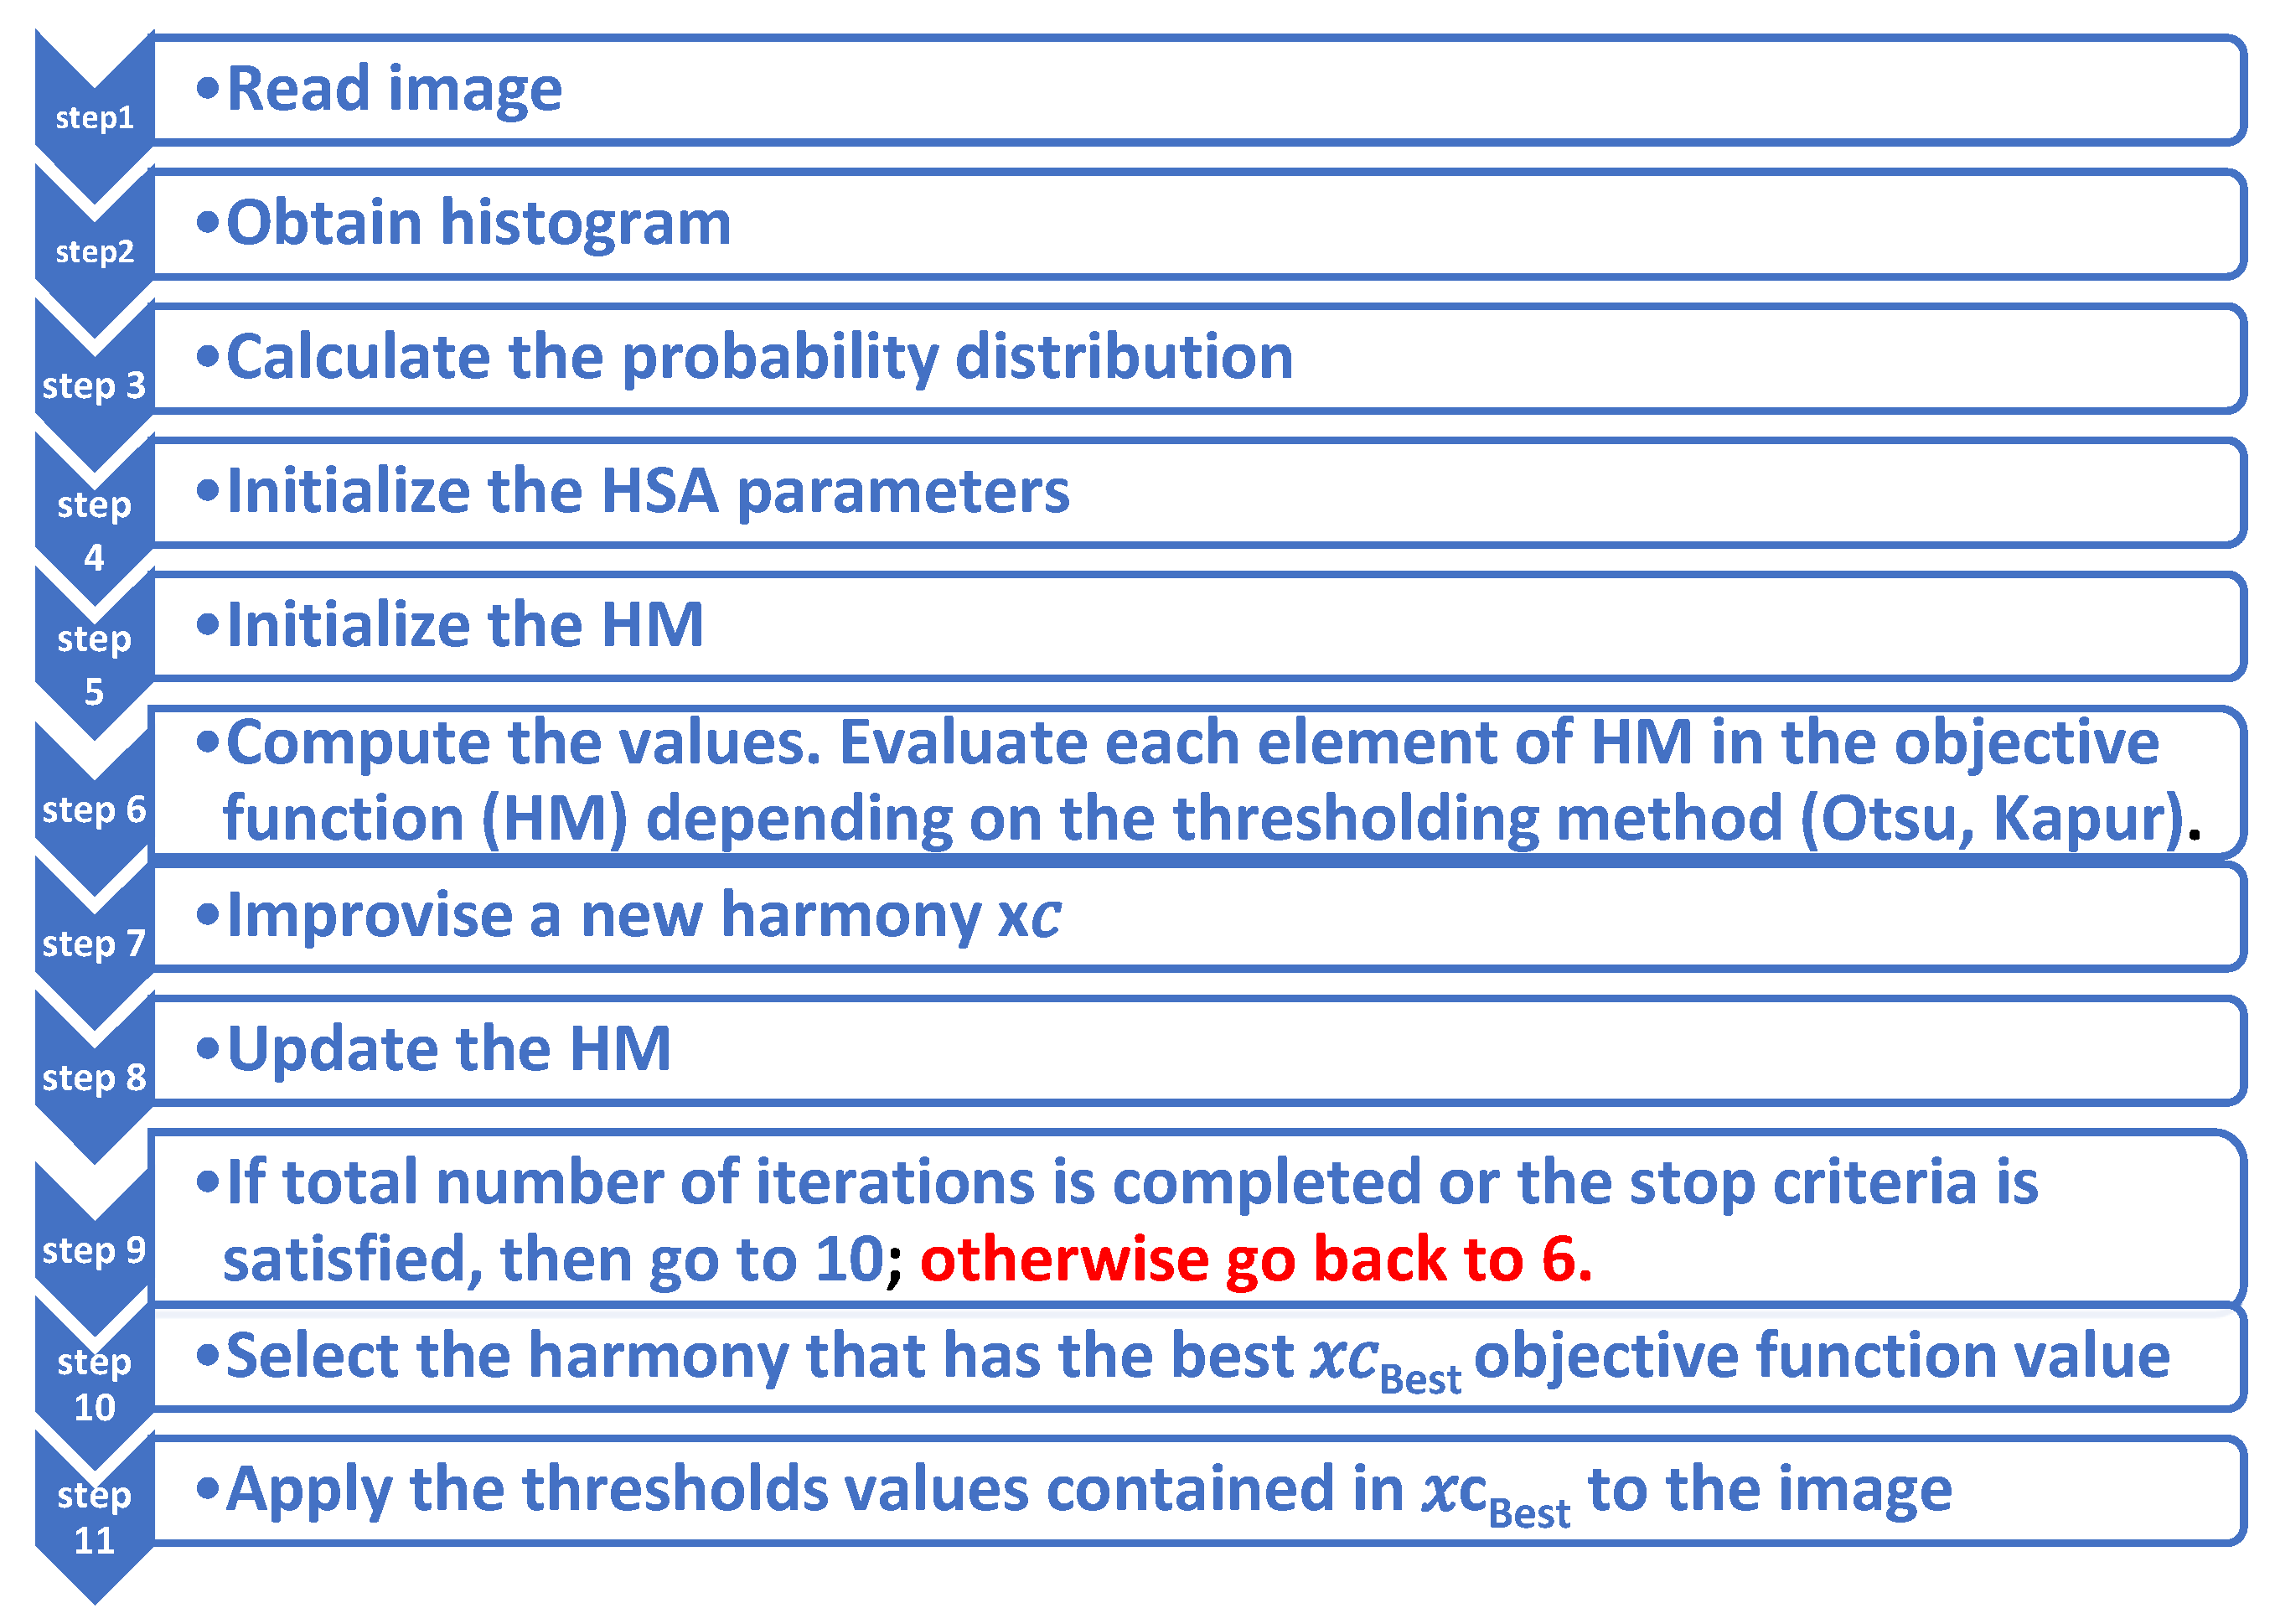
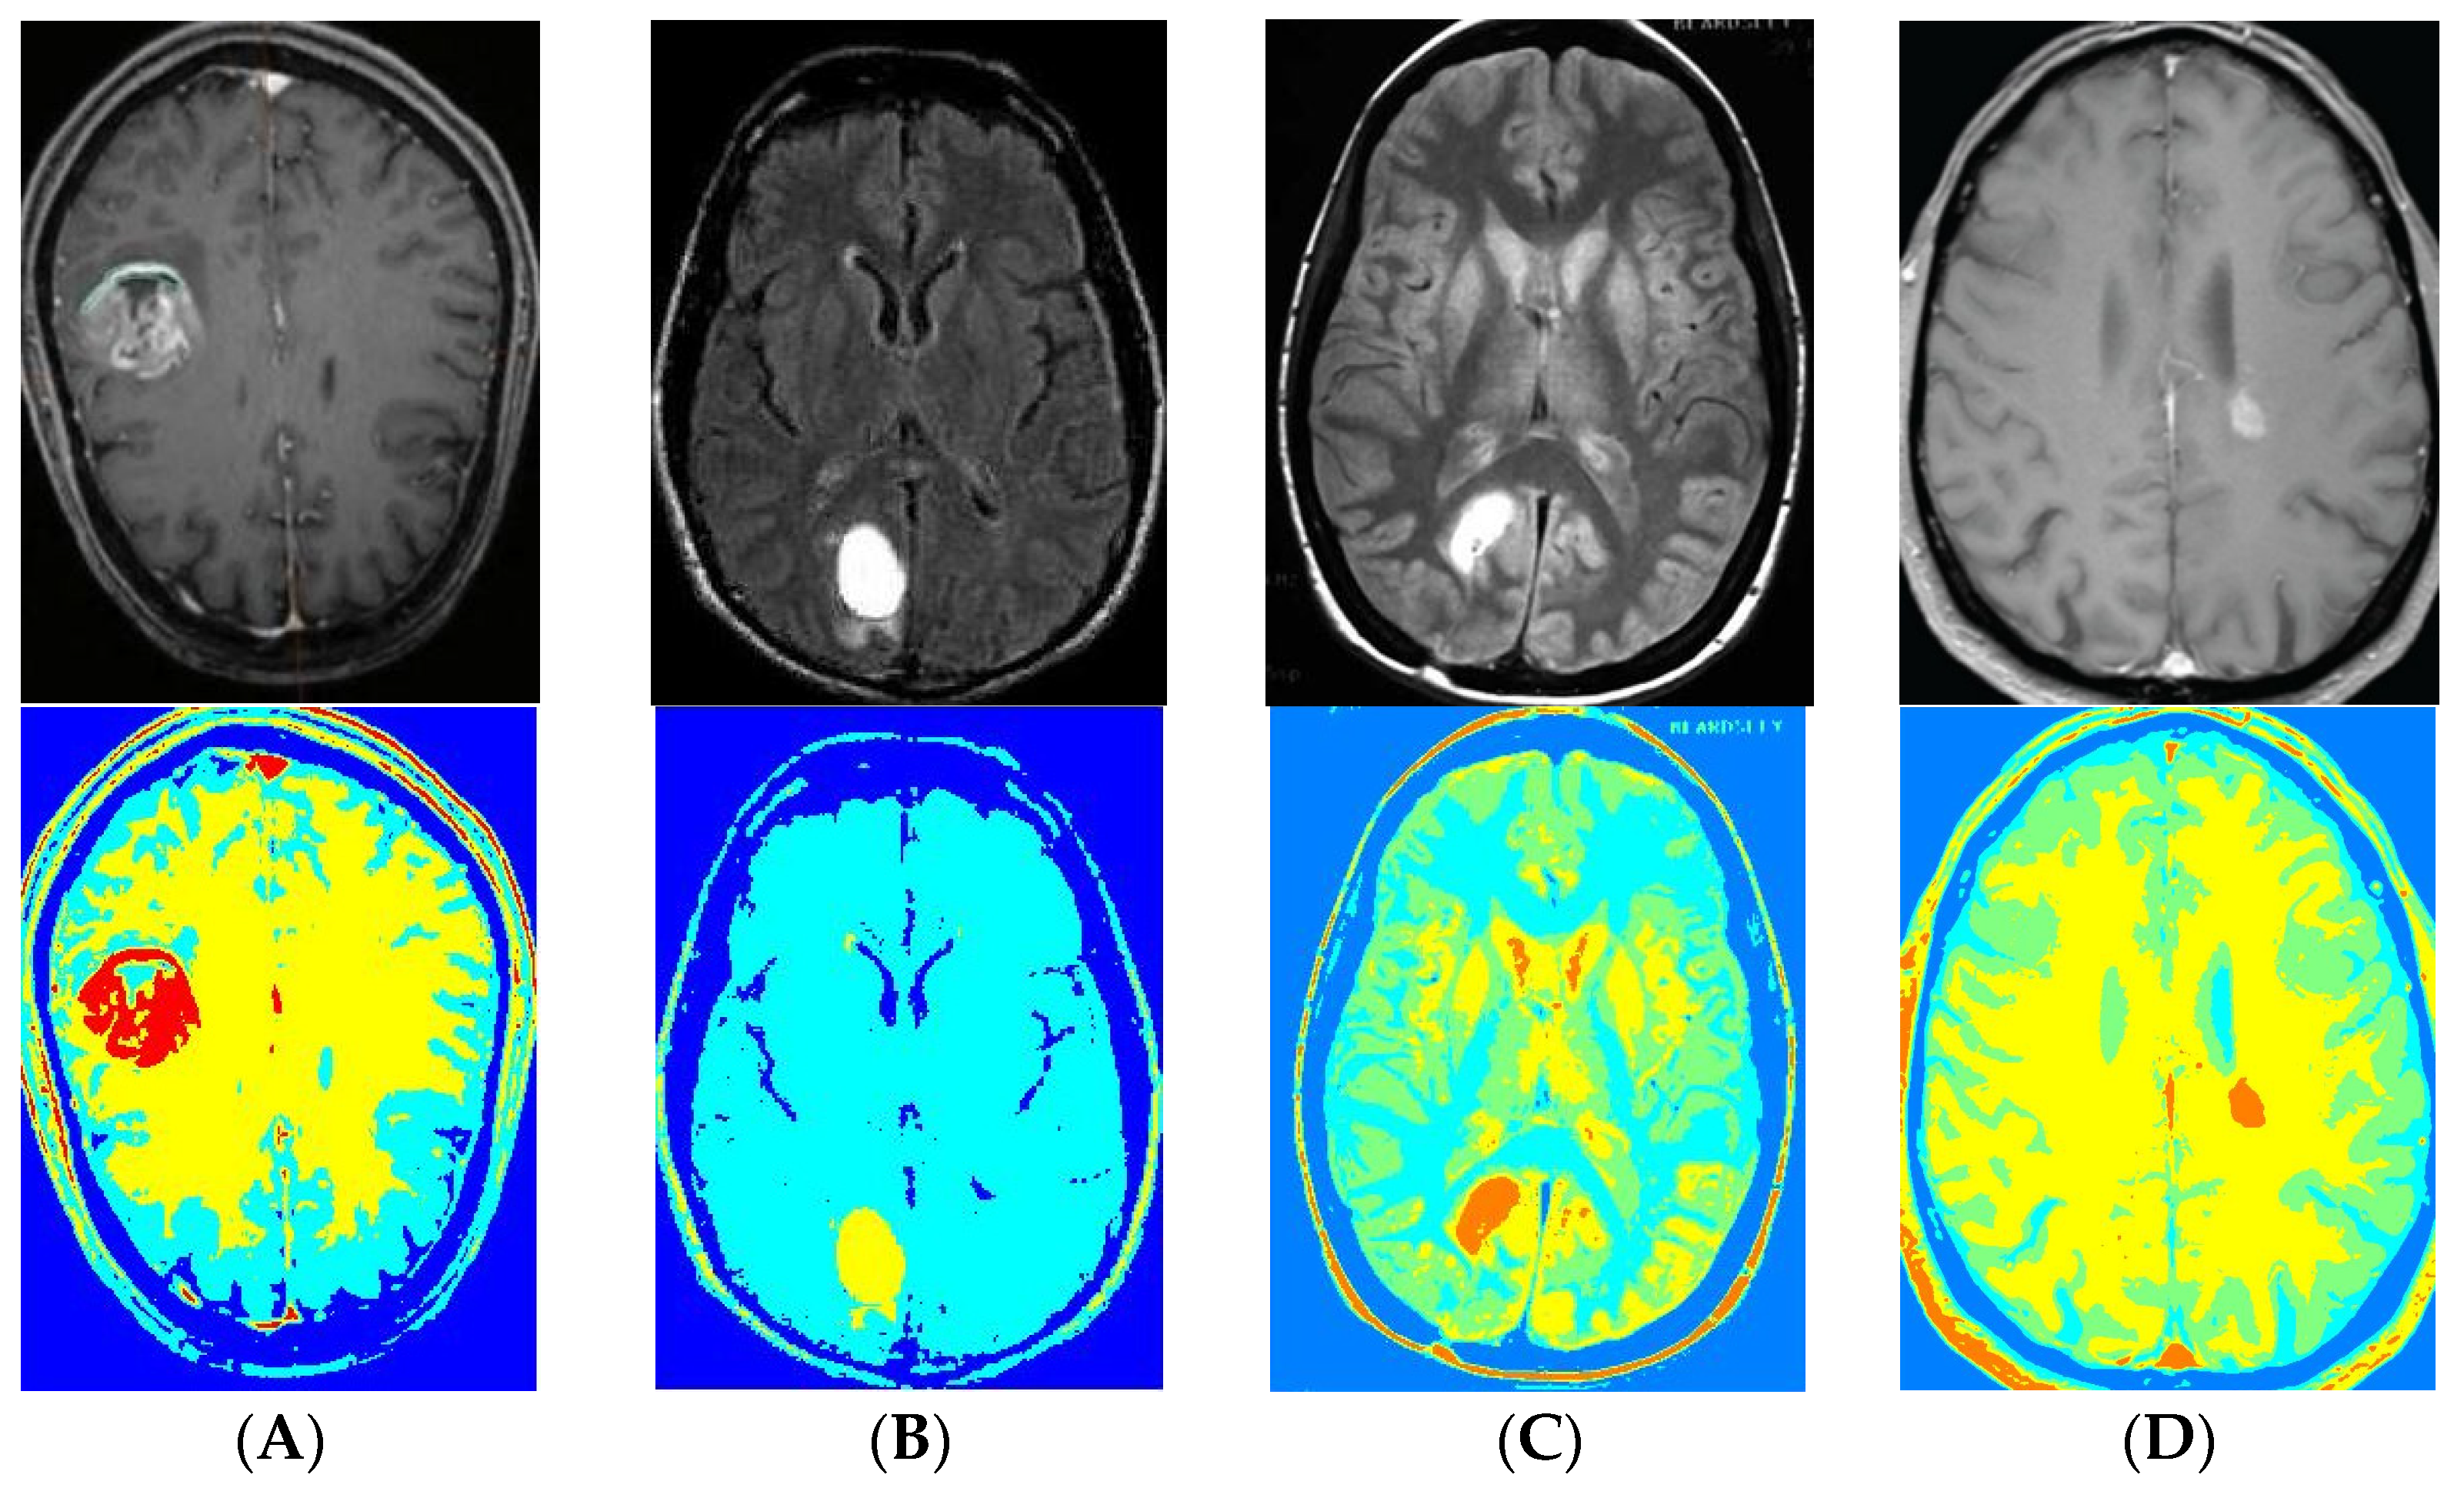
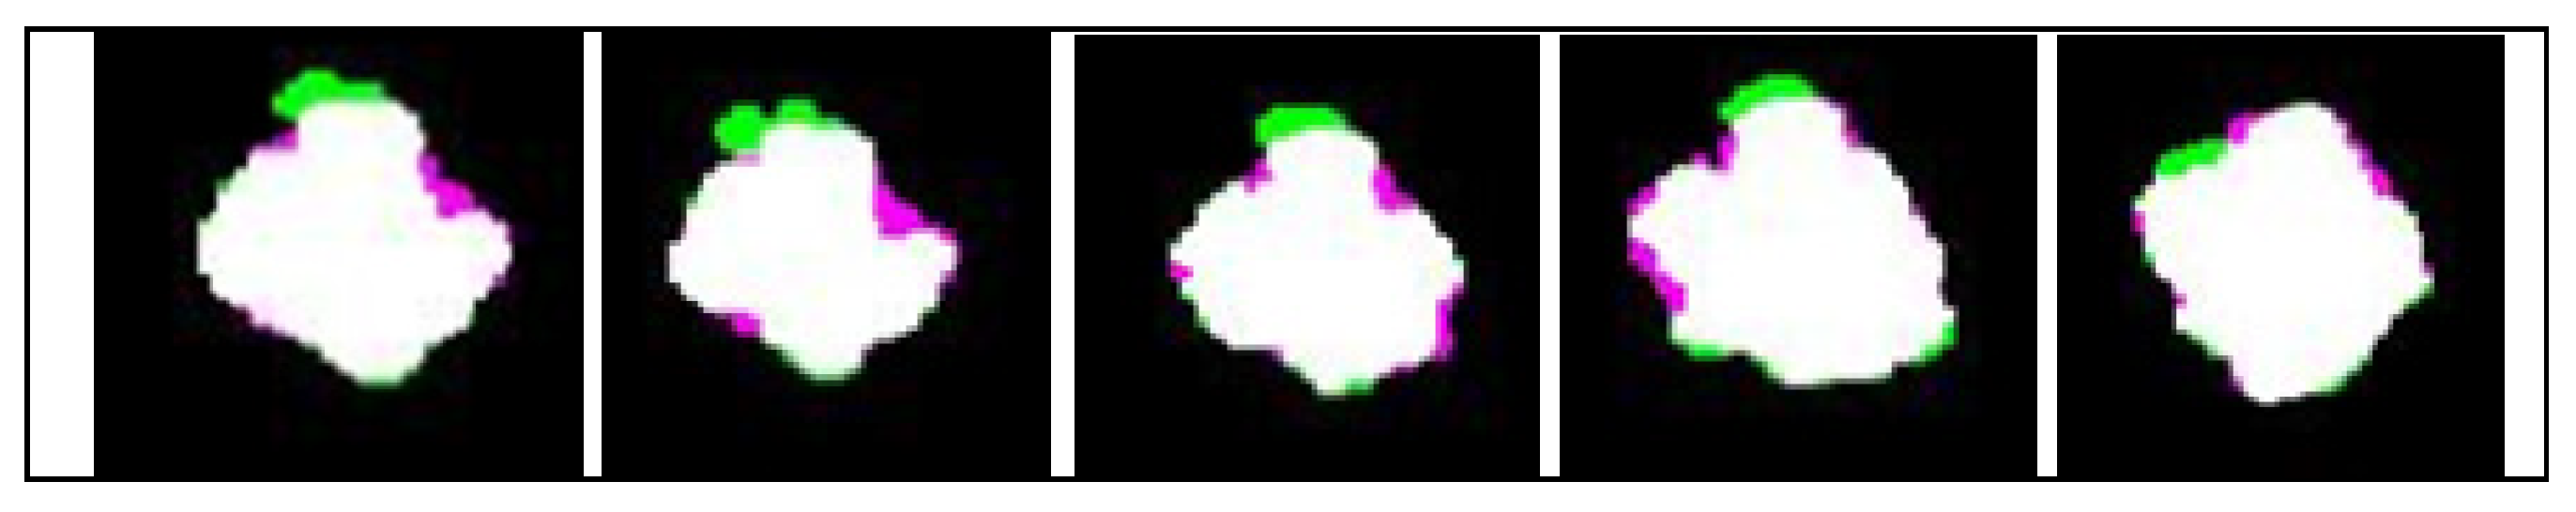
2.2.2. Segmentation Algorithm
2.2.3. Morphological Operations
2.2.4. Connected Component Analysis
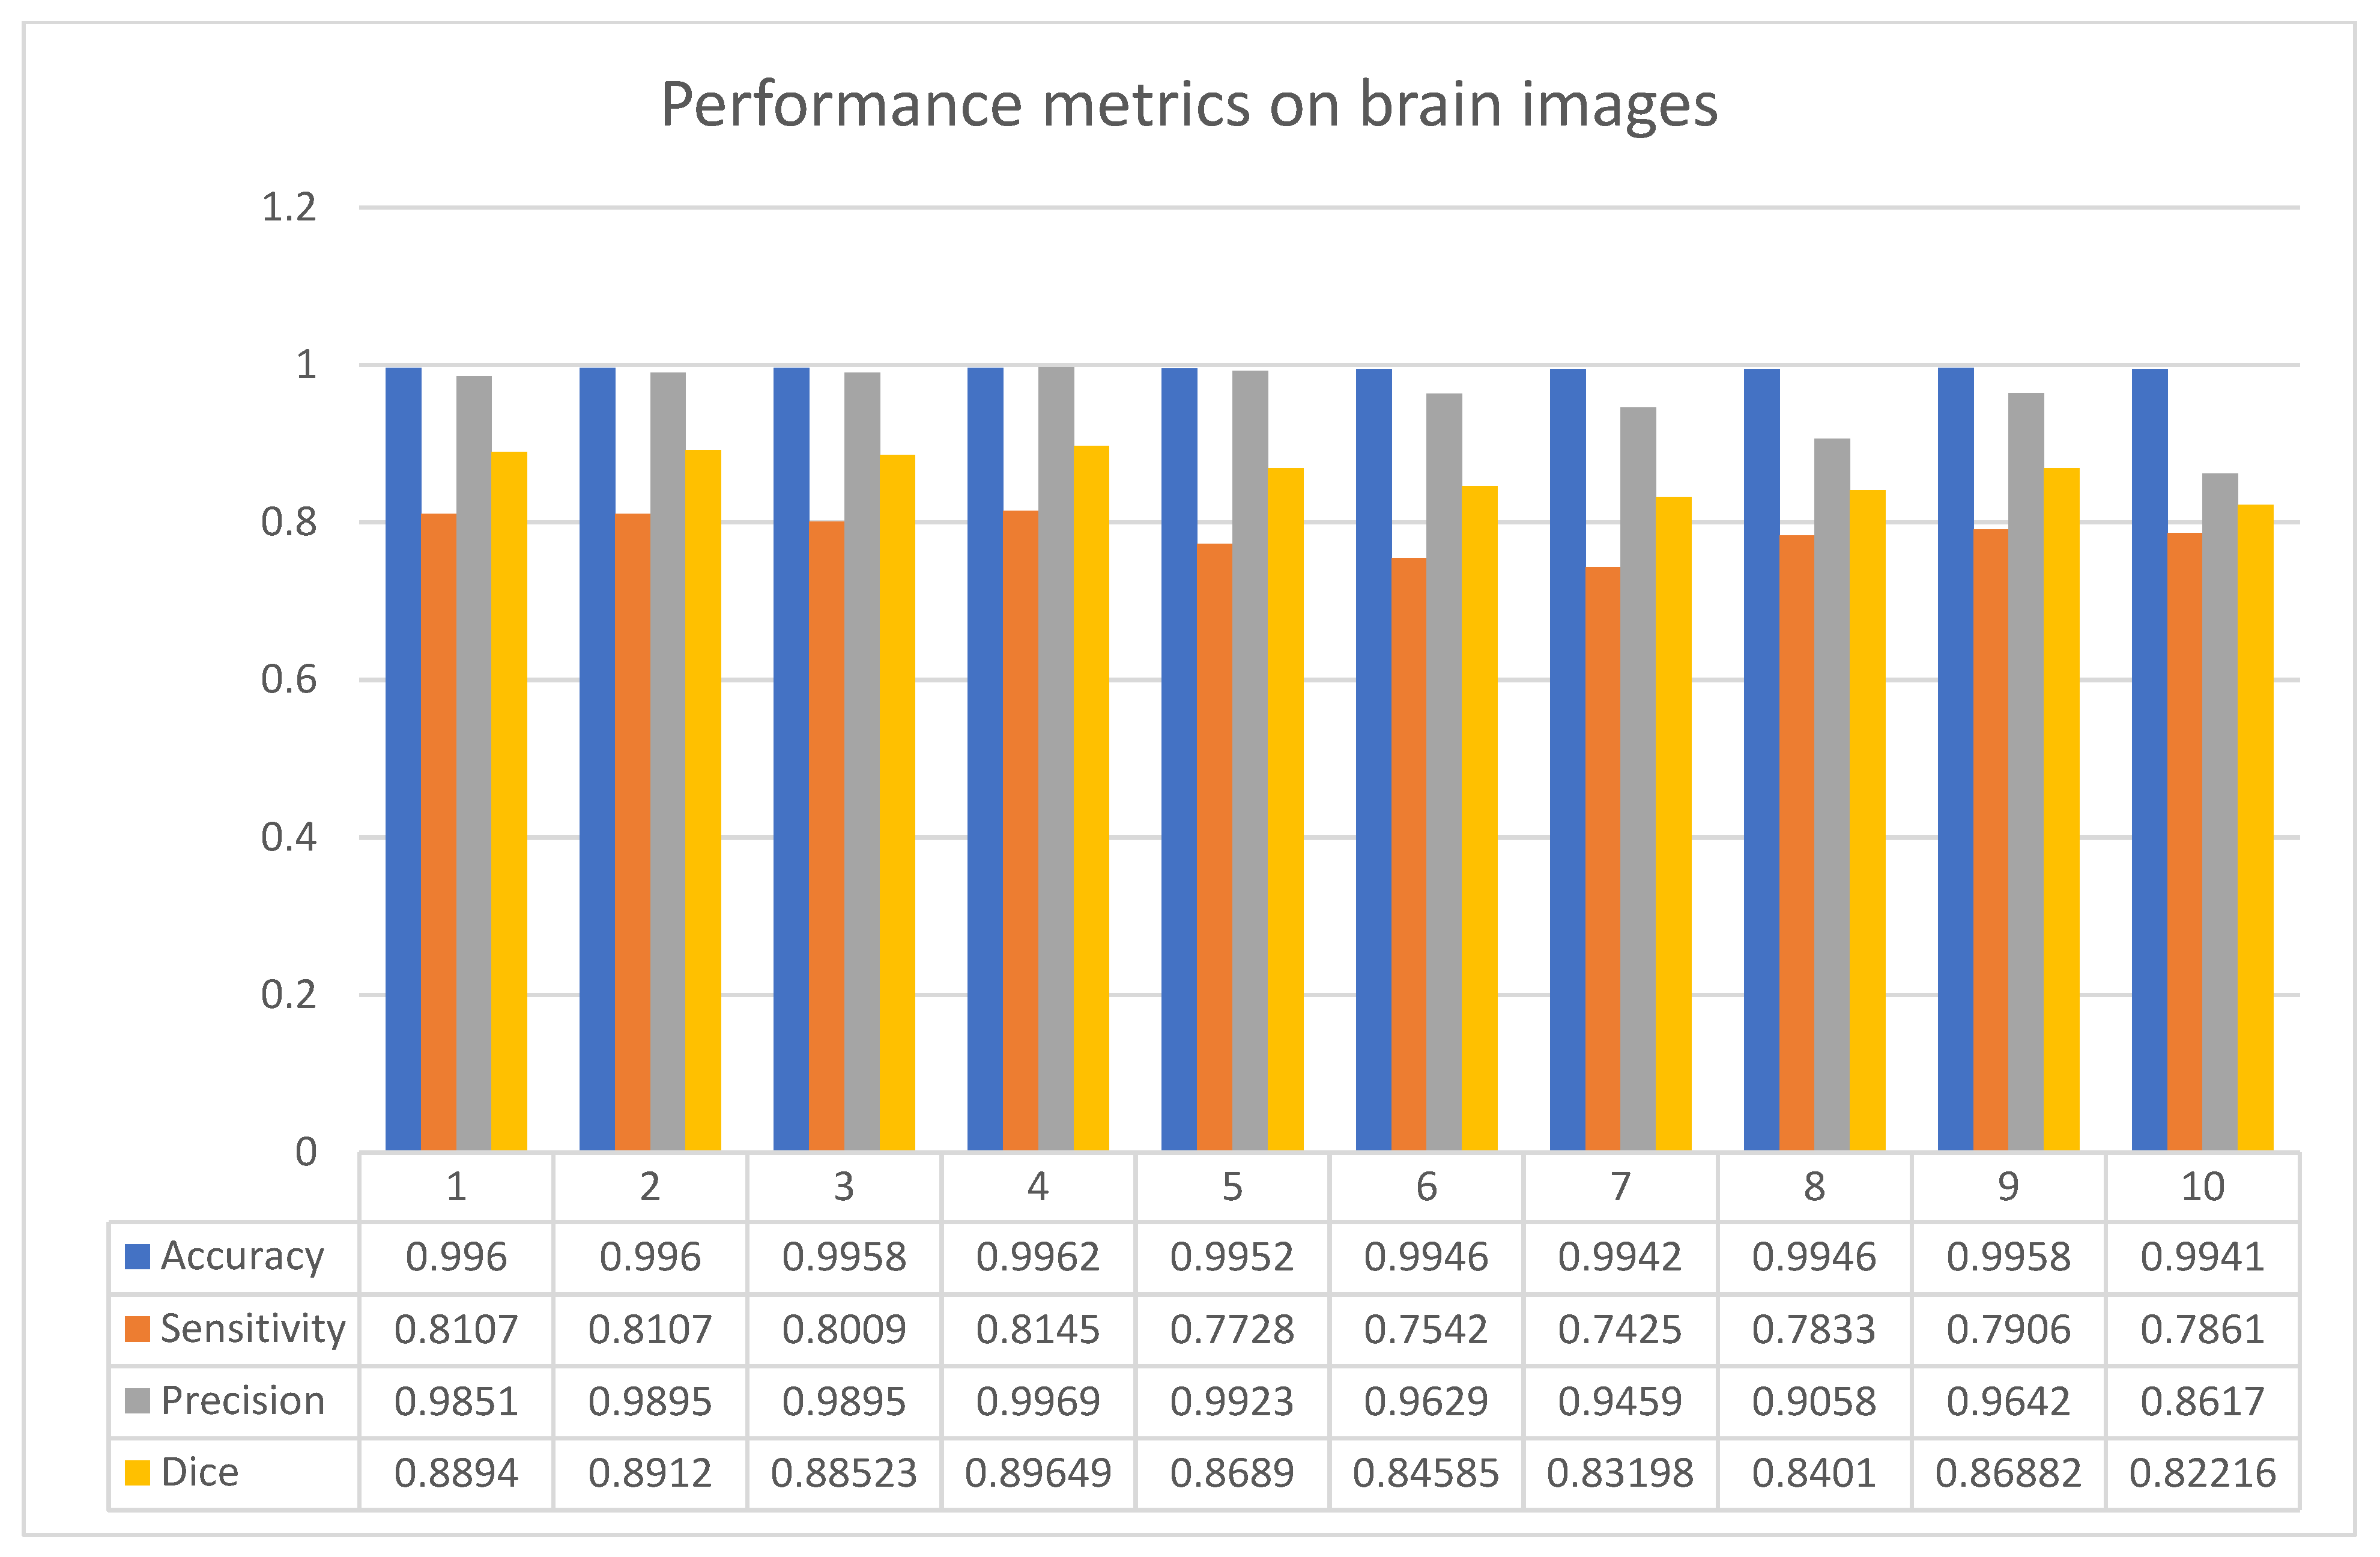
2.2.5. Performance Evaluation Metrics
3. Results
4. Discussions
5. Conclusions
Author Contributions
Funding
Acknowledgments
Conflicts of Interest
References
- Bhattacharyya, S.; Maulik, U.; Dutta, P. Multilevel image segmentation with adaptive image context based thresholding. Appl. Soft Comput. 2011, 11, 946–962. [Google Scholar] [CrossRef]
- Małyszko, D.; Stepaniuk, J. Adaptive multilevel rough entropy evolutionary thresholding. Inf. Sci. 2010, 180, 1138–1158. [Google Scholar] [CrossRef]
- Li, L.; Sun, L.; Xue, Y.; Li, S.; Huang, X.; Mansour, R.F. Fuzzy Multilevel Image Thresholding Based on Improved Coyote Optimization Algorithm. IEEE Access 2021, 9, 33595–33607. [Google Scholar] [CrossRef]
- Esparza, E.R.; Calzada, L.A.Z.; Oliva, D.; Heidari, A.A.; Zaldivar, D.; Cisneros, M.P.; Foong, L.K. An efficient harris hawks-inspired image segmentation method. Expert Syst. Appl. 2020, 155, 113428. [Google Scholar] [CrossRef]
- Houssein, E.H.; Emam, M.M.; Ali, A.A. An efficient multilevel thresholding segmentation method for thermography breast cancer imaging based on improved chimp optimization algorithm. Expert Syst. Appl. 2021, 185, 115651. [Google Scholar] [CrossRef]
- Patel, S.; Rao, D. Brain Tumor Detection in MRI Images with New Multiple Thresholding. J. Netw. Commun. Emerg. Technol. 2017, 7, 6. [Google Scholar]
- Juang, L.-H.; Wu, M.-N. Tumor Classification Using Automatic Multi-Thresholding. Intell. Autom. Soft Comput. 2018, 2018, 1272778. [Google Scholar] [CrossRef]
- Otsu, N. A threshold selection method from gray-level histograms. IEEE Trans. Syst. Man Cybern. 1979, 9, 62–66. [Google Scholar] [CrossRef] [Green Version]
- Kapur, J.N.; Sahoo, P.K.; Wong, A.K.C. A new method for gray-level picture thresholding using the entropy of the histogram. Comput. Vis. Graph. Image Process. 1985, 29, 273–285. [Google Scholar] [CrossRef]
- Serra, J. Image Analysis and Mathematical Morphology; Academic Press: London, UK, 1982. [Google Scholar]
- Gonzalez, R.; Woods, R. Digital Image Processing; Addison-Wesley Publishing Company: Boston, MA, USA, 1992; Chapter 2. [Google Scholar]
- Kabade, R.S.; Gaikwad, M.S. MRI segmentation of brain to detect brain tumor and its area calculation using K-means clustering and fuzzy c-means algorithm. Int. J. Comput. Sci. Eng. Technol. 2013, 4, 524–531. [Google Scholar]
- Liu, C.; Liu, W.; Xing, W. A weighted edge-based level set method based on multi-local statistical information for noisy image segmentation. J. Vis. Commun. Image Represent. 2019, 59, 89–107. [Google Scholar] [CrossRef]
- Balla-Arabé, S.; Gao, X.; Wang, B. GPU Accelerated Edge-Region Based Level Set Evolution Constrained by 2D Gray-Scale Histogram. IEEE Trans. Image Process. 2013, 22, 2688–2698. [Google Scholar] [CrossRef] [PubMed]
- Almijalli, M.; Saad, A.; Alhussaini, K.; Aleid, A.; Alwasel, A. Towards Drug Delivery Control Using Iron Oxide Nanoparticles in Three-Dimensional Magnetic Resonance Imaging. Nanomaterials 2021, 11, 1876. [Google Scholar] [CrossRef]
- Huang, D.-Y.; Wang, C.-H. Optimal multi-level thresholding using a two-stage Otsu optimization approach. Pattern Recognit. Lett. 2009, 30, 275–284. [Google Scholar] [CrossRef]
- Feng, Y.; Zhao, H.; Li, X.; Zhang, X.; Li, H. A multi-scale 3D Otsu thresholding algorithm for medical image segmentation. Digit. Signal. Process. 2017, 60, 186–199. [Google Scholar] [CrossRef] [Green Version]
- Pérez, M.G.; Calle, A.S.; Moreno, A.B.; Nunes, E.; Andaluz, V. A multi-level thresholding method based on histogram derivatives for accurate brain MRI segmentation. Rev. Politécnica 2015, 35, 82. [Google Scholar]
- Agrawal, S.; Panda, R.; Samantaray, L.; Abraham, A. A novel automated absolute intensity difference based technique for optimal MR brain image thresholding. J. King Saud Univ. Comput. Inf. Sci. 2020, 32, 1045–1054. [Google Scholar] [CrossRef]
- Lin, S.; Jia, H.; Abualigah, L.; Altalhi, M. Enhanced Slime Mould Algorithm for Multilevel Thresholding Image Segmentation Using Entropy Measures. Entropy 2021, 23, 1700. [Google Scholar] [CrossRef]
- Guan, Y.; Aamir, M.; Rahman, Z.; Ali, A.; Abro, W.A.; Dayo, Z.A.; Bhutta, M.S.; Hu, Z. A framework for efficient brain tumor classification using MRI images. Math. Biosci. Eng. 2021, 18, 5790–5815. [Google Scholar] [CrossRef]
- Aamir, M.; Rahman, Z.; Dayo, Z.A.; Abro, W.A.; Uddin, M.I.; Khan, I.; Imran, A.S.; Ishfaq, M.; Guan, Y.; Hu, Z. A deep learning approach for brain tumor classification using MRI images. Comput. Electr. Eng. 2022, 101, 108105. [Google Scholar] [CrossRef]
- Zheng, P.; Zhu, X.; Guo, W. Brain tumour segmentation based on an improved U-Net. BMC Med. Imaging 2022, 22, 199. [Google Scholar] [CrossRef] [PubMed]
- Manikandan, S.; Ramar, K.; Iruthayarajan, M.W.; Srinivasagan, K.G. Multilevel thresholding for segmentation of medical brain images using real coded genetic algorithm. Measurement 2014, 47, 558–568. [Google Scholar] [CrossRef]
- Sandhya, G.; Kande, G.B.; Savithri, T.S. Multilevel Thresholding Method Based on Electromagnetism for Accurate Brain MRI Segmentation to Detect White Matter, Gray Matter, and CSF. BioMed Res. Int. 2017, 2017, 6783209. [Google Scholar] [CrossRef] [Green Version]
- Malviya, U.K. Tumor Detection in MRI Images using Modified Multi-level Otsu Thresholding (MLOT) and Cross-Correlation of Principle Components. In Proceedings of the 2020 Fourth International Conference on Computing Methodologies and Communication (ICCMC), Erode, India, 11–13 March 2020; pp. 126–131. [Google Scholar] [CrossRef]
- Aqilah Bohani, F.; Qasem, A.; Norul Huda Sheikh Abdullah, S.; Omar, K.; Sahran, S.; Hussain, I.R.; Sharis, S. Multilevel Thresholding of Brain Tumor MRI Images: Patch-Levy Bees Algorithm versus Harmony Search Algorithm. Int. J. Electr. Comput. Eng. Syst. 2019, 10, 45–57. [Google Scholar] [CrossRef]
- Noorfizir, A.; Rachmatullah, M.N.; Sulong, G. Hybrid Multilevel Thresholding-Otsu and Morphology Operation for Retinal Blood Vessel Segmentation. Eng. Lett. 2020, 28, 180–191. [Google Scholar]
- Khairuzzaman, A.K.M.; Chaudhury, S. Brain MR Image Multilevel Thresholding by Using Particle Swarm Optimization, Otsu Method and Anisotropic Diffusion. Int. J. Appl. Metaheuristic Comput. 2019, 10, 91–106. [Google Scholar] [CrossRef] [Green Version]
- Oliva, D.; Cuevas, E.; Pajares, G.; Zaldivar, D.; Perez-Cisneros, M. Multilevel Thresholding Segmentation Based on Harmony Search Optimization. J. Appl. Math. 2013, 2013, 575414. [Google Scholar] [CrossRef] [Green Version]
- Training Data.tar. Available online: http://www.kaggle.com/dschettler8845/brats-2021-task1?select=BraTS2021 (accessed on 13 May 2021).
- Baid, U.; Ghodasara, S.; Mohan, S.; Bilello, M.; Calabrese, E.; Colak, E.; Farahani, K.; Kalpathy-Cramer, J.; Kitamura, F.C.; Pati, S.; et al. The RSNA-ASNR-MICCAI BraTS 2021 Benchmark on Brain Tumor Segmentation and Radiogenomic Classification. arXiv 2021, arXiv:2107.02314. [Google Scholar]
- Menze, B.H.; Jakab, A.; Bauer, S.; Kalpathy-Cramer, J.; Farahani, K.; Kirby, J.; Burren, Y.; Porz, N.; Slotboom, J.; Wiest, R.; et al. The Multimodal Brain Tumor Image Segmentation Benchmark (BRATS). IEEE Trans. Med. Imaging 2014, 34, 1993–2024. [Google Scholar] [CrossRef]
- Bakas, S.; Akbari, H.; Sotiras, A.; Bilello, M.; Rozycki, M.; Kirby, J.S.; Freymann, J.B.; Farahani, K.; Davatzikos, C. Advancing the Cancer Genome Atlas glioma MRI collections with expert segmentation labels and radiomic features. Sci. Data 2017, 4, 170117. [Google Scholar] [CrossRef] [Green Version]
- Bakas, S.; Akbari, H.; Sotiras, A.; Bilello, M.; Rozycki, M.; Kirby, J.; Freymann, J.; Farahani, K.; Davatzikos, C. Segmentation Labels and Radiomic Features for the Pre-operative Scans of the TCGA-GBM collection. Cancer Imaging Arch. 2017, 2017, 286. [Google Scholar] [CrossRef]
- Cox, R.; Ashburner, J.; Breman, H.; Fissell, K.; Haselgrove, C.; Holmes, C.; Lancaster, J.; Rex, D.; Smith, S.; Woodward, J. A (Sort of) new image data format standard: NIfTI-1: WE 150. Neuroimage 2004, 22. Available online: https://nifti.nimh.nih.gov/pub/dist/doc/hbm_nifti_2004.pdf?msclkid=d49c7829a84211ecbb15aaeaee73150c (accessed on 13 May 2021).
- Rohlfing, T.; Zahr, N.M.; Sullivan, E.V.; Pfefferbaum, A. The SRI24 multichannel atlas of normal adult human brain structure. Hum. Brain Mapp. 2010, 31, 798–819. [Google Scholar] [CrossRef] [Green Version]
- Khadwilard, A.; Luangpaiboon, P.; Pongcharoen, P. Full factorial experimental design for parameters selection of harmony search Algorithm. J. Ind. Technol. 2012, 8, 1–10. [Google Scholar]
- Chudasama, D.; Patel, T.; Joshi, S.; Prajapati, G.I. Image Segmentation using Morphological Operations. Int. J. Comput. Appl. 2015, 117, 16–19. [Google Scholar] [CrossRef]
- Aboussaleh, I.; Riffi, J.; Mahraz, A.M.; Tairi, H. Brain Tumor Segmentation Based on Deep Learning’s Feature Representation. J. Imaging 2021, 7, 269. [Google Scholar] [CrossRef] [PubMed]
- Taha, A.A.; Hanbury, A. Metrics for evaluating 3D medical image segmentation: Analysis, selection, and tool. BMC Med. Imaging 2015, 15, 29. [Google Scholar] [CrossRef] [PubMed] [Green Version]

| Methods | Average Performance of Dice Index | Average Execution Time |
|---|---|---|
| Single path MLDeepMedic | 79% | ~6 h |
| U-Net | 80% | ~6 h |
| Rescue Net | 95% | ~6 h |
| Cascaded Anistropic CNN | 87% | ~5 h |
| K_Mean and FCM | 57% | ~45 s |
| Proposed method “Multilevel HSO” | 87% | ~2 min |
Disclaimer/Publisher’s Note: The statements, opinions and data contained in all publications are solely those of the individual author(s) and contributor(s) and not of MDPI and/or the editor(s). MDPI and/or the editor(s) disclaim responsibility for any injury to people or property resulting from any ideas, methods, instructions or products referred to in the content. |
© 2023 by the authors. Licensee MDPI, Basel, Switzerland. This article is an open access article distributed under the terms and conditions of the Creative Commons Attribution (CC BY) license (https://creativecommons.org/licenses/by/4.0/).
Share and Cite
Aleid, A.; Alhussaini, K.; Alanazi, R.; Altwaimi, M.; Altwijri, O.; Saad, A.S. Artificial Intelligence Approach for Early Detection of Brain Tumors Using MRI Images. Appl. Sci. 2023, 13, 3808. https://doi.org/10.3390/app13063808
Aleid A, Alhussaini K, Alanazi R, Altwaimi M, Altwijri O, Saad AS. Artificial Intelligence Approach for Early Detection of Brain Tumors Using MRI Images. Applied Sciences. 2023; 13(6):3808. https://doi.org/10.3390/app13063808
Chicago/Turabian StyleAleid, Adham, Khalid Alhussaini, Reem Alanazi, Meaad Altwaimi, Omar Altwijri, and Ali S. Saad. 2023. "Artificial Intelligence Approach for Early Detection of Brain Tumors Using MRI Images" Applied Sciences 13, no. 6: 3808. https://doi.org/10.3390/app13063808
APA StyleAleid, A., Alhussaini, K., Alanazi, R., Altwaimi, M., Altwijri, O., & Saad, A. S. (2023). Artificial Intelligence Approach for Early Detection of Brain Tumors Using MRI Images. Applied Sciences, 13(6), 3808. https://doi.org/10.3390/app13063808