
Measurement of Visible Radiation through a Sansevieria cylindrica-Based “Living Sensor”

Abstract
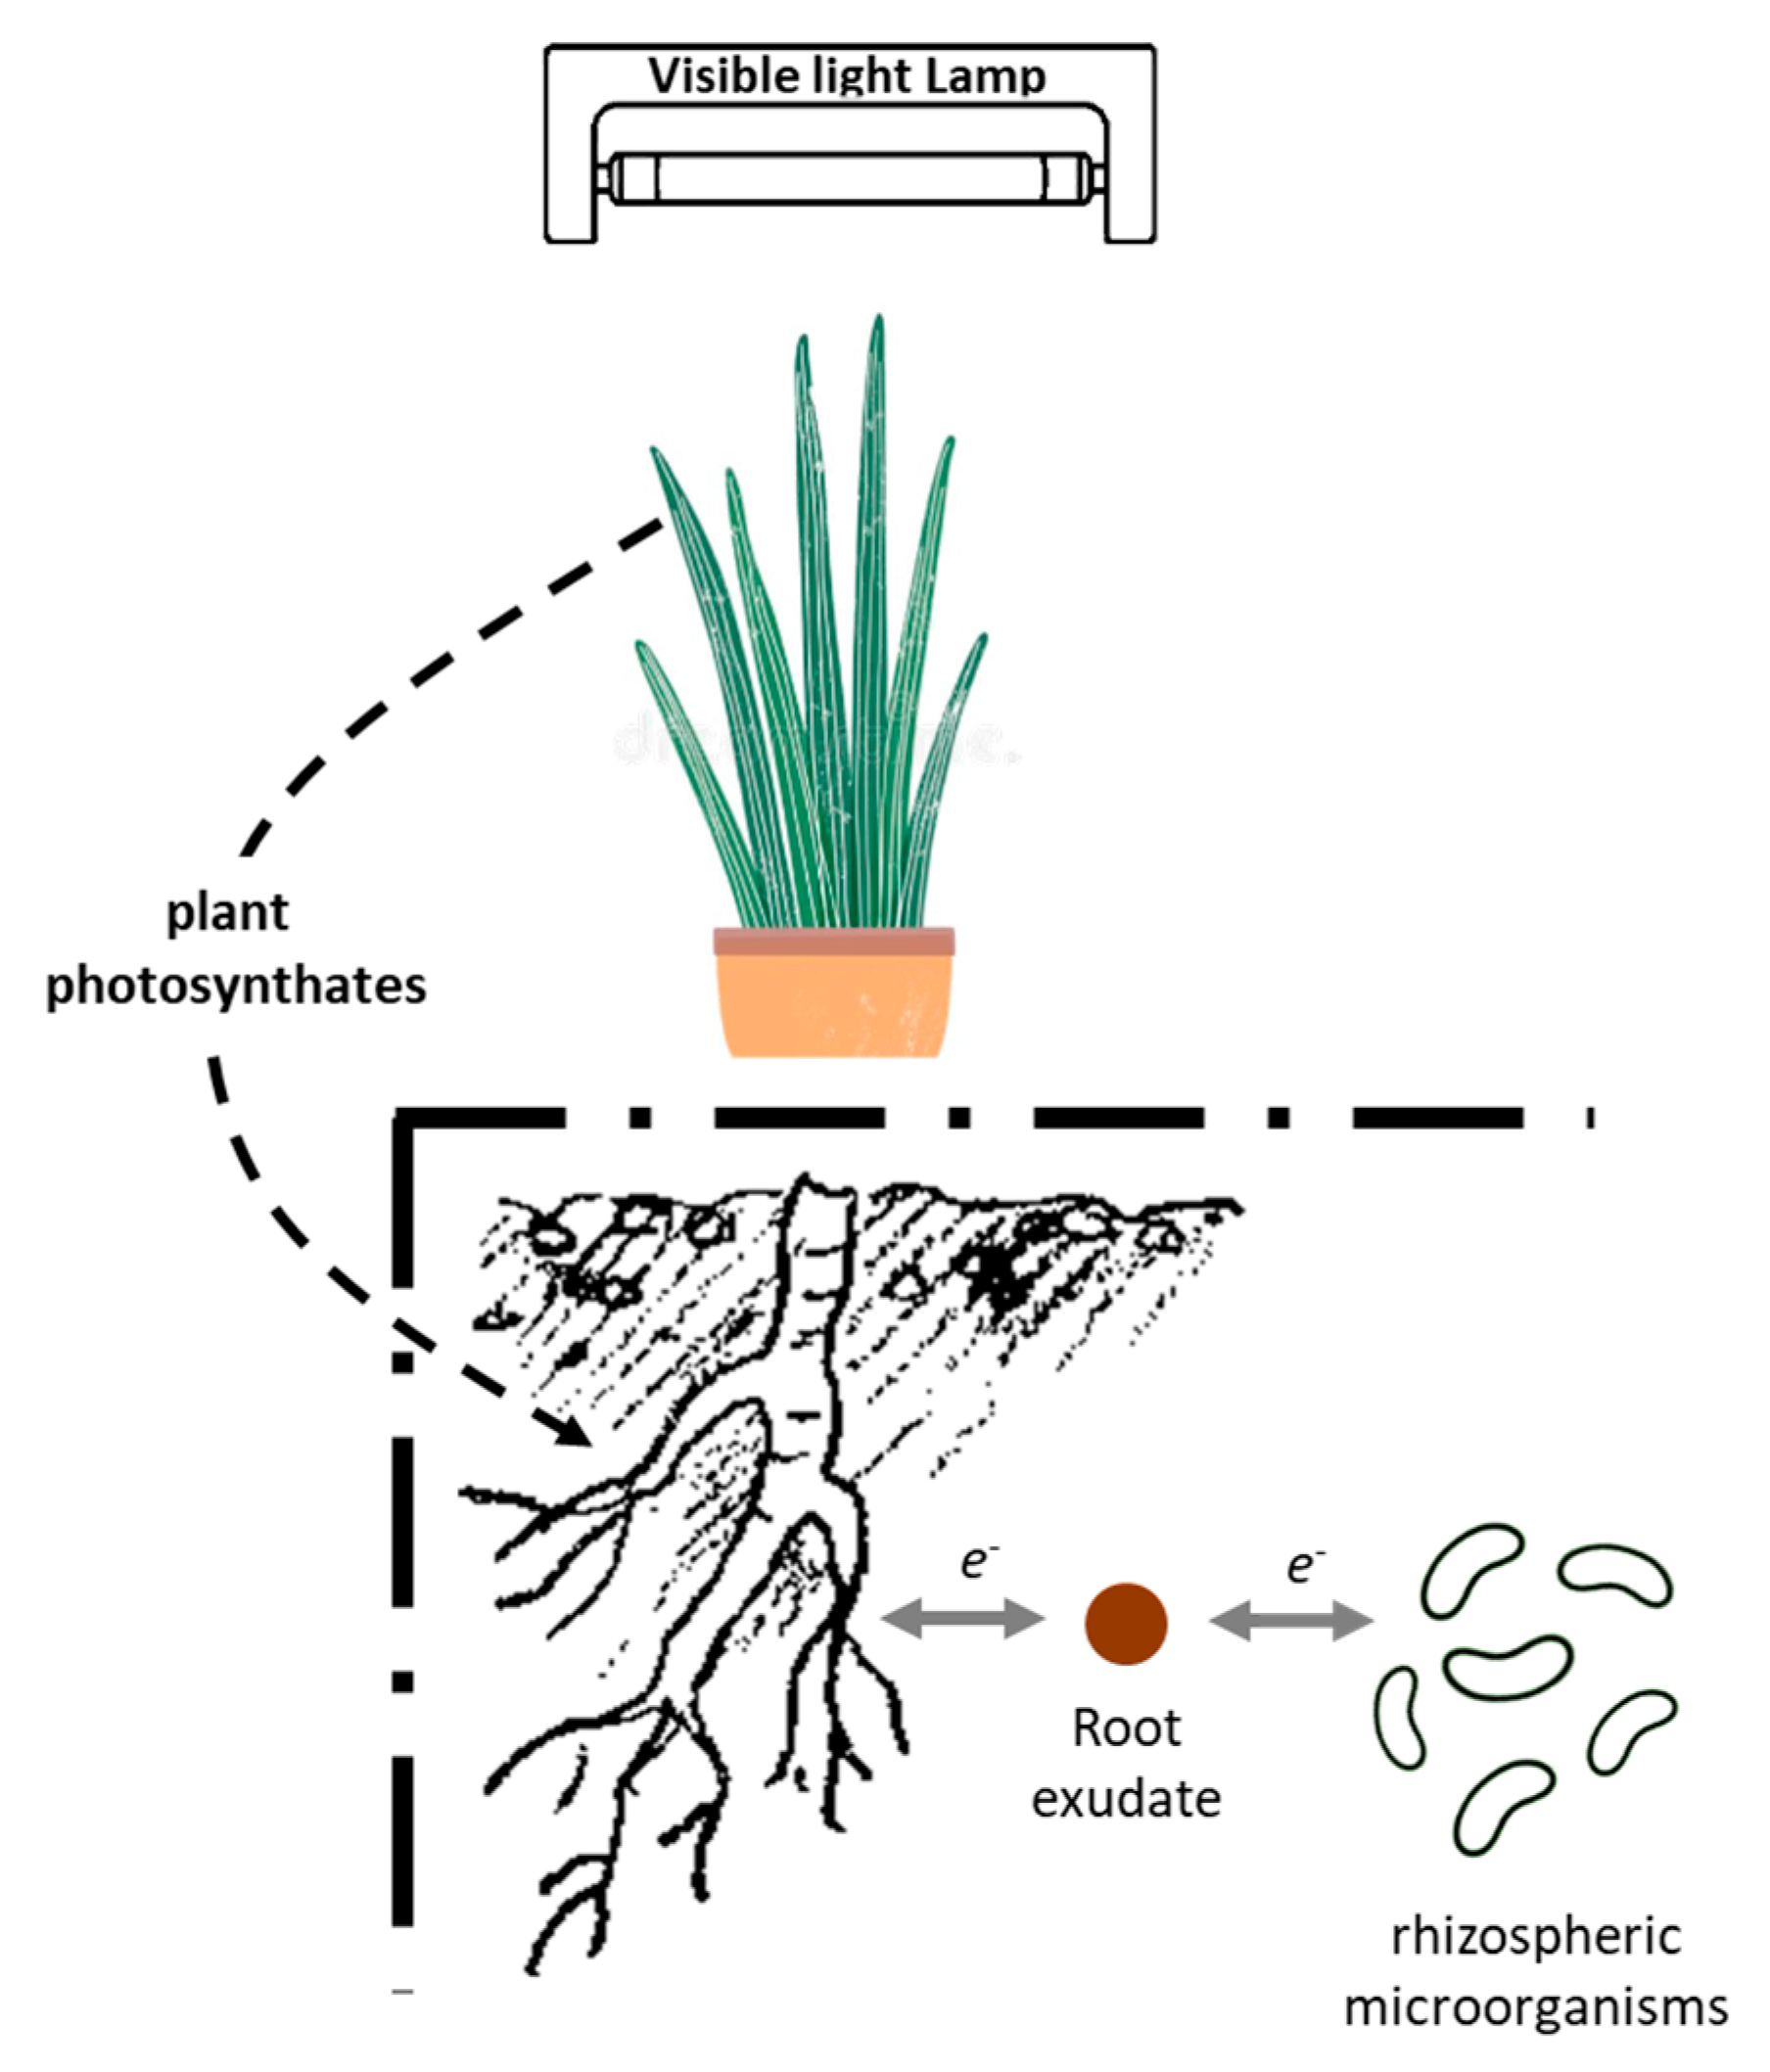
:1. Introduction
2. Materials and Methods
- A Sansevieria cylindrica having 15 stems for which we assume the shape of a cone with radius and height of about, respectively, 6.5 mm and 30 cm, so a base area of about 132.6 mm2 is estimated, and a total area of 6257 mm2 for each stem;
- A visible light source with a spectrum typical of D65 CIE illuminant, composed of 4 neon lamps, each one of 18 W;
- A support system useful for changing the distance between source and plant and, as a consequence, the intensity of the light intensity on living sensor;
- A controlled chamber, ESPEC CORP., model SH-242 used to investigate the influence of temperature and relative humidity on the device response;
- Two electrical contacts of Zn and Cu, placed inside the soil at a depth of 6 cm, 8 cm apart, that represent, respectively, anode and cathode of the device;
- A LabVIEWTM routine to acquire the output voltage coming from the soil–plant system;
- A NI USB-6366 DAQ board with a laptop, adopted to continuously acquire the data;
- MATLAB® processing to elaborate the acquired experimental data.
3. Discussion
3.1. Analysis and Spatial Distribution of Applied Illuminance
3.2. Selectivity Achievement of the Living Sensor
3.3. Metrological Characterization and Discussions
4. Conclusions
Author Contributions
Funding
Institutional Review Board Statement
Informed Consent Statement
Data Availability Statement
Acknowledgments
Conflicts of Interest
References
- Yang, J.; Yu, Y.; Ma, T.; Zhang, C.; Wang, Q. Evolution of energy and metal demand driven by industrial revolutions and its trend analysis. Chin. J. Popul. Resour. Environ. 2021, 19, 256–264. [Google Scholar] [CrossRef]
- Yoro, K.O.; Daramola, M.O. CO2 emission sources, greenhouse gases, and the global warming effect. Adv. Carbon Capture 2020, 3–28. [Google Scholar] [CrossRef]
- Azadi, M.; Northey, S.A.; Ali, S.H.; Edraki, M. Transparency on greenhouse gas emissions from mining to enable climate change mitigation. Nat. Geosci. 2020, 13, 100–104. [Google Scholar] [CrossRef]
- Rogelj, J.; Geden, O.; Cowie, A.; Reisinger, A. Three ways to improve net-zero emissions targets. Nature 2021, 591, 365–368. [Google Scholar] [CrossRef]
- Johnson, O.W.; Mete, G.; Sanchez, F.; Shawoo, Z.; Talebian, S. Toward Climate-Neutral Heavy Industry: An Analysis of Industry Transition Roadmaps. Appl. Sci. 2021, 11, 5375. [Google Scholar] [CrossRef]
- Lamb, W.F.; Wiedmann, T.; Pongratz, J.; Andrew, R.; Crippa, M.; Olivier, J.G.; Minx, J. A review of trends and drivers of greenhouse gas emissions by sector from 1990 to 2018. Environ. Res. Lett. 2021, 16, 073005. [Google Scholar] [CrossRef]
- Lee, S.J.; Ryu, I.S.; Moon, S.H. N2O emission and reduction in the electronics manufacturing industries. Greenh. Gases: Sci. Technol. 2012, 2, 380–385. [Google Scholar] [CrossRef]
- Vasan, A.; Sood, B.; Pecht, M. Carbon footprinting of electronic products. Appl. Energy 2014, 136, 636–648. [Google Scholar] [CrossRef]
- Pirson, T.; Delhaye, T.; Pip, A.; Le Brun, G.; Raskin, J.P.; Bol, D. The Environmental Footprint of IC Production: Meta-Analysis and Historical Trends. In Proceedings of the ESSDERC 2022-IEEE 52nd European Solid-State Device Research Conference (ESSDERC), Milan, Italy, 19–22 September 2022. [Google Scholar]
- Tanimura, N.; Sato, T.; Nitta, H.; Asaumi, K.; Sato, A.; Suzuki, K.; Maeda, R. Estimation of greenhouse gas emissions in micro-fabrication of MEMS devices. In Proceedings of the EcoDesign 2011 International Symposium, Kyoto, Japan, 30 November–2 December 2011. [Google Scholar]
- Patsavellas, J.; Salonitis, K. The carbon footprint of manufacturing digitalization: Critical literature review and future research agenda. Procedia CIRP 2019, 81, 1354–1359. [Google Scholar] [CrossRef]
- Hsu, T.R. MEMS and Microsystems: Design, Manufacture, and Nanoscale Engineering; John Wiley & Sons: Hoboken, NJ, USA, 2008. [Google Scholar]
- Mishra, M.K.; Dubey, V.; Mishra, P.M.; Khan, I. MEMS technology: A review. J. Eng. Res. Rep. 2019, 4, 1–24. [Google Scholar] [CrossRef]
- Villard, A.; Lelah, A.; Brissaud, D. Drawing a chip environmental profile: Environmental indicators for the semiconductor industry. J. Clean. Prod. 2015, 86, 98–109. [Google Scholar] [CrossRef]
- Kiddee, P.; Naidu, R.; Wong, M.H. Electronic waste management approaches: An overview. Waste Manag. 2013, 33, 1237–1250. [Google Scholar] [CrossRef]
- Doan, L.T.T.; Amer, Y.; Lee, S.H.; Phuc, P.N.K.; Dat, L.Q. E-waste reverse supply chain: A review and future perspectives. Appl. Sci. 2019, 9, 5195. [Google Scholar] [CrossRef] [Green Version]
- Lloyd, J.; Kearney, N.; Lyden, C.; McCartney, D.; Robertson, D.; Shine, M. Silicon is Greener: Why Innovation in Circuits is Needed for Sustainability. In Proceedings of the 2020 IEEE Symposium on VLSI Technology, Honolulu, HI, USA, 16–19 June 2020. [Google Scholar]
- Trigona, C.; Graziani, S.; Baglio, S. Changes in sensors technologies during the last ten years: Evolution or revolution? IEEE Instrum. Meas. Mag. 2020, 23, 18–22. [Google Scholar] [CrossRef]
- Di Pasquale, G.; Graziani, S.; Pollicino, A.; Trigona, C. The evolution of ionic polymer metal composites towards greener transducers. IEEE Instrum. Meas. Mag. 2019, 22, 30–35. [Google Scholar] [CrossRef]
- Nilsson, D.; Kugler, T.; Svensson, P.O.; Berggren, M. An all-organic sensor–transistor based on a novel electrochemical transducer concept printed electrochemical sensors on paper. Sens. Actuators B Chem. 2002, 86, 193–197. [Google Scholar] [CrossRef]
- Anthony, J.E.; Facchetti, A.; Heeney, M.; Marder, S.R.; Zhan, X. n-Type organic semiconductors in organic electronics. Adv. Mater. 2010, 22, 3876–3892. [Google Scholar] [CrossRef] [PubMed]
- Meller, G.; Grasser, T. Organic Electronics; Springer: Berlin/Heidelberg, Germany, 2009. [Google Scholar]
- Volkov, A.G. Plant Electrophysiology: Signaling and Responses; Springer Science & Business Media: Berlin/Heidelberg, Germany, 2012. [Google Scholar]
- Burdon-Sanderson, J.S. On the electromotive properties of the leaf of dionæa in the excited and unexcited states. Philos. Trans. R. Soc. Lond. 1882, 173, 1–55. [Google Scholar]
- Comparini, D.; Masi, E.; Pandolfi, C.; Sabbatini, L.; Dolfi, M.; Morosi, S.; Mancuso, S. Stem electrical properties associated with water stress conditions in olive tree. Agric. Water Manag. 2020, 234, 106109. [Google Scholar] [CrossRef]
- Oyarce, P.; Gurovich, L. Electrical signals in avocado trees: Responses to light and water availability conditions. Plant Signal. Behav. 2010, 5, 34–41. [Google Scholar] [CrossRef] [PubMed] [Green Version]
- Fromm, J.; Lautner, S. Electrical signals and their physiological significance in plants. Plant Cell Environ. 2007, 30, 249–257. [Google Scholar] [CrossRef]
- Flexer, V.; Mano, N. From dynamic measurements of photosynthesis in a living plant to sunlight transformation into electricity. Anal. Chem. 2010, 82, 1444–1449. [Google Scholar] [CrossRef] [PubMed]
- Sinclair, I. Sensors and Transducers; Elsevier: Amsterdam, The Netherlands, 2000. [Google Scholar]
- Meder, F.; Saar, S.; Taccola, S.; Filippeschi, C.; Mattoli, V.; Mazzolai, B. Ultraconformable, self-adhering surface electrodes for measuring electrical signals in plants. Adv. Mater. Technol. 2021, 6, 2001182. [Google Scholar] [CrossRef]
- Trigona, C. Living Sensors: The Greenest Paradigm in Instrumentation and Measurements. IEEE Instrum. Meas. Mag. 2023, 26, 35–41. [Google Scholar] [CrossRef]
- Trigona, C. Feasibility of a Soil-based Sensor for Measurement of Temperature. In Proceedings of the 2020 17th International Multi-Conference on Systems, Signals & Devices (SSD), Sfax, Tunisia, 20–23 July 2020. [Google Scholar]
- Baglieri, A.; Gueli, A.M.; Pace, M.; Pasquale, S.; Puglisi, I.; Trigona, C. Exploitation of Chemo-Electrical Transduction Properties of Soil as a Function of Energy Radiation Doses and Temperature: Preliminary Results. In Proceedings of the 2021 18th International Multi-Conference on Systems, Signals & Devices (SSD), Monastir, Tunisia, 22–25 March 2021. [Google Scholar]
- Trigona, C.; Napoli, G.; Pasquale, S.; Puglisi, I.; Baglieri, A.; Gueli, A.M. A Plant-Based Sensor for UV—A radiation measurements. In Proceedings of the 2021 IEEE International Instrumentation and Measurement Technology Conference (I2MTC), Glasgow, UK, 17–20 May 2021. [Google Scholar]
- Aung, H.T.; Aye, M.M.; Thu, Z.M.; Komori, Y.; Sein, M.M.; Vidari, G.; Takaya, Y. Bioactive Constituents from the Rhizomes of Sansevieria cylindrica. Rec. Nat. Prod. 2020, 14, 269–275. [Google Scholar] [CrossRef]
- Taiz, L.; Zeiger, E.; Møller, I.M.; Murphy, A. Plant Physiology and Development; Sinauer Associates Incorporated: Sunderland, MA, USA, 2015. [Google Scholar]
- Ayala-Ruiz, D.; Castillo Atoche, A.; Ruiz-Ibarra, E.; Osorio de la Rosa, E.; Vázquez Castillo, J. A self-powered PMFC-based wireless sensor node for smart city applications. Wirel. Commun. Mobile Comput. 2019, 2019, 8986302. [Google Scholar] [CrossRef]
- Liu, B.; Liu, H.; Zhong, D.; Lin, C. Searching for a photocycle of the cryptochrome photoreceptors. Curr. Opin. Plant Biol. 2010, 13, 578–586. [Google Scholar] [CrossRef] [PubMed] [Green Version]
- Canarini, A.; Kaiser, C.; Merchant, A.; Richter, A.; Wanek, W. Root exudation of primary metabolites: Mechanisms and their roles in plant responses to environmental stimuli. Front. Plant Sci. 2019, 10, 157. [Google Scholar] [CrossRef] [Green Version]
- Rinnan, R.; Gehrke, C.; Michelsen, A. Two mire species respond differently to enhanced ultraviolet-B radiation: Effects on biomass allocation and root exudation. New Phytol. 2006, 169, 809–818. [Google Scholar] [CrossRef]
- Lin, J.; He, F.; Owens, G.; Chen, Z. How do phytogenic iron oxide nanoparticles drive redox reactions to reduce cadmium availability in a flooded paddy soil? J. Hazard. Mater. 2021, 403, 123736. [Google Scholar] [CrossRef]
- Vranova, V.; Rejsek, K.; Skene, K.R.; Janous, D.; Formanek, P. Methods of collection of plant root exudates in relation to plant metabolism and purpose: A review. J. Plant Nutr. Soil Sci. 2013, 176, 175–199. [Google Scholar] [CrossRef]
- LeVan, H.; Masuda, T. Physiology and biological studies on aluminum tolerance in pineapple. Aust. J. Soil Res. 2004, 42, 699–707. [Google Scholar] [CrossRef]
- Li, W.C.; Ye, Z.H.; Wong, M.H. Effects of bacteria on enhanced metal uptake of the Cd/Zn-hyperaccumulating plant, Sedum alfredii. J. Exp. Bot. 2007, 58, 4173–4182. [Google Scholar] [CrossRef]
- Pamintuan, K.R.S.; Calma, M.A.L.; Feliciano, K.A.D.; Lariba, K.J.P.D. Potential of bioelectricity generation in plant-microbial fuel cells growing house plants. In Proceedings of the IOP Conference Series: Earth and Environmental Science, Changchun, China, 21–23 August 2020. [Google Scholar]
- Ferrari, R.C.; Bittencourt, P.P.; Rodrigues, M.A.; Moreno-Villena, J.J.; Alves, F.R.; Gastaldi, V.D.; Freschi, L. C4 and crassulacean acid metabolism within a single leaf: Deciphering key components behind a rare photosynthetic adaptation. New Phytol. 2020, 225, 1699–1714. [Google Scholar] [CrossRef]
- Savage, J.A.; Clearwater, M.J.; Haines, D.F.; Klein, T.; Mencuccini, M.; Sevanto, S.; Zhang, C. Allocation, stress tolerance and carbon transport in plants: How does phloem physiology affect plant ecology? Plant Cell Environ. 2016, 39, 709–725. [Google Scholar] [CrossRef] [PubMed]
- Farrar, J.F.; Jones, D.L. The control of carbon acquisition by roots. New Phytol. 2000, 147, 43–53. [Google Scholar] [CrossRef]
- Italian Standard UNI 10829:1999; Beni di Interesse Storico Artistico. Condizioni Ambientali di Conservazione. Misurazione ed Analisi. Ente italiano di normazione: Milano, Italy, 1999.


| d [cm] | Min [lux] @ (−15 cm, −20 cm) | Max [lux] @ (0 cm, 0 cm) |
|---|---|---|
| 10 | 4700 | 10,270 |
| 20 | 3080 | 5220 |
| 30 | 2411 | 3730 |
| 40 | 1722 | 2395 |
| 50 | 1369 | 1769 |
| 60 | 1080 | 1438 |
| T [°C] | VI [V] | VD [V] | [mV] |
|---|---|---|---|
| 5 | 0.9336 | 0.9374 | 3.8 |
| 15 | 0.9289 | 0.9330 | 4.1 |
| 25 | 0.9183 | 0.9252 | 6.9 |
| 35 | 0.9080 | 0.9127 | 4.7 |
| 45 | 0.8958 | 0.8908 | 5.0 |
| 55 | 0.8802 | 0.8699 | 10.3 |
| 65 | 0.8599 | 0.8599 | 0 |
| RH [%] | VI [mV] | VD [mV] | [mV] |
|---|---|---|---|
| 30 | −0.5393 | 0.1679 | 0.7 |
| 40 | 0.0071 | 0.7214 | 0.7 |
| 50 | −0.3464 | −0.6250 | 0.3 |
| 60 | 1.5000 | −0.6714 | 2.2 |
| 70 | −0.0536 | −0.1179 | 0.1 |
| 80 | 0.1929 | 0.1357 | 0.1 |
| 90 | −0.7607 | 0.3893 | 1.2 |
Disclaimer/Publisher’s Note: The statements, opinions and data contained in all publications are solely those of the individual author(s) and contributor(s) and not of MDPI and/or the editor(s). MDPI and/or the editor(s) disclaim responsibility for any injury to people or property resulting from any ideas, methods, instructions or products referred to in the content. |
© 2023 by the authors. Licensee MDPI, Basel, Switzerland. This article is an open access article distributed under the terms and conditions of the Creative Commons Attribution (CC BY) license (https://creativecommons.org/licenses/by/4.0/).
Share and Cite
Trigona, C.; Puglisi, I.; Baglieri, A.; Gueli, A.M. Measurement of Visible Radiation through a Sansevieria cylindrica-Based “Living Sensor”. Appl. Sci. 2023, 13, 3896. https://doi.org/10.3390/app13063896
Trigona C, Puglisi I, Baglieri A, Gueli AM. Measurement of Visible Radiation through a Sansevieria cylindrica-Based “Living Sensor”. Applied Sciences. 2023; 13(6):3896. https://doi.org/10.3390/app13063896
Chicago/Turabian StyleTrigona, Carlo, Ivana Puglisi, Andrea Baglieri, and Anna M. Gueli. 2023. "Measurement of Visible Radiation through a Sansevieria cylindrica-Based “Living Sensor”" Applied Sciences 13, no. 6: 3896. https://doi.org/10.3390/app13063896