Article

Mechanical Performance of Polystyrene-Based Nanocomposites Filled with Carbon Allotropes

by
Olga A. Moskalyuk
1,
Andrey V. Belashov
2,
Anna A. Zhikhoreva
2,
Yaroslav M. Beltukov
2 and
Irina V. Semenova
2,*
1
Laboratory of Polymer and Composite Materials «SmartTextiles», IRC–X-ray Coherent Optics, Immanuel Kant Baltic Federal University, 14, A. Nevsky Str., Kaliningrad 236041, Russia
2
Ioffe Institute, Russian Academy of Sciences, 26, Polytekhnicheskaya, St. Petersburg 194021, Russia
*
Author to whom correspondence should be addressed.
Appl. Sci. 2023, 13(6), 4022; https://doi.org/10.3390/app13064022
Submission received: 28 February 2023 / Revised: 19 March 2023 / Accepted: 20 March 2023 / Published: 22 March 2023

Abstract

:
Numerous studies have been performed on different aspects of the mechanical behavior of polymer nanocomposites; however, the results obtained still lack a comprehensive comparative analysis of the mechanical properties of composites containing nanofillers of different shapes and concentrations and subjected to different static and dynamic loads. Carbon nanofillers were shown to provide the most significant improvement in the elastic properties of polymer composites. In this paper, we present a comparative analysis of the mechanical properties of polystyrene-based nanocomposites filled with carbon allotropes of different shapes: spherical fullerene particles, filamentary multi-walled nanotubes, and graphene platelets, fabricated by the same technology. The influence of shape and concentration of dispersed carbon fillers on mechanical and viscoelastic properties of composites in different stress–strain states was evaluated based on the results of tensile and three-point bending tests, and ultrasonic and dynamic mechanical analysis. Comparison of the static and dynamic elastic properties of nanocomposites allowed us to analyze their variations with frequency. At low concentrations of 0.1 wt% and 0.5 wt% all nanofillers did not provide significant improvement of elastic characteristics of composites. More efficient reinforcement was observed at the concentration of 5 wt%. Among the filler types, some increase in composite rigidity was observed with the addition of filamentary particles. The introduction of the layered filler provided the most pronounced rise in the composite rigidity. The weak frequency dependence of the mechanical loss tangent, which is characteristic of amorphous thermoplastics, was demonstrated for all the samples.

1. Introduction

Modern progress in engineering and technology is characterized by the widespread use of polymer-based composite materials both in key heavy industries, including aircraft and automotive production, petrochemical and construction industries, and in biomedical technologies. Polymer materials provide a reduction of product weight, facilitate higher production rates and demonstrate increased resistance to aggressive environments [1].
The development of composite materials with improved properties and the utilization of cost-efficient and environmentally friendly technologies for their production and processing are among the most important tasks of modern polymer material science. Recent progress in the field of nanotechnologies [2,3,4] led to vigorous research on the utilization of various nanosized particles as fillers for polymer composites as well as on the performance of resulting materials. It was shown [5,6,7,8,9,10,11] that small additions of nanofillers (up to a few percent) can drastically change electrical and thermal characteristics of the polymer, and can also lead to noticeable changes in its mechanical properties. In particular, Ayewah et al. have shown [10] that filling the polystyrene matrix with just 0.1–1 wt% of single-walled carbon nanotubes can provide an increase in electrical conductivity of the composite by 5–7 orders of magnitude reaching 10 1 S/m at filler concentration of 1 wt%. At the same time, the composites were characterized by increased brittleness and reduced bending strength and elongation at break. In experiments by Yeh et al. [9] introduction of small amounts (up to 0.1 wt%) of carbon allotropes had no effect on the strength of polystyrene-based composites but caused a reduced elongation at break. An increase in the nanofiller concentration provided a significant increase in the Young’s modulus of the material. However, it is known that over some threshold concentrations, the composite properties tend to decrease, which can be due to nonuniform dispersion and aggregation of filler particles.
The pronounced effect of nanosized particles on the mechanical properties of polymers can be explained by the fact that, at a particle size of 10–100 nm, their surface becomes large enough to transfer almost the entire polymer into the state of an interfacial layer, even at filler concentrations of tenths of a percent. Homogeneous dispersion and strong interaction of the particles with the matrix are required for efficient reinforcement of the material. Robust bonding of filler particles to the matrix is necessary for efficient transfer of the applied stress to the filler allowing it to bear most of the load [12].
Among the high-demand materials are composites based on thermoplastics (polypropylene, polyethylene, polystyrene, etc.), that are expected to provide required mechanical, thermal, structural, and electrical properties, see, e.g., recent papers on polystyrene-based composites intended for various applications [13,14,15]. Challenges arising in the fabrication of composites based on thermoplastics with different types of nanoparticles and attaining desired properties are discussed in a number of reviews (see [1,4,16,17,18]). As known, the tendency of nanosized particles to aggregate can deteriorate significantly the composite properties. Numerous publications are devoted to methods used for stabilization of nanoparticles and for their introduction into polymer matrices aimed at obtaining the required mechanical characteristics of the resulting material [19,20,21,22].
Dispersion of nanofillers in a melt of the polymer matrix is considered to be one of the most efficient ways for the fabrication of nanocomposites based on thermoplastics. The low dielectric constant of the melt reduces electrostatic adhesion between particles and facilitates their dispersion in the bulk of the polymer matrix. The main advantage of the melt technology is the absence of any solvents, which eliminates harmful effluents and enables fast and rather simple processing. The method allows obtaining nanocomposites using conventional equipment, extruders, or special mixers. However, an account should be taken of potential deformation, destruction, and, in particular, aggregation of the filler. More even distribution of the filler can be achieved by utilizing a special extruder with two screws and several mixing zones.
Despite numerous studies of composites filled with nanoparticles, no comprehensive studies have been published by now presenting data on the mechanical behavior of composites containing nanofillers of different shapes and chemical nature in different stress–strain states under static and dynamic loads. As mentioned in [12], no systematic studies have been performed to date that would compare the effect of aspect ratio, nanofiller purity, degree of functionalization, and type of functional group on composite properties. However, such thorough analysis is important for assessing the performance characteristics of the developed polymer composites under various conditions, and their resistance to external loads and can be helpful in the choice of the most appropriate filler for a specific application of the material.
The behavior of a composite material under dynamic loads is determined by its viscoelastic properties, which can be expressed as the frequency dependence of elastic and loss moduli. At the same time, experimental data show that in polystyrene, polymethyl methacrylate, and other amorphous thermoplastics, the mechanical loss tangent weakly depends on frequency over a wide frequency range of more than 10 orders of magnitude [23,24]. Viscoelastic properties play an important role in describing the dynamics of amorphous thermoplastics at different time scales. Therefore, analysis of the effect of nanoinclusions on the elastic properties of a composite at different frequencies is of considerable importance. In this work, in addition to commonly used standard mechanical tests, we performed measurements of the elastic properties of nanocomposite samples using ultrasonic and dynamic mechanical analysis.
Our recent studies have shown that polymer materials and polymer-based composites exhibit nonlinear elastic properties, which lead to the appearance of rich nonlinear dynamics of the materials [25,26,27], which can be realized in particular in the formation of nonlinear strain solitary waves in waveguides made of these materials, see [28,29,30,31] and references therein. Note that to date the nonlinear elastic properties of both polymer materials and polymer-based composites have been poorly studied. However, the data on the nonlinear elasticity of these materials are important for comprehensive analysis of their nonlinear dynamics which is based on an understanding of both static and dynamic mechanical properties [32,33]. We have recently demonstrated that nonlinear elastic properties of polymer nanocomposites depend significantly on the type and concentration of nanoinclusions [25,26,34].
In the previous works [25,35,36,37], we studied mechanical properties of polystyrene-based composites with dispersed fillers of different chemical nature: silicon oxide particles, aluminosilicates, carbon black, and carbon nanotubes. The most significant changes in material properties were achieved with carbonaceous fillers. Carbon nanofillers such as nanotubes and graphene are favorable due to their high mechanical strength and high aspect ratio. Carbon nanotubes were shown to have a tensile strength in the range of 50–150 GPa, 20 times higher than that of high-strength alloys [38], and the tensile modulus of 1 TPa [39,40]. Graphene platelets have Young’s modulus of about 1 TPa, ultimate strength of 130 GPa [41], and a high specific area of 2600 m 2 /g [42].
Recently, we performed an investigation of linear and nonlinear elastic properties of polystyrene-based composites with carbon nanoparticles of different dimensionality: zero-dimensional spherical fullerenes, one-dimensional carbon nanotubes, and two-dimensional graphene platelets and their binary mixtures [34]. The analysis was carried out for a single concentration of nanoinclusions in the polystyrene matrix (5 wt%). However as shown in [43,44] substantial reinforcement can be achieved with carbon nanoparticles at lower concentrations of less than 2 wt%.
In this work we analyzed if lower concentrations of carbon fillers below 1 wt% can provide better reinforcement. For comparative analysis of the effect of concentration and shape of dispersed carbon fillers on mechanical properties of composites under static and dynamic loading, we used standard tensile and three-point bending tests as well as ultrasonic and dynamic mechanical analysis. The apparent advantage of the work was in the realization of the entire set of measurement methods on samples fabricated by the same technology. Comparison of the static and dynamic elastic properties of nanocomposites allowed us to analyze their variations with frequency. The analysis performed provided data allowing for selection of the most efficient dispersed filler for the expected type of loads on the material in the course of its usage.

2. Materials and Methods

2.1. Materials

Experiments were performed on block samples of polystyrene-based composites with carbon allotropes of different shapes. Granular polystyrene (PS) of 585 grade (Nizhnekamskneftekhim, Nizhnekamsk, Russia) [45] was used as a matrix. Finely dispersed carbon particles of three types were used as fillers: multi-walled nanotubes Taunit-M (NanoTechCenter, Tambov, Russia); graphene (RUSGRAPHENE, Moscow, Russia) and C60 fullerenes (MST-Nano, St. Petersburg, Russia). The concentrations of carbon particles in the matrix comprised 0.1, 0.5, and 5 wt%. Multi-walled nanotubes (CNT) are hollow cylindrical structures consisting of several graphene platelets rolled into tubes. According to the manufacturer, Taunit-M nanotubes had the following dimensions: diameter of 10–30 nm, length of about 2 μ m, and specific surface area of about 270 m 2 /g. Note that in the received sample we observed some small amount of agglomerates up to 15 μ m long, consisting of coils of carbon nanotubes that could not be separated by mechanical stirring. Graphene platelets with the thickness of 1–4 nm and diameter of 1–10 μ m were obtained by mechanical exfoliation of graphite. Some amount of stacked platelets of various thicknesses up to 1 μ m were present in the stock material. Fullerenes C60 are absolutely symmetrical molecules of spherical shape with a diameter of 1.7 nm, containing 60 carbon atoms. Fullerenes MST-Nano were supplied with 95.9% purity.

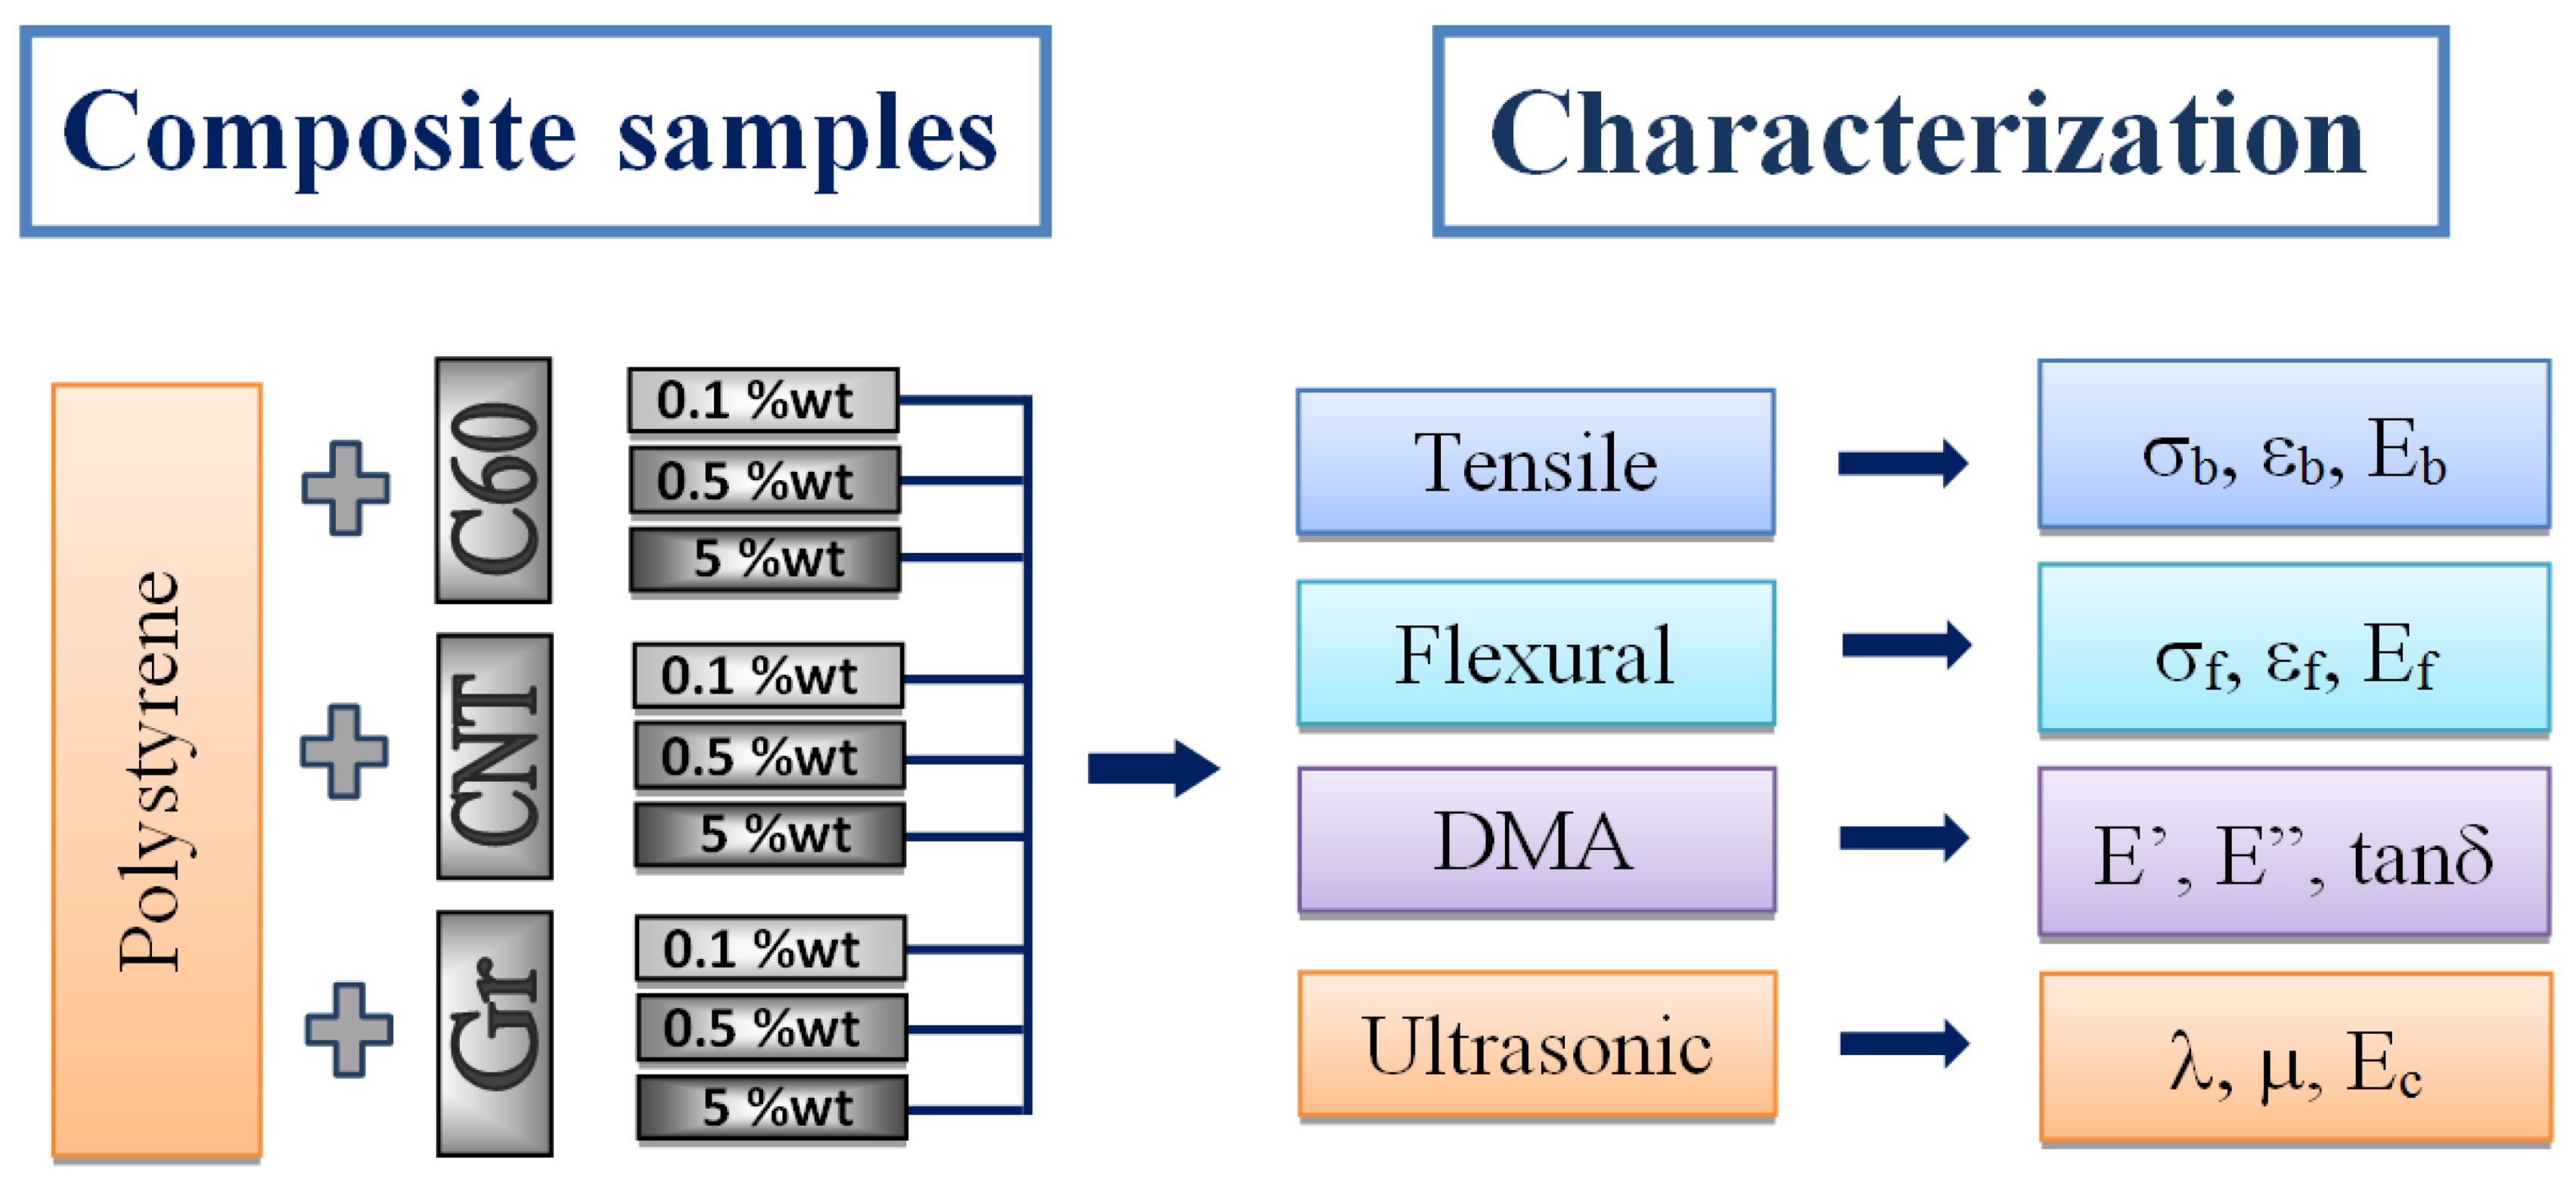
2.2. Fabrication of Composite Samples

Laboratory samples of polystyrene-based composites were fabricated by melt technology from granular polystyrene using a DSM Xplore 15 mL Microcompounder (Xplore, Sittard, The Netherlands). Compounding was carried out at 275 ° C for 10 min at screw rotation speed ω = 140 min 1 , mixing time comprised 3–4 min (until achieving constant viscosity). To reduce the oxidation of the polymer matrix, dry nitrogen was blown into the material supply zone at a rate of 500 mL/min. Upon completion of compounding, the composite melt was injected into the dies heated to 50 ° C . The dies provided samples with the shapes of plates 50   ×   10   ×   1.5 mm 3 and blades with a working area of 20 ×   4 ×   1.5 mm 3 . After being filled with the melt, the dies self-cooled down to room temperature in air. As we have shown earlier [26], even small changes in the technological process can lead to changes in the structure of the polymer material, which can affect the characteristics of the resulting material. In this regard, special attention was paid to maintaining identical conditions of the technological process. Samples made of pure PS were fabricated for control purposes.
Distribution of filler particles in the polymer matrix was controlled by analysis of cryo-SEM images of the samples using a scanning electron microscope. Samples for SEM imaging were prepared following the standard procedure. The composite plate was fixed in a holder and immersed in liquid nitrogen for several seconds. After cooling, the free end of the sample was cleaved with the formation of a cleavage cross-section. The obtained sample was attached to a stub. To eliminate sample surface charge and to improve the image contrast, a thin layer of gold was deposited onto the cryo-cleaved surface. After that, the stub with the sample was loaded into the working chamber of the microscope, and the sample surface was scanned with an electron beam.
Examples of cryo-SEM images of samples filled with 5 wt% of each filler are shown in Figure 1. As can be seen from the images, carbon particles were distributed uniformly in the polymer matrix. However, all three types of particles were observed to produce some small amounts of aggregates. As known [46,47] fullerenes in a polymer matrix can form aggregates with sizes varying from a few nanometers to tens of micrometers. Such aggregates can be observed in Figure 1a,d as tiny white globules, while single C60 particles, 1.7 nm in diameter, are not resolvable in the microphotographs. PS-based composites with carbon nanotubes also contained some small amount of agglomerates up to several micrometers long, distributed uniformly in the bulk of the polymer matrix. Graphene particles in the composites were 3 to 8 μ m long, and 200 to 800 nm thick. The layered structure of graphene platelets is visible in Figure 1c.

2.3. Measurement Methodology

Mechanical properties of fabricated composite samples were studied using uniaxial tensile test, three-point bending (flexural) test, and dynamic mechanical analysis (DMA). Besides that, ultrasound speed in the samples was measured providing data on the corresponding elastic moduli. The experimental methodology is depicted schematically in Figure 2.
Tensile tests were carried out in accordance with ASTM D-638 using an Instron 1122 universal testing machine (Instron, Norwood, MA, USA) at a tensile rate of 10 mm/min under normal conditions. The values of tensile strength σ b , relative strain at break ϵ b , and tensile modulus E b were determined from the obtained stress–strain curves. Three-point bending tests were carried out in accordance with ASTM D-790 also using the Instron 1122 universal testing machine, with a distance between the supports of 30 mm and loading speed of 10 mm/min under normal conditions. The span length to thickness ratio equaled to 20. Based on the loading diagrams, the values of bending stress at a given deflection σ f , the deflection S, a relative bending strain ϵ f and a flexural modulus E f were determined. The measurement error was calculated with a 95% confidence level. Dynamic mechanical analysis was carried out in bending mode at the temperature of 23 ± 2 ° C using a DMA 242 C setup (Netzsch, Selb, Germany) at the frequencies of 0.1, 0.5, 1, 2, 10, 50 Hz and dynamic force of 2 N. Frequency dependencies of the dynamic elastic modulus E , loss modulus E , and mechanical loss tangent tan δ = E / E were obtained.
The dynamic elastic properties of composite samples were studied also by the analysis of variations of the Young’s modulus obtained from measurements of ultrasonic wave velocities. The velocities of longitudinal and shear ultrasonic waves in the samples were measured using, respectively, piezoelectric transducers SC1812 (Amati Acoustics, St.Petersburg, Russia) and V154-RB (Olympus, Waltham, MA, USA). The ultrasonic waves were generated at the frequency of 2 MHz and were further modulated by a meander. Wave velocities in the samples were determined from the time delay of the signal on the receiving transducer. As known according to the acoustoelastic theory the velocities of longitudinal ( V p ) and shear ( V s ) ultrasonic waves in a sample are related with the Lame elastic moduli λ , μ of the material as V p = ( λ + 2 μ ) / ρ ; V s = μ / ρ , where ρ is the material density. The Young’s modulus E c was calculated from the obtained values of λ and μ using the equation: E c = μ ( 3 λ + 2 μ ) / ( λ + μ ) .
Measurements by tensile and three-point bending tests and DMA analysis were performed on 3 to 5 samples of each composite. Measurements of ultrasound velocity were performed on single samples of each composite but were repeated thrice for each sample. The results obtained were averaged over the measurement sets.

3. Results and Discussion

3.1. Tensile Tests

The stress–strain curves of composite samples are shown in Figure 3, and the parameters obtained from these data are summarized in Table 1. Note that the tensile strength σ b and stiffness E b of pure PS samples obtained in this work were higher by 30% and 15%, respectively, than the values specified by the manufacturer for original PS (38 MPa and 2.2 GPa [45]). As can be seen from Table 1 introduction of small amounts (0.1 and 0.5 wt%) of spherical (fullerenes) and lamellar (graphene) carbon particles led to an increase in strain at the break of composite samples. The addition of the same amounts of anisometric particles (nanotubes), on the contrary, caused a noticeable decrease in this parameter. The introduction of the higher amount (5 wt%) of fullerenes provided a decrease in both strength and strain at break, while the sample rigidity remained at the level of pure PS. The same amount of carbon nanotubes also did not cause any noticeable increase in the sample rigidity, the elastic modulus rose only slightly and remained within the measurement error bars. Both the composite strength and strain at break of this sample demonstrated a more profound decrease than that of the sample with the same amount of fullerenes and comprised about 30% for σ b and over 50% for ϵ b . On the contrary introduction of 5 wt% of graphene provided a significant increase in composite rigidity, the tensile modulus E b rose by 30% over that of pure PS. At the same time both the strength and strain at the break of the composite filled with 5 wt% of graphene decreased only slightly as compared to that of pure PS. However, ϵ b decreased by more than 40% as compared to that in the sample filled with 0.1 wt% of graphene.
Thus, the tensile tests revealed the dependence of the mechanical properties of PS-based composites on the shape and concentration of filler particles. Spherical and lamellar carbon particles at low concentrations led to an increase in the tensile elasticity of the composites. The increase in the content of anisometric particles up to 5 wt% caused the decrease in composite strength. The introduction of a layered filler at the concentration of 5 wt% provided an increase in the composite rigidity and its embrittlement, with its strength remaining almost unchanged.

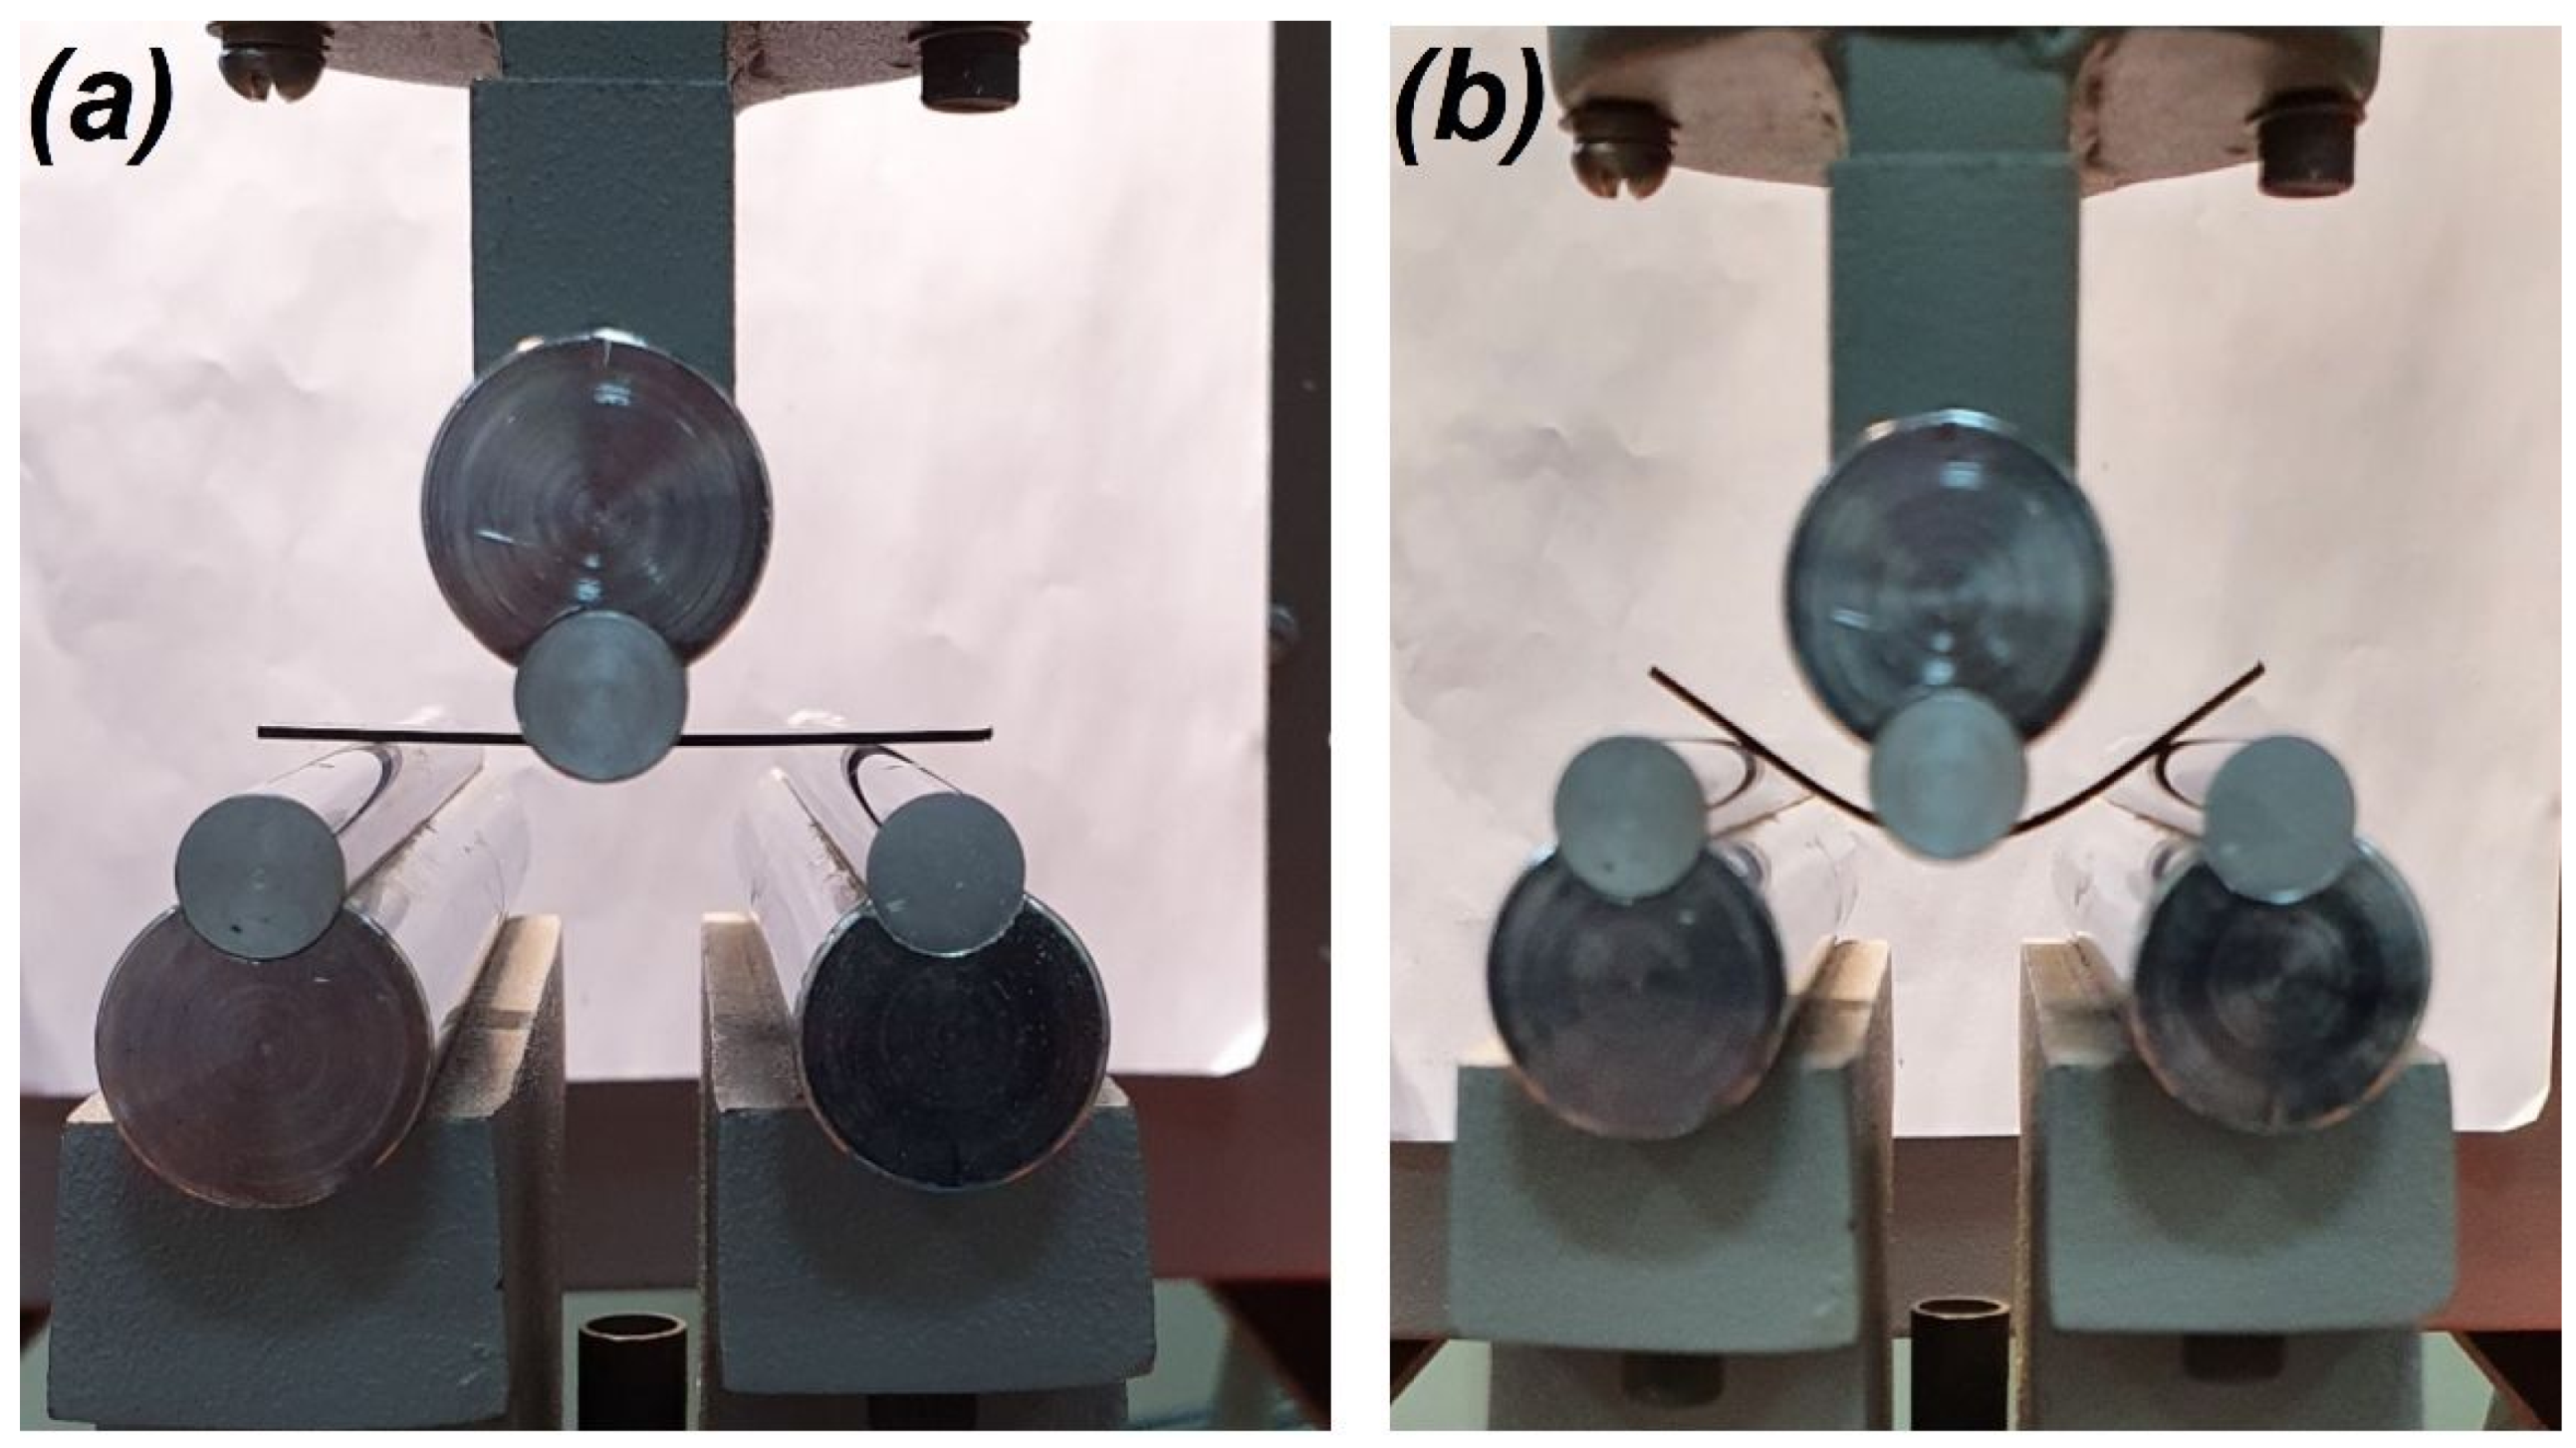
3.2. Three-Point Bending Tests

The composite parameters obtained from three-point bending tests are summarized in Table 1. All the samples were sufficiently ductile, no brittle fracture has been observed at relatively high loads, therefore the flexural stress was calculated at a given deflection of S = 6 mm (see Figure 4).
As can be seen from Table 1, only the samples filled with graphene demonstrated slightly higher flexural stress and somewhat rising flexural elastic modulus, while other composites retained their properties at the level of pure polystyrene. Apparently, the filler concentrations used were not sufficient for providing noticeable changes in the flexural mechanical properties of composites. Most likely, graphene platelets, located in the direction of the melt flow, were capable of exerting a reinforcing effect in block samples loaded in the cross-sectional plane orthogonally to the longitudinal axis of the sample.
The data obtained in tensile and flexural tests correspond to those reported by other authors. In particular, in experiments by Fragneaud et al. [48] introduction of as-produced multiwall carbon nanotubes in polystyrene matrix resulted in a weak increase in the elastic properties of the matrix. Chang et al. [49] observed only a modest increase in the flexural modulus of polystyrene with the addition of annealed SWNT at concentrations up to 2 wt%. Significant enhancement of mechanical properties of PS-based composites containing graphene at concentrations up to 5 wt% was reported by a number of research groups, see [50] and references therein. At the same time mechanical properties of PS-based nanocomposites with carbon nanofillers were shown to exhibit significantly different parameters depending upon fabrication method and procedure, functionalization of filler particles, utilization of a masterbatch, etc., see [51].

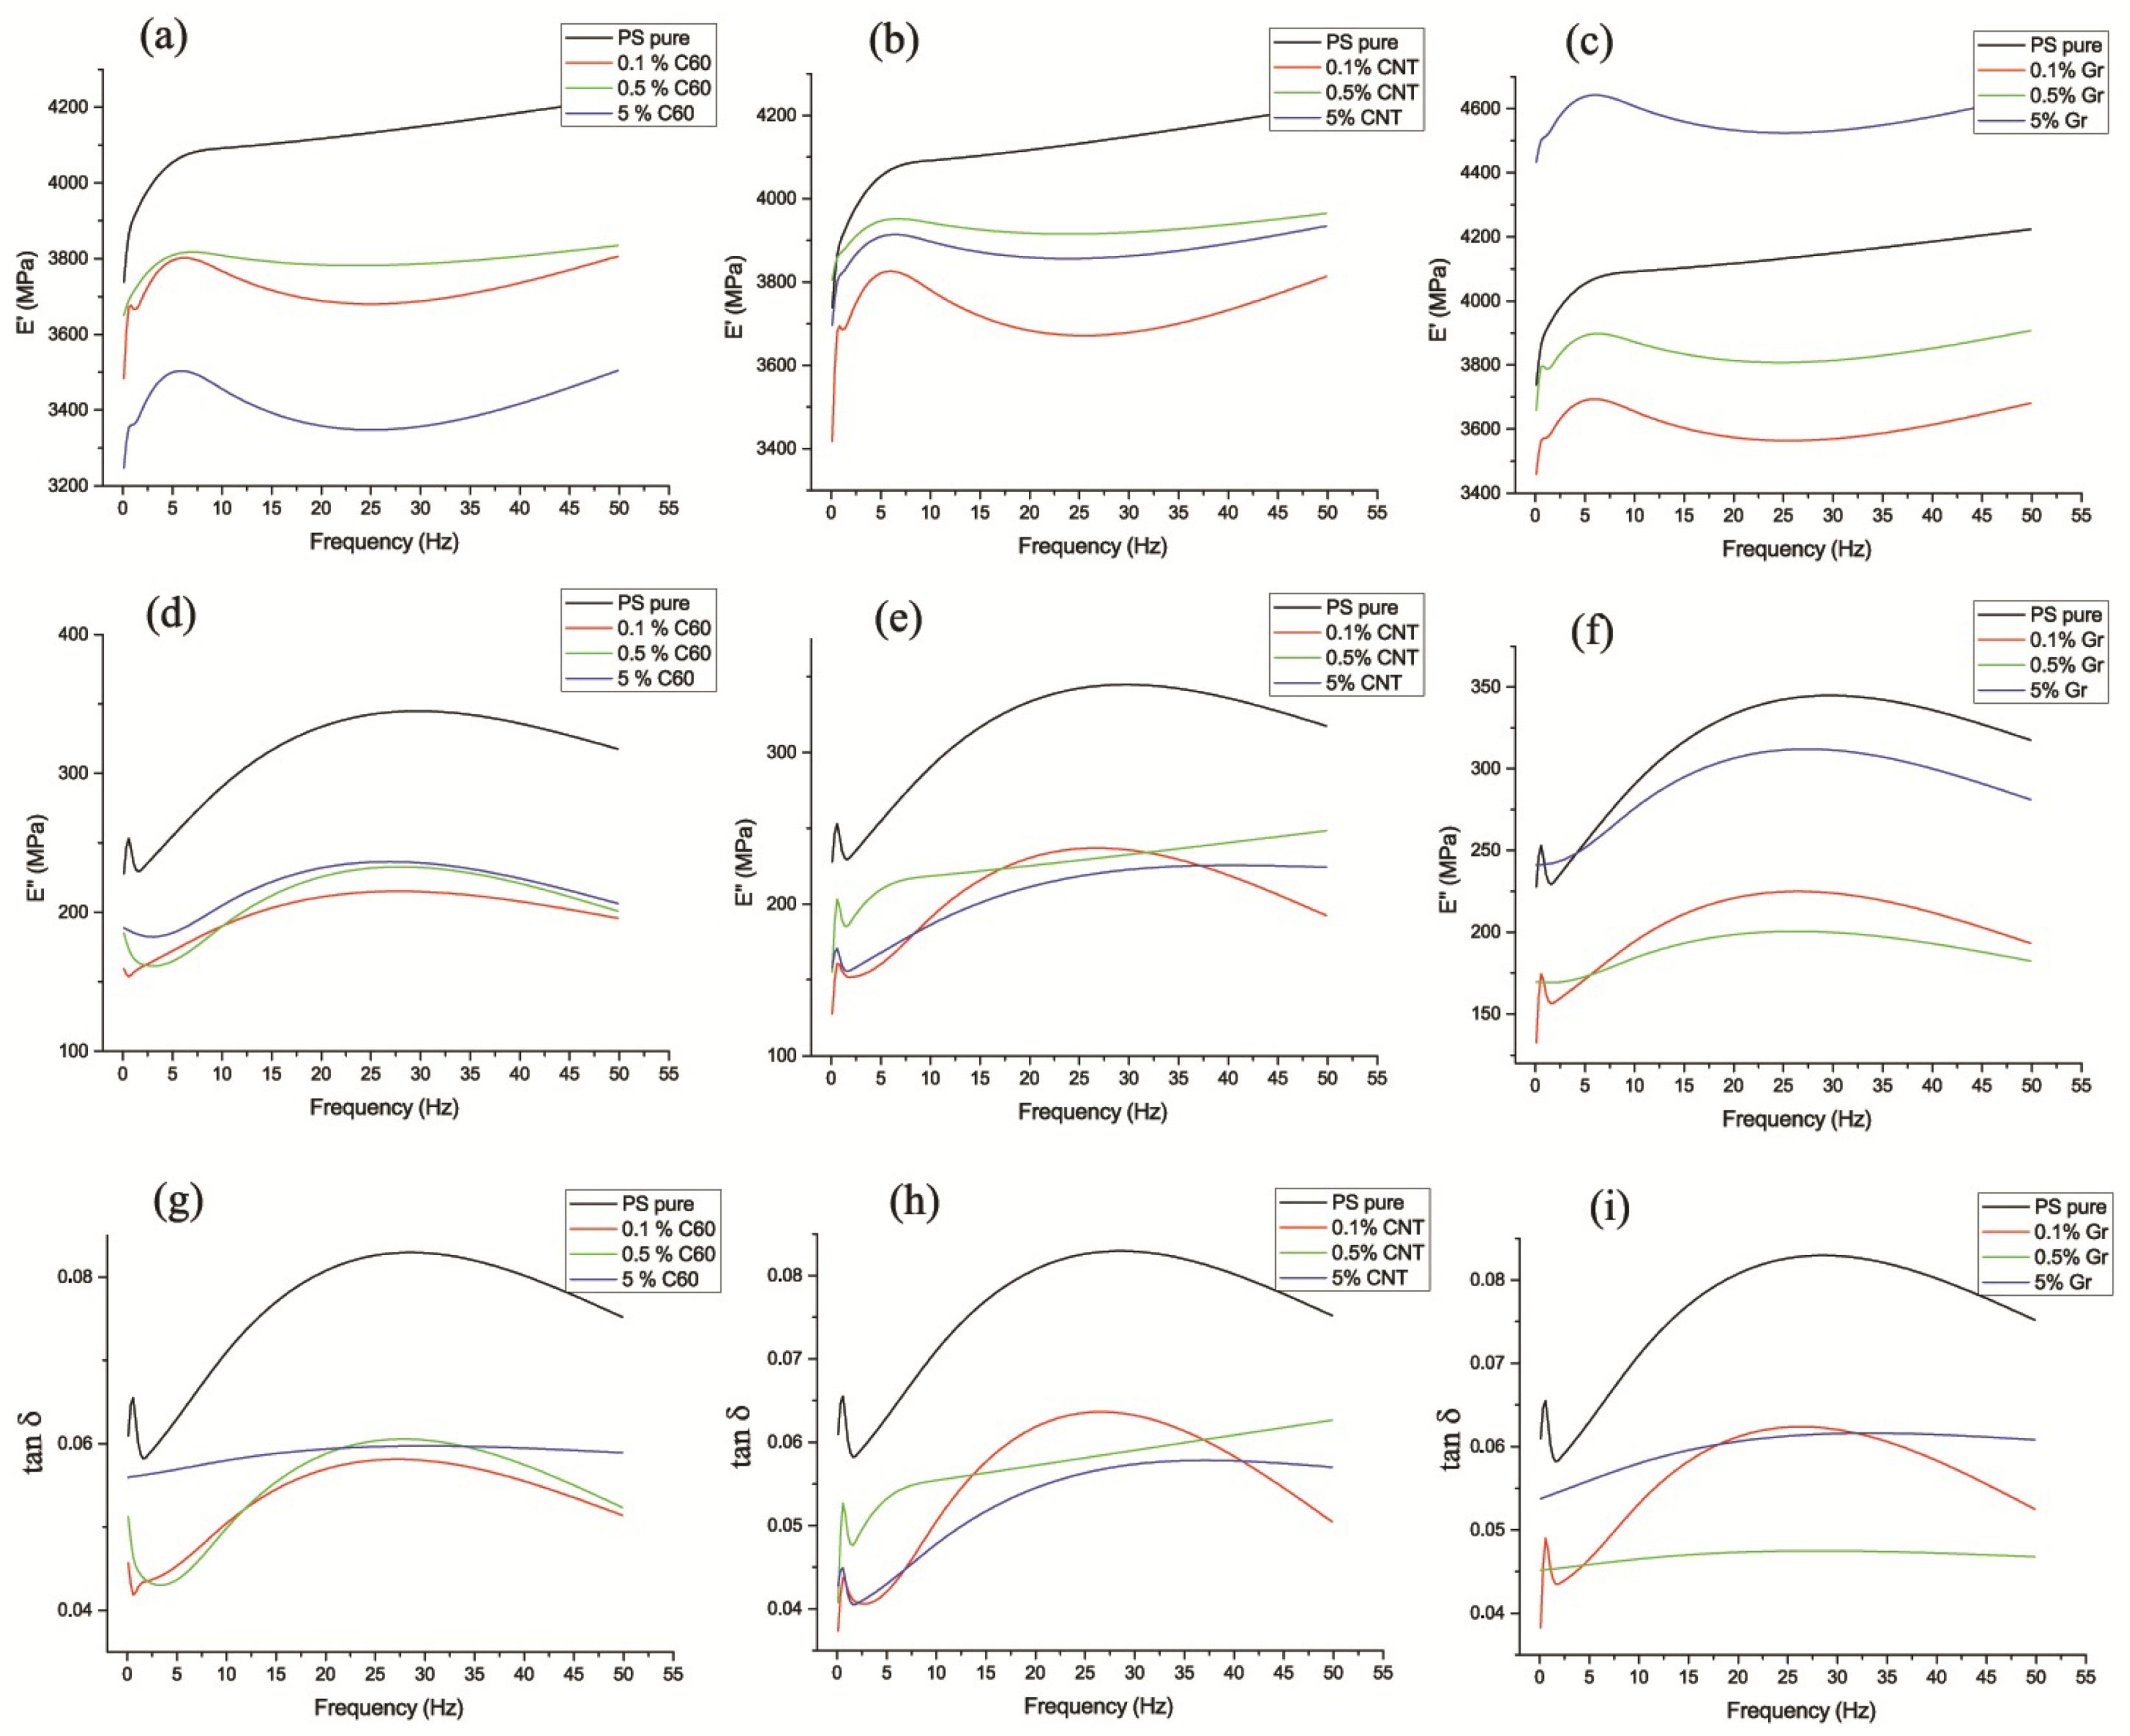
3.3. Dynamic Mechanical Analysis

The results of the DMA analysis of composite samples are shown in Figure 5. As can be seen from Figure 5, the dynamic elastic moduli E of all the samples were almost within the same range as the static moduli obtained in three-point bending tests ( E f = 3.4–4.4 GPa). The introduction of spherical (fullerenes) and anisometric (nanotubes) nanoparticles resulted in some decrease of the modulus. The most significant decrease was observed in composites containing 5 wt% of fullerenes. The layered filler (graphene) caused some decrease of the modulus at lower concentrations, while at 5 wt% it rose in 0.4 GPa, in 10% over 4 GPa in pure PS. The frequency dependencies of the loss modulus in all composite samples were allocated below those for pure PS. The values of loss modulus were in the range of 0.17–0.33 GPa. The frequency dependencies of the loss modulus for composites filled with spherical and layered fillers had a parabolic shape similar to that of pure PS, which can be associated with segmental mobility in the polymer matrix. The maximum was observed at the frequency of 25–30 Hz. At higher concentrations of anisometric particles, the shape of the frequency dependencies of the loss modulus changed from parabolic to linear. The frequency dependencies of the mechanical loss tangent had a similar shape as those for the loss modulus, and the values were in the range of tan δ = ( 40     65 ) · 10 3 . The increase in filler concentration of all allotropic forms of carbon caused the transition from parabolic to the linear shape of the dependencies.
Yu et al. [52] reported a 50% rise in the storage modulus of PS-based composites with functionalized graphene obtained by polymerization in situ. Some increase in the storage modulus was observed also in PS composites with 1 wt% of single- or multi-walled carbon nanotubes, both pristine and modified [53]. Samples were fabricated by compression molding.

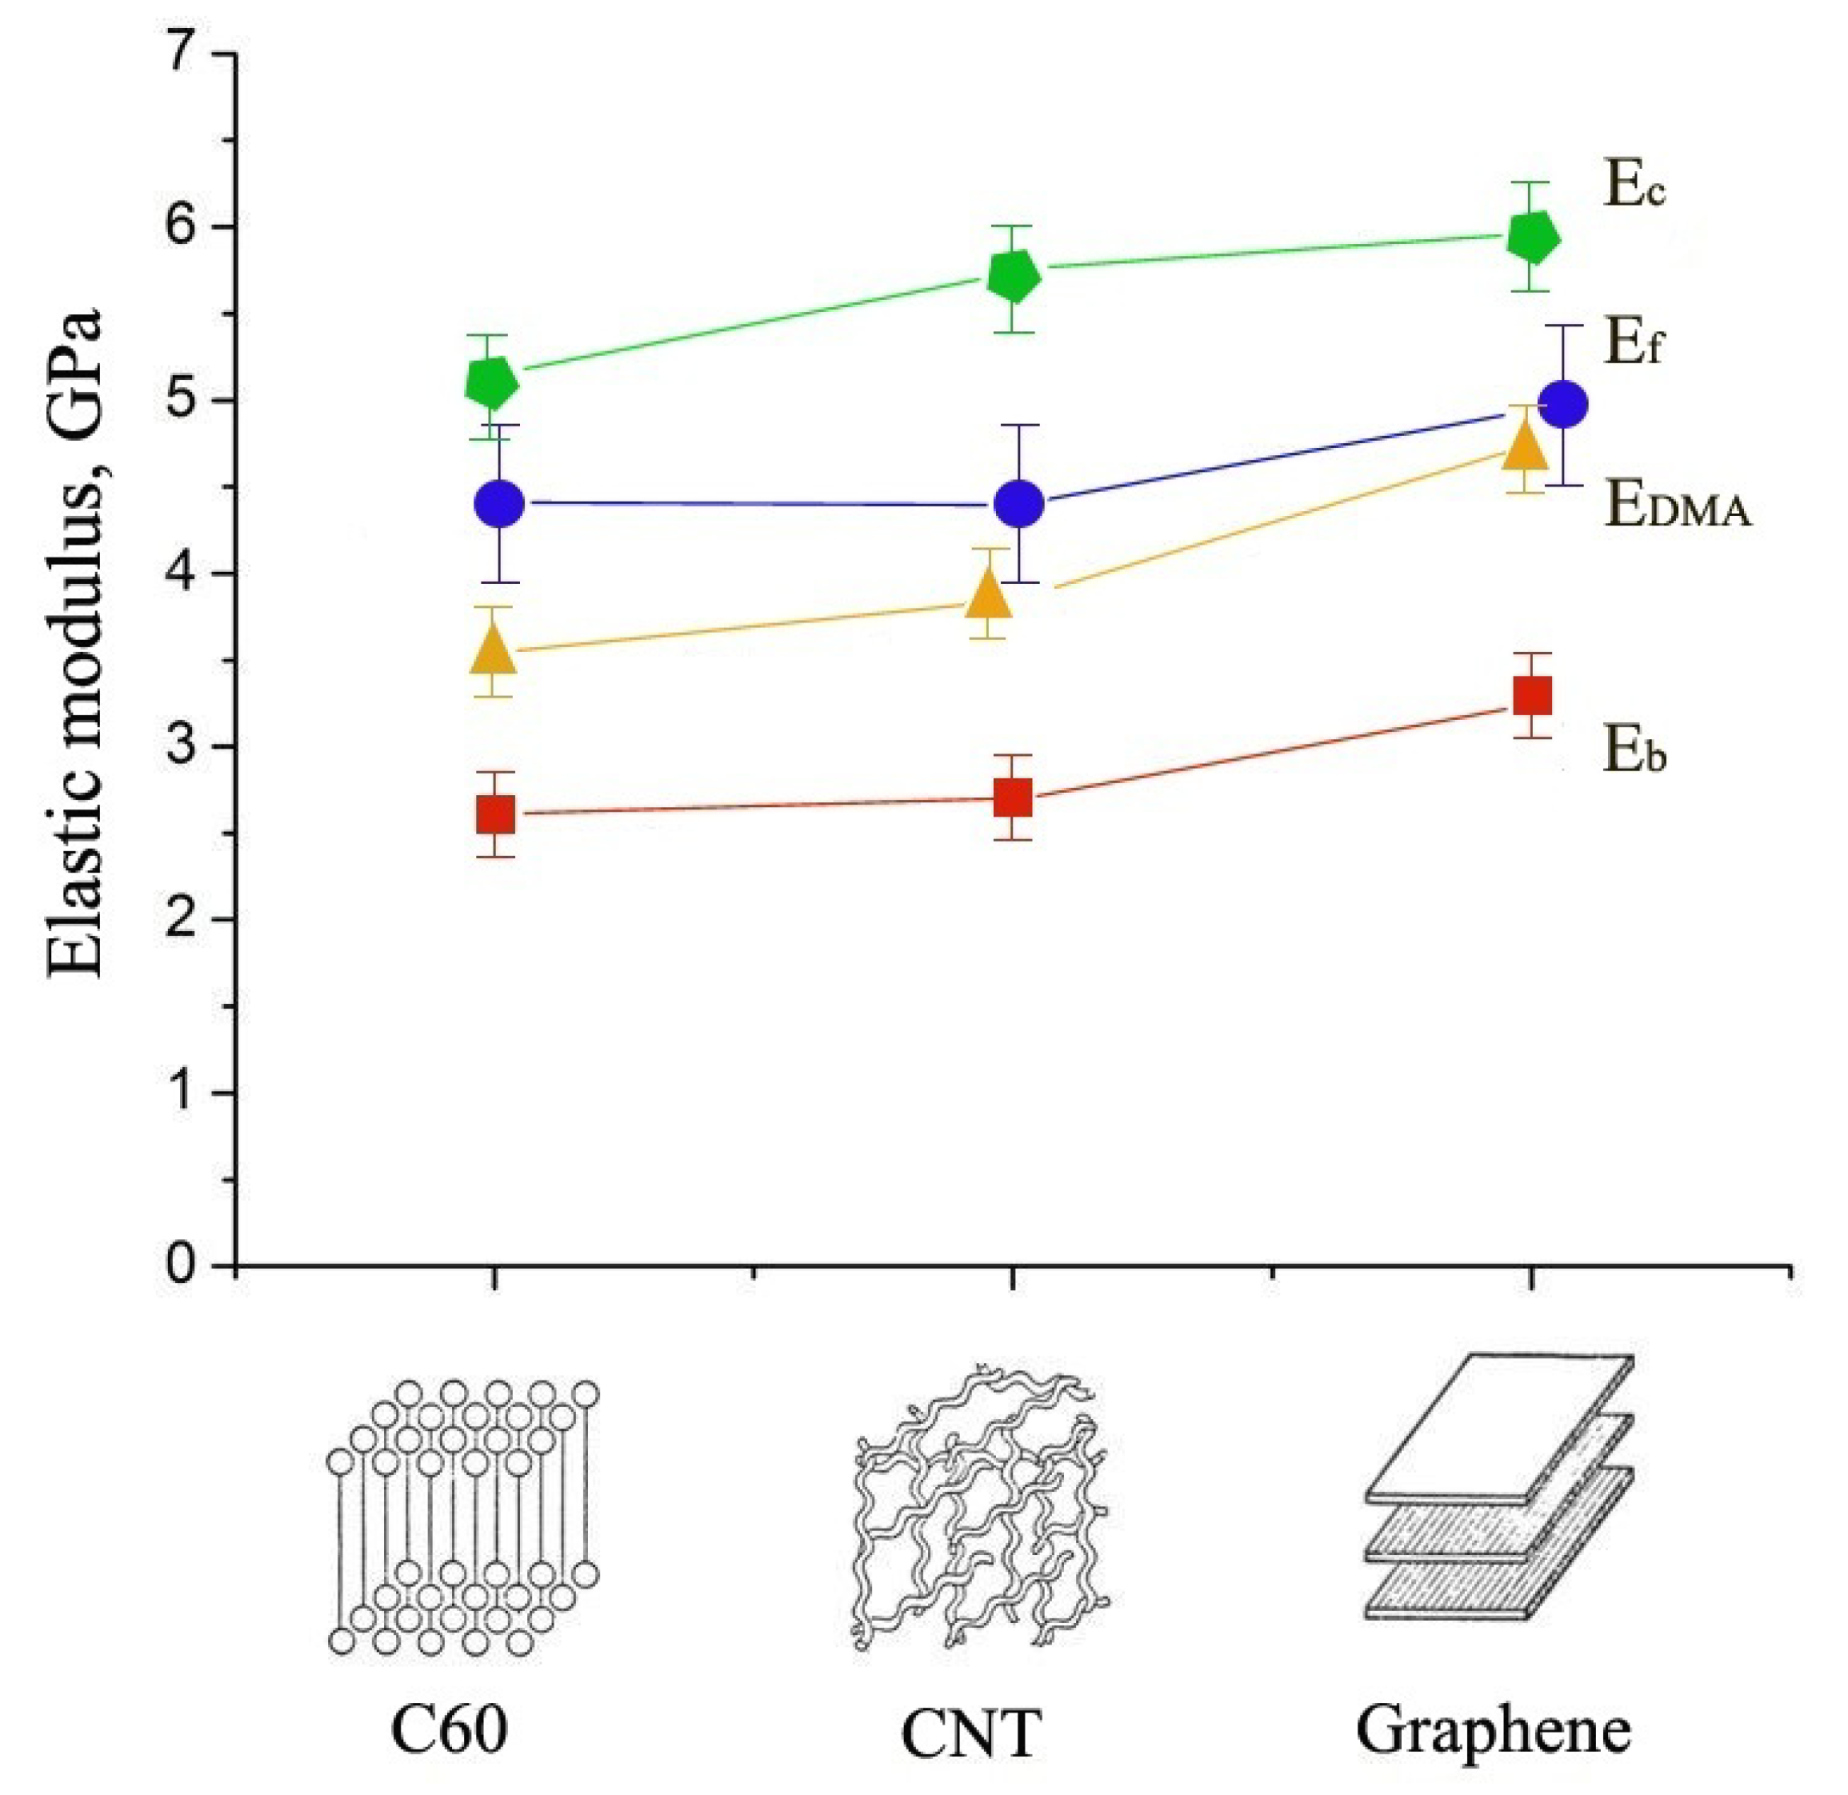
3.4. Elastic Moduli Obtained from Ultrasonic Measurements

The data on Young’s modulus E c and Lame moduli λ , μ of composite samples obtained from measurements of the sound velocity at the frequency of 2 MHz are given in Table 2. As can be seen from these data at a low concentration of 0.1 wt% neither of the fillers caused changes to the elastic moduli over those of pure PS. Moreover, spherical nanoparticles did not lead to moduli variations at higher concentrations as well. Meanwhile filling of the PS matrix with nanotubes and graphene provided some increase in the moduli at higher concentrations, especially notable at 5 wt%. The most significant rise of moduli values was observed in samples filled with 5 wt% of graphene. Note that the same tendency was observed in the static three-point bending tests.

3.5. Discussion

As can be seen from Table 1 and Table 2 and Figure 5, the values of Young’s modulus obtained from quasi-static (Table 1) and ultrasonic (Table 2) measurements and dynamic mechanical analysis (Figure 5) differ significantly for the same composites. This can be due to essentially different characteristic frequencies used in these techniques for measurements of elastic characteristics of materials. As known, in polymeric materials and polymer-based composites the frequency dependence of elastic moduli plays a significant role. The frequency dependence of the dynamic elastic modulus is directly related to the loss modulus by the Kramers–Kronig relationship [54]. In amorphous thermoplastics, including polystyrene, the mechanical loss tangent weakly depends on the frequency in a very wide range from fractions of a Hz to several MHz [23,24]. Therefore, according to the Kramers–Kronig relationship, the mechanical loss tangent, averaged on a logarithmic frequency scale from the frequency ω 1 to the frequency ω 2 , equals [54]:
tan δ = π 2 ln ( E ( ω 2 ) / E ( ω 1 ) ) ln ( ω 2 / ω 1 )
For the materials used in this study, the ratio of the elastic modulus at the frequency of 2 MHz to that at 20 Hz is within the range of 1.3–1.5, which corresponds to the average value of the mechanical loss tangent tan δ = ( 35     55 ) · 10 3 in the frequency range from 20 Hz to 2 MHz. These values agree well with those obtained by DMA in the range of 1–50 Hz (see Figure 5g–i).
Figure 6 presents a graphical summary of the values of elastic moduli of PS-based composites filled with dispersed particles of carbon allotropes obtained in mechanical tests utilized. The comparison was made for samples containing 5 wt% of each type of carbon particle. DMA data are shown for the frequency of 5 Hz. As can be seen from Figure 6, spherical nanoparticles (fullerenes) provided a considerable difference in all elastic moduli obtained at static, dynamic, and ultrasonic tests. With anisometric particles (nanotubes) the difference in moduli obtained in three-point bending tests under static and dynamic loads decreased, and with the layered filler (graphene) it was practically absent. However, for both CNT and Gr, a considerable difference was still observed between the moduli determined in tensile and three-point bending tests and ultrasonic measurements. In general, elastic moduli obtained by nondestructive (ultrasonic) measurements showed higher values than those at tensile or three-point bending tests. Composites filled with graphene were characterized by higher elastic moduli of all types as compared to composites with other carbon nanoparticles. This finding correlates with the results by Kim et al. [55], who showed that mechanical reinforcement with graphene was superior to that with carbon black or single-wall nanotubes. We note that as shown in our recent paper [34] and by other researchers [56,57] hybrid nanofillers containing two carbon allotropes of different shapes can provide a synergistic effect and allow for obtaining better reinforcement of the material. Such fillers can form interconnected structures, improving the dispersion of filler particles and changing the crystallinity of the polymer matrix.
The predominant orientation of the layered filler is worth noting (see Figure 1c,f. Filling the PS matrix with spherical (fullerenes) or filamentous anisometric (nanotubes) particles led to the formation of an isotropic structure of the composite, while two-dimensional particles had a preferential orientation caused by the extrusion process. Therefore, the most efficient dispersed filler can be selected depending on the expected type of loading; for example, filamentous structures are preferable for uniaxial loading, while the layered filler is favorable at loading perpendicular to the longitudinal axis in the cross-sectional plane.

4. Conclusions

Mechanical properties of polystyrene-based composites filled with carbon particles of different dimensionality (0D, 1D, and 2D) and at different concentrations (0.1, 0.5, and 5 wt%) were analyzed using a set of static and dynamic tests. The stress–strain performance of composite samples was studied in tensile and three-point bending tests, and dynamic mechanical and ultrasonic analysis. At low concentrations of 0.1 wt% and 0.5 wt%, all nanofillers did not provide significant improvement in the elastic characteristics of composites. More efficient reinforcement was observed at the concentration of 5 wt%. Among the filler types, some increase in composite rigidity was observed with the addition of carbon particles with a high axial ratio (nanotubes). The introduction of the layered filler (graphene) led to the most pronounced increase in material rigidity in three-point bending tests, under static and dynamic loads, and in measurements of ultrasound velocity. Note that due to the observed existence of some amounts of filler aggregates in composite samples functionalization of filler particles or utilization of a masterbatch could improve reinforcement of composites. Filling of the polystyrene matrix with spherical or filamentary particles provided the formation of an isotropic structure of the composite, while two-dimensional particles formed an anisotropic structure. Depending on the expected type of loading of elements produced by these materials, it is possible to choose the most efficient dispersed filler.
A comparison of the static and dynamic elastic properties of nanocomposites with carbon inclusions showed that the addition of nanoparticles provided an increase in the elastic properties at different frequencies. For all studied composites, the average value of the mechanical loss tangent in the frequency range from 20 Hz to 2 MHz was consistent with the DMA results in the range of 1–50 Hz, which corresponds to the weak frequency dependence of the mechanical loss tangent, that is characteristic for amorphous thermoplastics. The conclusions obtained on the value of mechanical loss tangent allow for a better understanding of the dynamics of polymeric materials and polymer-based composites and for applying the obtained values to describe nonlinear and viscoelastic effects in such materials. Nonlinear elastic moduli demonstrate much more pronounced variations with frequency than the mechanical loss tangent and, therefore, can provide additional important information needed to accurately describe and predict the viscoelastic behavior of polymer-based composite materials. The future direction of our work can be in the thorough analysis of nonlinear elastic properties of the composites with carbon allotropes.

Author Contributions

Conceptualization and methodology, O.A.M., A.V.B., Y.M.B. and I.V.S.; validation and investigation, O.A.M., A.V.B. and A.A.Z.; data curation and writing, O.A.M., A.V.B., Y.M.B. and I.V.S. All authors have read and agreed to the published version of the manuscript.

Funding

The financial support from Russian Science Foundation under the grant # 22-72-10083 is gratefully acknowledged.

Institutional Review Board Statement

Not applicable.

Informed Consent Statement

Not applicable.

Data Availability Statement

Data are available within the paper.

Acknowledgments

Authors are grateful to Ioffe Institute for providing equipment used in experiments.

Conflicts of Interest

The authors declare no conflict of interest.

References

  1. Jeon, I.Y.; Baek, J.B. Nanocomposites Derived from Polymers and Inorganic Nanoparticles. Materials 2010, 3, 3654–3674. [Google Scholar] [CrossRef] [Green Version]
  2. Nalwa, H.S. Encyclopedia of Nanoscience and Nanotechnology; American Scientific Publishers: Valencia, CA, USA, 2004. [Google Scholar]
  3. Sachdev, V.K.; Bhattacharya, S.; Patel, K.; Sharma, S.K.; Mehra, N.C.; Tandon, R.P. Electrical and EMI shielding characterization of multiwalled carbon nanotube/polystyrene composites. J. Appl. Polym. Sci. 2014, 131, 40201. [Google Scholar] [CrossRef]
  4. Hanemann, T.; Szabó, D.V. Polymer-Nanoparticle Composites: From Synthesis to Modern Applications. Materials 2010, 3, 3468–3517. [Google Scholar] [CrossRef]
  5. Friedrich, K.; Fakirov, S.; Zhang, Z. (Eds.) Polymer Composites—From Nano- to Macroscale; Springer: Berlin/Heidelberg, Germany, 2005. [Google Scholar]
  6. Calleja, J.F.B.; Michler, G. (Eds.) Mechanical Properties of Polymers Based on Nanostructure and Morphology; CRC Press: Boca Raton, FL, USA, 2005. [Google Scholar]
  7. Liu, H.; Wen, S.; Wang, J.; Zhu, Y. Preparation and characterization of carbon black-polystyrene composite particles by high-speed homogenization assisted suspension polymerization. J. Appl. Polym. Sci. 2012, 123, 3255–3260. [Google Scholar] [CrossRef]
  8. Zhou, S.; Hrymak, A.N.; Kamal, M.R. Effect of Hybrid Carbon Fillers on the Electrical and Morphological Properties of Polystyrene Nanocomposites in Microinjection Molding. Nanomaterials 2018, 8, 779. [Google Scholar] [CrossRef] [Green Version]
  9. Yeh, S.K.; Su, C.C.; Huang, J.M.; Ke, M.Q.; Bogale, D.; Anbarasan, R.; Tung, K.L.; Wang, S.F. Fabrication of polystyrene/carbon nanocomposites with superior mechanical properties. Polym. Eng. Sci. 2020, 60, 2046–2056. [Google Scholar] [CrossRef]
  10. Ayewah, D.O.O.; Davis, D.C.; Krishnamoorti, R.; Lagoudas, D.C.; Suec, H.J.; Willson, M. A surfactant dispersed SWCNT-polystyrene composite characterized for electrical and mechanical properties. Compos. Part A Appl. Sci. Manuf. 2010, 41, 842–849. [Google Scholar] [CrossRef]
  11. Ginzburg, B.M.; Shibaev, L.A.; Kireenko, O.F.; Shepelvskii, A.A.; Melenevskaya, E.Y.; Ugolkov, V.L. Thermal degradation of fullerene-containing polymer systems and formation of tribopolymer films. Polym. Sci. Ser. A 2005, 47, 160–174. [Google Scholar]
  12. Bhattacharya, M. Polymer Nanocomposites—A Comparison between Carbon Nanotubes, Graphene, and Clay as Nanofillers. Materials 2016, 9, 262. [Google Scholar] [CrossRef] [Green Version]
  13. Mohammed, A.; Rao, D.N. Investigation on mechanical properties of flax fiber/expanded polystyrene waste composites. Heliyon 2023, 9, e13310. [Google Scholar] [CrossRef]
  14. Ahmad, M.N.; Ishak, M.R.; Taha, M.M.; Mustapha, F.; Leman, Z. Mechanical, thermal and physical characteristics of oil palm (Elaeis Guineensis) fiber reinforced thermoplastic composites for FDM–Type 3D printer. Polym. Test. 2023, 120, 107972. [Google Scholar] [CrossRef]
  15. Al-Muntaser, A.A.; Pashameah, R.A.; Saeed, A.; Alwafi, R.; Alzahrani, E.; AlSubhi, S.A.; Yassin, A.Y. Boosting the optical, structural, electrical, and dielectric properties of polystyrene using a hybrid GNP/Cu nanofiller: Novel nanocomposites for energy storage applications. J. Mater. Sci. Mater. Electron. 2023, 34, 678. [Google Scholar] [CrossRef]
  16. Thostenson, E.T.; Li, C.; Chou, T.W. Nanocomposites in context. Compos. Sci. Technol. 2005, 65, 491–516. [Google Scholar] [CrossRef]
  17. Jordan, J.; Jacob, K.I.; Tannenbaum, R.; Sharaf, M.A.; Jasiuk, I. Experimental trends in polymer nanocomposites—A review. Mater. Sci. Eng. A 2005, 393, 1–11. [Google Scholar] [CrossRef]
  18. Hussain, F.; Hojjati, M.; Okamoto, M.; Gorga, R.E. Polymer-matrix Nanocomposites, Processing, Manufacturing, and Application: An Overview. Mater. Sci. Eng. A 2006, 40, 1511–1575. [Google Scholar]
  19. Pötschke, P.; Bhattacharyya, A.R.; Janke, A. Melt mixing of polycarbonate with multiwalled carbon nanotubes: Microscopic studies on the state of dispersion. Eur. Polym. J. 2004, 40, 137–148. [Google Scholar] [CrossRef]
  20. Ogasawara, T.; Ishida, Y. Characterization of multi-walled carbon nanotube/phenylenthynyl terminated polyimide composites. Compos. Part A 2004, 35, 67–74. [Google Scholar] [CrossRef]
  21. Katada, A.; Buys, Y. Resistivity control in the semiconductive region for carbon black-filled polymer composites. Colloid Polym. Sci. 2005, 283, 367–374. [Google Scholar] [CrossRef]
  22. Mierczynska, A.; Friedrich, J. Segregated network polymer/carbon nanotubes composites. Cent. Eur. J. Chem. 2004, 2, 363–370. [Google Scholar] [CrossRef]
  23. Hurley, D.C.; Campbell, S.E.; Killgore, J.P.; Cox, L.M.; Ding, Y. Measurement of viscoelastic loss tangent with contact resonance modes of atomic force microscopy. Macromolecules 2013, 46, 9396–9402. [Google Scholar] [CrossRef]
  24. Ferry, J.D. The Glassy State. In Viscoelastic Properties of Polymers; John Wiley & Sons: Hoboken, NJ, USA, 1980; pp. 437–456. [Google Scholar]
  25. Belashov, A.V.; Beltukov, Y.M.; Moskalyuk, O.A.; Semenova, I.V. Relative variations of nonlinear elastic moduli in polystyrene-based nanocomposites. Polym. Test. 2021, 95, 107132. [Google Scholar] [CrossRef]
  26. Belashov, A.V.; Zhikhoreva, A.A.; Beltukov, Y.M.; Moskalyuk, O.A.; Semenova, I.V. Third-order elastic moduli of polystyrene samples fabricated by different technologies. Tech. Phys. 2021, 66, 1085–1091. [Google Scholar] [CrossRef]
  27. Semenova, I.; Belashov, A.; Zhikhoreva, A.; Moskalyuk, O.; Beltukov, Y. Frequency Dependence of Nonlinear Elastic Moduli of Polystyrene-Based Nanocomposites in the Range of 1.5–2.5 MHz. Macromol. Symp. 2022, 405, 2100252. [Google Scholar] [CrossRef]
  28. Samsonov, A.M. Strain Solitons in Solids and How to Construct Them; Chapman & Hall/CRC: Boca Raton, FL, USA, 2001. [Google Scholar]
  29. Dreiden, G.V.; Khusnutdinova, K.R.; Samsonov, A.M.; Semenova, I.V. Bulk strain solitary waves in bonded layered polymeric bars with delamination. J. Appl. Phys. 2012, 112, 063516. [Google Scholar] [CrossRef]
  30. Belashov, A.; Beltukov, Y.; Petrov, N.; Samsonov, A.; Semenova, I. Indirect assessment of bulk strain soliton velocity in opaque solids. Appl. Phys. Lett. 2018, 112, 121903. [Google Scholar] [CrossRef]
  31. Garbuzov, F.E.; Khusnutdinova, K.R.; Semenova, I.V. On Boussinesq-type models for long longitudinal waves in elastic rods. Wave Motion 2019, 88, 129–143. [Google Scholar] [CrossRef] [Green Version]
  32. Garbuzov, F.; Semenova, I.; Belashov, A.; Beltukov, Y. Formation of solitary strain waves in viscoelastic waveguides. In Proceedings of the International Conference “Days on Diffraction 2021”, Saint Petersburg, Russia, 31 May–4 June 2021; pp. 58–62. [Google Scholar]
  33. Garbuzov, F.E.; Belashov, A.V.; Zhikhoreva, A.A.; Beltukov, Y.M.; Semenova, I.V. Shock Wave Evolution into Strain Soliton in Nonlinearly Elastic Solid Bar. Wave Motion 2022, 114, 103022. [Google Scholar] [CrossRef]
  34. Belashov, A.V.; Zhikhoreva, A.A.; Moskalyuk, O.A.; Beltukov, Y.M.; Semenova, I.V. Linear and nonlinear elastic properties of polystyrene-based nanocomposites with allotropic carbon fillers and binary mixtures. Polymers 2022, 14, 5462. [Google Scholar] [CrossRef]
  35. Moskalyuk, O.A.; Samsonov, A.M.; Semenova, I.V.; Smirnova, V.E.; Yudin, V.E. Mechanical Properties of Polymeric Composites with Silicon Dioxide Particles. Tech. Phys. 2017, 62, 294–298. [Google Scholar] [CrossRef]
  36. Moskalyuk, O.A.; Semenova, I.V.; Yudin, V.E.; Beltukov, Y.M.; Saprykina, N.N.; Elokhovskii, V.Y. Polystyrene-Based Composites with Aluminosilicate Inclusions of Different Shapes. Tech. Phys. 2019, 64, 245–251. [Google Scholar] [CrossRef]
  37. Moskalyuk, O.A.; Belashov, A.V.; Beltukov, Y.M.; Ivan’kova, E.M.; Popova, E.N.; Semenova, I.V.; Yelokhovskii, V.Y.; Yudin, V.E. Polystyrene-based nanocomposites with different fillers: Fabrication and mechanical properties. Polymers 2020, 12, 2457. [Google Scholar] [CrossRef] [PubMed]
  38. Thostenson, E.K.; Chou, T.W. Aligned multi-walled carbon nanotube-reinforced composites: Processing and mechanical characterization. J. Phys. D Appl. Phys. 2002, 35, L77–L80. [Google Scholar] [CrossRef]
  39. Yu, M.; Dyer, M.J.; Kelly, T.F.; Ruoff, R.S. Strength and breaking mechanism of multiwalled carbon nanotubes under tensile load. Science 2000, 287, 637–640. [Google Scholar] [CrossRef] [Green Version]
  40. Al Sheheri, S.Z.; Al-Amshany, Z.M.; Al Sulami, Q.A.; Tashkandi, N.Y.; Hussein, M.A.; El-Shishtawy, R.M. The preparation of carbon nanofillers and their role on the performance of variable polymer nanocomposites. Des. Monomers Polym. 2019, 22, 8–53. [Google Scholar] [CrossRef] [Green Version]
  41. Lee, C.; Wei, X.; Kysar, J.W.; Hone, J. Measurement of the Elastic Properties and Intrinsic Strength of Monolayer Graphene. Science 2008, 321, 385–388. [Google Scholar] [CrossRef]
  42. Geim, A.K.; Novoselov, K.S. The rise of graphene. Nat. Mater. 2007, 6, 183–191. [Google Scholar] [CrossRef]
  43. Rafiee, M.A.; Rafiee, J.; Wang, Z.; Song, H.; Yu, Z.Z.; Koratkar, N. Enhanced Mechanical Properties of Nanocomposites at Low Graphene Content. ACS Nano 2009, 3, 3884–3890. [Google Scholar] [CrossRef]
  44. Grady, B.P. Carbon Nanotube-Polymer Composites Manufacture, Properties, and Applications; John Wiley and Sons: New York, NY, USA, 2011. [Google Scholar]
  45. TDS 585 Polystyrene. Available online: https://nknh.ru/upload/iblock/9b8/EN_585V.pdf (accessed on 15 January 2022).
  46. Leach, S.; Vervloet, M.; Desprès, A.; Bréheret, E.; Hare, J.P.; Dennis, T.J.; Kroto, H.W.; Taylor, R.; Walton, D.R. Electronic spectra and transitions of the fullerene C60. Chem. Phys. 1992, 160, 451–466. [Google Scholar] [CrossRef]
  47. David, W.I.F.; Ibberson, R.M.; Dennis, T.J.S.D.; Bréheret, E.; Hare, J.P.; Prassides, K. Structural Phase Transitions in the Fullerene C60. Eur. Polym. J. 1992, 18, 219. [Google Scholar]
  48. Fragneaud, B.; Masenelli-Varlot, K.; Gonzalez-Montiel, A.; Terrones, M.; Cavaillé, J.Y. Mechanical behavior of polystyrene grafted carbon nanotubes/polystyrene nanocomposites. Compos. Sci. Technol. 2008, 68, 3265–3271. [Google Scholar] [CrossRef] [Green Version]
  49. Chang, T.E.; Kisliuk, A.; Rhodes, S.M.; Brittain, W.J.; Sokolov, A.P. Conductivity and mechanical properties of well-dispersed single-wall carbon nanotube/polystyrene composite. Polymer 2006, 47, 7740–7746. [Google Scholar] [CrossRef]
  50. Lee, S.J.; Yoon, S.J.; Jeon, I.Y. Graphene/Polymer Nanocomposites: Preparation, Mechanical Properties, and Application. Polymers 2022, 14, 4733. [Google Scholar] [CrossRef]
  51. Faraguna, F.; Potschke, P.; Pionteck, J. Preparation of polystyrene nanocomposites with functionalized carbon nanotubes by melt and solution mixing: Investigation of dispersion, melt rheology, electrical and thermal properties. Polymer 2017, 132, 325–341. [Google Scholar] [CrossRef]
  52. Yu, Y.H.; Lin, Y.Y.; Lin, C.H.; Chan, C.C.; Huang, Y.C. High-performance polystyrene/graphene-based nanocomposites with excellent anti-corrosion properties. Polym. Chem. 2014, 5, 535–550. [Google Scholar] [CrossRef]
  53. Espejo, C.; Carrión-Vilches, F.J.; Bermúdez, M.D. Viscoelastic properties and long-term stability of polystyrene-carbon nanotube nanocomposites. Effect of the nature of the carbon nanotubes and modification by ionic liquid. Polym. Degrad. Stab. 2014, 103, 42–48. [Google Scholar] [CrossRef]
  54. Pritz, T. Verification of local Kramers–Kronig relations for complex modulus by means of fractional derivative model. J. Sound Vib. 1999, 228, 1145–1165. [Google Scholar] [CrossRef]
  55. Kim, H.; Abdala, A.A.; Macosko, C.W. Graphene/Polymer Nanocomposites. Macromolecules 2010, 43, 6515–6530. [Google Scholar] [CrossRef]
  56. Bansal, S.A.; Singh, A.P.; Kumar, S. Synergistic effect of graphene and carbon nanotubes on mechanical and thermal performance of polystyrene. Mater. Res. Express 2018, 5, 075602. [Google Scholar] [CrossRef]
  57. Liu, Y.T.; Dang, M.; Xie, X.M.; Wang, Z.F.; Ye, X.Y. Synergistic effect of Cu2+-coordinated carbon nanotube/graphene network on the electrical and mechanical properties of polymer nanocomposites. J. Mater. Chem. 2011, 21, 18723–18729. [Google Scholar] [CrossRef]
Figure 1. Cryo-SEM images of composite samples filled with 5 wt% of carbon allotropes: fullerenes C60 (a,d), carbon nanotubes CNT (b,e), graphene (c,f) with different magnification.
Applsci 13 04022 g001
Figure 2. Flowchart of the experimental procedure.
Applsci 13 04022 g002
Figure 3. Stress–strain curves of composite samples with carbon nanofillers: PS + fullerenes (a), PS + CNT (b) and PS + graphene (c). Curves (1)–(4) correspond to filler concentrations of 0, 0.1, 0.5, and 5 wt%, respectively.
Applsci 13 04022 g003
Figure 4. Composite sample before (a) and after (b) three-point bending test.
Applsci 13 04022 g004
Figure 5. Frequency dependencies of the elastic modulus E (ac), loss modulus E (df) and mechanical loss tangent tan δ (gi) of PS-based composites filled with fullerenes C60 (a,d,g), carbon nanotubes CNT (b,e,h) and graphene Gr (c,f,i), obtained by DMA.
Applsci 13 04022 g005
Figure 6. Elastic moduli of PS-based composites filled with carbon allotropes at the concentration of 5 wt%. Moduli were obtained at four static and dynamic tests: tensile ( E b ), three-point bending ( E f ), DMA ( E D M A ), and ultrasonic ( E c ).
Applsci 13 04022 g006
Table 1. Linear elastic parameters of PS-based nanocomposites obtained from tensile and three-point bending tests.
SamplePS PurePS + C60PS + CNTPS + Graphene
0.1%0.5%5%0.1%0.5%5%0.1%0.5%5%
σ b , MPa 52 ± 5 49 ± 3 50 ± 4 46 ± 3 50 ± 3 48 ± 3 36 ± 3 49 ± 3 48 ± 3 48 ± 3
ϵ b , % 3.3 ± 0.5 4.5 ± 0.4 4.1 ± 0.4 2.5 ± 0.3 3.0 ± 0.3 2.1 ± 0.2 1.4 ± 0.2 4.6 ± 0.5 3.9 ± 0.4 2.7 ± 0.3
E b , GPa 2.5 ± 0.2 2.5 ± 0.2 2.6 ± 0.2 2.6 ± 0.2 2.6 ± 0.2 2.6 ± 0.2 2.7 ± 0.3 2.5 ± 0.2 2.6 ± 0.2 3.2 ± 0.2
σ f , MPa 80 ± 7 77 ± 4 79 ± 4 78 ± 4 81 ± 5 79 ± 4 82 ± 5 84 ± 5 84 ± 5 87 ± 4
ϵ f , % 2.0 ± 0.2 2.0 ± 0.2 2.0 ± 0.2 2.0 ± 0.2 2.0 ± 0.2 2.0 ± 0.2 2.0 ± 0.2 2.0 ± 0.2 2.0 ± 0.2 2.0 ± 0.2
E f , GPa 4.1 ± 0.4 4.2 ± 0.4 4.4 ± 0.4 4.4 ± 0.4 4.1 ± 0.4 4.1 ± 0.4 4.4 ± 0.4 4.1 ± 0.4 4.4 ± 0.4 4.9 ± 0.4
Table 2. Linear elastic moduli of PS-based nanocomposites obtained from ultrasonic measurements.
SamplePS PurePS + C60PS + CNTPS + Graphene
0.1%0.5%5%0.1%0.5%5%0.1%0.5%5%
λ , GPa ( ± 0.05 )2.32.32.292.282.292.422.712.292.482.58
μ , GPa ( ± 0.05 )1.41.421.41.411.41.451.51.41.461.68
E c , GPa ( ± 0.1 )5.15.145.15.15.15.35.75.15.45.94
Disclaimer/Publisher’s Note: The statements, opinions and data contained in all publications are solely those of the individual author(s) and contributor(s) and not of MDPI and/or the editor(s). MDPI and/or the editor(s) disclaim responsibility for any injury to people or property resulting from any ideas, methods, instructions or products referred to in the content.

