Article

Integrated Analysis of Polycyclic Aromatic Hydrocarbons and Polychlorinated Biphenyls: A Comparison of the Effectiveness of Selected Methods on Dried Fruit Matrices

by
Artur Ciemniak
,
Agata Witczak
* and
Kamila Pokorska-Niewiada
Department of Toxicology, Dairy Technology and Food Storage, Faculty of Food Sciences and Fisheries, West Pomeranian University of Technology, 70-310 Szczecin, Poland
*
Author to whom correspondence should be addressed.
Appl. Sci. 2023, 13(6), 4047; https://doi.org/10.3390/app13064047
Submission received: 27 February 2023 / Revised: 17 March 2023 / Accepted: 21 March 2023 / Published: 22 March 2023
(This article belongs to the Special Issue Toxicity of Chemicals: Evaluation, Analysis and Impact)

Abstract

:
Polycyclic aromatic hydrocarbons (PAHs) and polychlorinated biphenyls (PCBs) are groups of chemical substances commonly found in the environment. Because of large differences in the concentrations of PAHs and PCBs in the materials tested, separate analytical methods specific to each group of compounds are usually used. The aim of this study was to compare methods for the determination of PAHs and PCBs that permit the simultaneous determination of these compounds from one solvent extract. The analysis of the content of 15 PCB congeners and 16 PAHs was conducted using dried fruits. The analyses were performed with gas chromatography coupled with mass spectrometry. PAHs and PCBs were determined separately in each fruit sample using specific extraction and cleanup procedures for the respective groups of compounds. Analyses were also performed with two methods that permitted the simultaneous analysis of PAHs and PCBs in one solvent extract. The integrated methods did not provide adequate extract cleanup of interfering substances; consequently, the results of determinations of PAHs and PCBs using these methods were significantly different from the values obtained with proven determination methods for PAHs and PCBs.

1. Introduction

The presence of polycyclic aromatic hydrocarbons (PAHs) and polychlorinated biphenyls (PCBs) in foodstuffs raises concerns globally because they are toxic, carcinogenic, and tend to bioaccumulate in living organisms [1,2]. These compounds are classified as xenobiotics that have similar physicochemical properties, such as hydrophobicity, low degradability (especially PCBs), and lipophilicity.
According to the US Environmental Protection Agency (US EPA), 16 PAHs are classified as priority pollutants because of their prevalence and carcinogenicity [3]. In addition to carcinogens, such as benzo[a]pyrene (BaP), the EPA list includes the most common hydrocarbons, including naphthalene (Na). The EU 15 +1 PAH list was created in the European Union, and legislation focuses only on PAHs that are confirmed to be highly carcinogenic and mutagenic, regardless of their prevalence [4,5]. PAHs can damage DNA structures, cause chromosomal mutations, and increase the risk of childhood leukemia [6]. PAH content in unprocessed food derives mainly from environmental pollution, and their occurrence in fruits results from the deposition of PAH particles on plants and their absorption through the cuticle [7]. The result is the constant presence of these compounds in fruits and other edible parts of plants, which is a fundamental problem in many countries worldwide [8,9].
According to the EPA, PCBs can affect animal immune, reproductive, nervous, and endocrine systems. The regulation of all of these systems in the body is complex and interrelated. Non-dioxin-like PCBs (ndl-PCBs) can disrupt thyroid hormone homeostasis [10] and decrease total and free thyroxine (T4) concentrations [11,12,13]. There are two groups of PCB compounds, the first one includes 12 congeners with similar structures and toxicological profiles to tetrachloro-dibenzo-para-dioxins (TCDD), which are known as dioxin-like PCBs (dl-PCBs). Their effects are similar to those of dioxins, including carcinogenicity, immunotoxicity, and neurotoxicity. The second group includes congeners that do not have dioxin-like properties, but which exhibit other toxic properties (ndl-PCBs) [14]. Ndl-PCB congeners have neurotoxic effects that, inter alia, inhibit tyrosine hydroxylase, an enzyme necessary for the synthesis of the neurotransmitter dopamine, or that disrupt calcium homeostasis in the nervous system [15,16,17]. The widespread use of PCBs in industry, especially in electrical engineering, has resulted in their widespread occurrence in aquatic and terrestrial environments. In aquatic environments, PCBs accumulate in the bodies of fishes, crustaceans, and other animals, and their bioaccumulation coefficients range from several to tens of thousands [18]. Dl-PCBs are currently recognized as carcinogenic compounds [19]. Consequently, the tolerable weekly intake (TWI) value has been lowered significantly from 14 to 2 pg-TEQ/kg bw/week [2].
Qualitative and quantitative analyses of PCBs and PAHs require many stages of sample preparation, including extracting the compounds to be tested from the matrix (e.g., food) and cleanup with large amounts of toxic organic solvents [20,21]. Thus, a more ecological, economical approach would be to develop rapid analyses that permit the simultaneous determination of many different groups of compounds. The quantitative analysis of these compounds, however, is a difficult task, because they occur in very diverse concentrations, from very low for PCBs (ng·g−1) to relatively high for PAHs (µg·g−1), which can result in some compounds masking the presence of others [22].
PCBs and PAHs are mainly analyzed using methods such as gas chromatography (GC) and high-performance liquid chromatography (HPLC), which are most often coupled with mass spectrometry (MS) [9,23,24]. Preparing food samples for chromatographic analysis requires the following:
-
Solvent extraction using polar and non-polar solvents that are selected depending on the physicochemical properties of the compounds analyzed [25,26,27]. Various methods are used, including Soxhlet extraction, ultrasound-assisted extraction, microwave-assisted extraction (MAE), accelerated solvent extraction (ASE), and supercritical fluid extraction (SFE);
-
Sample cleanup to eliminate lipids, sulfur, and other interfering components that hinder analyses with methods such as solid phase extraction (SPE) with silica gel, alumina, Florisil, C18 phases, amine phase adsorbents, or gel chromatography (GPC).
Determinations of chlorinated hydrocarbons (including PCBs) often include extract cleanup with sulfuric acid at one of the stages [28,29], while for PAHs, saponification is applied using alcoholic solutions of potassium hydroxide or multi-stage liquid–liquid extraction, i.e., with cyclohexane–dimethylformamide–cyclohexane [30,31].
An integrated method would minimize not only analysis time and the use of toxic solvents, but also the risk of sample contamination.
This study attempted to develop a method for simultaneously preparing samples for qualitative and quantitative analyses of PCBs and PAHs based on the methods developed by Vives and Grimalt [32] and Jaouen-Madulet et al. [33]. An attempt was also made to assess the efficiency and effectiveness of integrated methods for the simultaneous determination of PCBs and PAHs from one solvent extract and to compare them to widely used specific determination methods for individual compounds.

2. Materials and Methods

2.1. Samples and Sample Preparation

The materials used in the study were dried apricots, pears, and apples, purchased at popular retail chains in Szczecin, Poland (Table 1). Dry matter was determined using the gravimetric method, and fat content was determined using the Soxhlet method. Lipid content was determined gravimetrically by evaporating a defined amount of the extract.

2.2. Chemicals

All chemicals (cyclohexane, n-hexane, dichloromethane, acetone, sulfuric acid, Florisil, and sodium sulfate anhydrous [Na2SO4]) were of analytical grade and were purchased from Scharlau, Fluka (Germany). Deionized water was prepared using an Easy Pure UV instrument (0.05 μS/cm; Barnstead™ GenPure™ Pro, Thermo Scientific, Dubuque, IA, USA).
The dried fruit material used to test the content of compounds with each method was homogenized and freeze-dried in a LYO LAB 3000 apparatus.
The following analytical standards were used for the analyses:
-
Deuterated PAHs standards (Semivolatile Internal Standard Mix) Sigma-Aldrich (Germany), naphthalene-D8 (NA D8), acenaphthene-D10 (AC D10), phenanthrene-D10 (PHE D10), chrysene-D12 (CHR D12), benzo[a]pyrene-D12 (BaP D12), and perylene-D12 (Per D12).
The standard mixture of 16 PAHs in methanol: methylene chloride (1:1) (EPA Method 610 PAH Mixture, Merc, USA) included acenaphthene (AC), acenaphthylene (ACL), anthracene (AN), benz[a]anthracene (BaA), benzo[b]fluoranthene (BbFA), benzo[k]fluoranthene (BkFA), benzo[ghi]perylene (BghiP), benzo[a]pyrene (BaP), chrysene (CHR), dibenz[a,h]anthracene (DBahA), fluoranthene (FL), fluorene (FA), indeno [1,2,3-cd]pyrene (IP), naphthalene (NA) phenanthrene (PHE), and pyrene (PY).
-
Pesticides Surrogate Spike Mix solutions in acetone (4-8460, SUPELCO, Bellefonte, USA) included 2,4,5,6-Tetrachloro-m-xylene and 2,2′,3,3′,4,4′,5, 5′,6,6′-PCB.
-
Standard solutions containing indicators of PCB congeners: PCB 28, PCB 52, PCB 101, PCB 138, PCB 153, PCB 180 (6 PCB–Key Isomers LGC Ltd., NE 5575, Augsburg, Taufkirchen, Germany);
dioxin-like PCBs: non-ortho PCBs (PCB 77, PCB 81, PCB 126, PCB 169) and mono-ortho PCBs (PCB 105, PCB 114, PCB 118, PCB 156, PCB 157) (CERTAN© NE 90152 LGC Ltd., Teddington, UK).

2.3. Extraction Procedures

The contents of selected PAHs and PCBs in dried fruit samples were analyzed using four methods, and 10 ± 0.5 g of dried fruit was collected for each method. Methods 1 and 2 were typical, specific analytical procedures used in determinations of both groups of these compounds. Methods 3 and 4 were used to determine both groups of these compounds from one solvent extract. The following criteria were important when selecting the methods used: determination speed of selected analytes; accuracy of determinations; and economical use of chemical reagents.

2.3.1. Method 1—Determination of Selected PCBs

Aliquots were extracted for 8 h in a Soxhlet apparatus using 120 cm3 of a 3:1 v/v hexane–acetone mixture. The extracts obtained were concentrated in a rotary vacuum evaporator to a volume of 2 cm3 and quantitatively transferred to glass test tubes with a capacity of 10 cm3 using n-hexane. The excess solvent was evaporated in a stream of inert gas (N2) to a volume of 2 cm3, and the cleanup of the concentrated extracts was performed by adding oleum (7% SO3 in concentrated H2SO4). After mixing and separating the layers, the upper layer with n-hexane and dissolved PCB compounds was collected using Pasteur pipettes and placed into new 10 cm3 tubes, cleaned of acid residues by washing three times with deionized water, and dried on an anhydrous Na2SO4 bed (1 g).

2.3.2. Method 2—Determination of Selected PAHs

The aliquots were prepared, and 50 μL of PAH Semivolatile Internal Standard Mix was added to them. Then, the fat contained in the samples was saponified using 100 cm3 of a 2 mol/dm3 KOH in water/methanol solution (9:1 v/v). The samples were extracted in a Soxhlet extractor for 6 h. After the process was completed, the extracts were cooled to about 40 °C and transferred to separatory funnels with capacities of 500 cm3, and 150 cm3 of deionized water was added to these alkaline mixtures. Then, the PAH fractions were extracted with three portions of n-hexane (50, 30, 20 cm3). The extracts were combined and again cleaned of residual potassium hydroxide (KOH), methanol, and hydrolysis products by shaking three times with 100 cm3 of deionized water. If an emulsion formed, which was a common occurrence, 10 cm3 of a saturated NaCl solution was added. In the next step, residual water was removed by applying the mixture to a layer of anhydrous sodium sulfate. The extracts were concentrated in a vacuum evaporator to a volume of 2 cm3, followed by the SPE method. The column packing material was Florisil (1 g) roasted at 350 °C and then deactivated with a 2% addition of H2O. The columns were conditioned by washing them with 6 cm3 dichloromethane and then washing them twice with 6 cm3 n-hexane. The test sample was transferred quantitatively to the prepared bed with 2 cm3 n-hexane. The columns were washed with 10 cm3 n-hexane, and the fractions containing PAH were eluted with 9 cm3 of a 3:1 v/v n-hexane-dichloromethane mixture.

2.3.3. Method 3—Simultaneous Determinations of PCBs and PAHs, According to Vives and Grimalt [32]

The samples were extracted in a Soxhlet apparatus for 4 h with 150 cm3 n-hexane (Figure 1). The extracts were concentrated in a rotary vacuum evaporator to a volume of 2 cm3 and quantitatively transferred to 10 cm3 tubes using 2 cm3 isooctane. Then, the solvent was evaporated in a stream of inert gas (N2) to a volume of 1 cm3. The cleanup and fractionation of the extracts was performed with SPE columns filled with 5 g of alumina (Al2O3-activated at 120 °C). The first fraction was eluted with a 16.5 cm3 n-hexane-dichloromethane mixture at a ratio of 19:1 v/v and then with a 3 cm3 n-hexane-dichloromethane mixture at a ratio of 1:2 v/v. The second fraction was eluted with 13 cm3 n-hexane-dichloromethane 1:2 v/v. In the first fraction, organochlorine compounds, including PCBs, HCB (hexachlorobenzene), and DDT (dichlorodiphenyltrichloroethane), were collected, while in the second, PAHs and HCH (hexachlorocyclohexane) were collected. The cleanup procedure for the fractions used oleum (PCBs) and columns packed with Florisil (PAHs).

2.3.4. Method 4—Simultaneous Determinations of PCBs and PAHs According to Jaouen-Madulet et al. [33]

The fruit samples were extracted in a Soxhlet extractor using 50 cm3 of a 4:1 v/v n-hexane and acetone mixture. The cleanup and fractionation of the extracts obtained were performed with SPE dual-layer columns with alumina (5 g) and silica gel (5 g) that were roasted at 400 °C and then deactivated with 5% H2O (Figure 1). The columns were conditioned by washing them with 20 cm3 n-pentane. The prepared extract was then transferred quantitatively to a bed with n-hexane. The first fraction containing PCBs was eluted with 40 cm3 n-pentane. The second fraction containing PAHs was eluted with 20 cm3 of a 10:90 v/v dichloromethane-n-pentane mixture, followed by a 20:80 v/v dichloromethane-n-pentane mixture.
All extracts obtained with all four methods were concentrated in streams of inert gas (N2) to a volume of 1 cm3.

2.4. GC-MS Analysis

The dried fruit samples were analyzed with gas chromatography coupled with mass spectrometry in a Agilent/HP 6890 GC with 5973 MSD (Palo Alto, CA, USA) in selected ion monitoring (SIM) mode. The chromatographic separation parameters are presented in Table 2.
The parameters of SIM mode determined for indicator PCB congeners and non- and mono-ortho PCBs were as follows: PCB 28—256/258 (molecular ion/confirmation ions), 186; PCB 52—256/290, 220; PCB 77—292/290, 220; PCB 81—292/290, 220; PCB 101—326/254, 328; PCB 105—326/328, 254; PCB 114—326/328, 254; PCB 118—326/328, 254; PCB 126—326/254; PCB 138—360/362, 290; PCB 153—360/290; PCB 156—360/290; PCB 157—360/290; PCB 169—360/362, 290; and PCB 180—394/396, 324.
The parameters of SIM mode during PAH analysis were as follows: NA—128/126,102 (molecular ion/confirmation ions); ACL—152/151, 153; AC—154/153, 152; FA—166/165, 167; PHE—178/179, 176; AN—178/179, 176; FL—202/101, 203; PY—202/200, 203; BaA—228/229, 226; CHR—228/229, 226; BbF—252/253, 126; BkF—252/253, 126; BaP—252/253, 126; IP—276/138, 277; DBahA—278/139, 279; BghiP—276/138, 277; naphthalene D8—136/68, 137; acenaphthene D10—164/162, 165; phenanthrene D10—188/94, 189; chrysene D12—240/120, 241; benzo[a]pyrene D12—264/132, 265; and perylene D12—264/260, 265.

2.5. Analytical Method Validation for Quality Assurance

All quantifications were performed using external calibration curves. For PAH quantification, a series of solutions was prepared with the EPA 610 PAH Mix (Sigma-Aldrich, Germany). The accuracy of the analyses was verified using the internal standard method with standard solutions of deuterated aromatic hydrocarbons (Semivolatile Internal Standard Mix) [30].
The accuracy of the PCB analyses was verified by adding an internal standard using Pesticides Surrogate Spike, which is an acetone solution of decachlorobiphenyl and 2,4,5,6-tetrachloro-m-xylene. To correctly identify the PCB congeners tested, some of the samples were fortified with standard solutions of seven indicator congeners (NEN 0813) and eight toxic congeners (PCB Mix-8). A 300 μL mixture of both standard solutions, in which the concentration of each congener was 160 μg·dm−3, was added to the samples.
Standard solutions of PAHs and PCBs were also fractionated. Each of the columns prepared for methods 3 and 4 was loaded with 1 cm3 of the solutions, containing 16 PAH at 40 μg·dm−3 each and 15 PCB at 16 μg·dm−3 each.
The limit of detection (LOD) for each compound was determined as the concentration in the extract that produced an instrumental response at two different ions to be monitored, with a signal to noise ratio of 3:1 for the less sensitive signal [34]. A blank method was included for every 10 samples. The LOQ was estimated as 10 times the standard deviation of 10 independent blank measurements (Table 3).
Statistical analysis was performed with Statistica 13.3. The results are presented as arithmetic means. One-way ANOVA (Tukey’s test; p < 0.05) was used to analyze the significance of the differences.

3. Results

The PCB and PAH contents of dried fruit were determined using four methods. Methods 1 and 2 (Figure 2) permitted determinations of PCBs (method 1) and PAHs (method 2) separately, while integrated methods 3 and 4 permitted determinations of PAHs and PCBs from single solvent extracts.
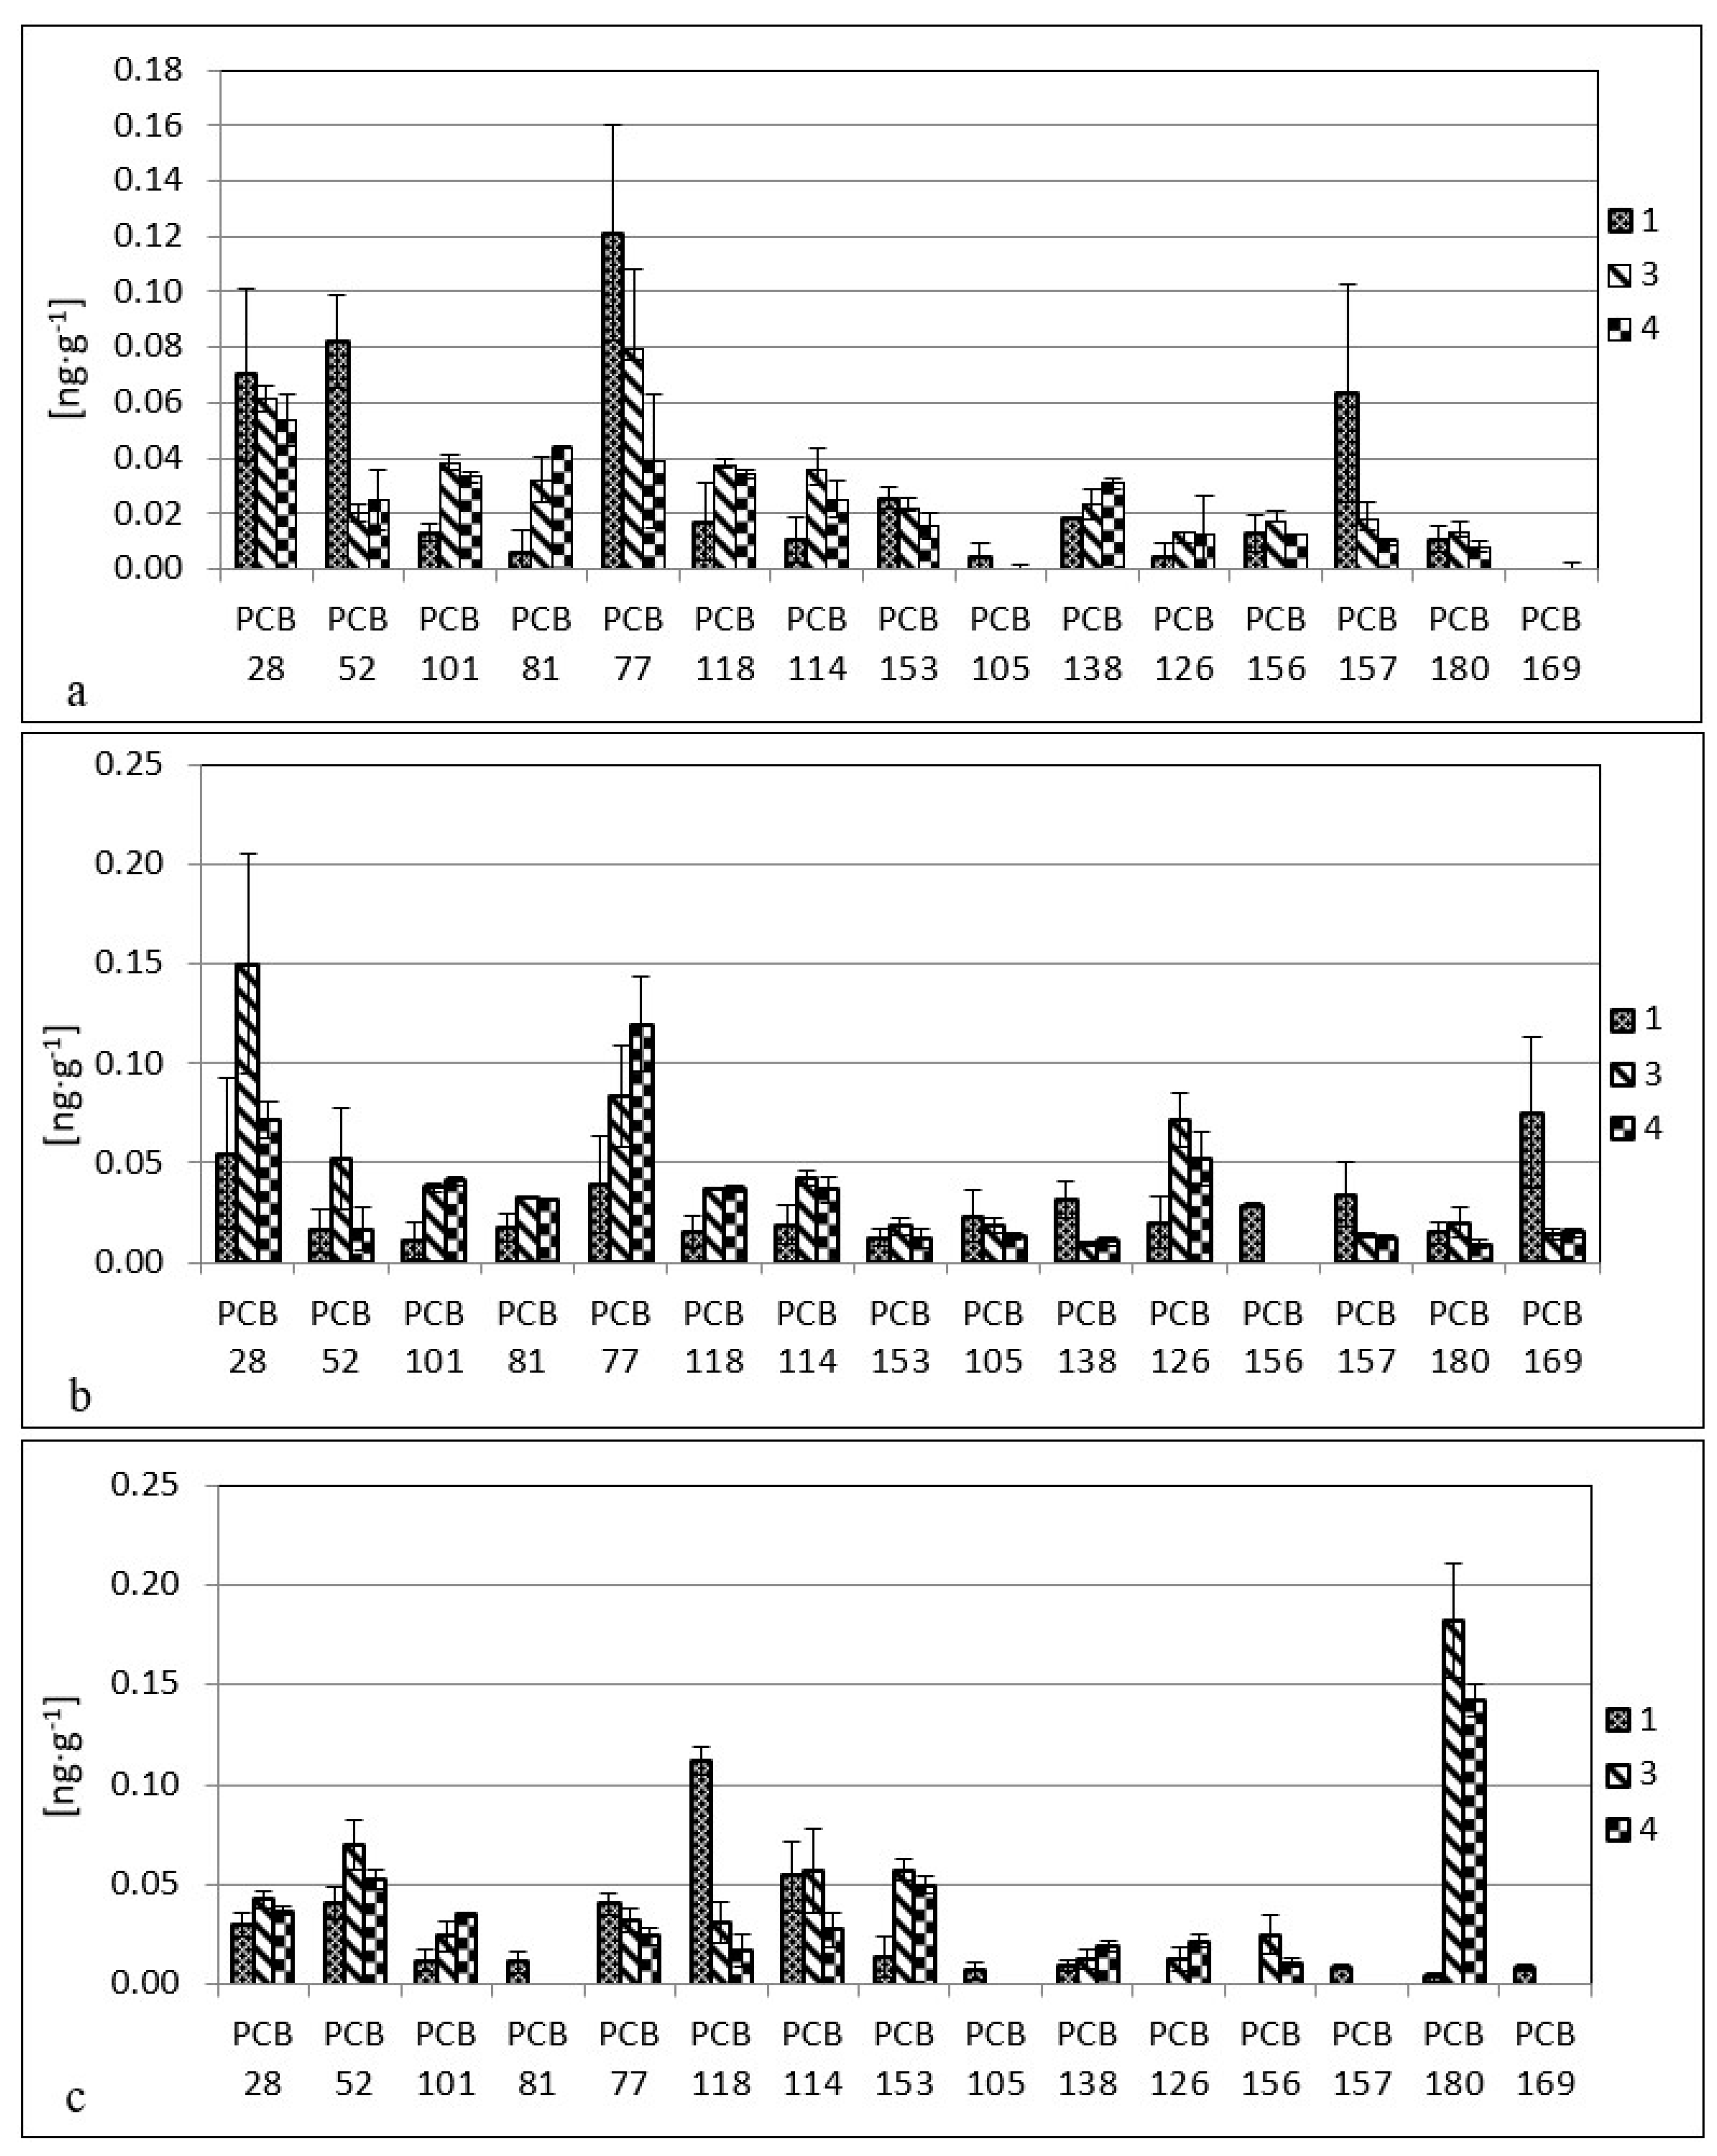
The values of PCB congeners in the material tested with methods 3 and 4 were significantly different from those obtained with method 1 (Figure 2, Table 4).
With the standard method of PCB content determination, congeners 126, 169, and 156 were not detected in the fruits, and the highest content was of PCB 77 at 0.121 ng·g−1 dw (apricot).
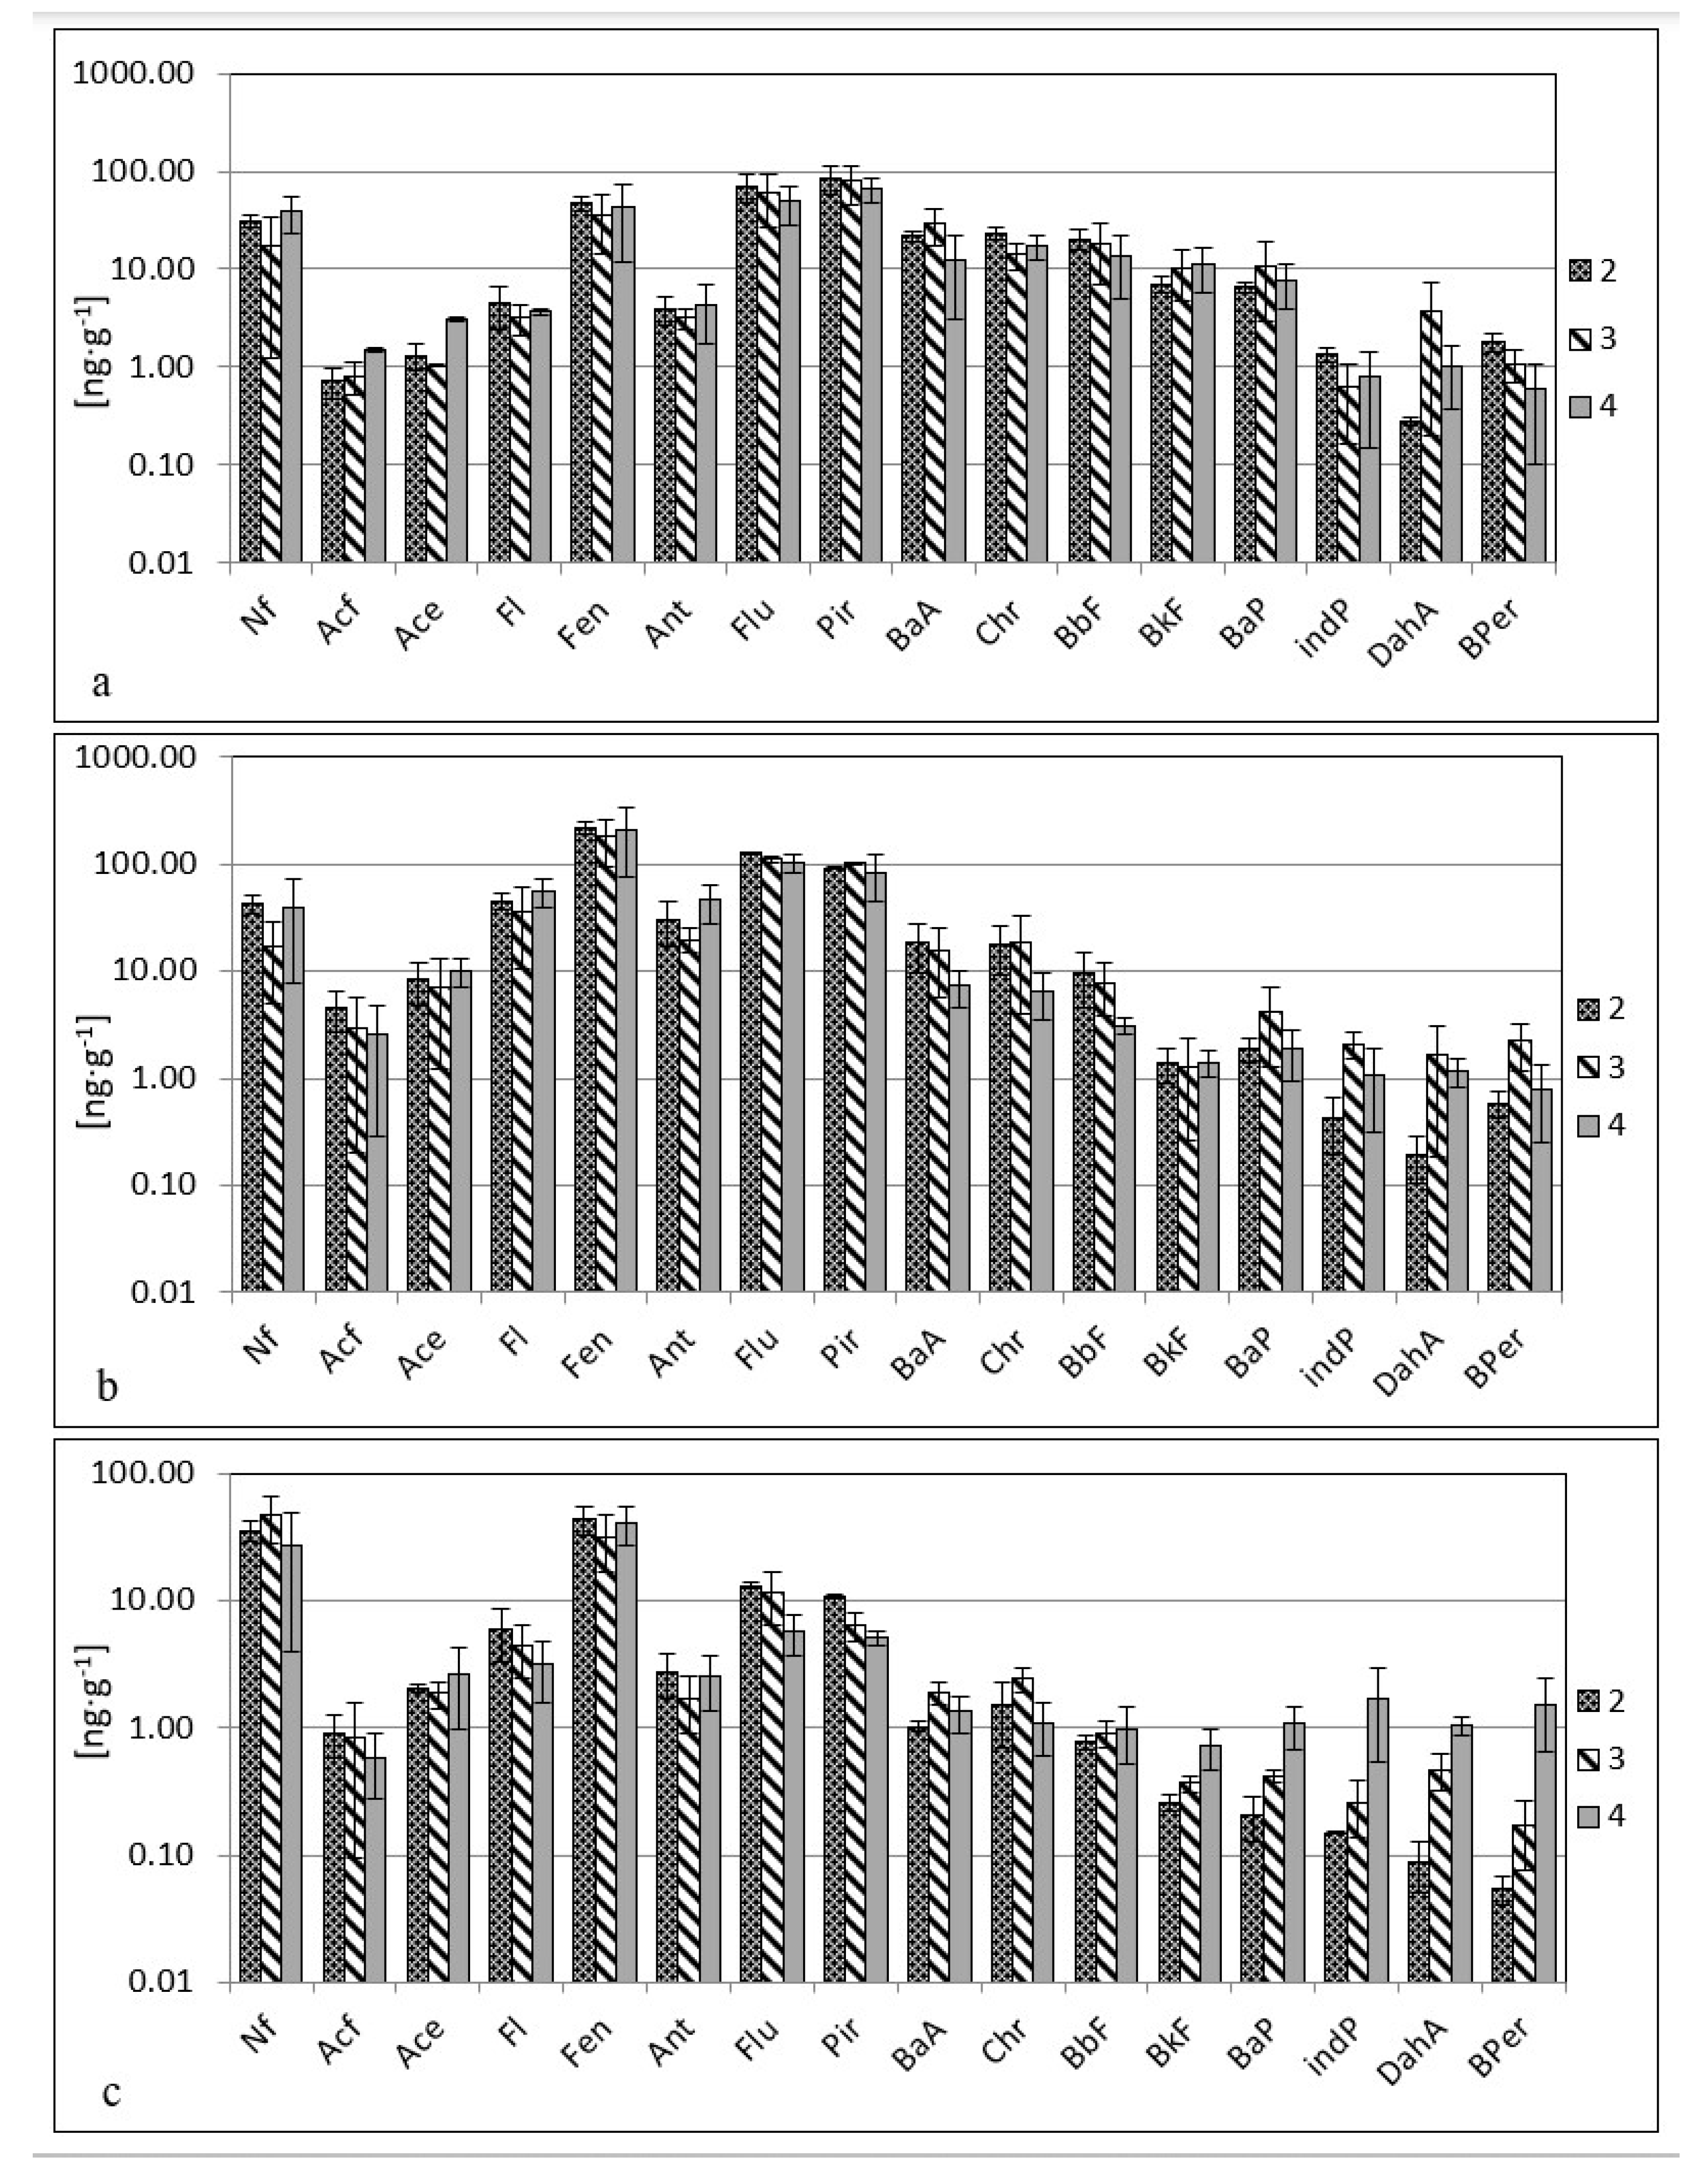
The amounts of PAH compounds determined with the standard method ranged from 0.05 ng·g−1 dw (benzo[g,h,i]terylene in apple) to 222.6 ng·g−1 dw (phenanthrene in pear).
The analysis of PCB content using method 3 [32] did not determine the presence of congeners 105, 169, 81, 156, or 157. The highest value was for PCB 28 at 0.150 ng·g−1 dw in pear. PAH content was determined with the same method and ranged from 0.17 ng·g−1 dw (benzo[ghi]perylene in apple) to 179.70 ng·g−1 dwng/g dm (phenanthrene in pear).
Method 4, developed by Jaouen-Madulet et al. [33], indicated that PCBs 105, 169, 81, 156, or 157 were not determined. The highest value determined was that of PCB 180 at 0.14 ng·g−1 dw (apple). Determinations of PAHs indicated that the lowest content was noted for dibenzo[a,h]anthracene at 0.24 ng·g−1 dw (apple), while the highest was for pyrene at 464.12 ng·g−1 dw (apple).
A significant difference (p < 0.05) was noted for PCB congener 180 in dried apple. Values obtained with methods 3 and 4 were 54 and 42 times higher, respectively, than the value obtained with method 1. Additionally, in contrast to method 1, some PCB congeners (in apple—PCBs 81, 105, 157; in apricot—PCB 105; in pear—PCB 165) were not determined with methods 3 or 4. However, PCB congeners 126 and 156 were determined in dried apple, but were not determined with method 1, which is used specifically for determinations of PCBs (<LOD). A very low, unacceptable recovery value was noted for PCB congener 169 (Table 4).
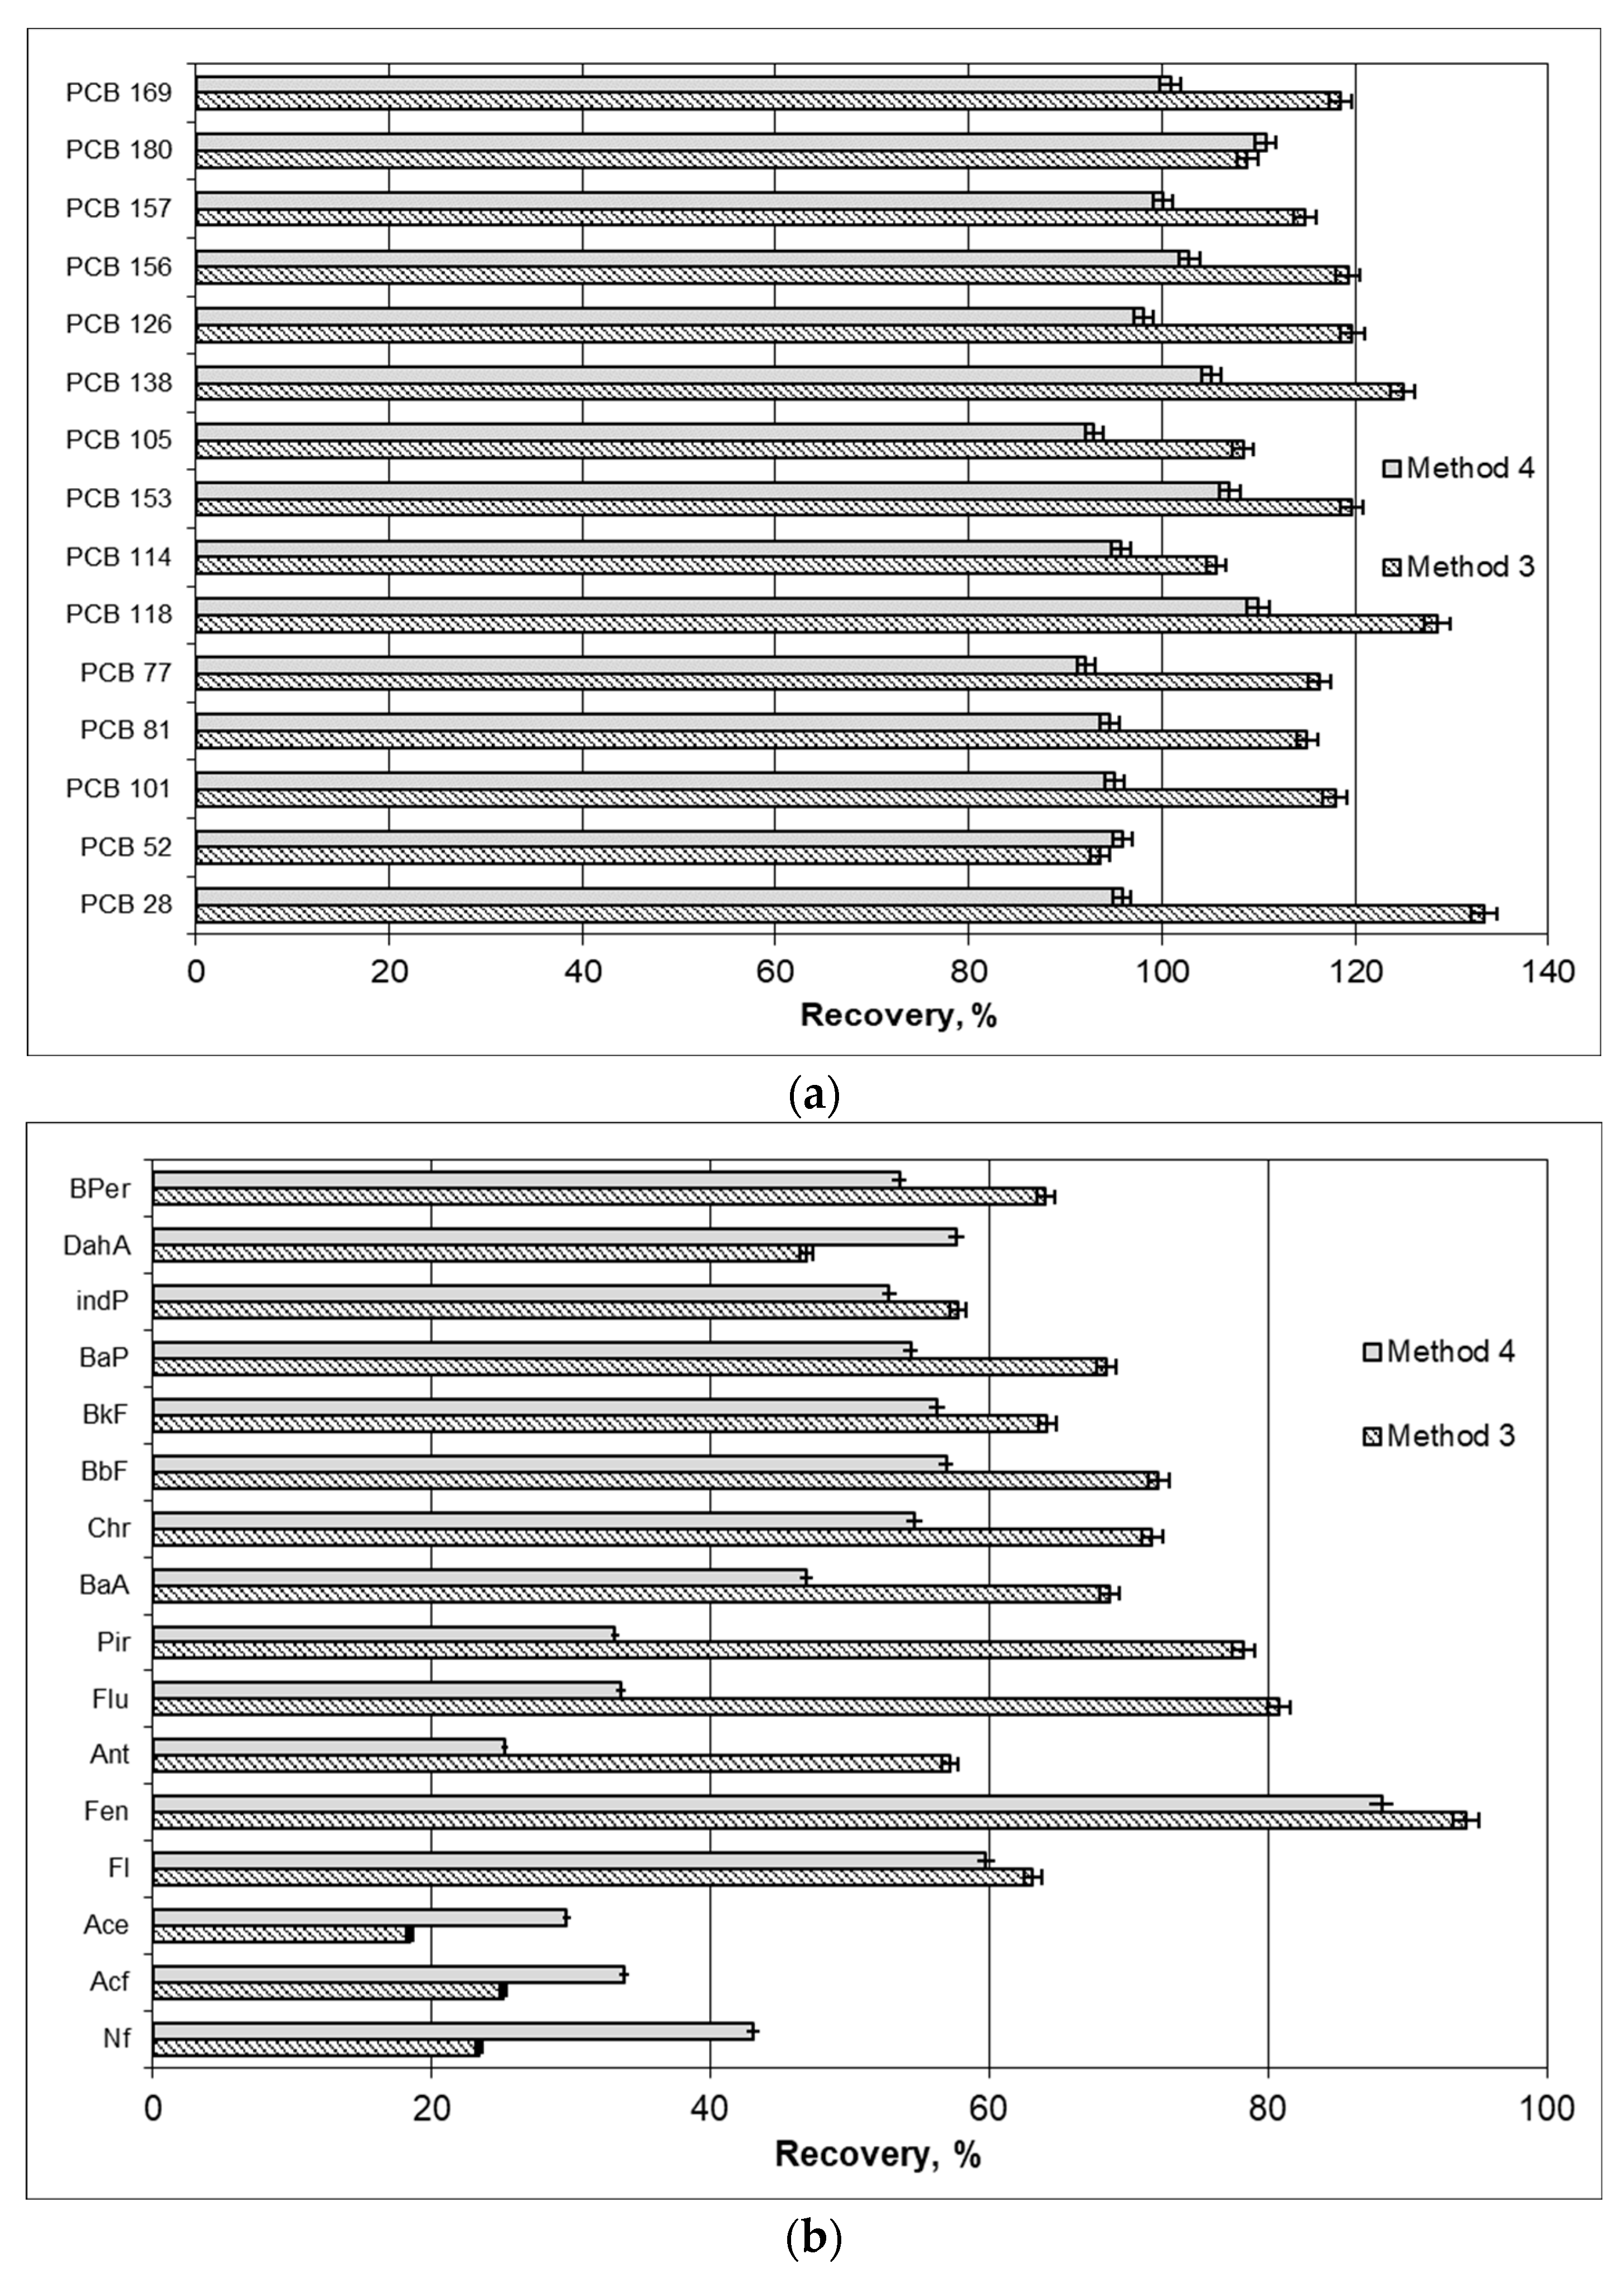
In the current study, the model experiment conducted using standard solutions (Figure 3) indicated that methods 3 [32] and 4 [33] provided higher recovery values for all the PCB congeners analyzed, as well as for light PAHs, than did the specific methods for the two groups of these compounds. Particularly, large differences in PAH recoveries were observed for fluorene and phenanthrene. Recovery with method 3 was 93.6–133.4% for PCBs and 18.4–94.2% for PAHs.
As with PCBs, the values of all 16 PAHs determined with methods 2, 3, and 4 differed depending on the method. Differences among results obtained with method 2 and methods 3 and 4 revealed that, especially with heavy PAHs, their contents were overestimated (Figure 4, Table 4). The contents of BaP determined with methods 3 and 4 were three and five times higher than that determined with method 2.

4. Discussion

Vives and Grimalt [32] developed a method for integrated determinations of PAHs, PCBs, and organochlorine pesticides in fish livers using SPE columns with alumina. The two fractions obtained are eluted with n-hexane/dichloromethane. The first extract is used for determinations of PCBs, HCB, and DDTs, while the second is used for determinations of PAHs and HCHs. The authors report that extraction in a Soxhlet extractor permitted obtaining greater analyte recovery than did saponification in an NaOH solution. The disadvantageous effects of saponification were particularly notable for chlorinated hydrocarbons, especially since the complete decomposition of HCH and pp’-DDT (dichlorodiphenyltrichloroethane) occurred, rendering their analysis impossible. A similar method of extract fractionation is proposed by Jaouen-Madoulet et al. [33]. Alumina and silica gel are used as the adsorbents. Individual fractions are eluted with n-pentane and a n-pentane and dichloromethane mixture. The method is used to determine PAHs and organochlorine compounds in mussels, cod liver oil, and benthic sediments. These authors, similarly to Vives and Grimalt [32], also pointed out that the procedure of analyte extraction based on saponification in an ethanolic KOH solution requires additional stages of extract cleanup due to saponification residues and results in a lower recovery values than the procedure using Soxhlet extraction. Two fractions are obtained: one containing aliphatic hydrocarbons and PCBs, and one with PAHs. Compared to the method described by Vives and Grimalt [32], this procedure requires using more solvents.
Simultaneous determinations of PAHs and PCBs in foodstuffs poses a high degree of difficulty due to the complexity of food matrices and the presence of organochlorine compounds in very low concentrations, with relatively high PAH contents. The matrix contains all the components in the sample, not just the analytes of interest. Sample extracts with high levels of organic matter, including lipids, organic acids, etc., contain substances that are co-extracted and deposited on the chromatographic column, reducing separation efficiency and interfering with the analytical method [35,36]. The matrix effect is influenced by the presence of interferences that coelute with analytes present in low concentrations [37,38]. Therefore, interference from the matrix may affect the accuracy of the analytical method. Their elimination before the final determination stage is crucial for the quality of the analysis. Therefore, it is important to use procedures to minimize the matrix effects, e.g., internal standards and the implementation of new methods of purifying the extracts. The analytical procedure that consists of the selective isolation of analytes, cleanup, and extract fractionation and quantification must also be adapted to the physicochemical properties of the compounds tested. In most studies, the contents of PAHs and organochlorine compounds in fruits are analyzed with separate methods specific to each group [20,21,39]. Relatively few researchers are currently working on developing an integrated method to analyze all of these compounds (Table 5). The methods proposed differ significantly in terms of complexity, the numbers of stages, and the sorbents used. Some commonly applied methods use, for example, Soxhlet apparatuses and sorbents that have been in use for many years [40], while others use modern sorbents and apparatuses [41,42,43]. Among the modern methods, zirconium oxide-based sorbents, in particular, are used instead of PSA/C18 in QuEChERS cleanup, and they ensure a lower background and higher recovery of some compounds [44,45].
Vives and Grimalt [32] reported that the PAH recovery range was 71–130%. In the current experiment, the PCB recovery range using standard solutions was 100.4–128.5%, which was higher at 79–110% than the values reported by Vives and Grimalt [32].
With method 4, the PAH recovery range reported by Jaouen-Madoulet et al. [33] was 52.8–101.4%, which was higher than the range of 30–80% obtained in the current study by using solutions. The PCB recovery range was very similar to that reported by the authors of method 4. The range was 92.17–124.9%, which was similar to that of 92.6–102.6% reported by Jaouen-Madoulet et al. [33]. Additionally, the recovery ranges for individual PAHs, regardless of the analytical method used, fluctuated more than those of the individual PCB congeners.
Additionally, inter alia, significantly elevated concentrations of heavy PAHs were noted (Figure 4). Primarily, method 2 more effectively removed impurities thanks to extraction combined with lipid alkaline hydrolysis using a methanolic KOH solution. The reasons for these discrepancies, both in the case of PAHs and PCBs, should be sought by evaluating the interference between the analyte and the compounds that were not removed during extract preparation in methods 3 and 4, i.e., fatty acids that passed into the extract. The sorbents used in this study were insufficient for simultaneously isolating PCBs and PAHs from complex organic matrices, which resulted, among other things, in overestimating the concentrations of some analytes. Effectively purifying extracts is possible using of modern sorbents. For example, it has been shown that PSA sorbents permit the removal of all polar organic acids, polar pigments, sugars and fatty acids from extracts [46], while C18 permits the elimination of non-polar interfering substances, such as lipids (Table 5).

5. Conclusions

Determinations of PCB and PAH contents requires tedious analytical procedures. To facilitate the analyses of both groups of compounds, procedures for simultaneously preparing samples and their subsequent separation into fractions containing PCBs and PAHs are being developed.
This study compared the effectiveness of sample cleanup methods proposed by Vives and Grimalt [32] and Jaouen-Madulet et al. [33] by comparing the recoveries of the compounds analyzed in dried fruit. The PCB and PAH contents obtained using the integrated determination methods were significantly different from those obtained using the specific methods for each of the groups of compounds. The integrated methods did not provide adequate extract cleanup. The extract fractionation step on alumina columns in method 3 [32] and alumina and silica gel columns in method 4 [33] were insufficient for removing compounds that interfered with the final detections. As with PCBs, the PAH contents obtained in the material tested differed depending on the methods applied.
Based on the literature, it is apparent that integrated methods for determinations of PCBs and PAHs from one solvent extract (methods 3 and 4) are less labor intensive and less time consuming, and they utilize smaller quantities of reagents. However, because the differences in individual PCB congener recoveries using methods 3 and 4 were too high compared to those in method 1, neither of these methods was accurate in testing fruit matrices, and thus, they are unsuitable for quantitative determinations of PCBs in food. The determinations of individual PAHs in methods 3 and 4 and the specific analytical method for PAHs (method 2) were consistent for light PAHs, but determinations of heavy PAHs with a higher molecular weight were overestimated in methods 3 and 4. In reference to the results of the study, sample cleanup with integrated methods 3 and 4 was satisfactory only when standard solutions were used in the model experiment. The reasons for these differences should be sought in the insufficient removal of interfering substances, mainly lipids, that were also extracted. Therefore, it is necessary to further optimize these methods or to use other sorbents.
The advantage of these methods is the possibility of performing simultaneous determinations of PCBs and PAHs, which are less labor intensive, save time, and utilize fewer reagents. However, because of inconsistent results, it is necessary to further optimize the extraction and purification stages of these methods, especially when they are applied to materials with higher fat contents.

Author Contributions

Conceptualization, A.C. and A.W.; methodology, A.C. and A.W.; validation, A.C., A.W. and K.P.-N.; investigations, A.C. and A.W.; original draft and manuscript preparation, A.C., A.W. and K.P.-N. All authors have read and agreed to the published version of the manuscript.

Funding

This research received no external funding.

Institutional Review Board Statement

Not applicable.

Informed Consent Statement

Not applicable.

Data Availability Statement

The data presented in this study are available upon request from the corresponding author.

Conflicts of Interest

The authors declare no conflict of interest.

References

  1. Snedeker, S.M. Pesticides and breast cancer risk: A review of DDT, DDE and dieldrin. Environ. Health Perspect. 2001, 109, 35–47. [Google Scholar] [CrossRef] [PubMed]
  2. European Food Safety Authority. Risk for animal and human health related to the presence of dioxins and dioxin-like PCBs in feed and food. EFSA J. 2018, 16, 5333. [Google Scholar]
  3. U.S. Environmental Protection Agency Compendium Method TO-13A. Determination of Polycyclic Aromatic Hydrocarbons (PAHs) in Ambient Air Using Gas Chromatography/Mass Spectrometry (GC/MS). Compendium of Methods for the Determination of Toxic Organic Compounds in Ambient Air. EPA/625/R-96/010b; EPA, Center for Environmental Research Information: Washington, DC, USA, 1999. Available online: https://www3.epa.gov/ttnamti1/files/ambient/airtox/to-13arr.pdf (accessed on 19 July 2022).
  4. Food and Agriculture Organization of the United Nations; World Health Organization. JECFA 2005, Joint FAO/WHO. In Proceedings of the Summary and Conclusions of Sixty-Fourth Meeting, Expert Committee on Food Additives (JECFA), Rome, Italy, 8–17 February 2005; Available online: https://www.fao.org/3/at877e/at877e.pdf (accessed on 10 July 2022).
  5. European Commission. Commission Regulation (EU) No 835/2011 of 19 August 2011 amending Regulation (EC) No 1881/2006 as regards maximum levels for polycyclic aromatic hydrocarbons in foodstuffs. Off. J. Eur. Union 2011, 215, 4–8. [Google Scholar]
  6. IARC Working Group on the Evaluation of Carcinogenic Risks to Humans. Some non-heterocyclic polycyclic aromatic hydro-carbons and some related exposures. In IARC Monographs on the Evaluation of Carcinogenic Risks to Humans. Int. Agency Res. Cancer 2010, 92, 868. Available online: https://www.ncbi.nlm.nih.gov/books/NBK321712/ (accessed on 14 August 2022).
  7. Ciemniak, A.; Witczak, A.; Mocek, K. Assessment of honey contamination with polycyclic aromatic hydrocarbons. J. Environ. Sci. Health B 2013, 48, 993–998. [Google Scholar] [CrossRef] [PubMed]
  8. Jánska, M.; Hajšlová, J.; Tomaniová, M.; Kocourek, V.; Vávrová, M. Polycyclic aromatic hydrocarbons in fruits and vegetables grown in the Czech republic. Bull. Environ. Contam. Toxicol. 2006, 77, 492–499. [Google Scholar] [CrossRef]
  9. Paris, A.; Ledauphin, J.; Poinot, P.; Gaillard, J.L. Polycyclic aromatic hydrocarbons in fruits and vegetables: Origin, analysis, and occurrence. Environ. Pollut. 2018, 234, 96–106. [Google Scholar] [CrossRef] [PubMed]
  10. Murk, A.J.; Rijntjes, E.; Blaauboer, B.J.; Clewell, R.; Crofton, K.M.; Dingemans, M.M.L.; Furlow, J.D.; Kavlock, R.; Köhrle, J.; Opitz, R.; et al. Mechanism-based testing strategy using in vitro approaches for identification of thyroid hormone disrupting chemicals. Toxicol. Vitr. 2013, 27, 1320–1346. [Google Scholar] [CrossRef]
  11. Blanco, L.; Martínez, A.; Ferreira, M.; Juan Vieites, J.; Cabado, A. Polychlorinated dibenzo-p-dioxins and dibenzofurans (PCDD/Fs) and dioxin-like polychlorinated biphenyls (dl-PCBs) in fish, seafood products and fish oil in Spain. Food Addit. Contam. Part B 2013, 6, 218–230. [Google Scholar] [CrossRef]
  12. Liu, W.; Tao, F.; Zhang, W.; Li, S.; Zheng, M.; Zheng, M.H. Contamination and emission factors of PCDD/Fs, unintentional PCBs, HxCBz, PeCBz and polychlorophenols in chloranil in China. Chemosphere 2012, 86, 248–251. [Google Scholar] [CrossRef]
  13. Richardson, K.L.; Lopez Castro, M.; Gardner, S.C.; Schlenk, D. Polychlorinated Biphenyls and Biotransformation Enzymes in Three Species of Sea Turtles from the Baja California Peninsula of Mexico. Arch. Environ. Contam. Toxicol. 2010, 58, 183–193. [Google Scholar] [CrossRef] [PubMed] [Green Version]
  14. Holland, E.B.; Pessah, I.N. Non-dioxin-like polychlorinated biphenyl neurotoxic equivalents found in environmental and human samples. Regul. Toxicol. Pharmacol. 2021, 120, 104842. [Google Scholar] [CrossRef] [PubMed]
  15. Langeveld, W.T.; Meijer, M.; Westerink, R.H. Differential effects of 20 non-dioxin-like PCBs on basal and depolarization-evoked intracellular calcium levels in PC12 cells. Toxicol. Sci. 2012, 126, 487–496. [Google Scholar] [CrossRef] [PubMed] [Green Version]
  16. Dai, Q.; Min, X.; Weng, M. A review of polychlorinated biphenyls (PCBs)pollution in indoor air environment. J. Air Waste Manag. Assoc. 2016, 66, 941–950. [Google Scholar] [CrossRef] [PubMed] [Green Version]
  17. Faroon, O.; Ruiz, P. Polychlorinated biphenyls: New evidence from the last decade. Toxicol. Ind. Health 2016, 32, 1825–1847. [Google Scholar] [CrossRef] [PubMed]
  18. Harvey, J.; Harwell, L.; Summers, J.K. Contaminant concentrations in whole-body fish and shellfish from US estuaries. Environ. Monit. Assess. 2008, 137, 403–412. [Google Scholar] [CrossRef]
  19. IARC/WHO. Polychlorinated biphenyls and polybrominated biphenyls. Monographs on the evaluation of carcinogenic risk to humans. Lyon, France. Int. Agency Res. Cancer 2016, 107, 1–124. [Google Scholar]
  20. Adekunle, A.S.; Adekunle, J.; Oyekunle, O.; Ola, I.J.; Obisesan, O.R.; Maxakato, N.W. Determination of polycyclic aromatic hydrocarbons (PAHs) and organochlorine pesticides (OCPs) in some personal care products in Nigeria. [published correction appears in Toxicol. Rep. 2020,5, 60–61]. Toxicol. Rep. 2018, 5, 994–1001. [Google Scholar] [CrossRef]
  21. Taghizadeh, S.F.; Azizi, M.; Rezaee, R.; Giesy, J.P.; Karimi, G. Polycyclic aromatic hydrocarbons, pesticides, and metals in olive: Analysis and probabilistic risk assessment. Environ. Sci. Pollut. Res. 2021, 28, 39723–39741. [Google Scholar] [CrossRef]
  22. Wolska, L. Miniaturised analytical procedure of determining polycyclic aromatic hydrocarbons and polychlorinated biphenyls in bottom sediments. J. Chromatogr. A 2002, 959, 176. [Google Scholar] [CrossRef]
  23. Tarawneh, I.; Alawi, M.; Sapah, R.; Abu Shmeis, R. Pesticide Residues in Commonly Consumed Fruits and Vegetables in Jordan and Their Associated Health Risk Assessments. Jordan J. Chem. 2019, 14, 69–80. [Google Scholar]
  24. Kumari, D.; John, S. Health Risk Assessment of Pesticide Residues in Fruits and Vegetables from Farms and Markets of Western Indian Himalayan Region. Chemosphere 2019, 224, 136–167. [Google Scholar] [CrossRef] [PubMed]
  25. Thompson, S.; Budzinski, H.; LeMenach, K.; Letellier, M.; Garrigues, P. Multi-residue analysis of polycyclic aromatic hydrocarbons polychlorobiphenyls, and organochlorine pesticides in marine sediments. Anal. Bioanal. Chem. 2002, 372, 196–204. [Google Scholar] [CrossRef] [PubMed]
  26. Liljelind, P.; Söderström, G.; Hedman, B.; Karlsson, S.; Lundin, L.; Marklund, S. Method for Multiresidue Determination of Halogenated Aromatics and PAHs in Combustion-Related Samples. Environ. Sci. Technol. 2003, 37, 3680–3686. [Google Scholar] [CrossRef]
  27. Sharma, S.; Chandra, P.; Mishra, C.; Kakkar, P. Microbiological Quality and Organochlorine Pesticide Residue in Commercially Available Ready-To-Eat Raisins. Bull. Environ. Contam. Toxicol. 2008, 81, 388–390. [Google Scholar] [CrossRef] [PubMed]
  28. Reddy, A.V.B.; Moniruzzaman, M.; Aminabhavi, T.M. Polychlorinated biphenyls (PCBs) in the environment: Recent updates on sampling, pretreatment, cleanup technologies and their analysis. Chem. Eng. J. 2018, 358, 1186–1207. [Google Scholar] [CrossRef]
  29. Witczak, A.; Harada, D.; Aftyka, A.; Cybulski, J. Endocrine-disrupting organochlorine xenobiotics in fish products imported from Asia—An assessment of human health risk. Environ. Monit. Assess. 2021, 193, 1–15. [Google Scholar] [CrossRef]
  30. Kuźmicz, K.; Ciemniak, A. Assessing contamination of smoked sprats (Sprattus sprattus) with polycyclic aromatic hydrocarbons (PAHs) and changes in its level during storage in various types of packaging. J. Environ. Sci. Health Part B 2018, 1, 1369306. [Google Scholar] [CrossRef]
  31. Ciemniak, A.; Kuźmicz, K. Effect of a packaging material type on PAHs contents in oils and water. J. Stored Prod. Res. 2021, 92, 101810. [Google Scholar] [CrossRef]
  32. Vives, I.; Grimalt, J.O. Method for integrated analysis of polycyclic aromatic hydrocarbons and organochlorine compounds in fish liver. J. Chromatogr. B 2002, 768, 248–254. [Google Scholar] [CrossRef]
  33. Jaouen-Madoulet, A.; Abarnou, A.; Le Guellec, A.-M.; Loizeau, V.; Leboulenger, F. Validation of an analytical procedure for polychlorinated biphenyls, coplanar polychlorinated biphenyls and polycyclic aromatic hydrocarbons in environmental samples. J. Chromatogr. A 2000, 886, 153–173. [Google Scholar] [CrossRef]
  34. EU Commission Directive. 2002/63/EC of 11 July 2002 Establishing Community Methods of Sampling for the Official Control of Pesticide Residues in and on Products of Plant and Animal Origin and Repealing Directive 79/700/EEC. Available online: https://eur-lex.europa.eu/legal-content/EN/TXT/PDF/?uri=CELEX:32002L0063&from=EN (accessed on 1 July 2022).
  35. Castro, I.B.; Costa, P.G.; Primel, E.G.; Fillmann, G. Environmental matrices effect in butyltin determination by GC/MS. Ecotoxicol. Environ. Contam. 2015, 10, 47–53. [Google Scholar] [CrossRef]
  36. Azis, M.Y.; Asia, L.; Piram, A.; Buchari, B.; Doumenq, P.; Setiyanto, H. Matrix effects on organic pollutants analysis in marine sediment. J. Phys. Conf. Ser. 2018, 1013, 012193. [Google Scholar] [CrossRef] [Green Version]
  37. Dos Santos, D.M.; de Marchi, M.R.R.; Godoi, A.F.L.; Turra, A.; Montone, A. Matrix effect on butyltin analysis of sediments and fish tissues by GC-PFPD. J. Braz. Chem. Soc. 2013, 24, 998–1005. [Google Scholar] [CrossRef]
  38. Al-Alam, J.; Baroudi, F.; Chbani, A.; Fajloun, Z.; Millet, M. A multiresidue method for the analysis of pesticides, polycyclic aromatic hydrocarbons, and polychlorinated biphenyls in snails used as environmental biomonitors. J. Chromatogr. A 2020, 1621, 461006. [Google Scholar] [CrossRef] [PubMed]
  39. Roszko, M.; Szterk, A.; Szymczyk, K.; Waszkiewicz-Robak, B. PAHs, PCBs, PBDEs and Pesticides in Cold-Pressed Vegetable Oils. J. Am. Oil Chem. Soc. 2012, 89, 389–400. [Google Scholar] [CrossRef] [Green Version]
  40. Yenisoy-Karakaş, S.; Gaga, E.O. Validation of one-step cleanup and separation method of polychlorinated biphenyls, organochlorine pesticides, and polycyclic aromatic hydrocarbons from atmospheric gas- and particle-phasesamples. Talanta 2013, 115, 150–158. [Google Scholar] [CrossRef]
  41. Lehnik-Habrink, P.; Hein, S.; Win, T.; Bremser, W.; Nehls, I. Multi-residue analysis of PAH, PCB, and OCP optimized for organic matter of forest soil. J. Soils Sediments 2010, 10, 1487–1498. [Google Scholar] [CrossRef]
  42. Sapozhnikova, Y.; Lehotay, S.J. Multi-class, multi-residue analysis of pesticides, polychlorinated biphenyls, polycyclic aromatic hydrocarbons, polybrominated diphenyl ethers and novel flame retardants in fish using fast, low-pressure gas chromatography–tandem mass spectrometry. Anal. Chim. Acta 2013, 758, 80–92. [Google Scholar] [CrossRef]
  43. Nácher-Mestre, J.; Serrano, R.; Portolés, T.; Berntssen, M.H.; Pérez-Sánchez, J.; Hernϡndez, F. Screening of Pesticides and Polycyclic Aromatic Hydrocarbons in Feeds and Fish Tissues by Gas Chromatography Coupled to High-Resolution Mass Spectrometry Using Atmospheric Pressure Chemical Ionization. J. Agric. Food Chem. 2014, 62, 2165–2174. [Google Scholar] [CrossRef] [Green Version]
  44. Stenerson, K.K.; Ye, M.; Shimelis, O.; Barrey, E.; Halpenny, M. Sample Cleanup for the Analysis of Pesticide Residues and Polynuclear Aromatic Hydrocarbons in Fatty Food Matrices. Am. Lab. 2016. Available online: https://www.americanlaboratory.com/914-Application-Notes/185012-Sample-Cleanup-for-the-Analysis-of-Pesticide-Residues-and-Polynuclear-Aromatic-Hydrocarbons-in-Fatty-Food-Matrices. (accessed on 28 September 2021).
  45. Al-Alam, J.; Fajloun, Z.; Chbani, A.; Millet, M. A multiresidue method for the analysis of 90 pesticides, 16 PAHs, and 22 PCBs in honey using QuEChERS–SPME. Anal. Bioanal. Chem. 2017, 409, 5157–5169. [Google Scholar] [CrossRef] [PubMed]
  46. He, W.; Chen, Y.; Yang, C.; Liu, W.; Kong, X.; Qin, N.; He, O.; Xu, F. Optimized Multiresidue Analysis of Organic Contaminants of Priority Concern in a Daily Consumed Fish (Grass Carp). J. Anal. Methods Chem. 2017, 2017, 9294024. [Google Scholar] [CrossRef] [PubMed] [Green Version]
  47. Ballesteros, E.; Garcia Sanchez, A.; Ramos Martos, N. Simultaneous Multidetermination of Residues of Pesticides and Polycyclic Aromatic Hydrocarbons in Olive and Olive-pomace Oils by Gas Chromatography/Tandem Mass Spectrometry. J. Chromatogr. A 2006, 1111, 89–96. [Google Scholar] [CrossRef] [PubMed]
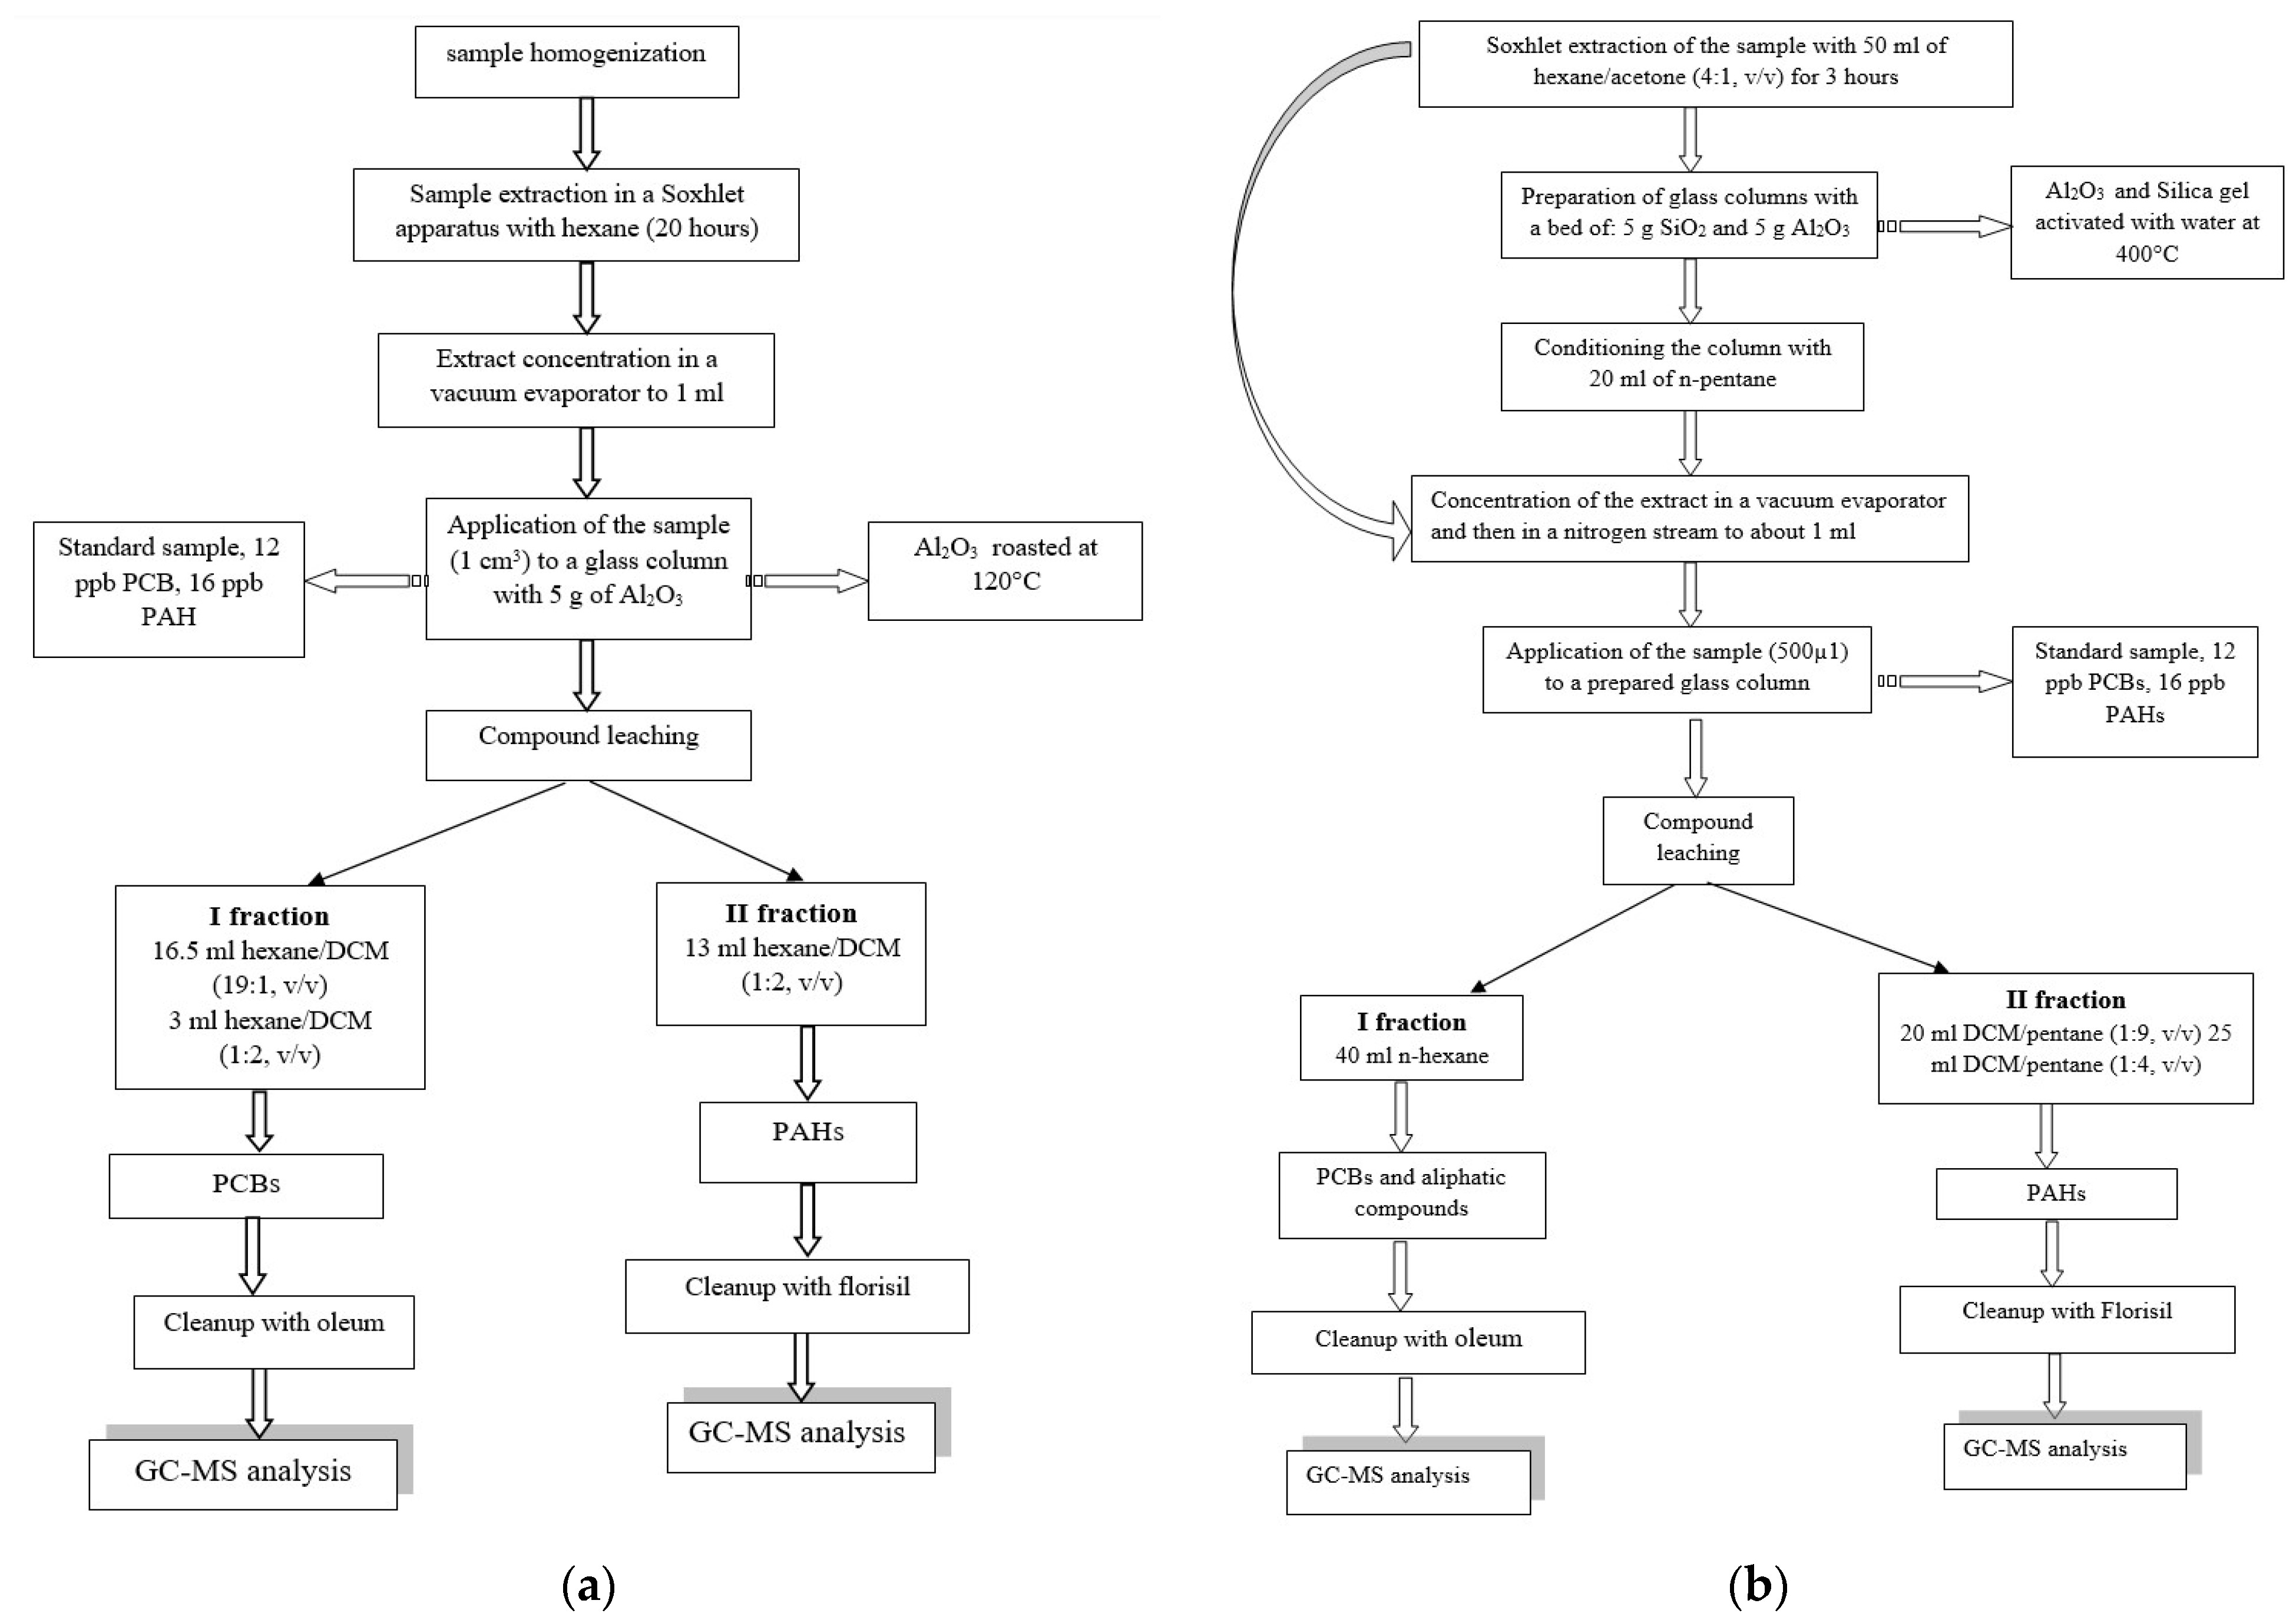
Figure 1. Procedures for determinations of PAHs and PCBs, according to Vives and Grimalt [32] ((a), method 3) and Jaouen-Madulet et al. [33] ((b), method 4).
Applsci 13 04047 g001
Figure 2. Comparison of PCB contents in dried fruits analyzed with methods 1, 3, and 4. (a)—apricot, (b)—pear, (c)—apple; 1—determined with the specific method for PCBs; 3—determined according to the methods of Vives and Grimalt [32]; 4—determined according to the methods of Jaouen-Madoulet et al. [33].
Applsci 13 04047 g002
Figure 3. Recovery of PCBs congeners (a) and PAHs (b) (method 3—according to Vives and Grimalt [32]; method 4—according to Jaouen-Madoulet et al. [33]).
Applsci 13 04047 g003
Figure 4. Comparison of PHA contents in dried fruits analyzed with methods 2, 3, and 4. (a)—apricot, (b)—pear, (c)—apple; 2—determined with the specific method for PAHs; 3—determined according to the methods of Vives and Grimalt [32]; 4—determined according to the methods of Jaouen-Madoulet et al. [33].
Applsci 13 04047 g004
Table 1. Fat content and dry matter in dried fruit.
ParameterDried Apricot
n = 20
Dried Pear
N = 20
Dried Apple
n = 20
Mean ± SDMean ± SDMean ± SD
Fat content [%]0.25 ± 0.10.6 ± 0.11.5 ± 0.2
Dry matter [%]72.5 ± 0.277.4 ± 0.375.2 ± 0.1
Note: n—number of samples; SD—standard deviation.
Table 2. Chromatographic separation parameters.
PCBPAH
Sample injection2 µL2 µL
Column typeZB-5MS (30 m × 0.25 µm × 250 µm)ZB-5MS (30 m × 0.25 µm × 250 µm)
Carrier gasHeHe
Column oven temperature
program
1.1 cm3/min1.2 cm3/min
130 °C (0.5 min *)80 °C (0.5 min *)
increase rate 7 °C up to 200 °C
(10 min *)
increase rate 10 °C up to 230 °C (10 min *)
temperature ramp 14 °C up to 280 °C (10 min *)temperature ramp 5 °C up to 305 °C (10 min *)
Electron multiplier voltage1920 V1920 V
* thermostated.
Table 3. LOD [µg·kg−1] and LOQ [µg·kg−1] values for the compounds tested.
PAHLODLOQPCBLODLOQ
NA0.300.91PCB 280.0310.094
ACL0.190.59PCB 520.0290.087
AC0.230.70PCB 1010.0440.132
FA0.110.34PCB 810.0350.110
PHE0.080.26PCB 770.0300.089
AN0.110.32PCB 1180.0180.056
FL0.050.15PCB 1140.0660.197
PY0.050.16PCB 1530.0620.183
BaA0.050.16PCB 1050.0600.179
CHR0.060.18PCB 1380.0590.174
BbFA0.080.24PCB 1260.0530.158
BkFA0.070.22PCB 1560.0300.090
BaP0.060.17PCB 1570.0300.091
IP0.090.28PCB 1800.0090.028
DbahA0.080.25PCB 1690.0400.120
BghiP0.100.32
Table 4. Value ranges of PCB and PAH determinations in the fruits tested with methods 3 and 4 in comparison to method 1 (expressed in %).
PCBsPCB Recovery by Method 1 * (%)PAHsPAH Recovery by Method 2 ** (%)
Method 3Method 4Method 3Method 4
PCB 5224.7–330.930.4–127.5ACL65.7–112.755.7–211.5
PCB 101202.7–342.3253.0–374.6AC78.4–92.763.8–233.2
PCB 810–559.30.0–768.4FA71.3–83.952.7–124.3
PCB 7735.7–212.932.2–305.0PHE60.5–80.080.1–94.1
PCB 11827.6–220.314.7–233.7AN62.1–79.689.9–150.9
PCB 114105.4–338.350.2–238.1FL68.7–88.742.7–83.5
PCB 15383.9–417.360.9–361.0PY59.2–112.147.0–124.9
PCB 1050.0–78.20.0–55.9BaA79.6–187.939.4–129.9
PCB 13829.6–141.733.1–215.6CHR61.5–162.137.3–75.9
PCB 126330.7–358.1260.6–320.8BbFA79.2–116.231.8–125.3
PCB 1560.0–138.30.0–100.4BkFA115.8–242.8102.5–280.7
PCB 1570.0–39.815.7–35.2BaP70–222.961.0–513.1
PCB 180123.9–5284.060.9–4119.1IP45.9–480.457.9–1152.2
PCB 1690.0–18.50.0–19.8DBahA537.2–1323.0408.1–1177.0
BghiP61.3–371.533.7–2828.7
* Values obtained with method 1 assumed to be 100%; ** values obtained with method 2 assumed to be 100%.
Table 5. Comparison of methods for preparing samples for determinations of PCBs and PAHs.
Authors Extraction MethodCleanup MethodTarget Compounds
Yenisoy-Karakaş and Gaga 2013 [40]atmospheric gas, particle-phaseSoxhlet extraction:
dichloromethane/petroleum ether
aluminum oxide + florisil + anhydrous sodium
sulfate
PAHs,
PCBs,
OCPs
He et al., 2017 [46]fishmicrowave-assisted extraction (MAE)gel permeation chromatogra-phy (GPC)neutral alumina + acid
silica gel + neutral silicagel
PBDEs,
PCBs
neutral alumina + wet neutral silica gel + wet alkaline silica gelPBDEs,
PCBs,
neutral alumina + wet neutral silica gel + anhydrous sodium sulfatePAHs,
OCPs
Lehnik-Habrink et al., 2010 [41]forest soilpressurized
liquid extraction (PLE), acetone/cyclohexane AC/CH
GPC; silica gel or aluminum oxidePAH,
PCBs,
OCPs
Stenerson et al., 2016 [44]Fatty foodQuEChERS, acetonitrilePSA/C18, Z-Sep/C18Pesticides,
PAHs
Sapozhnikva and Lehotay 2013 [42]fishQuEChERS, acetonitrilezirconia-based sorbent (Z-Sep) for d-SPEPCBs, PAHs, PBDEs. OCPs
Nácher-Mestre et al., 2014 [43]feeds and fish tissuesQuEChERS, acetonitrile(primary−secondary amine (PSA) + MgSO4 + C18)Pesticides,
PAHs
Ballesteros et al., 2009 [47]olive oilacetonitrile/n-hexaneGPCPesticides,
PAHs
Jaouen-Madoulet et al., 2000 [33]environmental samples: blue mussel, cod liver oilSoxhlet extraction:
n-hexane/acetone
Alumina + silica gelPCBs,
PAHs
Thompson et al., 2002 [25]sedimentmicrowave-assisted extraction: dichloromethanesulfuric acid, activated silica + activated copperPAHs,
PCBs, OCPs
Vives and Grimalt 2002 [32]fish liverSoxhlet extraction:
n-hexane/dichloromethane
aluminium oxidePAHs,
PCBs, OCPs
Wolska 2002 [22]sedimentdichloromethaneactivated silica gelPAHs
solvent exchanged to pentane + activated silica gelPCBs
Disclaimer/Publisher’s Note: The statements, opinions and data contained in all publications are solely those of the individual author(s) and contributor(s) and not of MDPI and/or the editor(s). MDPI and/or the editor(s) disclaim responsibility for any injury to people or property resulting from any ideas, methods, instructions or products referred to in the content.