Article

Heat Transfer Mechanism Investigation of Bubble Growth on the Superhydrophilic Nano-Structured Surface Using Moving Particle Semi-Implicit Method

Shaanxi Key Laboratory of Advanced Nuclear Energy and Technology, State Key Laboratory of Multiphase Flow in Power Engineering, School of Nuclear Science and Technology, Xi’an Jiaotong University, Xi’an 710049, China
*
Author to whom correspondence should be addressed.
Appl. Sci. 2023, 13(7), 4114; https://doi.org/10.3390/app13074114
Submission received: 5 March 2023 / Revised: 20 March 2023 / Accepted: 21 March 2023 / Published: 23 March 2023

Abstract

:
The boiling behavior on nano-structured surfaces is a frontier research direction in nuclear engineering. However, the mechanism of boiling heat transfer on nano-structured surfaces is still unclear. In this study, a depletable micro-layer model and the nano-structure model are proposed based on the Moving Particle Semi-implicit (MPS) method coupled with Meshless-Advection using the Flow-directional Local-grid (MAFL) scheme, also known as the MPS-MAFL method. The developed method in this paper establishes a bridge between the nano-scale surface structure heat transfer and the macroscopic bubble boiling. Only by knowing the nanoparticle size, porosity, and thickness of the nano-structure, the heat transfer of the nano-structure can be considered into the macroscopic boiling bubble growth process. The accuracy of the approach is validated by benchmark cases and experiments, respectively. The present method quantitatively simulates the bubble growth behaviors on nano-structured surfaces for the first time. The results indicate that the heat transfer contribution of the micro-layer to bubble growth was not neglectable, while the proportion of heat transfer rate of the micro-layer on the bared surface was 40.55% at ΔTw = 7.22 ℃ and 32.23% at ΔTw = 10.15 ℃. The heat transfer contributions of the micro-layer and the wicked fluid to the bubble growth in the nano-structured heater were about 42.13%, the ratio of them was 14:11. The current study provides a fundamental base for further investigations.

1. Introduction

Boiling heat transfer is always the research hotspot in nuclear engineering. Significant classical literature can be found in this field [1,2,3,4,5,6,7,8,9]. Recently, nano-fluids have attracted attention in boiling heat transfer research. The nucleate boiling heat transfer and CHF enhanced by nano-fluids are mainly attributed to the deposition of nano-particles on boiling surfaces [10]. Nano-particle deposition leads to changes in boiling surfaces’ roughness [11], wettability [12,13,14], and wickability [15,16], which are the main influencing factors of boiling heat transfer. These findings have suggested to researchers that fabricating nano-structures on boiling surfaces directly seems to be a more immediate way to gain an enhancement of boiling heat transfer.
The boiling behavior on nano-structured surfaces is a frontier research direction. Relevant studies [17,18] have shown that nano-structures will significantly enhance the boiling transfer and critical heat flux, improving the economics and safety of nuclear plants. However, the bubble boiling heat transfer mechanism on nano-structured surfaces is still unclear. Numerical simulation investigation is of great importance for interpreting the boiling heat transfer mechanism on nano-structured surfaces. To date, however, most numerical simulations have focused on bare surface boiling. The main challenges in numerical simulations of nano-structured surface boiling can be attributed to difficulties in descriptions of the micro-layer beneath the growing bubble and the nano-structure on the boiling surface.
For the description of the micro-layer, its evaporation has not been included in most previous simulations [19,20,21]. The rapid evaporation of the micro-layer is considered to have a significant contribution to bubble growth and boiling heat transfer [22]. The micro-layer evaporation accounts for approximately from 40% to 60% of the total heat and mass transfer during the boiling process [23], meaning the micro-layer’s existence cannot be ignored in numerical simulations. The establishment of the micro-layer model relies on the accurate experimental measurement of the rapid growth of boiling bubbles. Cooper and Lloyd [24] first proposed a micro-layer model based on their experimental results, and the model was then adopted in Lee and Nydahl’s simulations [25]. In addition, Stralen et al. [26] also deduced a micro-layer model according to the velocity of the vapor-liquid interface. However, many speculations of the micro-layer thickness in those models directly influence the model’s accuracy. With the development of the measuring technique, the micro-layer thickness distribution was reported by Utaka et al. [27,28] using the laser extinction method. Utaka’s up-to-date micro-layer thickness equations have been widely adopted by recent numerical simulations [29,30,31,32], and good robustness of the micro-layer thickness equations has been revealed in those studies.
Modeling the nano-structures on a boiling surface is more challenging. The wickability of the super hydrophilic nano-structure will enhance the rewetting performance on the boiling surface, and the evaporation of the wicked fluid inside the nano-structure near the triple contact line also contributes to the bubble growth. However, a CFD method cannot establish fine modeling of the centimeter scale bubble and the nano-scale surface structure at the same time. Here, we provide a brief overview of numerical simulations of micro- and nano-structured surfaces boiling. Lee et al. [33] used the level-set method to capture the gas-liquid interface and numerically simulated the nuclear boiling process on a micro-structured surface. They analyzed the bubble dynamics and heat transfer characteristics in each case. Li et al. [34] used the Lattice Boltzmann Method (LBM) to simulate the nucleate boiling process on the surface of two-dimensional micro-column structures. Yu et al. [35] simulated boiling heat transfer on hydrophilic–hydrophobic mixed surfaces with 3D LBM; however, in their study, the effect of nano-structures only manifested in the influence on the wettability of the heating surface, while simulation and analysis were absent for the additional heat transfer caused by the nano-structures. The molecular dynamics (MD) simulation is an ideal tool to investigate the boiling process in nano-scale. Wang et al. [36] studied the sub-cooled boiling on the different nano-structured surfaces at different degrees of wall superheat. She et al. [37] analyzed the nucleation process on a platinum surface with/without the triangular nano-groove. Liu et al. [38] carried out MD simulations for the boiling on a concave hemispherical nanostructure surface. It should be acknowledged that molecular dynamics research plays an important role in revealing the micro-mechanism of bubble nucleation and CHF formation on nano-structured surfaces. However, the biggest problem with MD methods is that the simulated time and spatial scales are extremely small, limiting their applicability to the macroscopic phenomenon of bubble boiling.
Recently, several experimental investigations about boiling on superhydrophilic nano-structured surfaces have been carried out, and creative models about the wicked fluid inside the nano-structure have been proposed. Rahman et al. [39] introduce a non-dimensional number Wi to characterize the wickability of their super hydrophilic nano-structured surfaces using a capillary tube wicking test. The wicked fluid volume as a function of time was obtained in their research. Subsequently, Tetreault-Friend et al. [40] put forward a more detailed model to describe the wicked fluid velocity. Those models are practicable and may be good candidates to improve the numerical simulation by simplifying the nano-structure modeling.
In this paper, we take the first step in simulating the nucleate bubble growth on the super-hydrophilic nano-structured surface. Micro-layer and nano-structure models were implanted into the Moving Particle Semi-implicit (MPS) method coupled with Meshless-Advection using the Flow-directional Local-grid (MAFL) scheme (MPS-MAFL method) [41,42]. The MPS-MAFL has been utilized in simulating bubble dynamics and boiling bubble behaviors [43,44,45]. Compared with traditional numerical methods, e.g., VOF [46] and Level Set [47], MPS-MAFL is a Lagrangian-Eulerian scheme, wherein only the fluid phase is presented by a set of Lagrangian particles while the vapor phase is solved by the ideal gas law; thus, the calculation efficiency is one of the primary advantages. Moreover, re-construction of the computing grid near complex moving interfaces is not a problem since the mesh is no longer needed. In the present study, up-to-date gradient and Lagrangian models were modified in the MPS-MAFL method, and both micro-layer and nano-structure heat and mass transfer were considered as source terms of governing equations, enabling the approach to calculate the boiling bubble process on nano-structured surfaces. The present method establishes a bridge between micro and macro phenomena. Only by knowing the nanoparticle size, porosity, and thickness of the nano-structure, the heat transfer of the nano-structure can be considered into the macroscopic boiling bubble growth process. The present method quantitatively simulates the bubble growth behaviors on nano-structured surfaces for the first time. The heat transfer contributions of the superheated fluid, micro-layer evaporation, and nano-structure wicked fluid evaporation during boiling bubble growth are discussed quantitatively. The current research puts on an understanding of nano-structured surfaces’ boiling heat transfer mechanism and provides a fundamental base for further studies.

2. Numerical Method and Calculation Procedure

2.1. Governing Equations

In the MPS-MAFL method, the continuity, Navier–Stokes, and energy equations for incompressible viscous flows are as follows [42]:
· u = 0
ρ D u D t + u u c · u = p + μ 2 u + ρ g + F S
D T D t + u u c · T = α 2 T
where ρ is the liquid density, μ is the dynamic viscosity, u is the fluid flow velocity, u c is the velocity of computing Lagrangian points after reconfiguration, p is the pressure, F s is the surface tension force, T is the temperature, and α is the thermal diffusivity.
In the MPS-MAFL method, calculation consists of three parts: Lagrangian, reconfiguration, and Eulerian parts. In the Lagrangian part, Laplacian and gradient models as well as the Pressure Poisson Equation (PPE) are adopted to semi-implicitly solve governing equations except for the convection term in the momentum equation as stated in the MPS method [48]. Then, Lagrangian computing points are adaptively reconfigured according to the flow directional local grid. Finally, the convection term in the momentum equation is solved by the first-order upwind scheme. In this paper, we introduce some up-to-date particle interaction models into the Lagrangian part, which are indicated in followed parts. Discussion about reconfiguration and Eulerian parts is outside the scope of this paper; readers can find more details about these two parts in other previous studies [41,43].

2.2. Particle Interaction Models

The kernel function is used to associate the target particle i with its neighboring particles j. Both the Gaussian kernel function (Equation (4)) and hyperbolic kernel function (Equation (5)) [49] are adopted in the current MPS-MAFL method.
G r = 9 π r e 2 exp 9 r 2 r e 2
H r = r e r 1 r < r e 0 r r e
where G is the Gaussian kernel function, H is the hyperbolic kernel function, re is the radius of the interaction zone, and r is the distance between particle j and i.
The Laplacian model shown in Equation (6) [49] is adopted to discrete the Laplacian operators in Equations (2) and (3).
2 φ i = 18 r e 2 j n i 2 + n j 2 n i n j 2 × φ i j G i j
where φ stands for the arbitrary physical quantities, n is the Particle Number Density (PND), Gij is short for Gj-Gi, and subscripts i and j represent the particle i and j, respectively. Moreover, re is the radius of the interaction zone, which was set to be 3.1 times of the particle size. Equation (6) is deduced based on the Shepherd function [50], which considers the influence of particle i itself; thus, Equation (3) is needed as the kernel function. More details can be referred to in the author’s previous work [49].
The gradient calculation represents the transfer of physical quantitiesbetween particles, and the gradient model shown in Equation (7) is adopted to discrete the gradient operator [51].
φ i = D n 0 j i φ i j r i j r j r i 2 H i j
where D is the number of dimensions, and n0 is the initial PND. Equation (7) is always used to calculate the pressure gradient. In the fully Lagrangian method, the Particle Stabilizing Term (PST) is always needed for particles near free surfaces [52]. However, owing to the hybrid scheme, the PST is not necessary for the MPS-MAFL method.
The divergence model shown in Equation (8) is utilized to calculate the divergence of particle temporal velocity, which is another way to present the particle density; thus, the PND is not precisely required to be a constant to satisfy the incompressibility model in the MPS-MAFL method.
· u i = D n 0 j i u i j · r i j r j r i 2 H i j

2.3. Higher Order Accurate Pressure Poisson Equation

The format of PPE in the present MPS-MAFL method is shown in Equation (9) [41].
Δ t ρ 2 P k + 1 i = · u *
where u* is the particle temporal velocity and · u * is considered as the first order accurate description of PND’s change. The right-hand side of the PPE is discretized by Equation (8).
The left-hand side of Equation (9) is discretized by the higher-order accurate Laplacian model [49,51]. Considering the effect of the problem dimension, the left-hand side of Equation (9) is changed as:
2 P k + 1 i = 5 D n 0 j i P i j r e r i j 3
It should be noted that the PND in Equation (10) is calculated based on the hyperbolic kernel function (Equation (5)) as stated above. Finally, the discrete PPE is implicitly solved by the Incomplete Cholesky Conjugate Gradient (ICCG) method [42].

2.4. The Surface Tension Model

All numerical cases in the present study are in two dimensions; thus, the force analysis of the growing bubble should be carefully carried out to make sure the 2D cases can accurately reveal the real situation. As indicated in previous studies [41,43], the effect of space dimension on the drag coefficients for 3D spherical and 2D cylindrical bubbles can be neglected when the Reynolds number is small enough. In the current study, the surface tension force shown in Equation (11) is adopted to control the motion of a 2D bubble [45,53].
P g P l = σ r
Where Pg is bubble’s inner pressure, Pl is the pressure of surrounding fluid, σ is the surface tension coefficient, and r is the radius of curvature. Surface tension is implemented by computing the curvature of the phase interface, and the pressure gradient, p = σ / r , is explicitly added to the governing equation shown in Equation (2), where F S = σ / r × n is the surface tension term. Taking the advantage of the re-configuration phase, the local radius of curvature can be easily obtained according to the re-configured vapor-liquid interface.
It should be noted, however, that the phenomenon of fluid reflux beneath the bubble cannot be entirely described in 2D, as there is a large gap between the bubble departure time in 2D and that in 3D [54]. Thus, we only focus on the bubble growing process on the boiling surface in the present study, and the bubble departure behavior is not the research target.

2.5. The Micro-Layer Model

The micro-layer model is one of the main modifications in current research based on Yoon’s MPS-MAFL method. Sato et al. [29] proposed a depletable micro-layer model based on the FVM method. The heat and mass transfer part in their model is adopted in the current method, while the simulation of the fluid field inside the micro-layer is not included as indicated above.
The schematic of the micro-layer is shown in Figure 1. δ0 is the initial micro-layer thickness at rL, where rL is the distance between the nucleation site and the current position. According to Ukata et al.’s research [27], the expression for δ0 is shown as follows:
δ 0 r L = C 0 r L
in which C0 is a constant that can be only obtained by measurement or numerical experiments, and rL is the distance between the nucleation site and the position of the virtual micro-layer particle. In the study carried out by Utaka et al. [28], they experimentally determined the slop C0 = 4.46 × 10⁻³ for DI water in the case of the pool boiling on a heated quartz glass surface at atmospheric pressure. Considering the influence of different working fluids, surface roughness, surface wettability, material properties, and system pressure on the slop C0, we determined C0 as follows:
(1)
We carried out a first calculation with C0 = 4.46 × 10⁻³.
(2)
We compared the calculated results with the experiment. If they were in good agreement, an appropriate C0 was achieved. Otherwise, we went to the next step.
(3)
We recalculated with the modified C0 and returned to the previous step.
The temperature of the upper boundary of the micro-layer is the same as that of the saturated vapor inside the bubble, which is expressed as Tsat. The temperature of the micro-layer’s bottom boundary is Twm. In the numerical simulation, if the heated surface’s temperature Tw is regarded as a known fixed value, the relation of the above three temperature values is equal to the Equation (13). With a known Tsat, the Twm can be calculated.
λ s T w T w m l 0 / 2 = λ l T w m T s a t δ
where λs and λl are thermal conductivity for surface and liquid, respectively, and l0 is the interface particle size in the MPS-MAFL method.
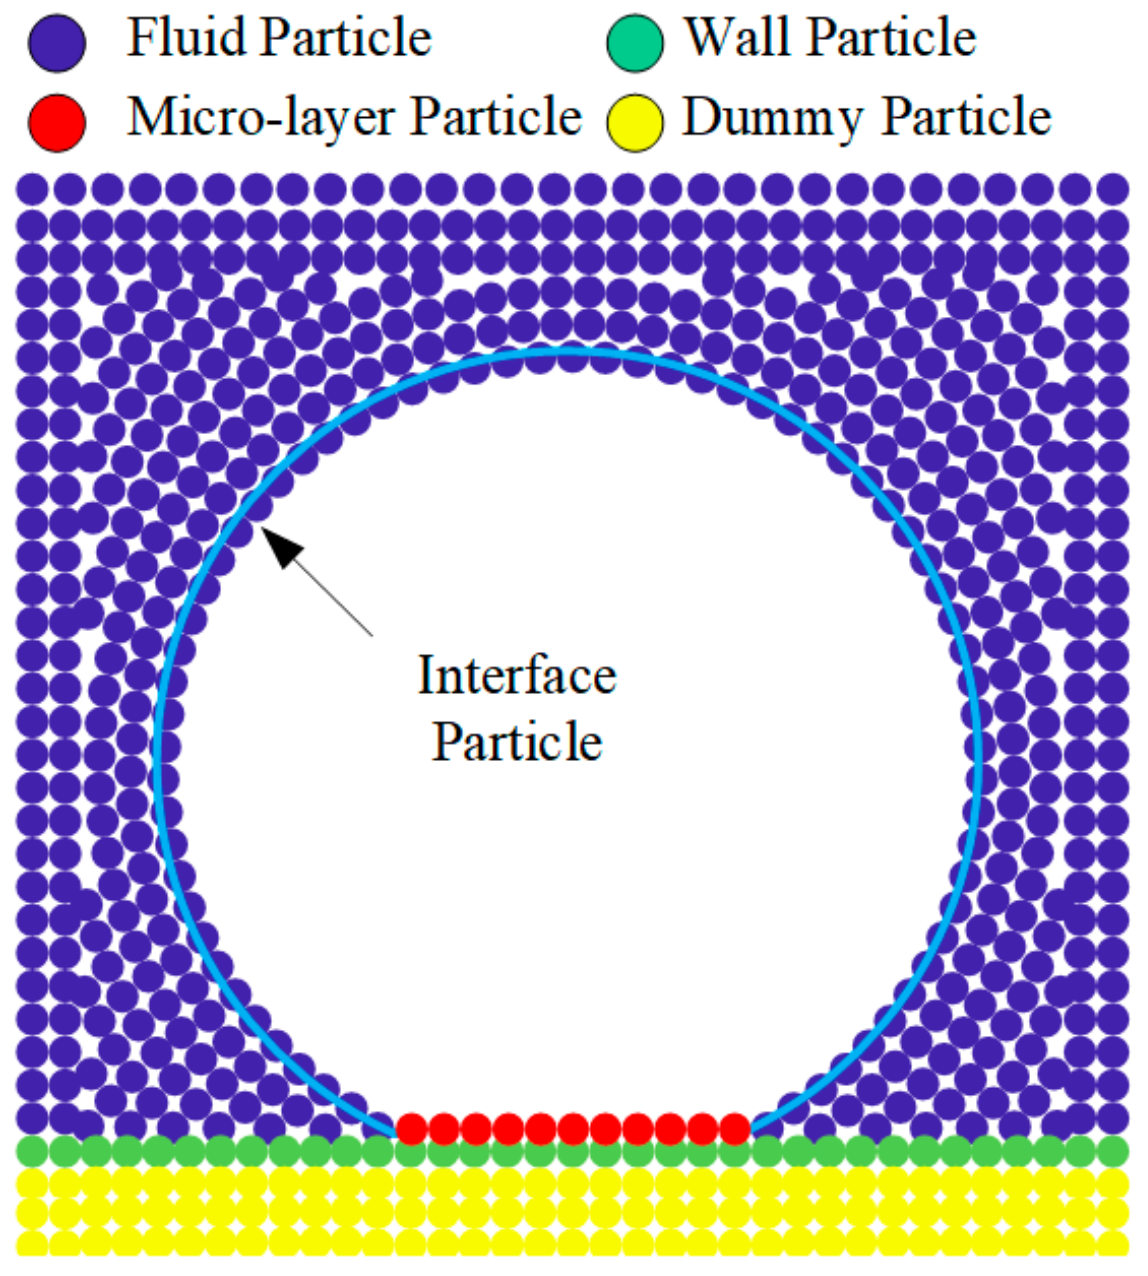
The arrangement of the initial bubble in the current method is shown in Figure 2. Compared with Yoon’s MPS-MAFL method, as indicated by red circles, a set of virtual micro-layer particles are arranged at the bottom of the initial bubble. The local micro-layer thickness is recorded by those virtual particles, and the initial thicknesses are evaluated by Equation (12).
The heat flux transferred from the micro-layer into the vapor bubble is calculated as follows:
q m l = T w m T s a t δ t λ l + 2 γ · 2 π R T s a t 2 γ · h lv 2 ρ v
where γ is the evaporation coefficient of the DI water, which is always set to be 1 [55]. R is the bubble radius. The first term in the denominator stands for the heat conduction of the micro-layer, and the second term is the evaporation resistance of the micro-layer.
The mass flux change rate of the micro-layer is shown in Equation (15).
m ˙ m l = q m l h l v
Then, the micro-layer’s thickness change rate can be obtained:
d δ t d t = 1 ρ l m ˙ m l
By considering Equations (12)–(16), transition changes in the micro-layer’s thickness and heat flux can be solved. It should be noticed that, when the triple contact line expands, new virtual micro-layer particles should be added, and their initial thicknesses can also be calculated by Equation (12).

2.6. The Nano-Structure Model

In the present study, we coupled the nano-structure heat transfer to the heat transfer caused by the micro-layer. As shown in Figure 3, one can imagine that the micro-layer exists on the nano-structure, and the micro-layer is fed by the wicked fluid inside the nano-structure. The micro-layer’s mass flux change rate caused by the wicked fluid can be calculated as follows:
m ˙ w i c k = ρ l V ˙ w i c k
where V ˙ w i c k is the velocity of the wicked fluid.
As shown in Figure 3, nano-structure is divided into two parts, i.e., the heat conduction-dominated domain and the wicked fluid-dominated domain. The height of the two domains’ interfaces is hc. The time required for heat to be transferred from the heating surface to a thickness of h can be calculated by:
τ c o n d = h 2 2 α p o r o u s
where τcond is heat transfer time under thermal conduction, αporous is the effective thermal diffusivity of the nano-structure, which can be calculated as follows:
α p o r o u s = λ p o r o u s / ρ p o r o u s C p , p o r o u s
The effective thermal conductivity of the porous nano-structure can be achieved using Equation (20) [56], and the equivalent density and specific heat capacity are obtained based on the weighted average of fluid and solid according to the porosity ε .
λ porous = λ f λ s λ f 0.28 0.757 log ε 0.057 log λ s λ f
Assuming that the wicked path of the fluid is a semicircular arc with a radius of the thickness of the region (δnanoh), the wicked fluid flow time τwick is calculated using the following equation:
τ w i c k = π δ n a n o h V ˙ w i c k
In the domain close to the heating surface, thermal conduction dominates, and the thermal transfer time through conduction is much shorter than the thermal transfer time through the wicked fluid (τcond << τwick). However, the opposite is true in the domain close to the surface of the nano-structure. Considering the continuity of heat transfer, τcond must be equal to τwick at the interface between two domains (h = hc). Thus, we can obtain the relationship shown as Equation (22):
h c 2 2 α p o r o u s = π δ n a n o h c V ˙ w i c k
The model of V ˙ w i c k is shown in Equation (23) [40], which considers the fluid kinematic viscosity υporous, the static contact angle of the fluid on the nano-structure θ, and the nano-particle’s radius rp. The static contact angle θ is regarded to be zero since the nano-structure in this study is super hydrophilic. The appearance of the adopted nano-structure is introduced later.
V ˙ w i c k = 4 ρ v π δ n a n o h c υ p o r o u s ρ l r p 2 1 + 1 + σ cos θ r p 3 ρ v π 2 δ n a n o h c 2 8 υ p o r o u s 2
Substituting Equation (23) into Equation (22), the hc is the only parameter to be solved. Then, the wicked fluid velocity and mass flux change rate can be finally achieved.
After obtaining the wicked fluid mass flux change rate m w i c k , the heat flux caused by the wicked fluid can be calculated as follows:
q w i c k = 2 π r f δ n a n o h c m w i c k h l v 4 r f 2
where rf is the radius of the bubble footprint. The 2πrf(δnano-hc) is the circulation area of the wicked fluid, and the 4 r f 2 scales the area of influence of each bubble [57].

2.7. The Bubble Volume Change Model

In the MPS-MFAL method, the ideal gas law is adopted to describe the volume change of the bubble. During the bubble growing, the inner vapor is considered saturated, and the temperature of the interface particle can be evaluated according to the vapor’s physical property:
T interface n = T s a t P n
The construction of the superheated liquid layer before nucleation is taken into consideration in the current research. The bubble wait time is molded by Equation (21) [4].
t w = 2 4 π α T w T R c T w T s a t 1 2 σ / R c ρ v h l v 2
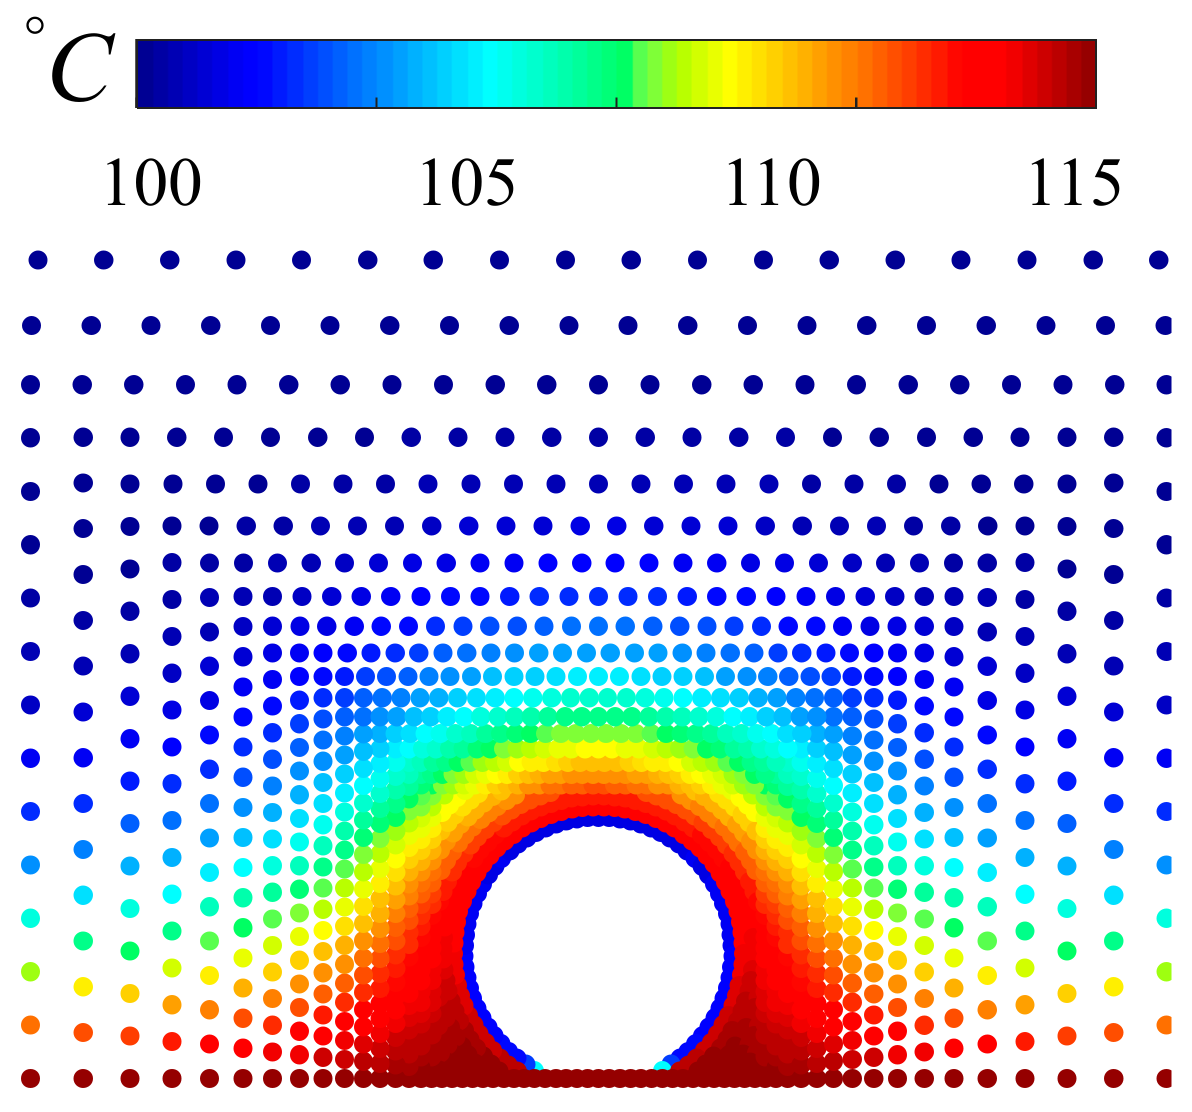
where Rc is cavity size which is replaced by the initial bubble size. The bubble wait time refers to the time interval between the departure of the previous bubble from the nucleation site on the heating surface and the generation of the next bubble. During this period, only the liquid layer in close proximity to the superheated wall continues to absorb heat from the heat source, leading to the formation of the superheated layer. In the simulation, we only solve the energy equation (Equation (3) in the revised manuscript), while the bubble volume is not updated during this time (t < tw). At the beginning of the bubble growth, taking tw = 115 °C as an example, the temperature distribution of the superheated liquid layer near the nucleation site is shown in Figure 4.
Then, the heat transfer from the superheated liquid layer into the bubble can be calculated:
Q s l = ρ l c p l 0 2 i interface T i t + Δ t T i t
The heat transfer of the micro-layer and wicked fluid inside the nano-structure was calculated by Equations (28) and (29), respectively.
Q m l = q m l A m l Δ T
Q w i c k = q w i c k A m l Δ T
where Aml is the area of the micro-layer. Here, we assume that the area of the wicked fluid under the growing bubble is precisely as the same as that of the micro-layer, and the heat transfer of the wicked fluid is considered to be zero after the micro-layer dries out.
As the calculation progresses, the micro-layer at the bottom of the bubble gradually dries up, leading to the appearance of a dry area. As shown in Figure 5, the micro-layer particles with a thickness of zero, namely the dry area particles, are represented with gray particles. Define the rf as the radius of the bubble footprint and rd as the radius of the dry area; then, the area of the micro-layer Am in Equations (28) and (29) can be calculated by:
A m = π r f 2 r d 2
Combining those three parts of heat transfer, the volume change of the growing bubble can be obtained:
Δ V = Q s l + Q m l + Q w i c k ρ v h l v
It should be noted that, after the micro-layer evaporates, the dry area appears under the bubble. However, the heat transfer from the dry area into the bubble is too faint to contribute to the bubble growth. Thus, the dry area heat transfer is neglected in this study.
The temporal bubble pressure, which is equivalent to the interface particles’ pressure, is evaluated by the ideal gas law according to the bubble volume change:
P * = P n V n + Δ V V n
where n stands for the number of the time step.
Substituting the temporal interface particles’ pressure P* into the pressure gradient model, the position of the interface particles in the next time step can be acquired. The modified volume and pressure of the bubble in the next time step can be further calculated:
V n + 1 = i i n t e r f a c e y i + y i + 1 x i x i + 1 / 2
P n + 1 = P * V n + Δ V V n + 1
Then, the temperature of the interface particles is updated by Equation (20).

2.8. Calculation of the Domain and Boundary Conditions

The initial particle arrangement of the pool boiling bubble is shown in Figure 6. The width and height of the static water pool were 0.1 m and 0.04 m, respectively. An initial nucleation site could be found at the center of the bottom heated surface. The multi-solution particles were employed to efficiently reduce the calculation amount, which means the denser particles were adopted closer to the vapor–liquid interface. The smallest particle distance in the calculation domain, i.e., the distance between the particles located on the vapor-liquid interface, was 10−5 m. The detailed principle of the multi-solution particle arrangement can be referred to in Ref. [41]. The non-slip wall [50] was considered for the left, right, and bottom boundary conditions, and the free surface [43] condition was adopted by the upper boundary.

2.9. The Time Step Control

In the current method, the calculation time step is automatically determined by the smallest time step controlled by the Courant–Friedrichs–Lewy (CFL), the surface tension, and the viscosity conditions [49]:
Δ t C F L = C 0 l 0 u m a x
Δ t s f = 0.5 · ρ l l 0 3 2 π σ
Δ t v i s = r e 2 18 d ν l
where the Courant number C0 is set to be 0.02.

2.10. The Calculation Procedure

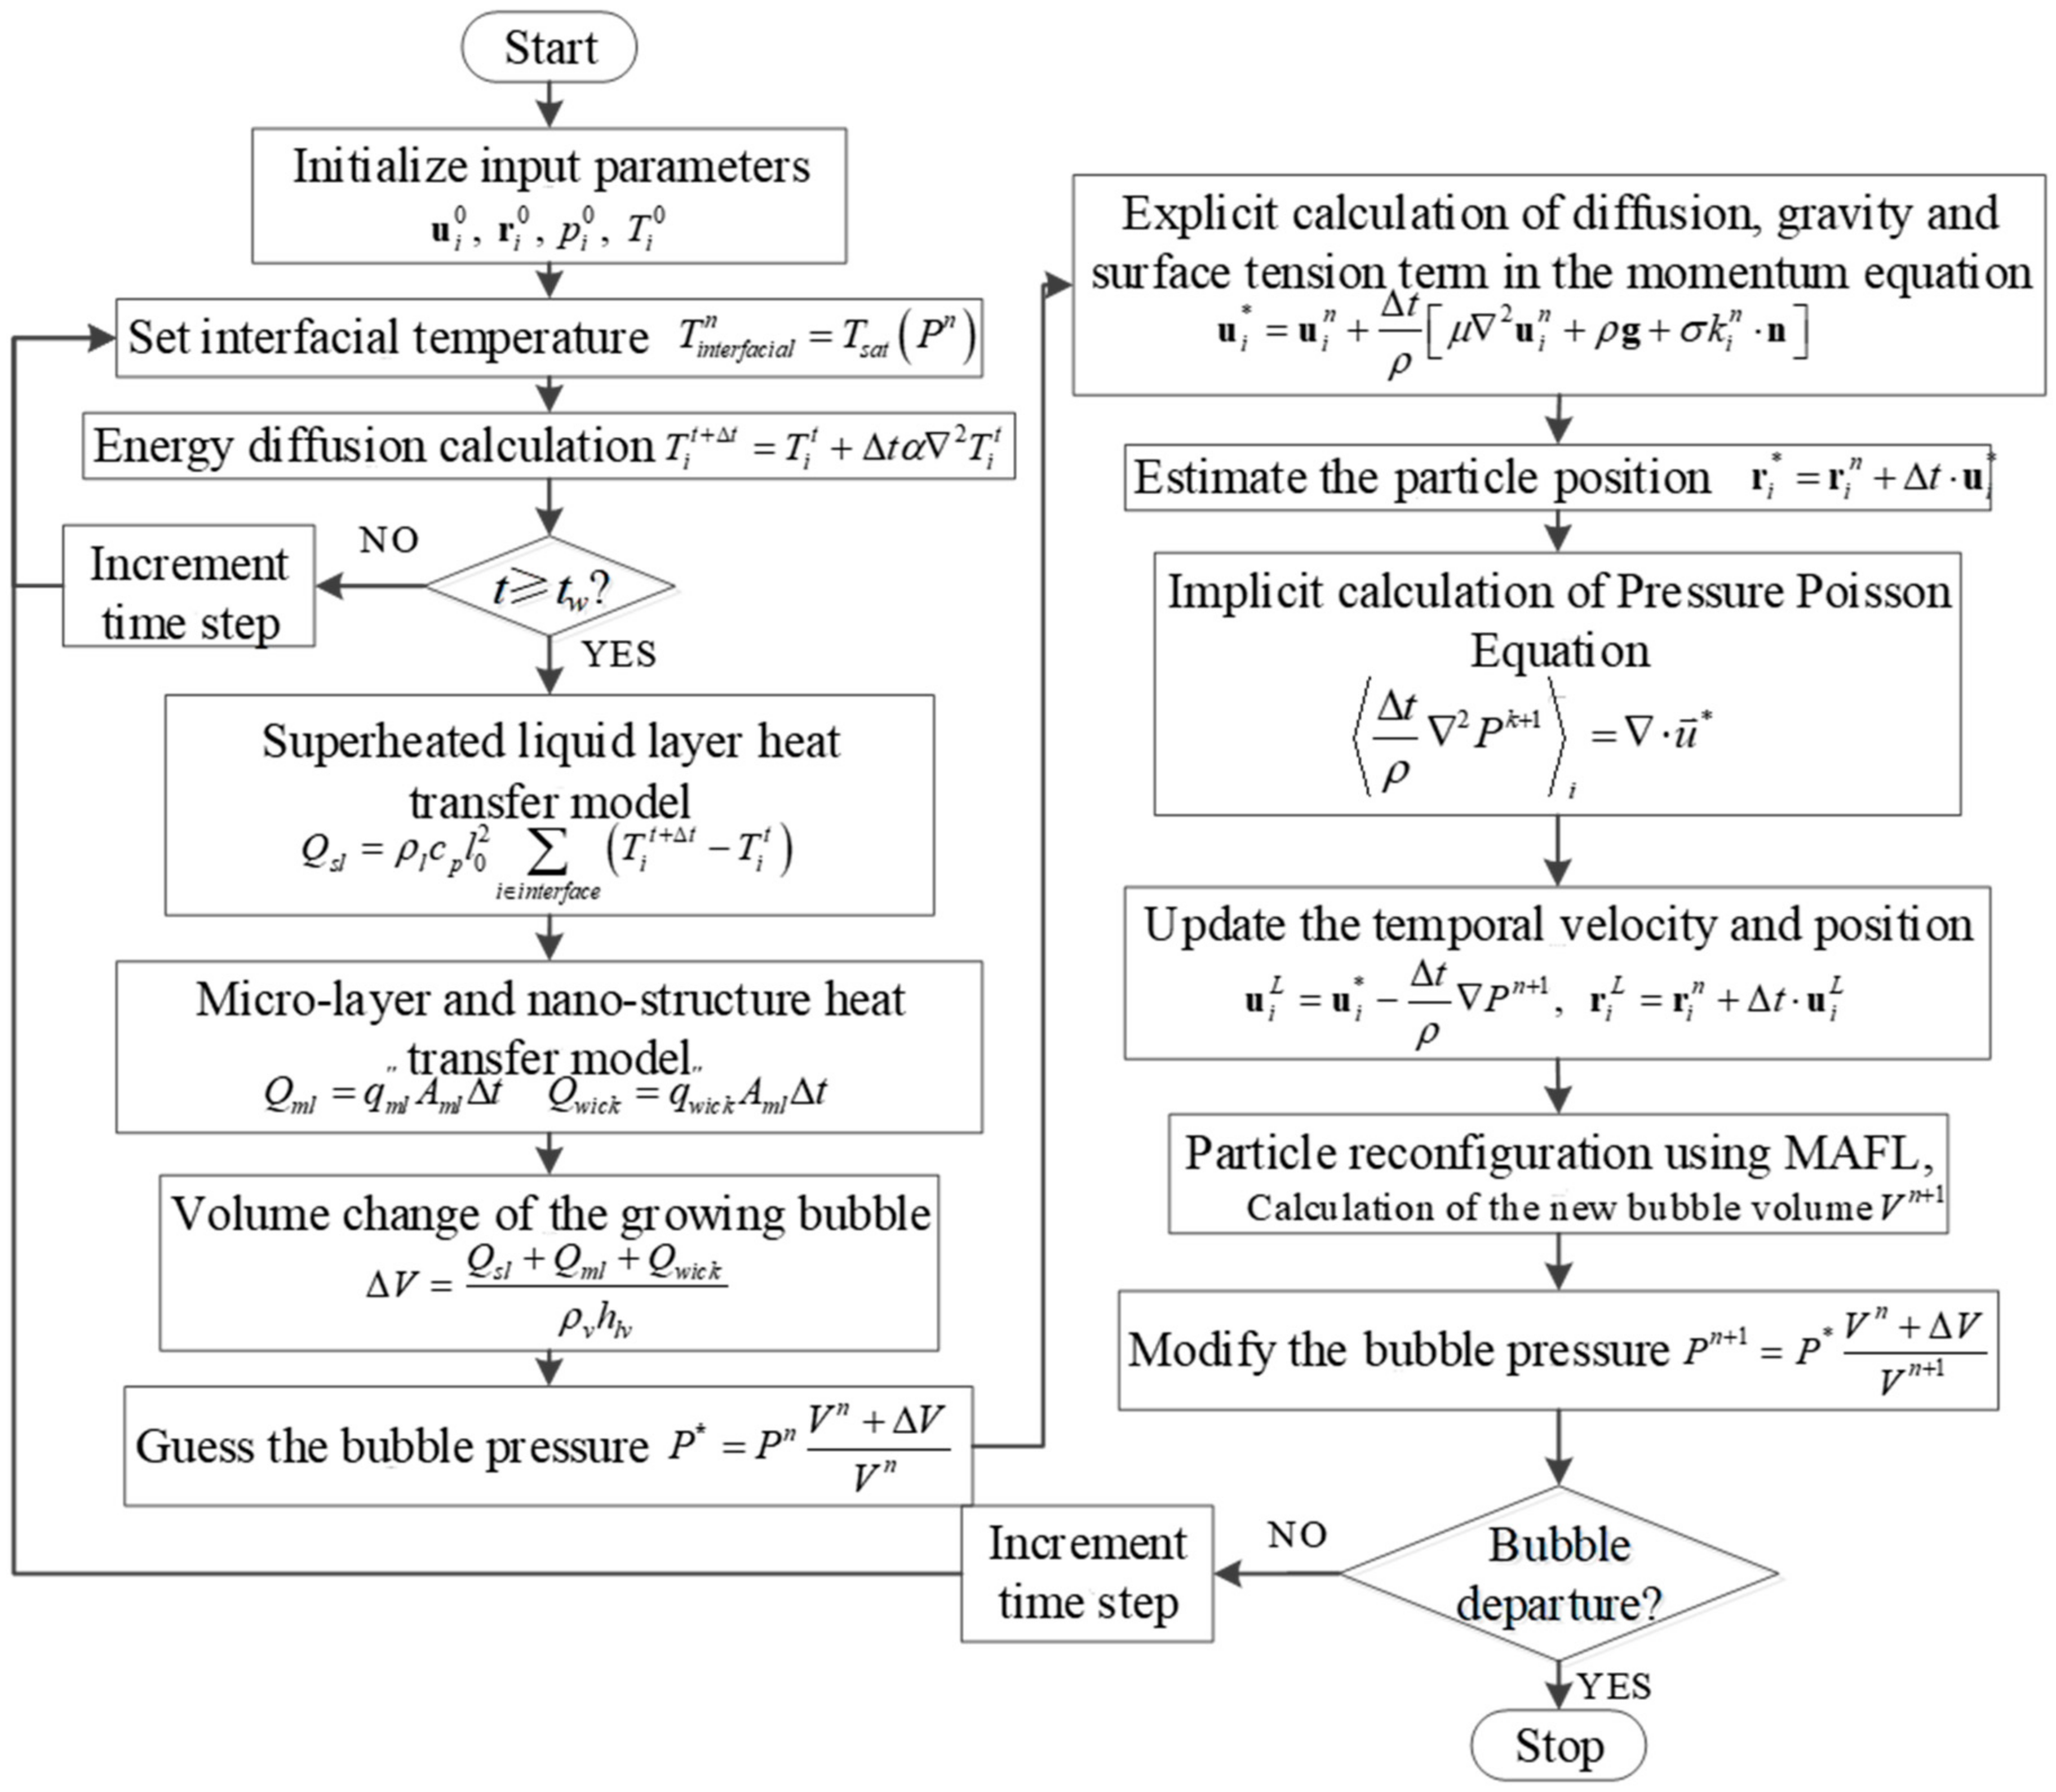
At the end of this section, the calculation procedure of the current MPS-MAFL method for the pool boiling bubble growth on the nano-structured surface is summarized in Figure 7.

3. Validation

3.1. One-Dimensional Plate Heat Conduction

To access the capability of the MPS method to analyze the heat transfer, as well as to verify the heat transfer model further quantitatively in the MPS method, the one-dimensional plate heat conduction was simulated by the improved MPS method to meet the one-dimensional requirement. A panel with a thickness of 0.1 m and a height of 1.0 m was used. Since the length/width ratio was 10, the temperature distribution in the center of the plate can be regarded as one-dimensional heat conduction temperature distribution. The initial temperature of the plate was assumed to be T0 and, the temperature on the left side was constant Tw. Hence, the analytical solution is as follows:
T x , t T w T 0 T w = e r f x 2 α t
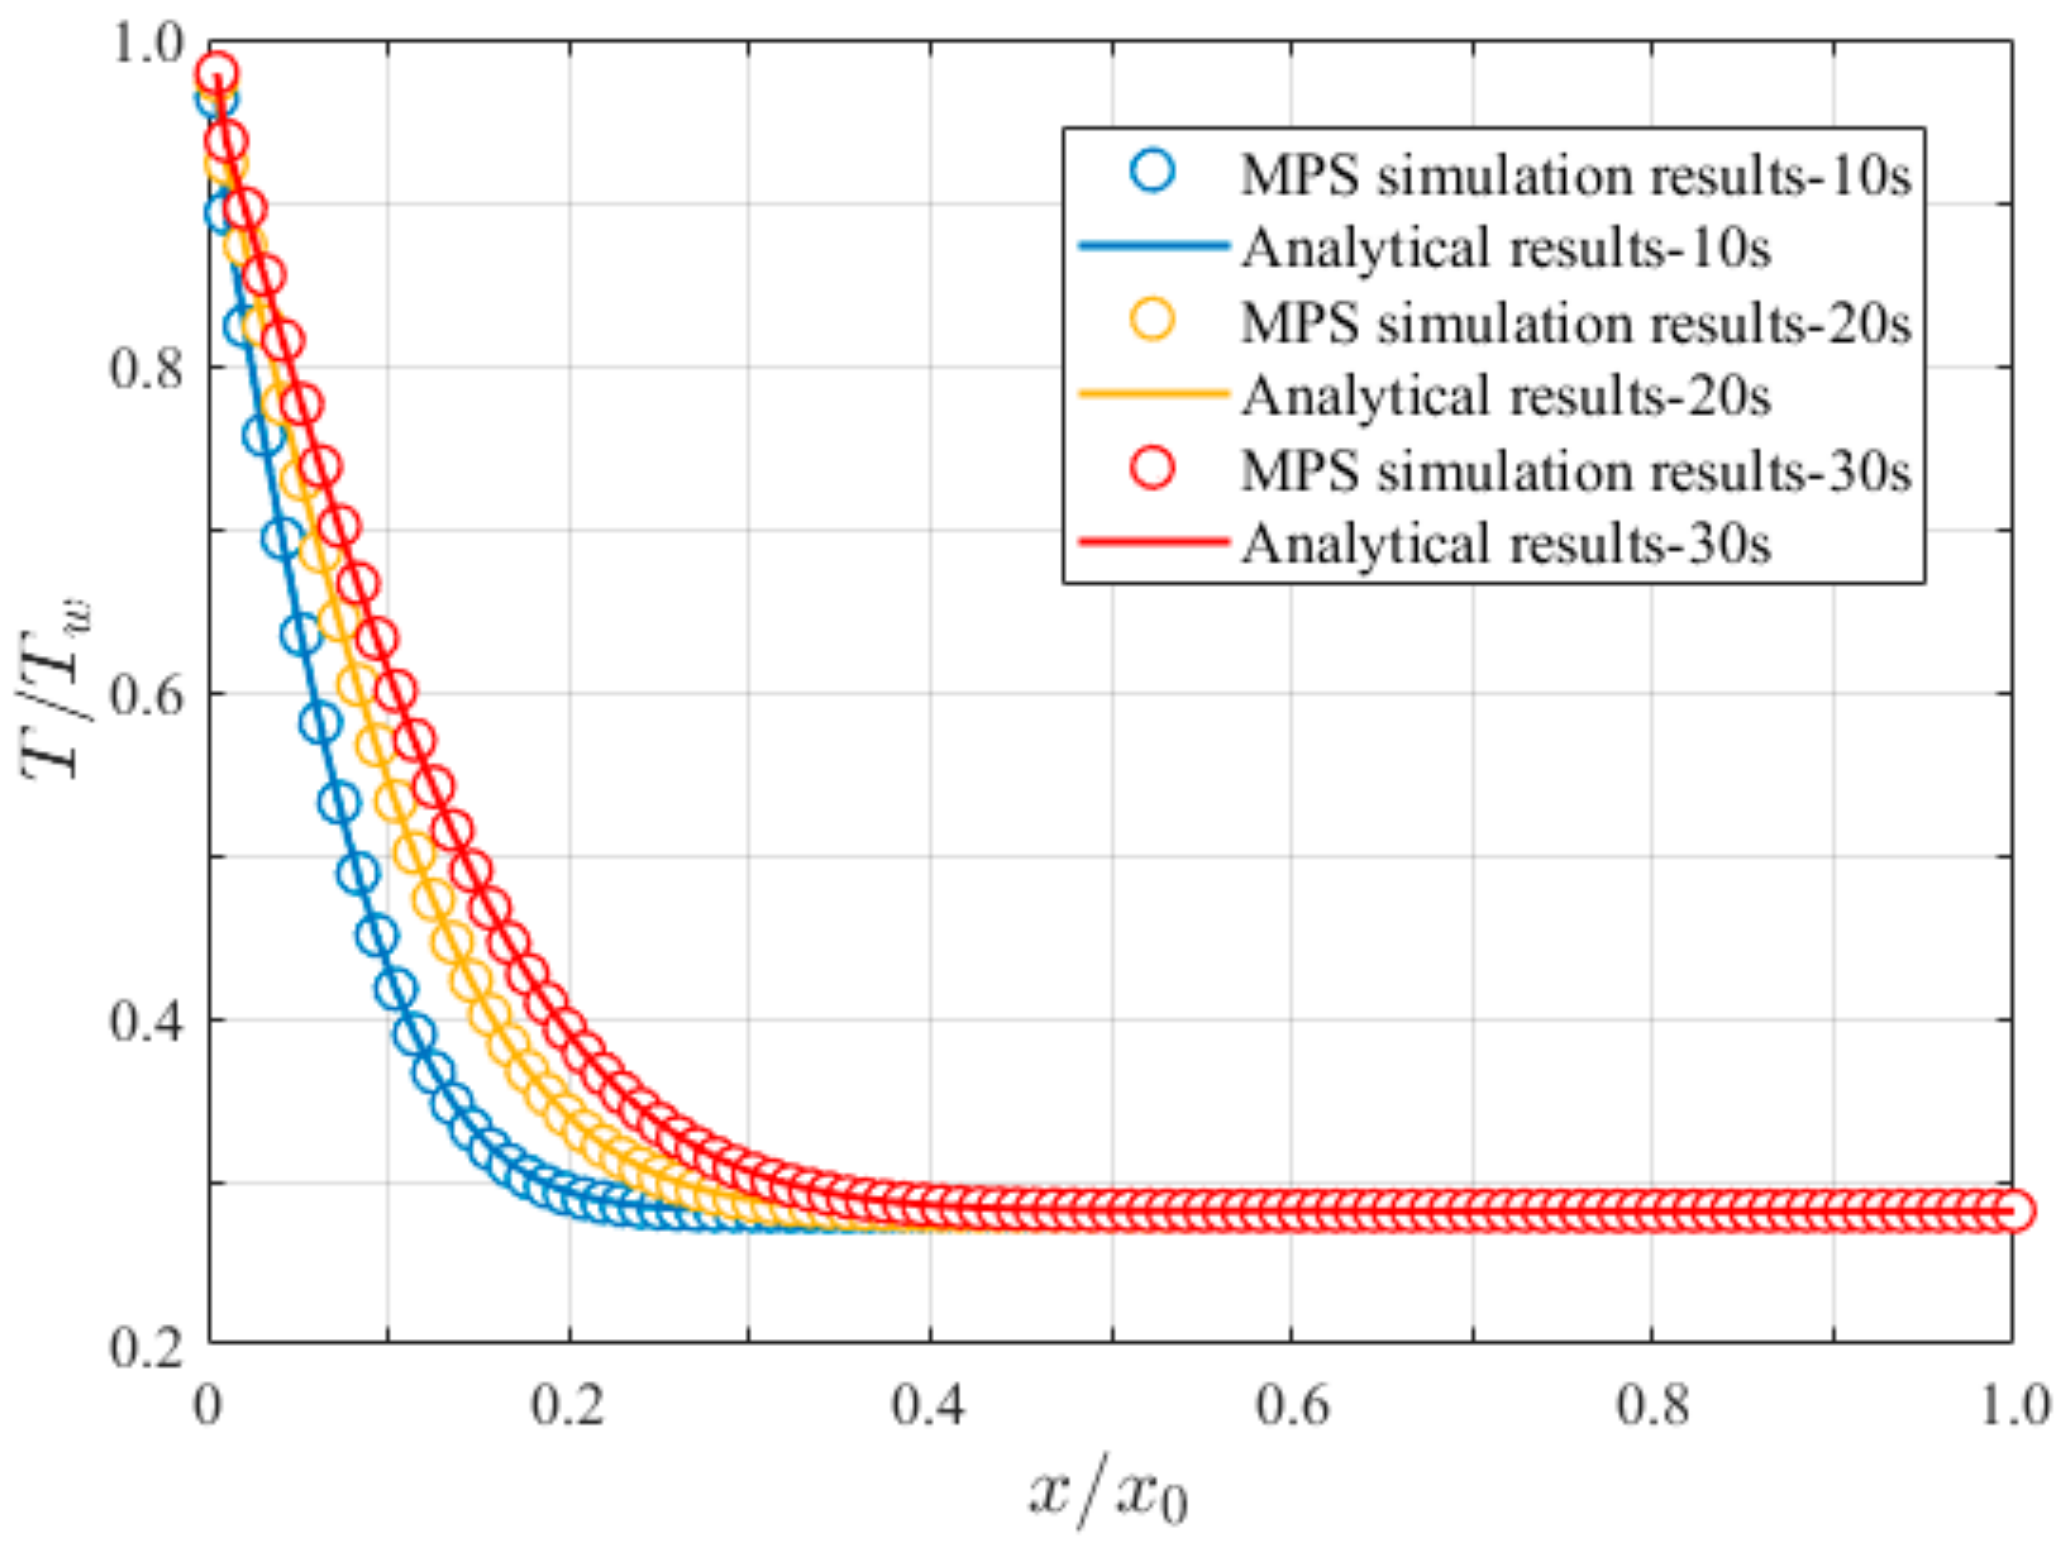
where T(x,t) denotes the temperature at time t and location x, and erf is the error function. Figure 8 shows the temperature distribution over time; as the simulation proceeds, the high-temperature region expanded along the x-axis coordinate under the effect of temperature difference. The temperature distribution and the analytical solution are in good agreement.

3.2. Pool Boiling on Bared Surfaces

In Figure 9, the bubble growth rate calculated by the present method is compared to the experimental results reported by Han and Griffith [4]. According to the experiment condition, the wall superheats, bulk temperature, and initial bubble diameter in the simulation were set to be 10 °C, 96 °C, and 0.6 mm, respectively. In addition, slope C0 in the micro-layer model was determined to be 4.42 × 10⁻³ in this case. Figure 9 shows great agreement between the present simulation and experimental results, and the maximum relative error between the simulation and experiment is less than 6%. The bubble diameter grew fast in the early stage up to 5 ms, and grew more slowly after 10 ms since the micro-layer dried up. Incidentally, the initial particle distance l0 in all cases of this study was set to be 2.0 × 10⁻⁵ m to make sure the finest simulation results could be achieved.
Notice that the simulation was carried out without the micro-layer model, which makes the method more similar to the one proposed by YOON et al. [43]. This is also indicated in Figure 9. The blue dashed line in Figure 9 cannot reflect the real behavior in the experiments, and the bubble growth rate hardly changed during the whole process. This provides evidence that the micro-layer model is necessary for pool boiling bubble growth simulation.
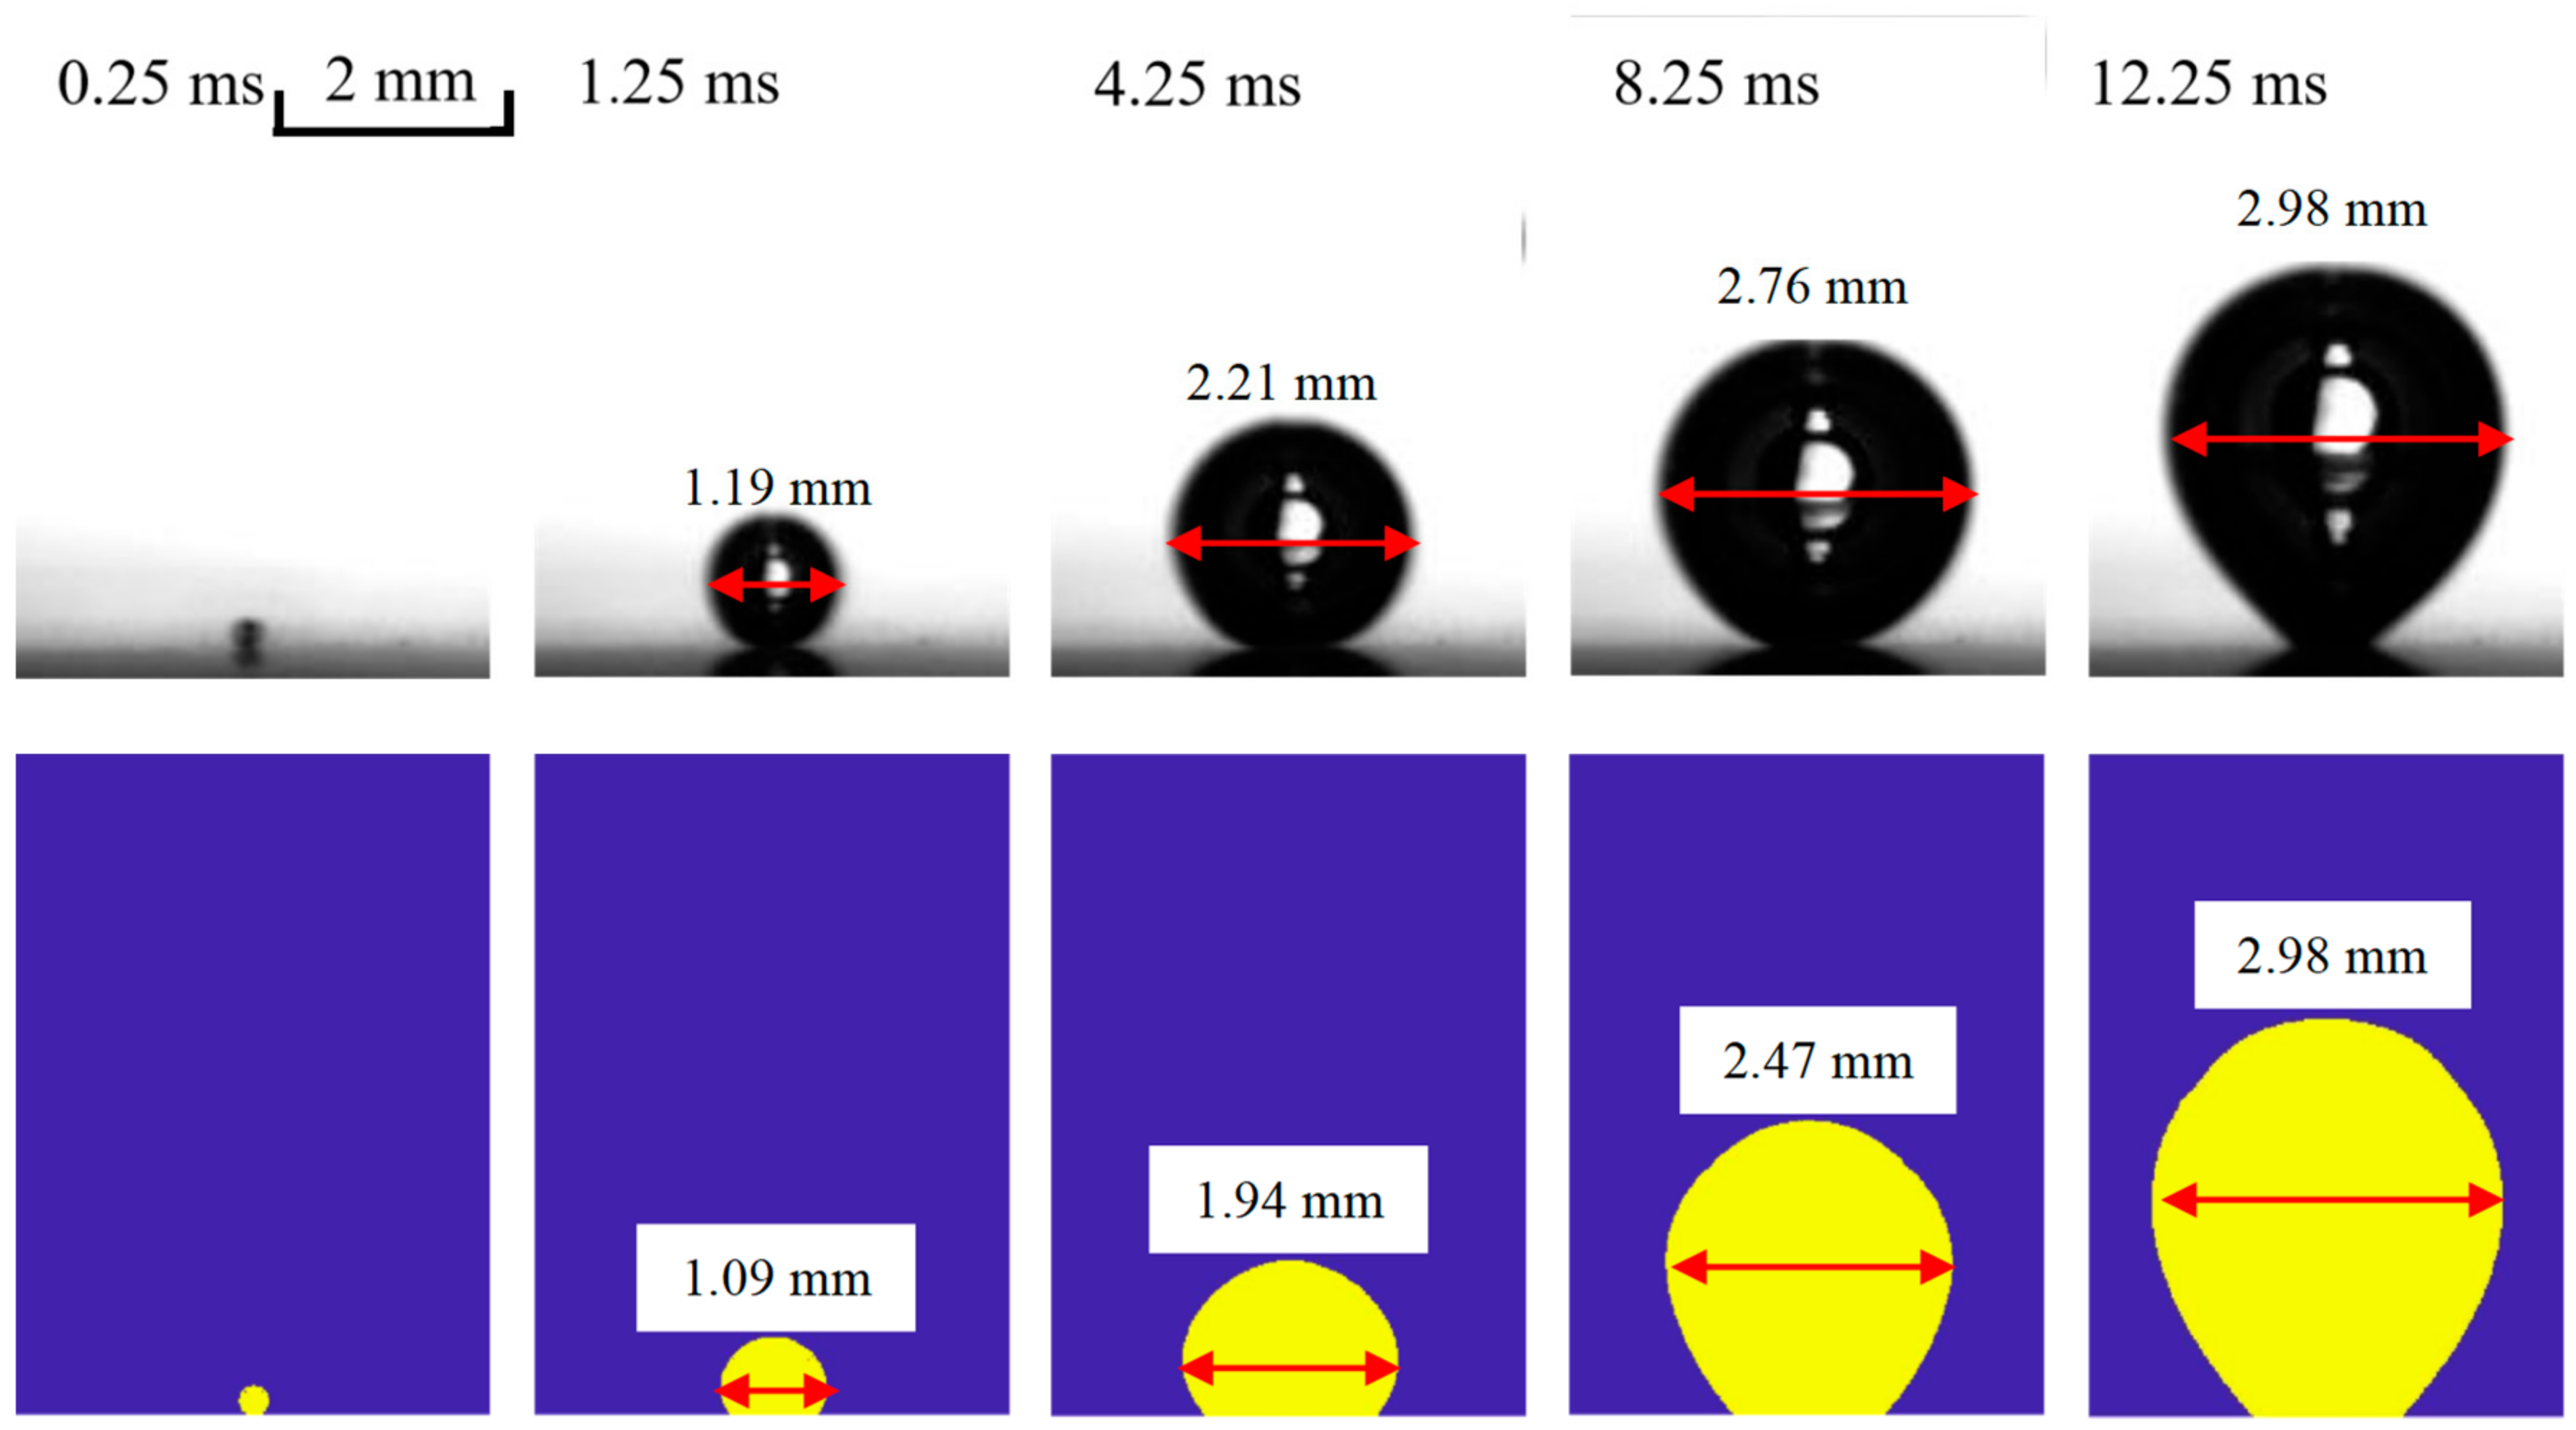
To validate the accuracy of the current method in simulating the pool boiling bubble growth on bared surfaces, an unpublished visualization study about the pool boiling bubble growth on the ITO heater carried out by the author was adopted. Figure 10 compares the growth process of a pool boiling bubble at wall superheat ΔTw = 7.22 °C between the HSV snapshots and the present simulation. The bulk temperature was 100 °C, the contact angle between DI water and the bared ITO heater was considered to be 45°, and the initial bubble size was set to be 0.4 mm in the simulation. C0 in Equation (12) was 4.25 × 10⁻³ in this case.
The predicted bubble sizes agree well with the visualized experimental results. However, current simulations were carried out in 2D, and the liquid reflux at the bottom of the bubble was far from the real situation in the experiment. This led to a gap between the predicted and experimental bubble departure time, which was 24.0 ms in the simulation and 22.15 ms in the experiment. Thus, we only focused on the bubble growth behavior on the heating surface in current research, and the bubble departure behavior was not strictly discussed.
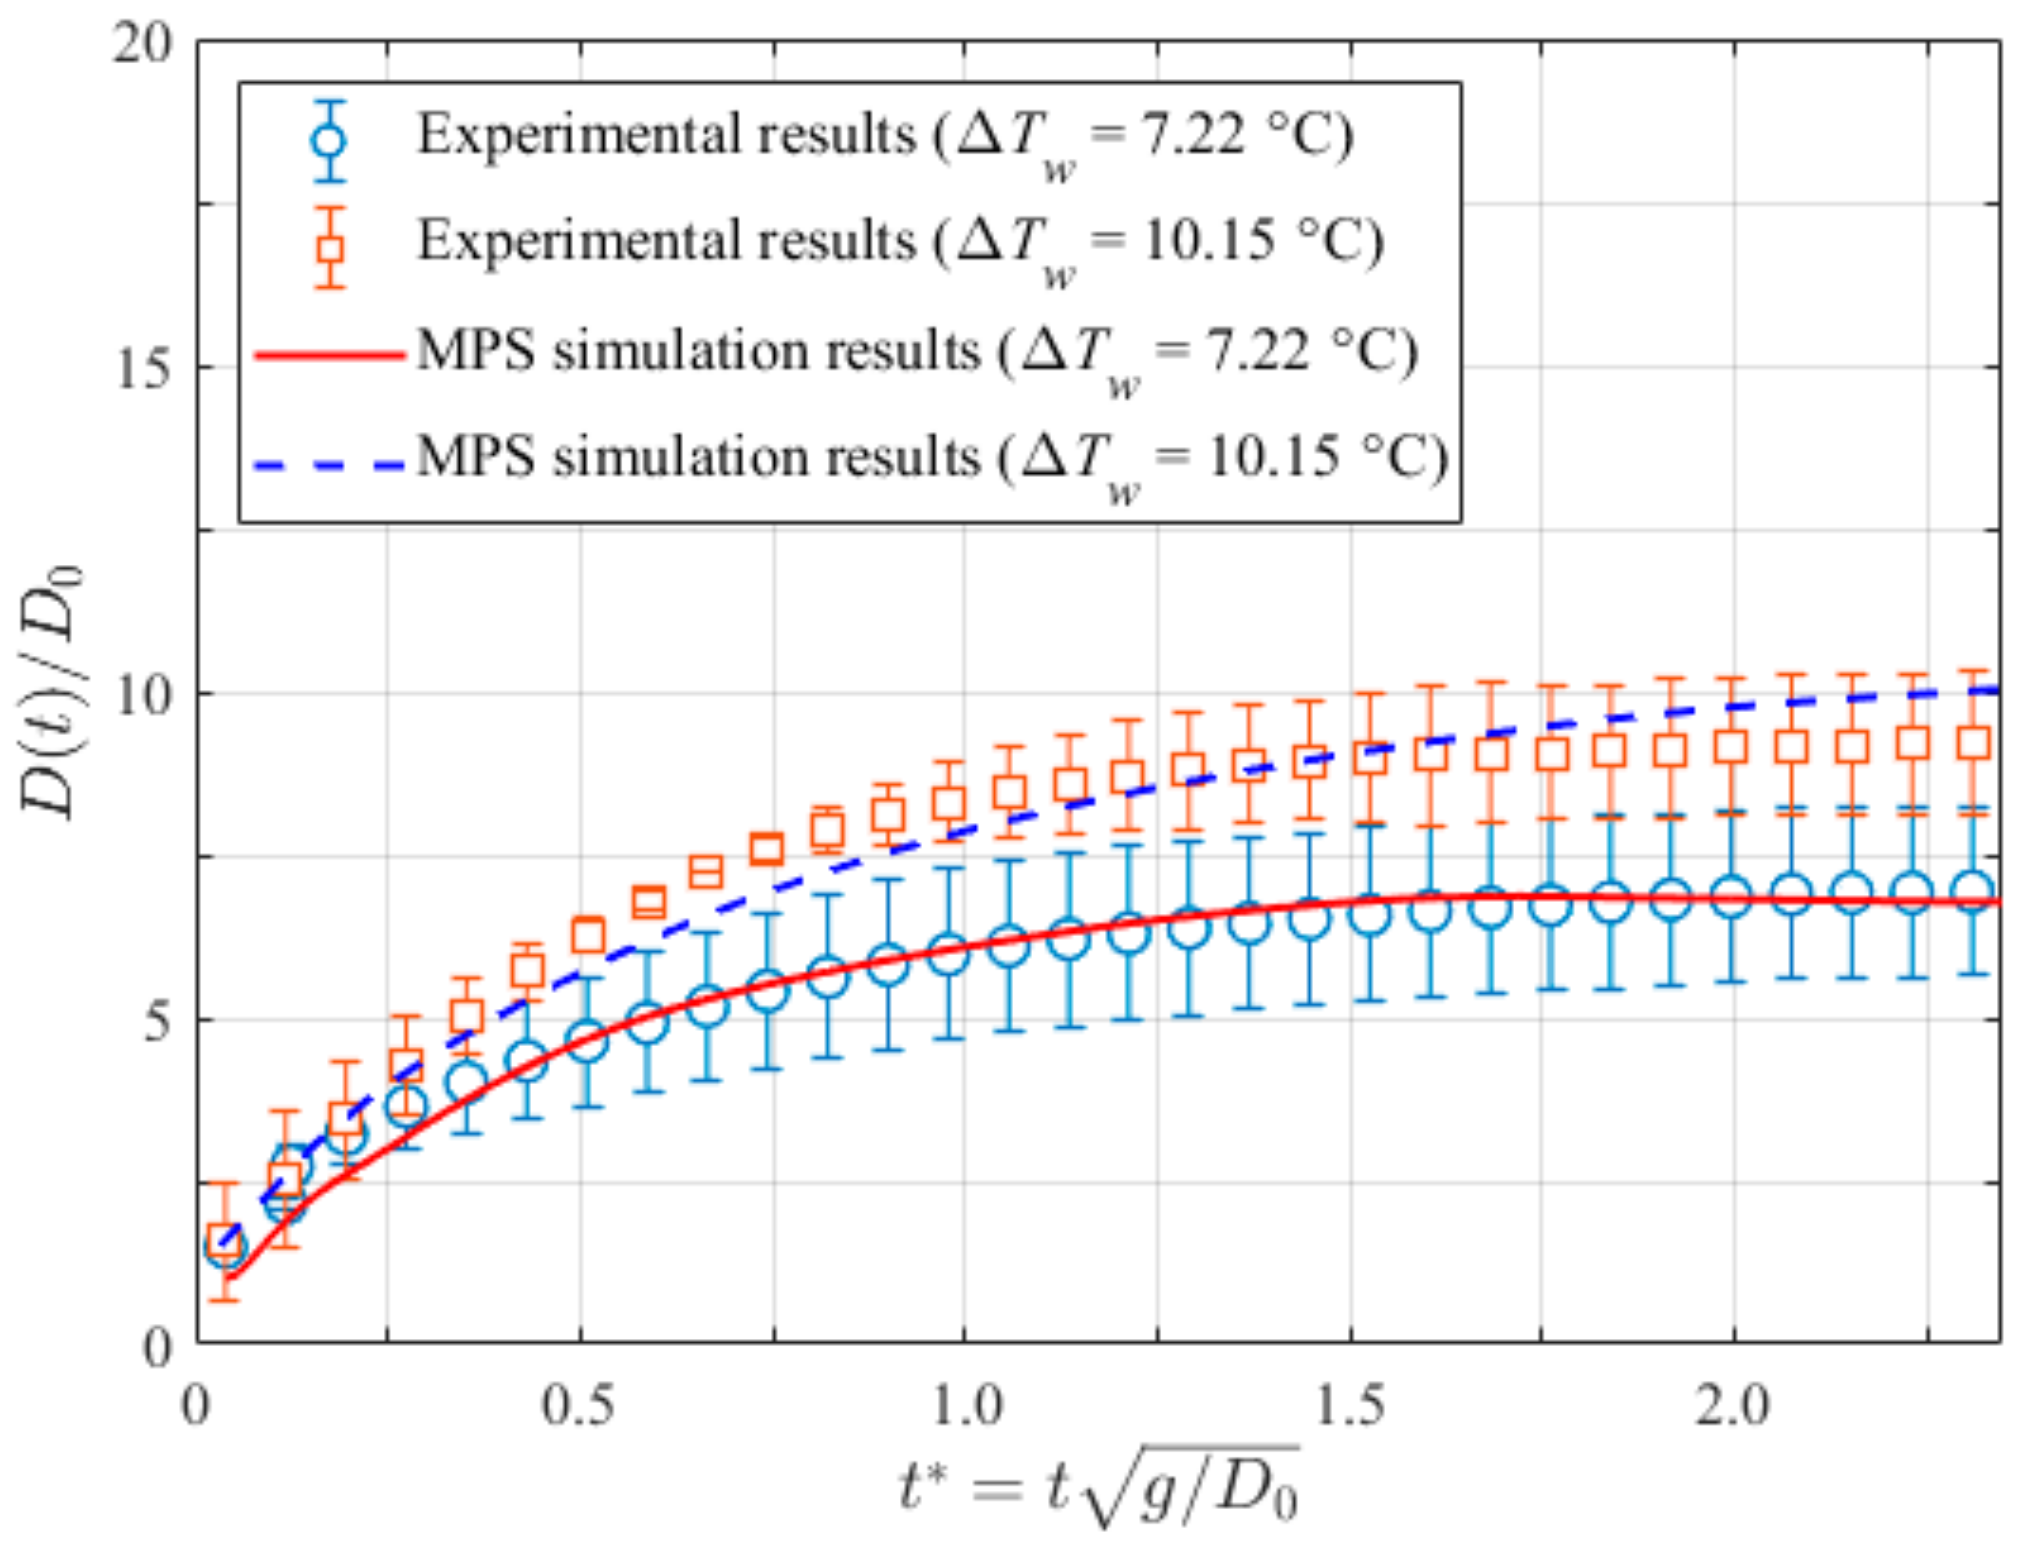
Figure 11 indicates good quantitative comparisons between the simulations and experiments. Another set of bubble growth data at ΔTw = 10.15 °C was also included (the initial bubble size was set to be 0.6 mm in the simulation, and C0 = 4.25 × 10⁻³). The error bar shows the standard deviation of three different individual bubbles’ data at each wall superheat. The accuracy of the current method in simulating bubble growth on the bared boiling surface was validated.

3.3. Pool Boiling on the Layer-by-Layer (LbL) Nano-Structured Surfaces

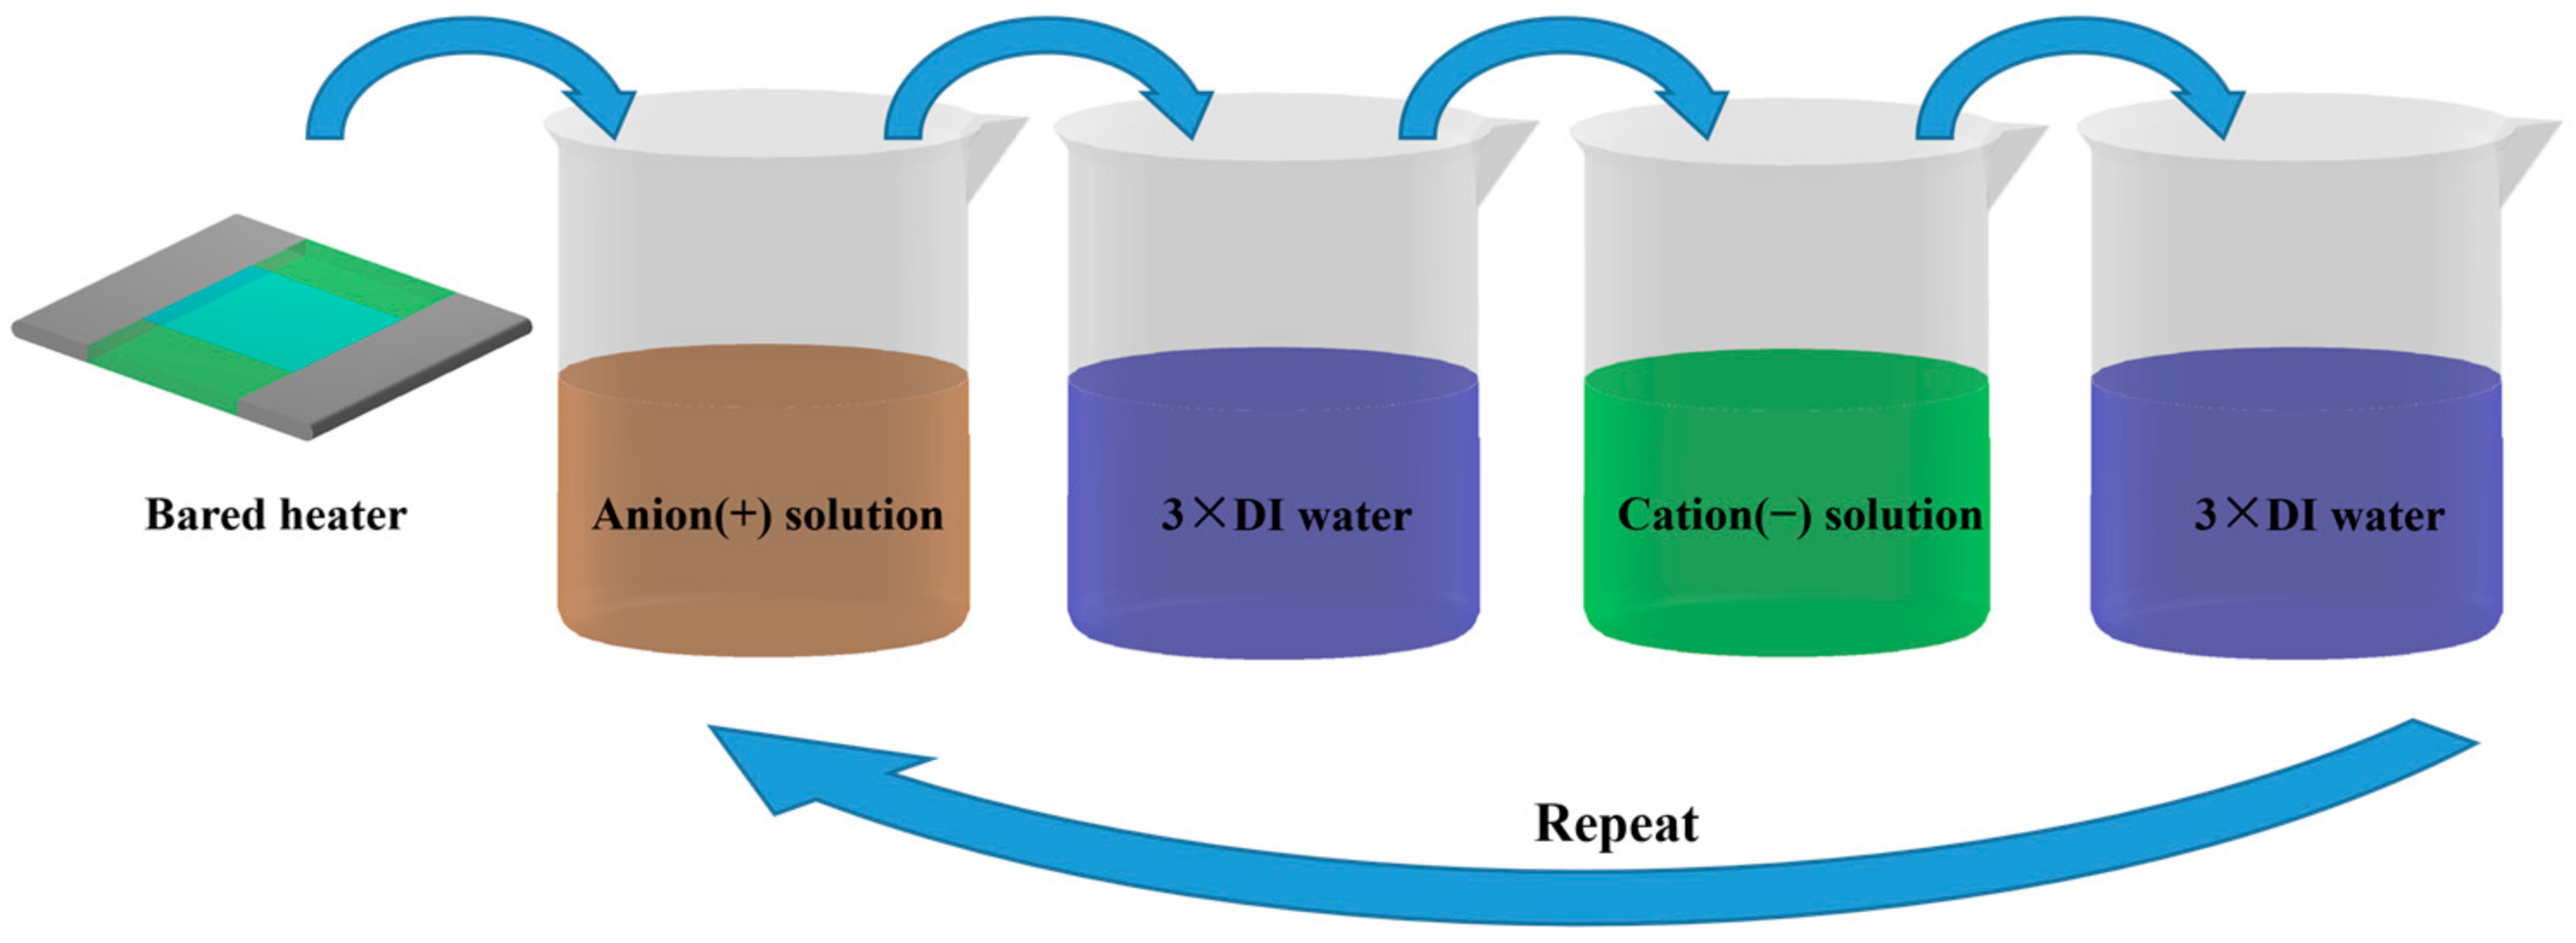
This paper mainly focuses on simulating the pool boiling bubble growth on nano-structured surfaces fabricated by the LbL technique. The main idea of this technique is to dip a substrate into the cationic polymer and anionic nanoparticle solutions to create a nanoparticle bilayer. The different charge promotes nanoparticle adsorption onto the substrate, resulting in a uniform smooth porous layer. The thickness of the porous layer can be easily controlled by changing the number of bilayer dipping procedures. The detailed fabrication procedure was outlined in the study of Tetreault-Friend et al. [40], and a brief schematic of the LbL dipping procedure can be also found in Figure 12.
Table 1 summarizes the surface parameters of LbL nano-structured ITO heaters with different numbers of bilayers. These parameters were tested in the Microsystems Technology Laboratories (MTL) during the author’s stay at MIT and were the input for the calculation of the nano-structure model.
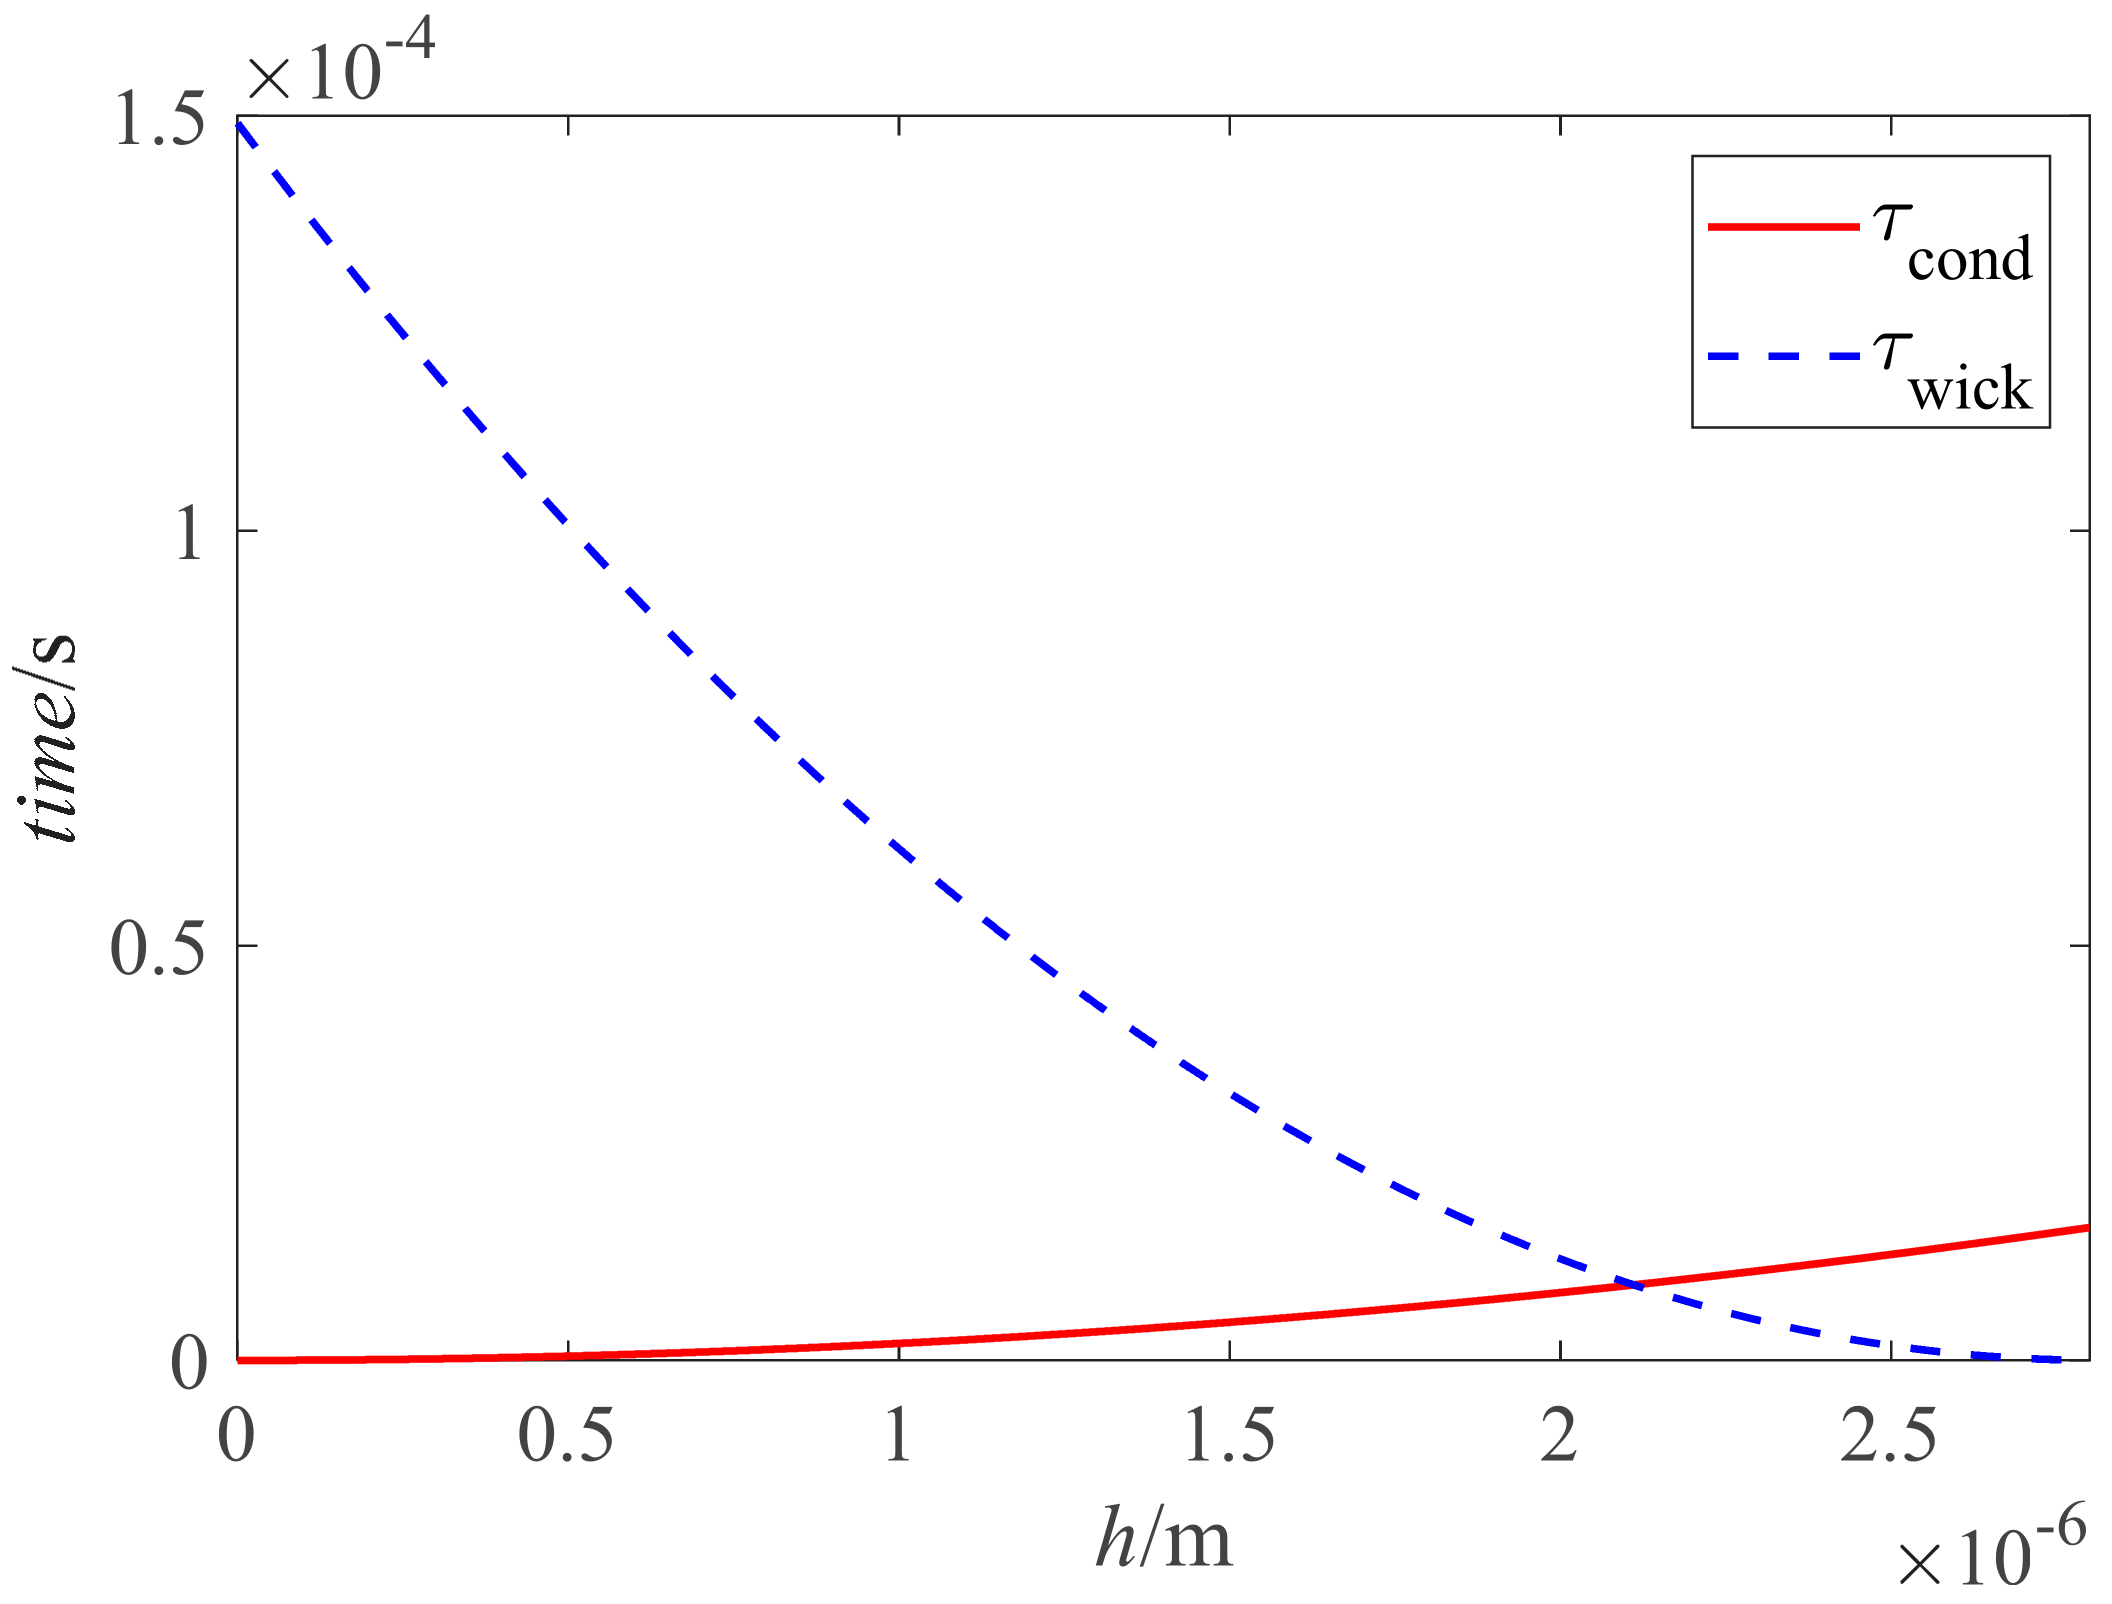
Before we conducted the bubble growth simulation on LbL heater, the interface height hc shown in Equations (23) and (24) was first determined first. Taking the 100 bilayers LbL heater as an example, curves of Equations (18) and (21) were plotted in Figure 13, where the abscissa of the intersection point of two curves indicates that hc = 2.1 × 10⁻⁶ m when the nano-structure thickness is 2.76 μm. Then, the nano-structure model shown in Equation (24) could be solved.
Figure 14 demonstrates reasonable simulation results of the bubble growth on the 100 bilayers LbL heater. The wall superheat was 22.69 °C, the bulk temperature was 100 °C, the initial bubble diameter was 0.7 mm, the contact angle between the liquid and the heater was 5° due to the super hydrophilic LbL nano-structure, and the constant C0 in the micro-layer model was set to be 3.43 × 10⁻³. Compared with the experimental snapshots, the present method successfully describes the bubble growth behavior on the 100 bilayers LbL surfaces. The bubble’s aspect ratio was larger than that on the bared surface due to the larger inertia force caused by the higher wall superheat and evaporation of the wicked fluid inside the nano-structure. The bubble departure time was 26.5 ms in the experiment, while it was 37.5 ms in the simulation.
The comparison shown in Figure 15 also quantitatively proves the correctness and accuracy of the current method. The largest relative error between the experiment and simulation was less than 5%.

4. Results and Discussion

4.1. Variation of Micro-Layer Radius and Thickness

The variation of the micro-layer beneath the growing bubble is a research emphasis in this study. According to Equation (14), the heat flux transferred through the micro-layer was proportional to the micro-layer’s occupied area, while it was inversely proportional to its thickness. The last three validation simulation cases in Section 3 are further studied in this part.
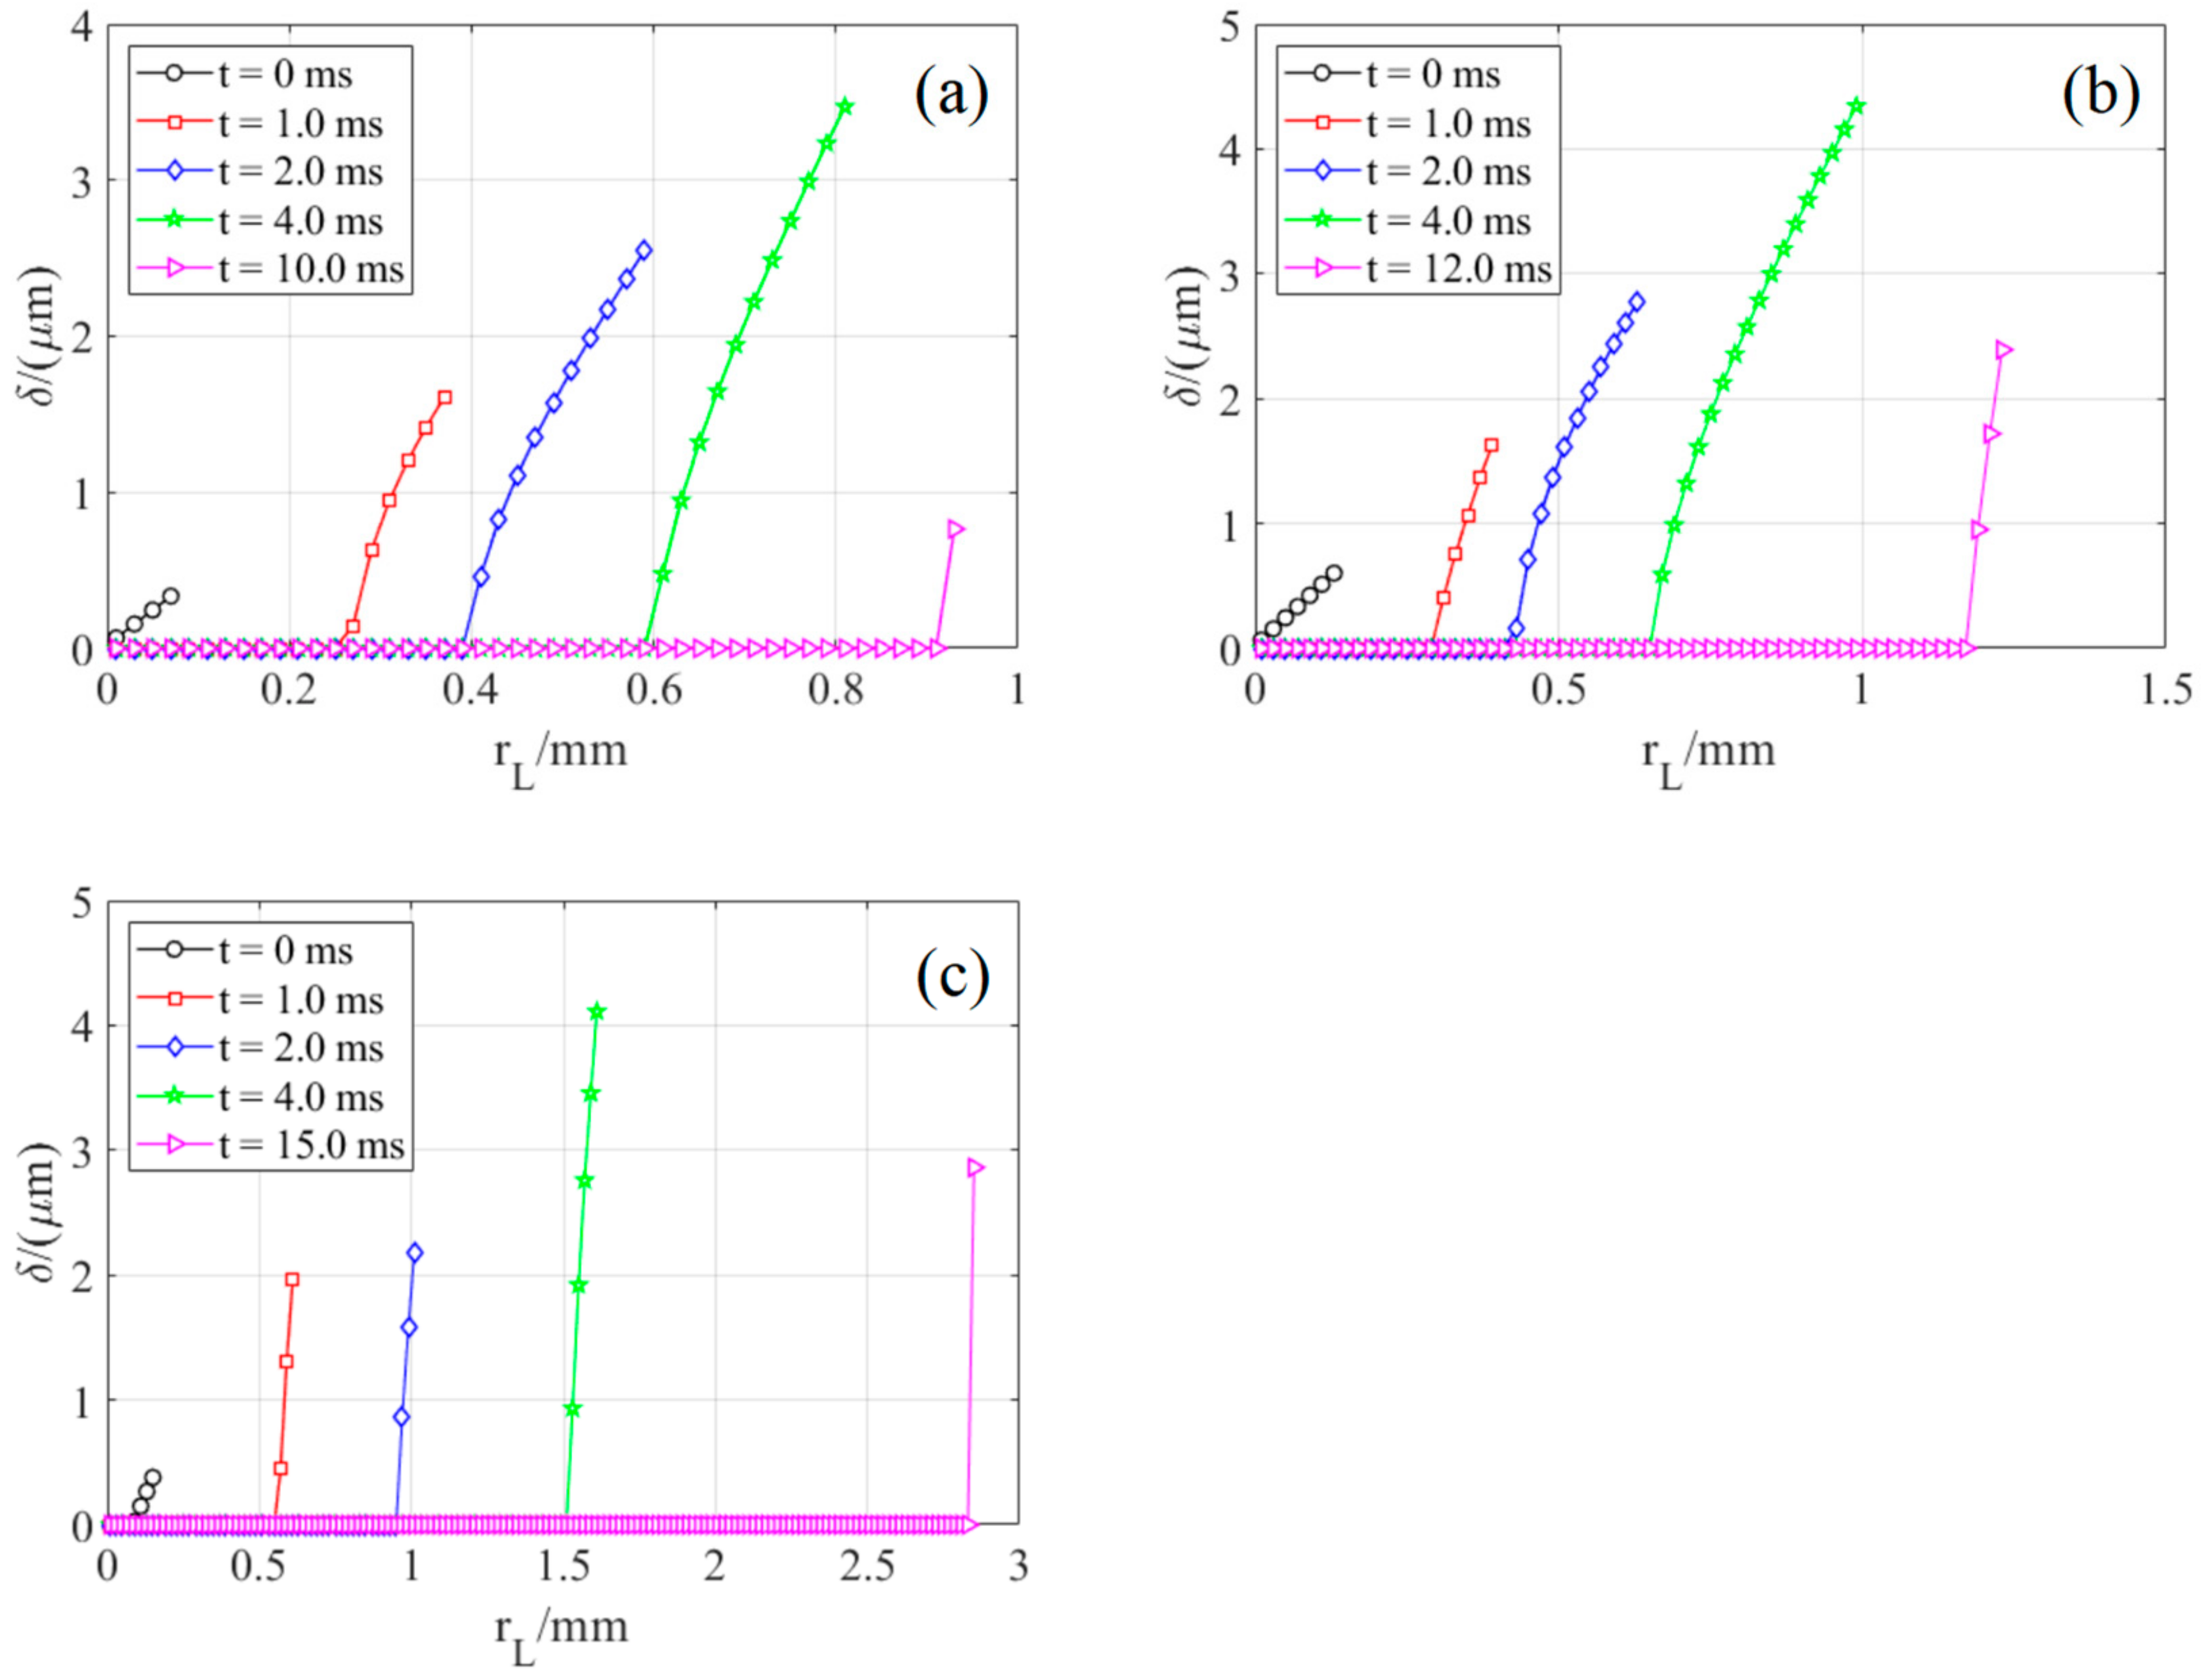
Figure 16 indicates distributions of micro-layers’ thickness in different cases at different times, where rL = 0 is the position of the nucleation site. With the bubble growth, the dry area beneath the bubble increased. The micro-layers’ max thickness in the different cases all increased first and then decreased. At the beginning of the bubble growth, the bubble footprint expanded sharply, and new micro-layers were continuously generated. According to Equation (12), the initial micro-layer’s thickness was proportional to the distance between the current position and the nucleation site; thus, the max thickness of the micro-layer increased in the first stage of the bubble growth. At the final stage of bubble growth, the bubble started to float, the bubble footprint stopped expanding, and the maximum thickness of the micro-layers decreased due to the evaporation.
Comparing sub-plots in Figure 16, one can find the influence of the wall superheat on the variation of the micro-layer. The micro-layer evaporated faster at a higher wall superheat, and the dry area was larger at the same time. However, the bubble growth rate was also larger at a higher wall superheat, leading to the thicker, newly generated micro-layer. Thus, the micro-layer dried up later on the higher-temperature surface.

4.2. Analysis of Heat Transfer Process

The heat transfer process of the bubble growth is analyzed in this section. As stated above, the quantity of heat in the bubble growth process mainly comes from the superheated fluid and the micro-layer. For the nano-structured surface, the evaporation of the wicked fluid cannot be neglected.
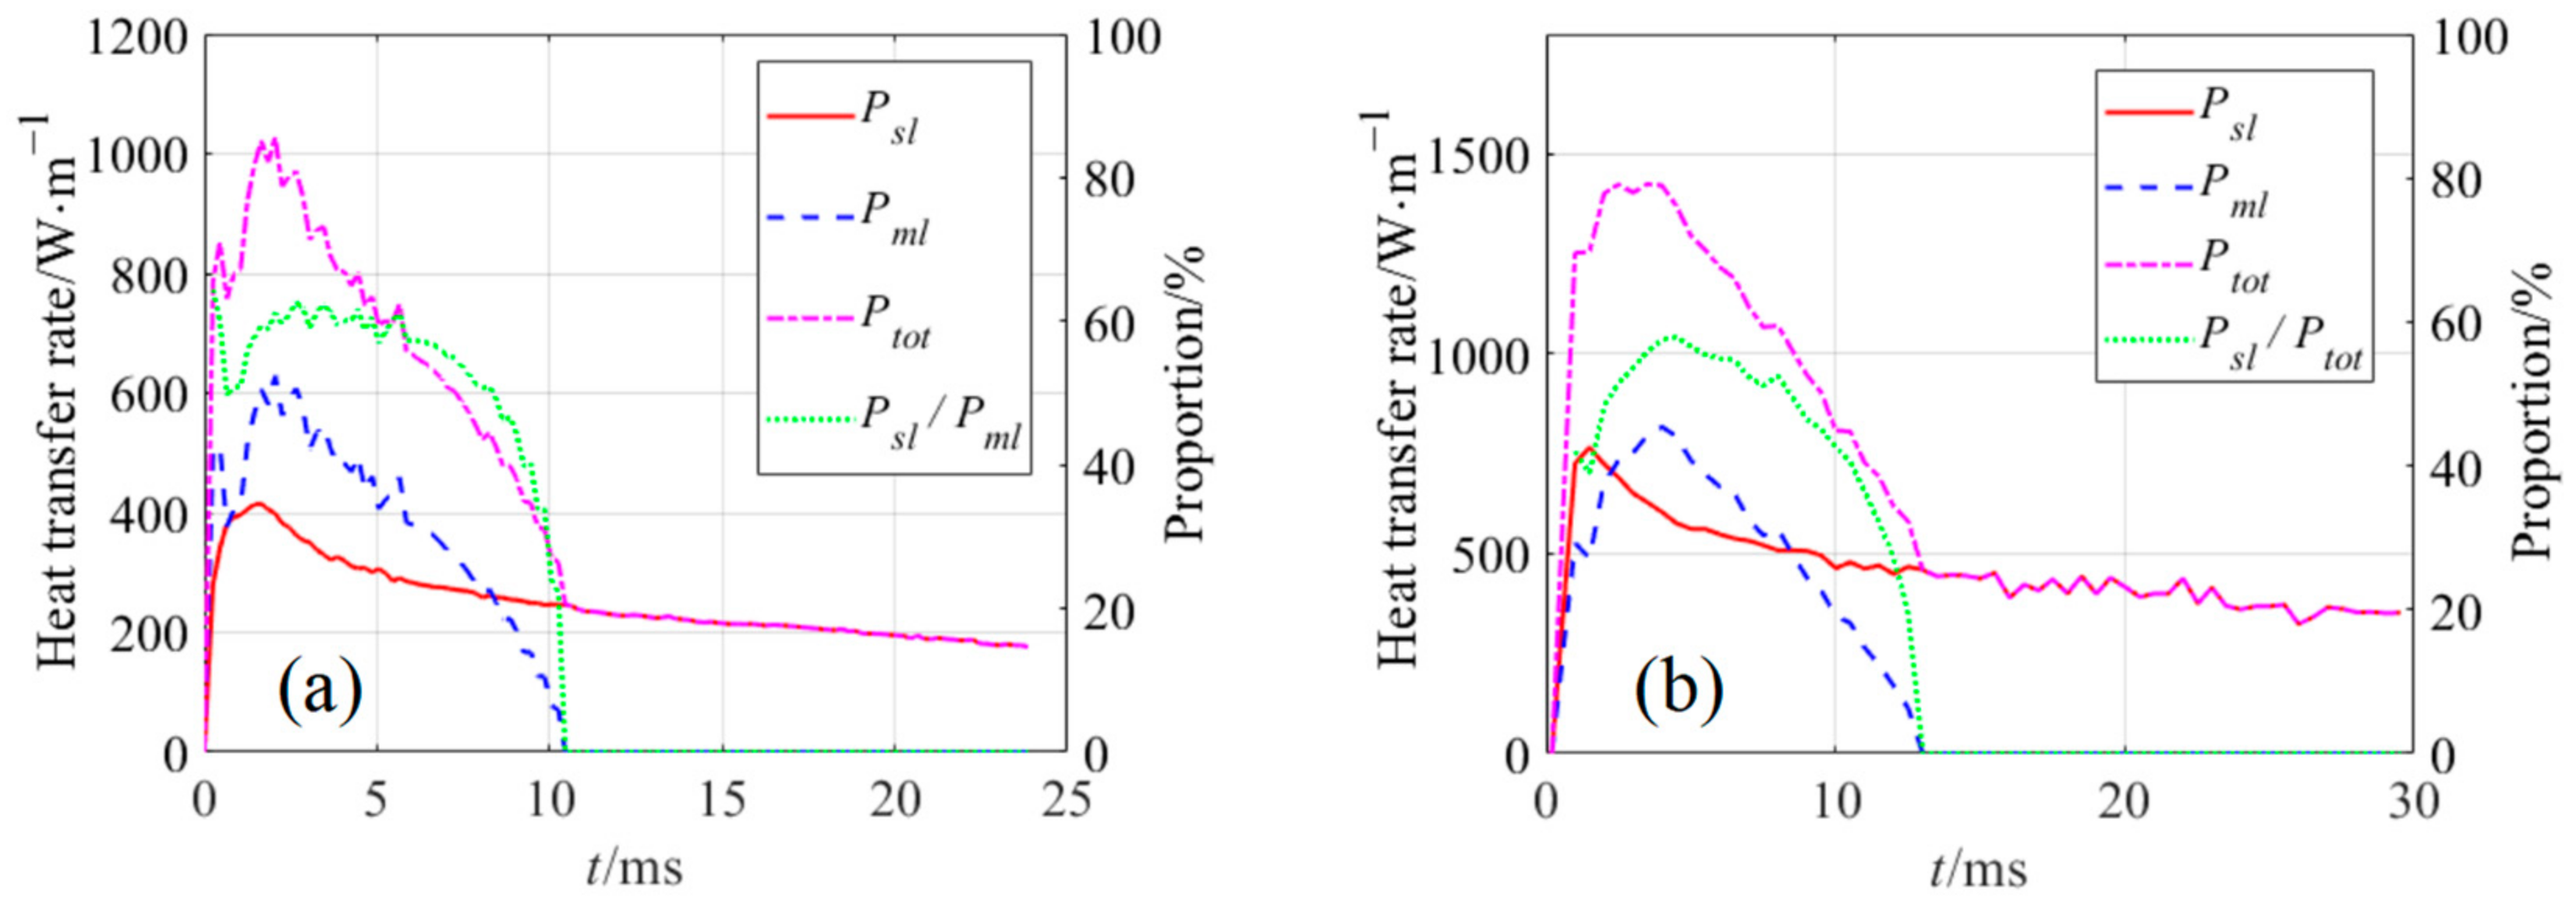
Figure 17 shows the computed time histories of the heat transfer rates delivered to the bubble on the bared heater by the superheated fluid (Psl), the micro-layer (Pml). The total heat transfer rate (Ptot), and the proportion of Pml in the Ptot are also indicated. Both Psl and Pml increased sharply at the beginning of the bubble growth, and they decreased when the bubble started to float.
The micro-layer’s variation of heat transfer rate was consistent with its variation of the radius and thickness discussed in Section 4.1. At the beginning of the bubble growth, the heat transfer rate delivered through the micro-layer was smaller due to the thicker thickness; however, the micro-layer’s occupied area increased quickly during this period. Thus, the Pml generally increased at the beginning. At the final stage of the bubble growth, although the micro-layer’s thickness was thinner, the dry spot beneath the bubble was dominated, leading to the decrease of the Pml. For the superheated fluid heat transfer rate, the bubble grew inside the superheated layer, and as the liquid/vapor interface expanded, the Psl increased. However, when the bubble grew into the bulk fluid, the temperature of the fluid decreased, leading to the fading of Psl.
As indicated by the green dotted line in Figure 17, the peak value of the Pml‘s proportion in the Ptot was around 60% which means the micro-layer’s evaporation was dominated at the beginning of the bubble growth. The time integral proportion of the Pml in the whole bubble growth process was 40.55% in the ΔTw = 7.22 °C case and 32.23% in the ΔTw = 10.15 °C case. The values were 62% and 52% in Sato’s [29] and Chen’s [58] studies, respectively. This difference may come from the different initial conditions. Moreover, the construction of the superheated layer was not included in their research, leading to a higher proportion of the micro-layer heat transfer rate.
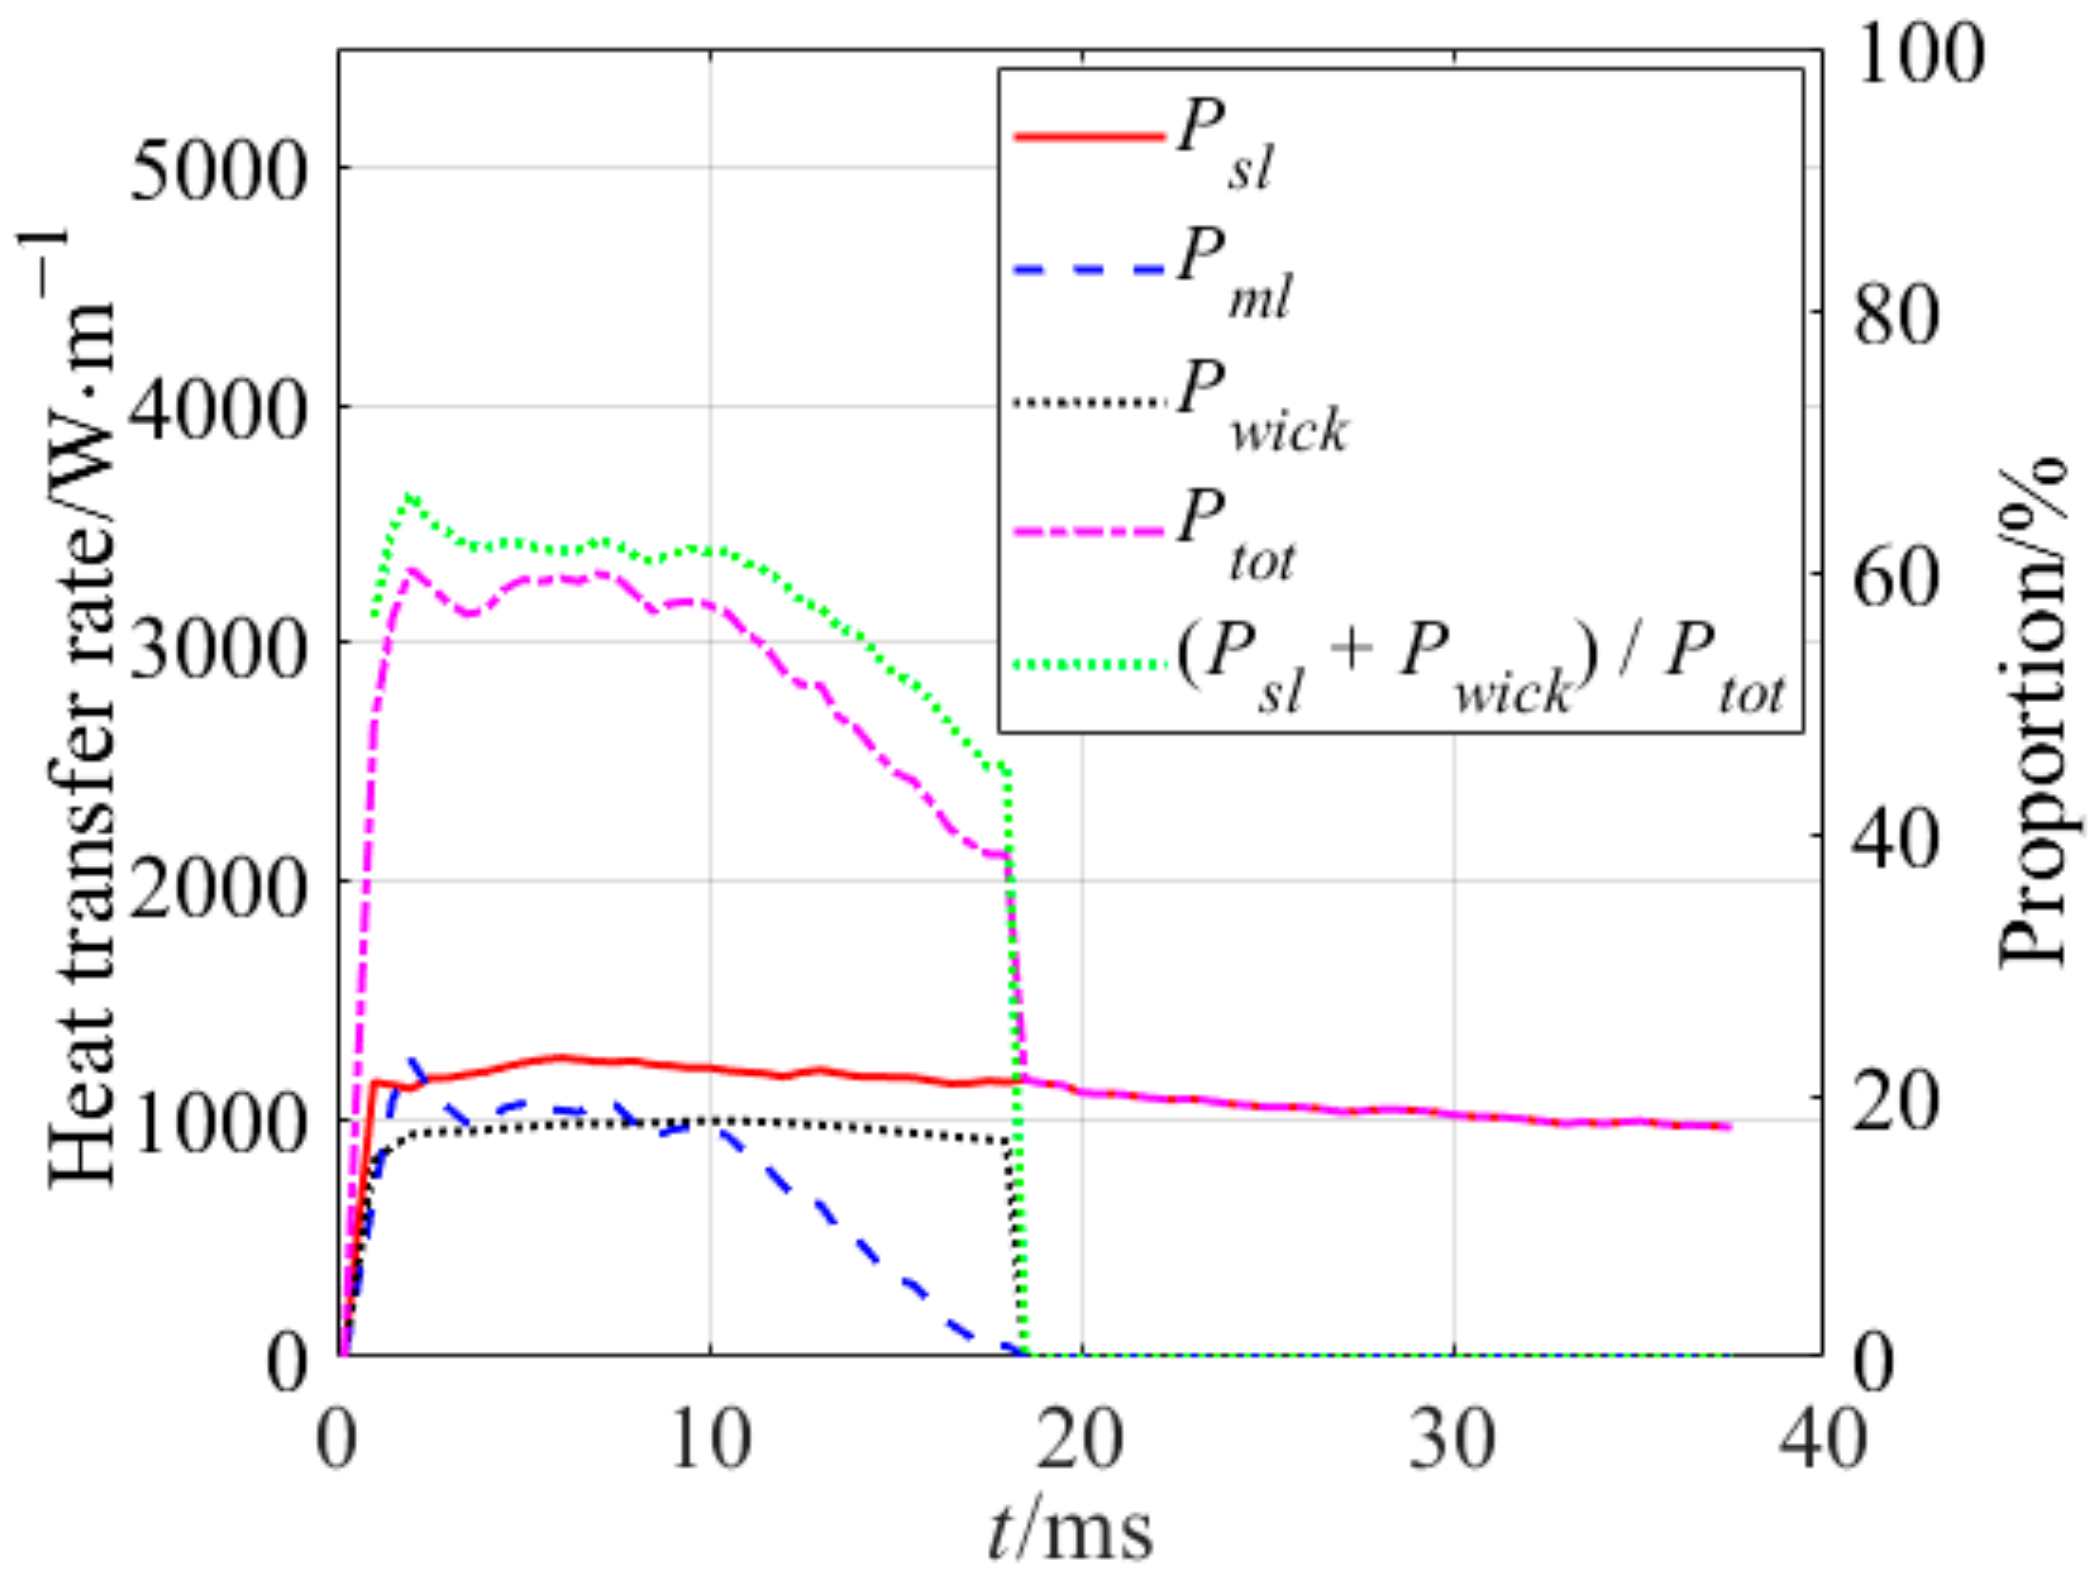
The bubble growth heat transfer analysis on the 100 bilayers LbL heater is demonstrated in Figure 18, and the heat transfer rate of the wicked fluid (Pwick) is indicated. Due to the higher wall superheat and the existence of the nano-structure, the total heat transfer rate, in this case, is larger than that in the above two cases. The Pwick increased quickly to its maximum value at the very beginning of the bubble growth and almost remained constant until the micro-layer dried up. The nano-structure provided a significant contribution. The Pwick was slightly lower than the Pml at first and then it overtook the Pml when the micro-layer gradually evaporated. The ratio of the time integral of Pwick and Pml was 14:11 in the whole bubble growth process.
The existence of the nano-structure is considered to directly enhance the evaporation beneath the bubble by feeding the micro-layer. The green dotted line in Figure 18 shows the proportion coupled Pwick and Pml. About 42.13% of the heat transfer rate was contributed by the micro-layer and the wicked fluid inside the nano-structure in the present case.
These conclusions give us a quantitative awareness of the heat transfer process during the bubble growth on the nano-structured surface and further reveal the necessity of the micro-layer and nano-structure models in numerical simulation studies.

5. Conclusions

A dynamic micro-layer model and nano-structure model were proposed based on the MPS-MAFL method. The present method is applicable to simulate the pool boiling bubble growth behavior on heating surfaces, especially on the nano-structured surface. The main conclusions of the current study are as follows:
(1)
Corresponding experiments were adopted as validations for the present method. The comparisons between the computed and experimental bubble growth rates showed great agreement. The maximum relative error was less than 5%, which reveals the robustness of the current method in simulating the growing bubble on both bared and nano-structured surfaces.
(2)
Micro-layers beneath bubbles were investigated. Variations of their thickness and occupied area were successfully captured. The micro-layers’ max thickness was found to increase first and then decrease in all cases. The proportion of Pml in the bubble growth process on the bared surface was 40.55% at ΔTw = 7.22 °C and 32.23% at ΔTw = 10.15 °C, which is strong evidence that the micro-layer evaporation cannot be neglected during the pooling boiling simulation.
(3)
The heat transfer process was investigated during bubble growth. The heat transfer contributions of the micro-layer and the wicked fluid were about 42.13% in the bubble growth on the nano-structured heater. The ratio of Pwick and Pml was 14:11.
(4)
The current research was the first attempt at directly simulating the bubble growth on the nano-structure. Simulations in this study give us a quantitative awareness of the heat transfer process during the bubble growth on the nano-structured surface.

Author Contributions

Data curation, K.G. and S.L.; Formal analysis, K.G.; Funding acquisition, G.S.; Investigation, K.G. and S.L.; Methodology, K.G., R.C. and M.W.; Project administration, W.T. and S.Q.; Writing—original draft, K.G.; Writing—review and editing, Y.Z., S.L. and K.G. All authors have read and agreed to the published version of the manuscript.

Funding

The present study is supported by the National Natural Science Foundation of China (No. 12105215), the China Postdoctoral Science Foundation (No. BX2021236) and the CNNC Science Fund for Talented Young Scholars.

Acknowledgments

The author thanks Matteo Bucci from MIT NSE department for affording a one-year visiting opportunity.

Conflicts of Interest

The authors declare no conflict of interest.

References

  1. Kutateladze, S.S. Heat Transfer in Condensation and Boiling; AEC-tr-3770; US Atomic Energy Commission, Technical Information Service: Washington, DC, USA, 1952.
  2. Zuber, N. On the instability of boiling heat transfer. Trans. ASME 1958, 80, 711–720. [Google Scholar]
  3. Zuber, N. Hydrodynamic Aspects of Boiling Heat Transfer; AEC Report; United States Atomic Energy Commission, Technical Information Service: Washington, DC, USA, 1959.
  4. Chi-Yeh, H.; Griffith, P. The mechanism of heat transfer in nucleate pool boiling—Part I: Bubble initiaton, growth and departure. Int. J. Heat Mass Transf. 1965, 8, 887–904. [Google Scholar] [CrossRef]
  5. Lienhard, J.H.; Dhir, V.K. Hydrodynamic Prediction of Peak Pool-boiling Heat Fluxes from Finite Bodies. J. Heat Transf. 1972, 95, 152–158. [Google Scholar] [CrossRef]
  6. Dhir, V.K.; Liaw, S.P. Framework for a Unified Model for Nucleate and Transition Pool Boiling. J. Heat Transf. 1989, 111, 739–746. [Google Scholar] [CrossRef]
  7. Kandlikar, S.G. A Theoretical Model to Predict Pool Boiling CHF Incorporating Effects of Contact Angle and Orientation. J. Heat Transf. 2000, 123, 1071–1079. [Google Scholar] [CrossRef] [Green Version]
  8. Ahn, H.S.; Lee, C.; Kim, H.; Jo, H.; Kang, S.; Kim, J.; Shin, J.; Kim, M.H. Pool boiling CHF enhancement by micro/nanoscale modification of zircaloy-4 surface. Nucl. Eng. Des. 2010, 240, 3350–3360. [Google Scholar] [CrossRef]
  9. Chu, K.-H.; Enright, R.; Wang, E.N. Structured surfaces for enhanced pool boiling heat transfer. Appl. Phys. Lett. 2012, 100, 241603. [Google Scholar] [CrossRef]
  10. Kim, S.; Bang, I.; Buongiorno, J.; Hu, L. Surface wettability change during pool boiling of nanofluids and its effect on critical heat flux. Int. J. Heat Mass Transf. 2007, 50, 4105–4116. [Google Scholar] [CrossRef]
  11. Bang, I.C.; Chang, S.H. Boiling heat transfer performance and phenomena of Al2O3–water nano-fluids from a plain surface in a pool. Int. J. Heat Mass Transf. 2005, 48, 2407–2419. [Google Scholar] [CrossRef]
  12. Pham, Q.; Kim, T.; Lee, S.; Chang, S. Enhancement of critical heat flux using nano-fluids for Invessel Retention–External Vessel Cooling. Appl. Therm. Eng. 2012, 35, 157–165. [Google Scholar] [CrossRef]
  13. Liu, Z.-H.; Liao, L. Sorption and agglutination phenomenon of nanofluids on a plain heating surface during pool boiling. Int. J. Heat Mass Transf. 2008, 51, 2593–2602. [Google Scholar] [CrossRef]
  14. Ahmed, O.; Hamed, M. Experimental investigation of the effect of particle deposition on pool boiling of nanofluids. Int. J. Heat Mass Transf. 2012, 55, 3423–3436. [Google Scholar] [CrossRef]
  15. Yu, L.; Sur, A.; Liu, D. Flow Boiling Heat Transfer and Two-Phase Flow Instability of Nanofluids in a Minichannel. J. Heat Transf.-Trans. Asme 2015, 137, 051502. [Google Scholar] [CrossRef]
  16. Paul, G.; Das, P.K.; Manna, I. Assessment of the process of boiling heat transfer during rewetting of a vertical tube bottom flooded by alumina nanofluid. Int. J. Heat Mass Transf. 2016, 94, 390–402. [Google Scholar] [CrossRef]
  17. Das, S.; Saha, B.; Bhaumik, S. Experimental study of nucleate pool boiling heat transfer of water by surface functionalization with SiO 2 nanostructure. Exp. Therm. Fluid Sci. 2016, 81, 454–465. [Google Scholar] [CrossRef]
  18. Stutz, B.; Morceli, C.H.S.; Da Silva, M.D.F.; Cioulachtjian, S.; Bonjour, J. Influence of nanoparticle surface coating on pool boiling. Exp. Therm. Fluid Sci. 2011, 35, 1239–1249. [Google Scholar] [CrossRef]
  19. Can, E.; Prosperetti, A. A level set method for vapor bubble dynamics. J. Comput. Phys. 2012, 231, 1533–1552. [Google Scholar] [CrossRef]
  20. Ryan, W.H.; Kuo, K.K. A ghost fluid method for compressible reacting flows with phase change. J. Comput. Phys. 2013, 235, 865–900. [Google Scholar]
  21. Ghosh, K.; Mukhopadhyay, A.; Sen, S.; Sanyal, D. A Sphericosymmetric VOF Approach for Investigating Immiscible Two-Phase Systems with One Liquid Phase. Numer. Heat Transf. Part A Appl. 2006, 50, 949–974. [Google Scholar] [CrossRef]
  22. Stephan, P.; Fuchs, T.; Wagner, E.; Schweizer, N. Transient local heat fluxes during the entire vapor bubble life time. In Proceedings of the ECI International Conference on Boiling Heat Transfer, Florianopolis, Brazil, 3–7 May 2009. [Google Scholar]
  23. Gerardi, C.; Buongiorno, J.; Hu, L.-W.; McKrell, T. Study of bubble growth in water pool boiling through synchronized, infrared thermometry and high-speed video. Int. J. Heat Mass Transf. 2010, 53, 4185–4192. [Google Scholar] [CrossRef]
  24. Cooper, M.G.; Lloyd, A.J.P. The microlayer in nucleate pool boiling. Int. J. Heat Mass Transf. 1969, 12, 895–913. [Google Scholar] [CrossRef]
  25. Lee, R.C.; Nydahl, J.E. Numerical Calculation of Bubble Growth in Nucleate Boiling from Inception Through Departure. J. Heat Transf. 1989, 111, 474–479. [Google Scholar] [CrossRef]
  26. Van Stralen, S.; Sohal, M.; Cole, R.; Sluyter, W. Bubble growth rates in pure and binary systems: Combined effect of relaxation and evaporation microlayers. Int. J. Heat Mass Transf. 1975, 18, 453–467. [Google Scholar] [CrossRef]
  27. Utaka, Y.; Kashiwabara, Y.; Ozaki, M. Microlayer structure in nucleate boiling of water and ethanol at atmospheric pressure. Int. J. Heat Mass Transf. 2013, 57, 222–230. [Google Scholar] [CrossRef]
  28. Utaka, Y.; Kashiwabara, Y.; Ozaki, M.; Chen, Z. Heat transfer characteristics based on microlayer structure in nucleate pool boiling for water and ethanol. Int. J. Heat Mass Transf. 2014, 68, 479–488. [Google Scholar] [CrossRef] [Green Version]
  29. Sato, Y.; Niceno, B. A depletable micro-layer model for nucleate pool boiling. J. Comput. Phys. 2015, 300, 20–52. [Google Scholar] [CrossRef]
  30. Chen, Z.; Utaka, Y. On heat transfer and evaporation characteristics in the growth process of a bubble with microlayer structure during nucleate boiling. Int. J. Heat Mass Transf. 2015, 81, 750–759. [Google Scholar] [CrossRef] [Green Version]
  31. Chen, Z.; Wu, F.; Utaka, Y. Numerical simulation of thermal property effect of heat transfer plate on bubble growth with microlayer evaporation during nucleate pool boiling. Int. J. Heat Mass Transf. 2018, 118, 989–996. [Google Scholar] [CrossRef]
  32. Chen, Z.; Wu, F.; Utaka, Y.; Chen, P.; Liang, C. An Improved Treatment on the Apparent Contact Angle of a Single-Bubble in Consideration of Microlayer for Simulations of Nucleate Pool Boiling. J. Therm. Sci. 2021, 30, 1951–1959. [Google Scholar] [CrossRef]
  33. Lee, W.; Son, G. Numerical simulation of boiling enhancement on a microstructured surface. Int. Commun. Heat Mass Transf. 2011, 38, 168–173. [Google Scholar] [CrossRef]
  34. Li, Q.; Yu, Y.; Zhou, P.; Yan, H. Enhancement of boiling heat transfer using hydrophilic-hydrophobic mixed surfaces: A lattice Boltzmann study. Appl. Therm. Eng. 2017, 132, 490–499. [Google Scholar] [CrossRef]
  35. Yu, Y.; Wen, Z.; Li, Q.; Zhou, P.; Yan, H. Boiling heat transfer on hydrophilic-hydrophobic mixed surfaces: A 3D lattice Boltzmann study. Appl. Therm. Eng. 2018, 142, 846–854. [Google Scholar] [CrossRef]
  36. Wang, W.; Huang, S.; Luo, X. MD simulation on nano-scale heat transfer mechanism of sub-cooled boiling on nano-structured surface. Int. J. Heat Mass Transf. 2016, 100, 276–286. [Google Scholar] [CrossRef]
  37. She, X.; Shedd, T.A.; Lindeman, B.; Yin, Y.; Zhang, X. Bubble formation on solid surface with a cavity based on molecular dynamics simulation. Int. J. Heat Mass Transf. 2016, 95, 278–287. [Google Scholar] [CrossRef]
  38. Liu, R.; Liu, Z. Study of boiling heat transfer on concave hemispherical nanostructure surface with MD simulation. Int. J. Heat Mass Transf. 2019, 143, 118534. [Google Scholar] [CrossRef]
  39. Rahman, M.M.; Ölçeroğlu, E.; McCarthy, M. Role of Wickability on the Critical Heat Flux of Structured Superhydrophilic Surfaces. Langmuir ACS J. Surf. Colloids 2014, 30, 11225. [Google Scholar] [CrossRef] [PubMed]
  40. Tetreault-Friend, M.; Azizian, R.; Bucci, M.; McKrell, T.; Buongiorno, J.; Rubner, M.; Cohen, R. Critical heat flux maxima resulting from the controlled morphology of nanoporous hydrophilic surface layers. Appl. Phys. Lett. 2016, 108, 243102. [Google Scholar] [CrossRef]
  41. Yoon, H.Y.; Koshizuka, S.; Oka, Y. Particle-Gridless Hybrid Method for Incompressible Flows. Int. J. Numer. Methods Fluids 1999, 30, 407–424. [Google Scholar] [CrossRef]
  42. Koshizuka, S.; Oka, Y. Moving-Particle Semi-Implicit Method for Fragmentation of Incompressible Fluid. Nucl. Sci. Eng. 1996, 123, 421–434. [Google Scholar] [CrossRef]
  43. Yoon, H.Y.; Koshizuka, S.; Oka, Y. Direct calculation of bubble growth, departure, and rise in nucleate pool boiling. Int. J. Multiph. Flow 2001, 27, 277–298. [Google Scholar] [CrossRef]
  44. Chen, R.; Tian, W.; Su, G.; Qiu, S.; Ishiwatari, Y.; Oka, Y. Numerical investigation on bubble dynamics during flow boiling using moving particle semi-implicit method. Nucl. Eng. Des. 2010, 240, 3830–3840. [Google Scholar] [CrossRef]
  45. Wang, Y.; Wu, J.M. Numerical simulation on single bubble behavior during Al2O3/H2O nanofluids flow boiling using Moving Particle Simi-implicit method. Prog. Nucl. Energy 2015, 85, 130–139. [Google Scholar] [CrossRef]
  46. Hirt, C.W.; Nichols, B.D. Volume of fluid (VOF) method for the dynamics of free boundaries. J. Comput. Phys. 1981, 39, 201–225. [Google Scholar] [CrossRef]
  47. Son, G.; Ramanujapu, N.; Dhir, V.K. Numerical Simulation of Bubble Merger Process on a Single Nucleation Site During Pool Nucleate Boiling. J. Heat Transf. 2002, 124, 51–62. [Google Scholar] [CrossRef]
  48. Guo, K.; Chen, R.; Li, Y.; Tian, W.; Su, G.; Qiu, S. Numerical simulation of Rayleigh-Taylor Instability with periodic boundary condition using MPS method. Prog. Nucl. Energy 2018, 109, 130–144. [Google Scholar] [CrossRef]
  49. Guo, K.; Chen, R.; Qiu, S.; Tian, W.; Su, G. An improved Multiphase Moving Particle Semi-implicit method in bubble rising simulations with large density ratios. Nucl. Eng. Des. 2018, 340, 370–387. [Google Scholar] [CrossRef]
  50. Lancaster, P.; Salkauskas, K. Surfaces generated by moving least squares methods. Math. Comput. 1981, 37, 141–158. [Google Scholar] [CrossRef]
  51. Khayyer, A.; Gotoh, H. A higher order Laplacian model for enhancement and stabilization of pressure calculation by the MPS method. Appl. Ocean Res. 2010, 32, 124–131. [Google Scholar] [CrossRef]
  52. Chen, R.; Chen, L.; Guo, K.; Yamaji, A.; Furuya, M.; Tian, W.; Su, G.; Qiu, S. Numerical analysis of the melt behavior in a fuel support piece of the BWR by MPS. Ann. Nucl. Energy 2017, 102, 422–439. [Google Scholar] [CrossRef]
  53. Chen, R.H.; Tian, W.X.; Su, G.H.; Qiu, S.Z.; Ishiwatari, Y.; Oka, Y. Numerical investigation on coalescence of bubble pairs rising in a stagnant liquid. Chem. Eng. Sci. 2011, 66, 5055–5063. [Google Scholar] [CrossRef]
  54. Lee, W.; Son, G.; Yoon, H.Y. Numerical study of bubble growth and boiling heat transfer on a microfinned surface. Int. Commun. Heat Mass Transf. 2012, 39, 52–57. [Google Scholar] [CrossRef]
  55. Marek, R.; Straub, J. Analysis of the evaporation coefficient and the condensation coefficient of water. Int. J. Heat Mass Transf. 2001, 44, 39–53. [Google Scholar] [CrossRef]
  56. Kaviany, M. Principle of Heat Transfer in Porous Media; Springer: Berlin/Heidelberg, Germany, 1995. [Google Scholar]
  57. Kim, H.D.; Kim, M.H. Effect of nanoparticle deposition on capillary wicking that influences the critical heat flux in nanofluids. Appl. Phys. Lett. 2007, 91, 014104. [Google Scholar] [CrossRef] [Green Version]
  58. Chen, H.; Sun, Y.; Xiao, H.; Liu, L. Numerical simulation of single bubble boiling on micro-pillar structure surface. Chem. Ind. Eng. Prog. 2019, 38, 4845–4855. (In Chinese) [Google Scholar]
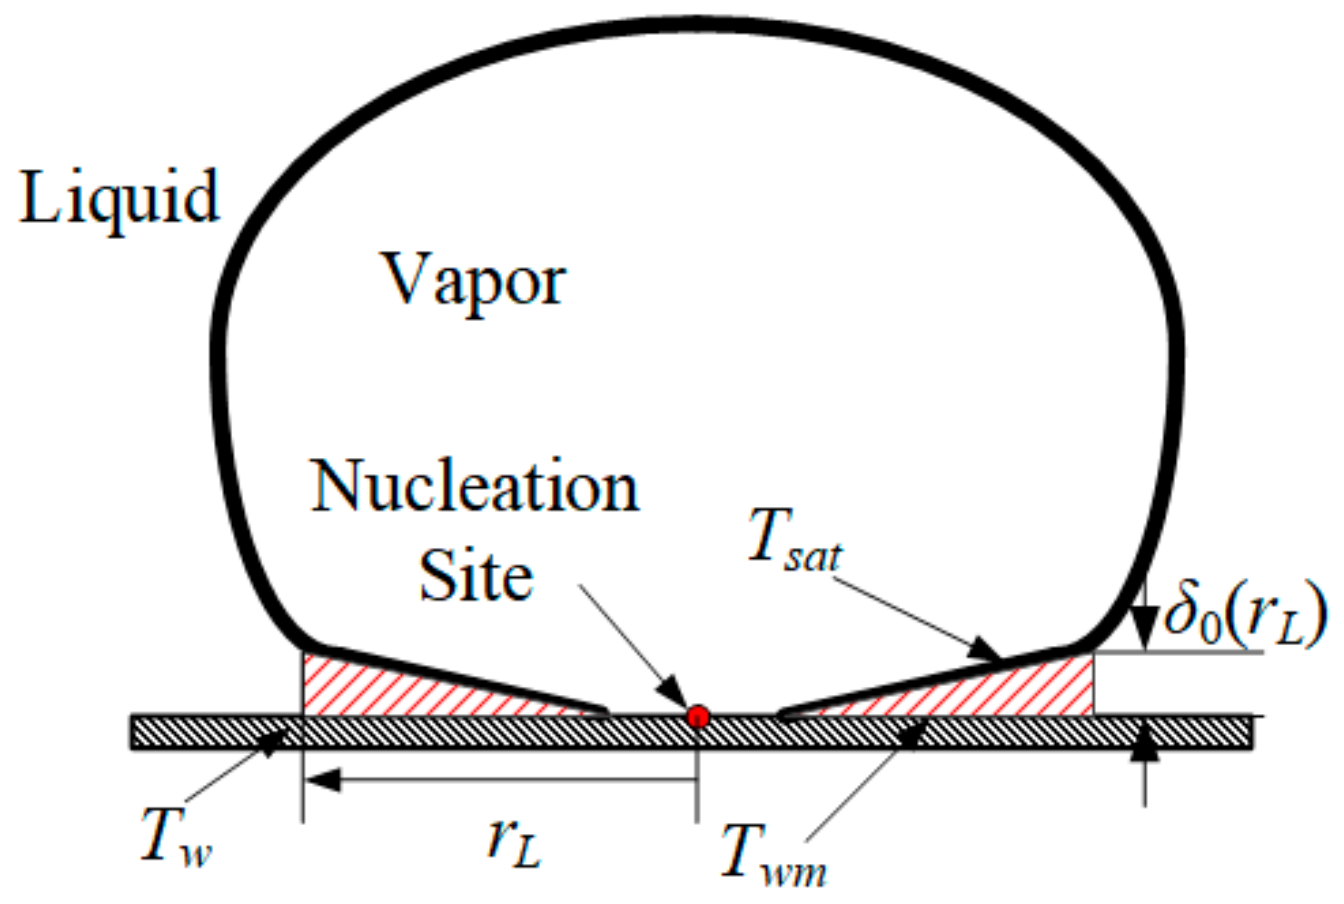
Figure 1. Schematic of the micro-layer.
Applsci 13 04114 g001
Figure 2. Arrangement of the initial bubble in current MPS-MAFL method.
Applsci 13 04114 g002
Figure 3. Schematic of the heat and mass transfer through nano-structures.
Applsci 13 04114 g003
Figure 4. Temperature distribution of the superheated liquid layer near the nucleation site when nucleation starts.
Applsci 13 04114 g004
Figure 5. Distribution of micro-layer and dry area during calculation.
Applsci 13 04114 g005
Figure 6. The initial particle arrangement of the pooling bubble growth calculation.
Applsci 13 04114 g006
Figure 7. The calculation procedure.
Applsci 13 04114 g007
Figure 8. Comparison of the temperature distribution between numerical simulations and the analytical results.
Applsci 13 04114 g008
Figure 9. Comparison of the bubble growth rate between numerical simulations and Han and Griffith’s experimental results [4].
Applsci 13 04114 g009
Figure 10. Pool boiling bubble on bared ITO heater at ΔTw = 7.22 °C: HSV snapshots (upper) and present simulation (lower).
Applsci 13 04114 g010
Figure 11. Comparison of the bubble diameter variation between numerical simulations and experiments on the ITO heater.
Applsci 13 04114 g011
Figure 12. The LbL dipping procedure.
Applsci 13 04114 g012
Figure 13. Variations of the τcond and τwick with height h on 100 bilayers LbL nano-structured surface.
Applsci 13 04114 g013
Figure 14. Pool boiling bubble on 100 bilayers LbL ITO heater at ΔTw = 22.69 °C: HSV snapshots (upper) and present simulation (lower).
Applsci 13 04114 g014aApplsci 13 04114 g014b
Figure 15. Comparison of the bubble diameter variation between numerical simulations and experiments on the 100 bilayer LbL heater.
Applsci 13 04114 g015
Figure 16. Thickness distribution of micro-layers at different times on: (a) bared ITO heater at ΔTw = 7.22 °C; (b) bared ITO heater at ΔTw = 10.15 °C; (c) 100 bilayers LbL ITO heater at ΔTw = 22.69 °C.
Applsci 13 04114 g016
Figure 17. Heat transfer rates from different parts vary with time on: (a) bared ITO heater at ΔTw = 7.22 °C; (b) bared ITO heater at ΔTw = 10.15 °C.
Applsci 13 04114 g017
Figure 18. Heat transfer rates from different parts vary with time on 100 bilayer LbL heater at ΔTw = 22.69 °C.
Applsci 13 04114 g018
Table 1. Parameters of LbL nano-structured surfaces with different numbers of bilayers.
No. of BilayersSize of Nano-Particle/nmThickness of the Nano-Sturcture/μmSurface Roughness/nmPorosity/%
0N/A0<10N/A
2220 ± 20.50 ± 0.0226 ± 363 ± 1
3420 ± 20.93 ± 0.0445 ± 663 ± 1
4220 ± 21.18 ± 0.0553 ± 863 ± 1
5320 ± 21.42 ± 0.0567 ± 2063 ± 1
7020 ± 21.90 ± 0.197 ± 1963 ± 1
10020 ± 22.76 ± 0.08162 ± 2563 ± 1
Disclaimer/Publisher’s Note: The statements, opinions and data contained in all publications are solely those of the individual author(s) and contributor(s) and not of MDPI and/or the editor(s). MDPI and/or the editor(s) disclaim responsibility for any injury to people or property resulting from any ideas, methods, instructions or products referred to in the content.