

Spectral Splitting Sensing Using Optical Fiber Bragg Grating for Spacecraft Lateral Stress Health Monitoring
 , ,
, ,
Abstract
:1. Introduction
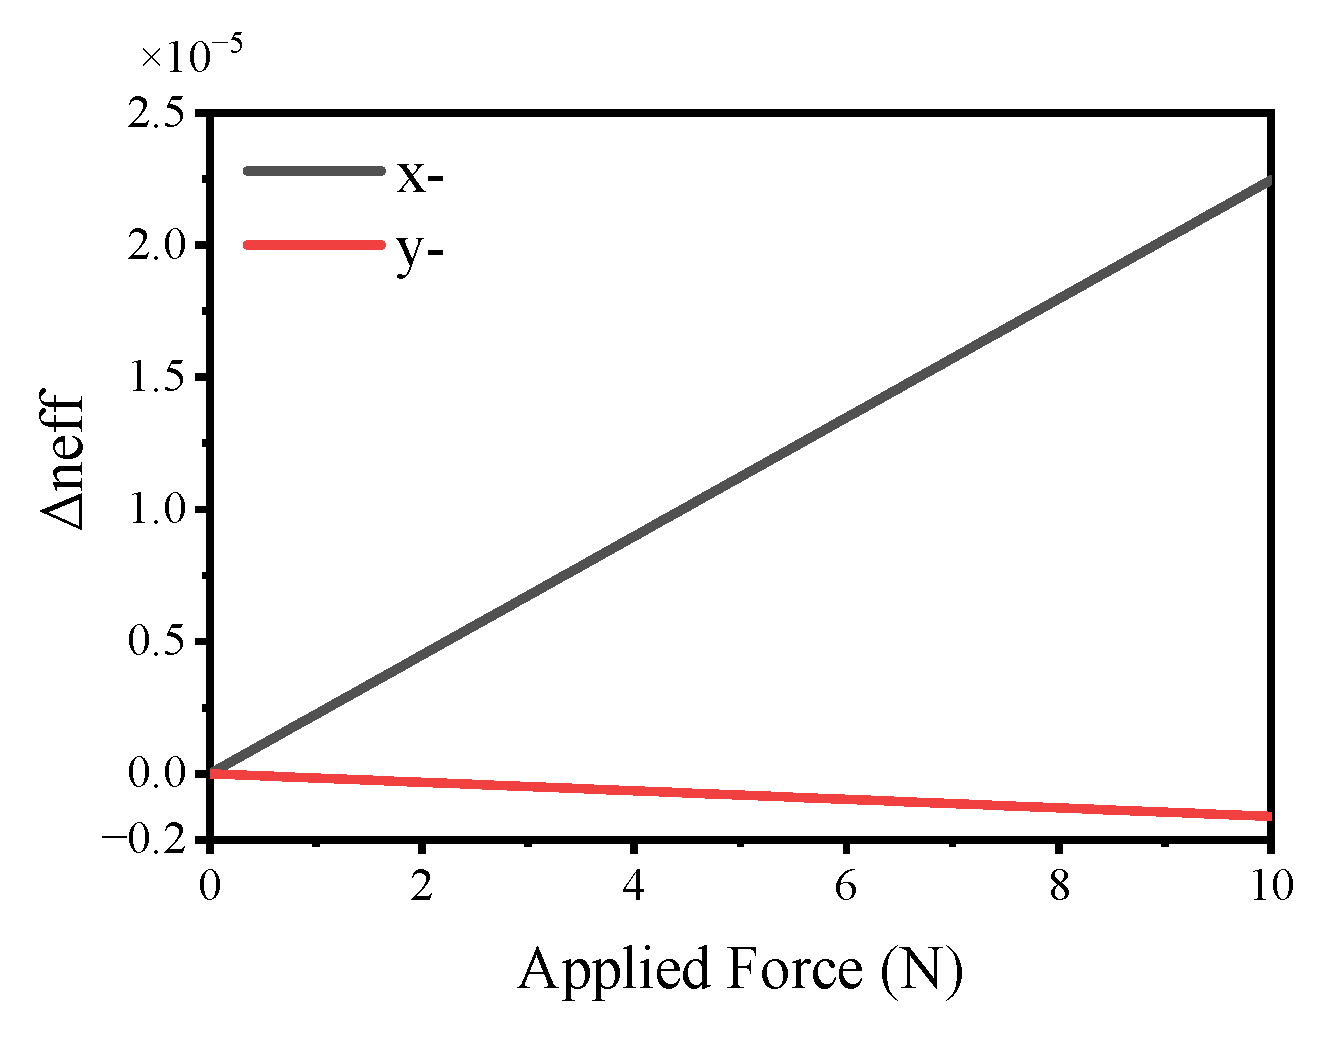
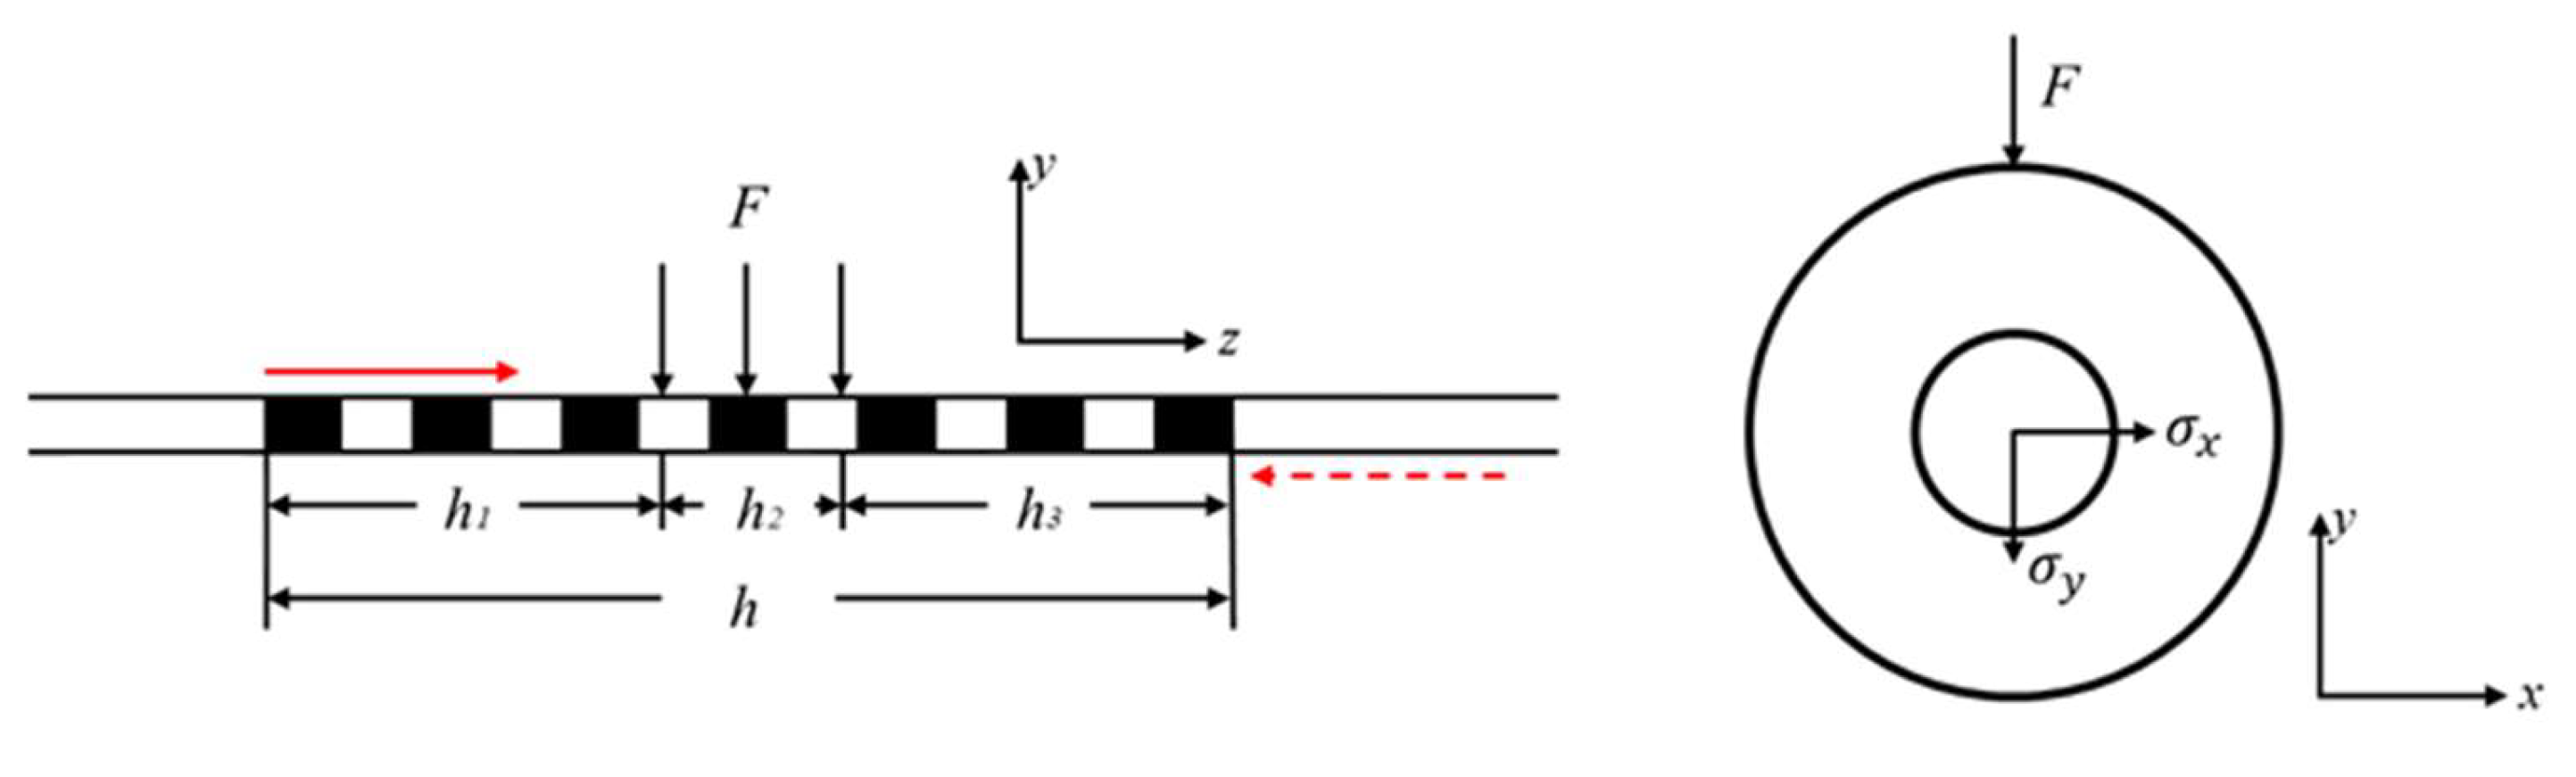
2. Lateral Stress Sensing Principle
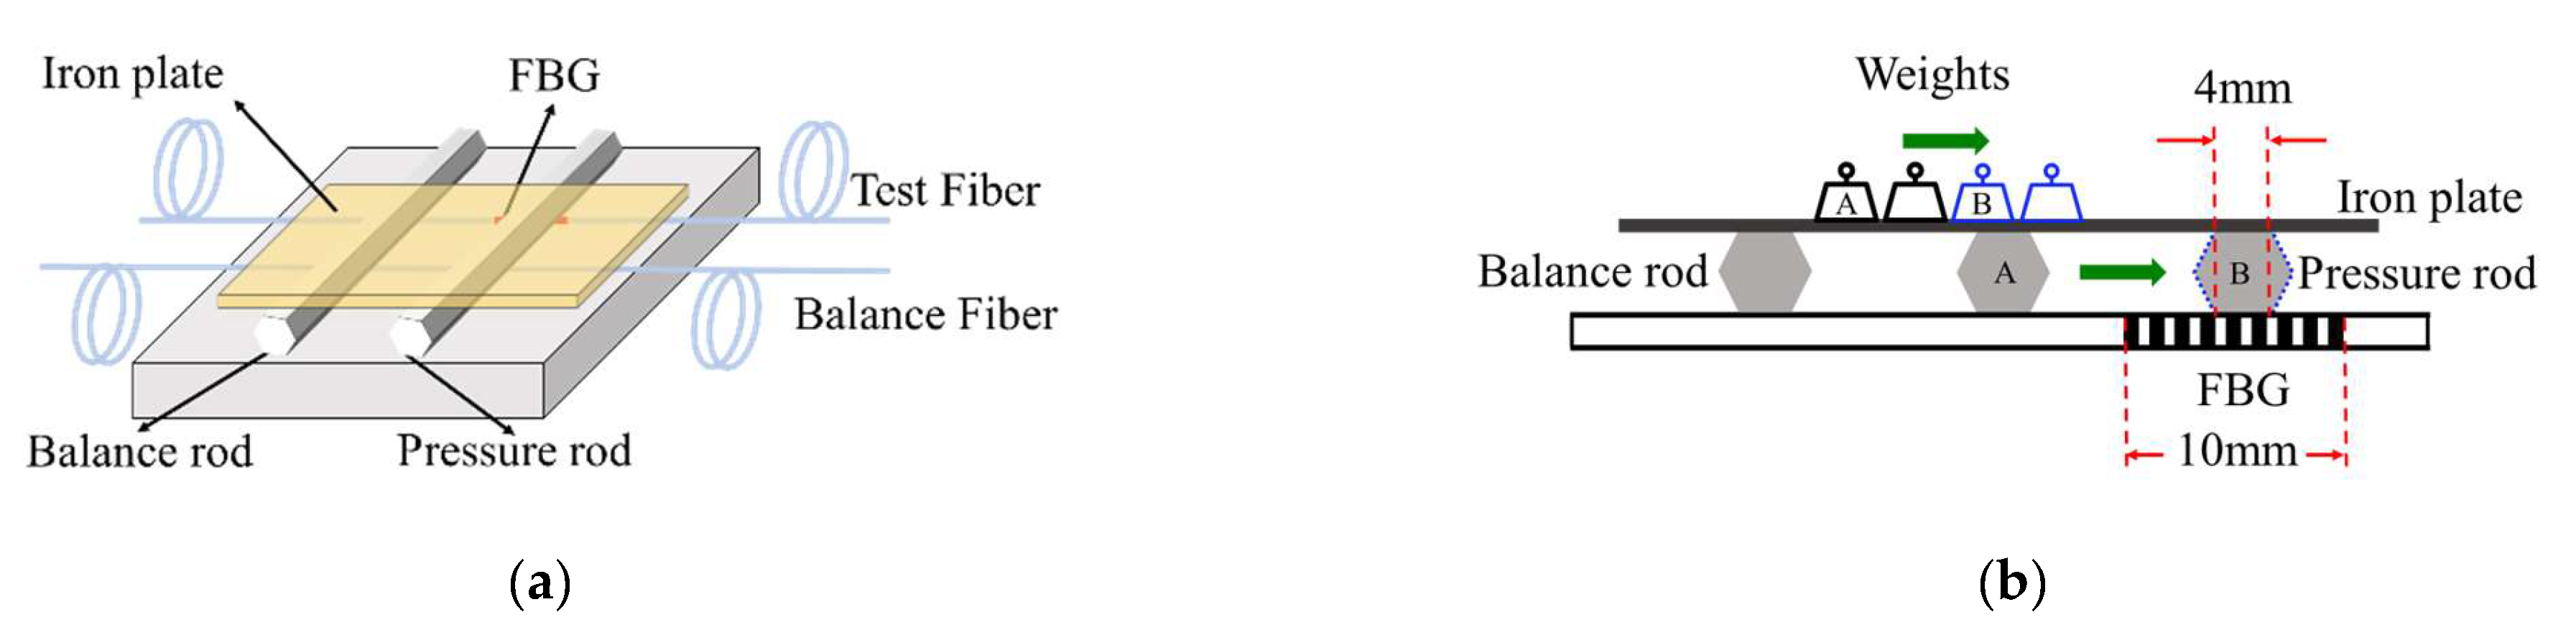
3. Experimental Setup
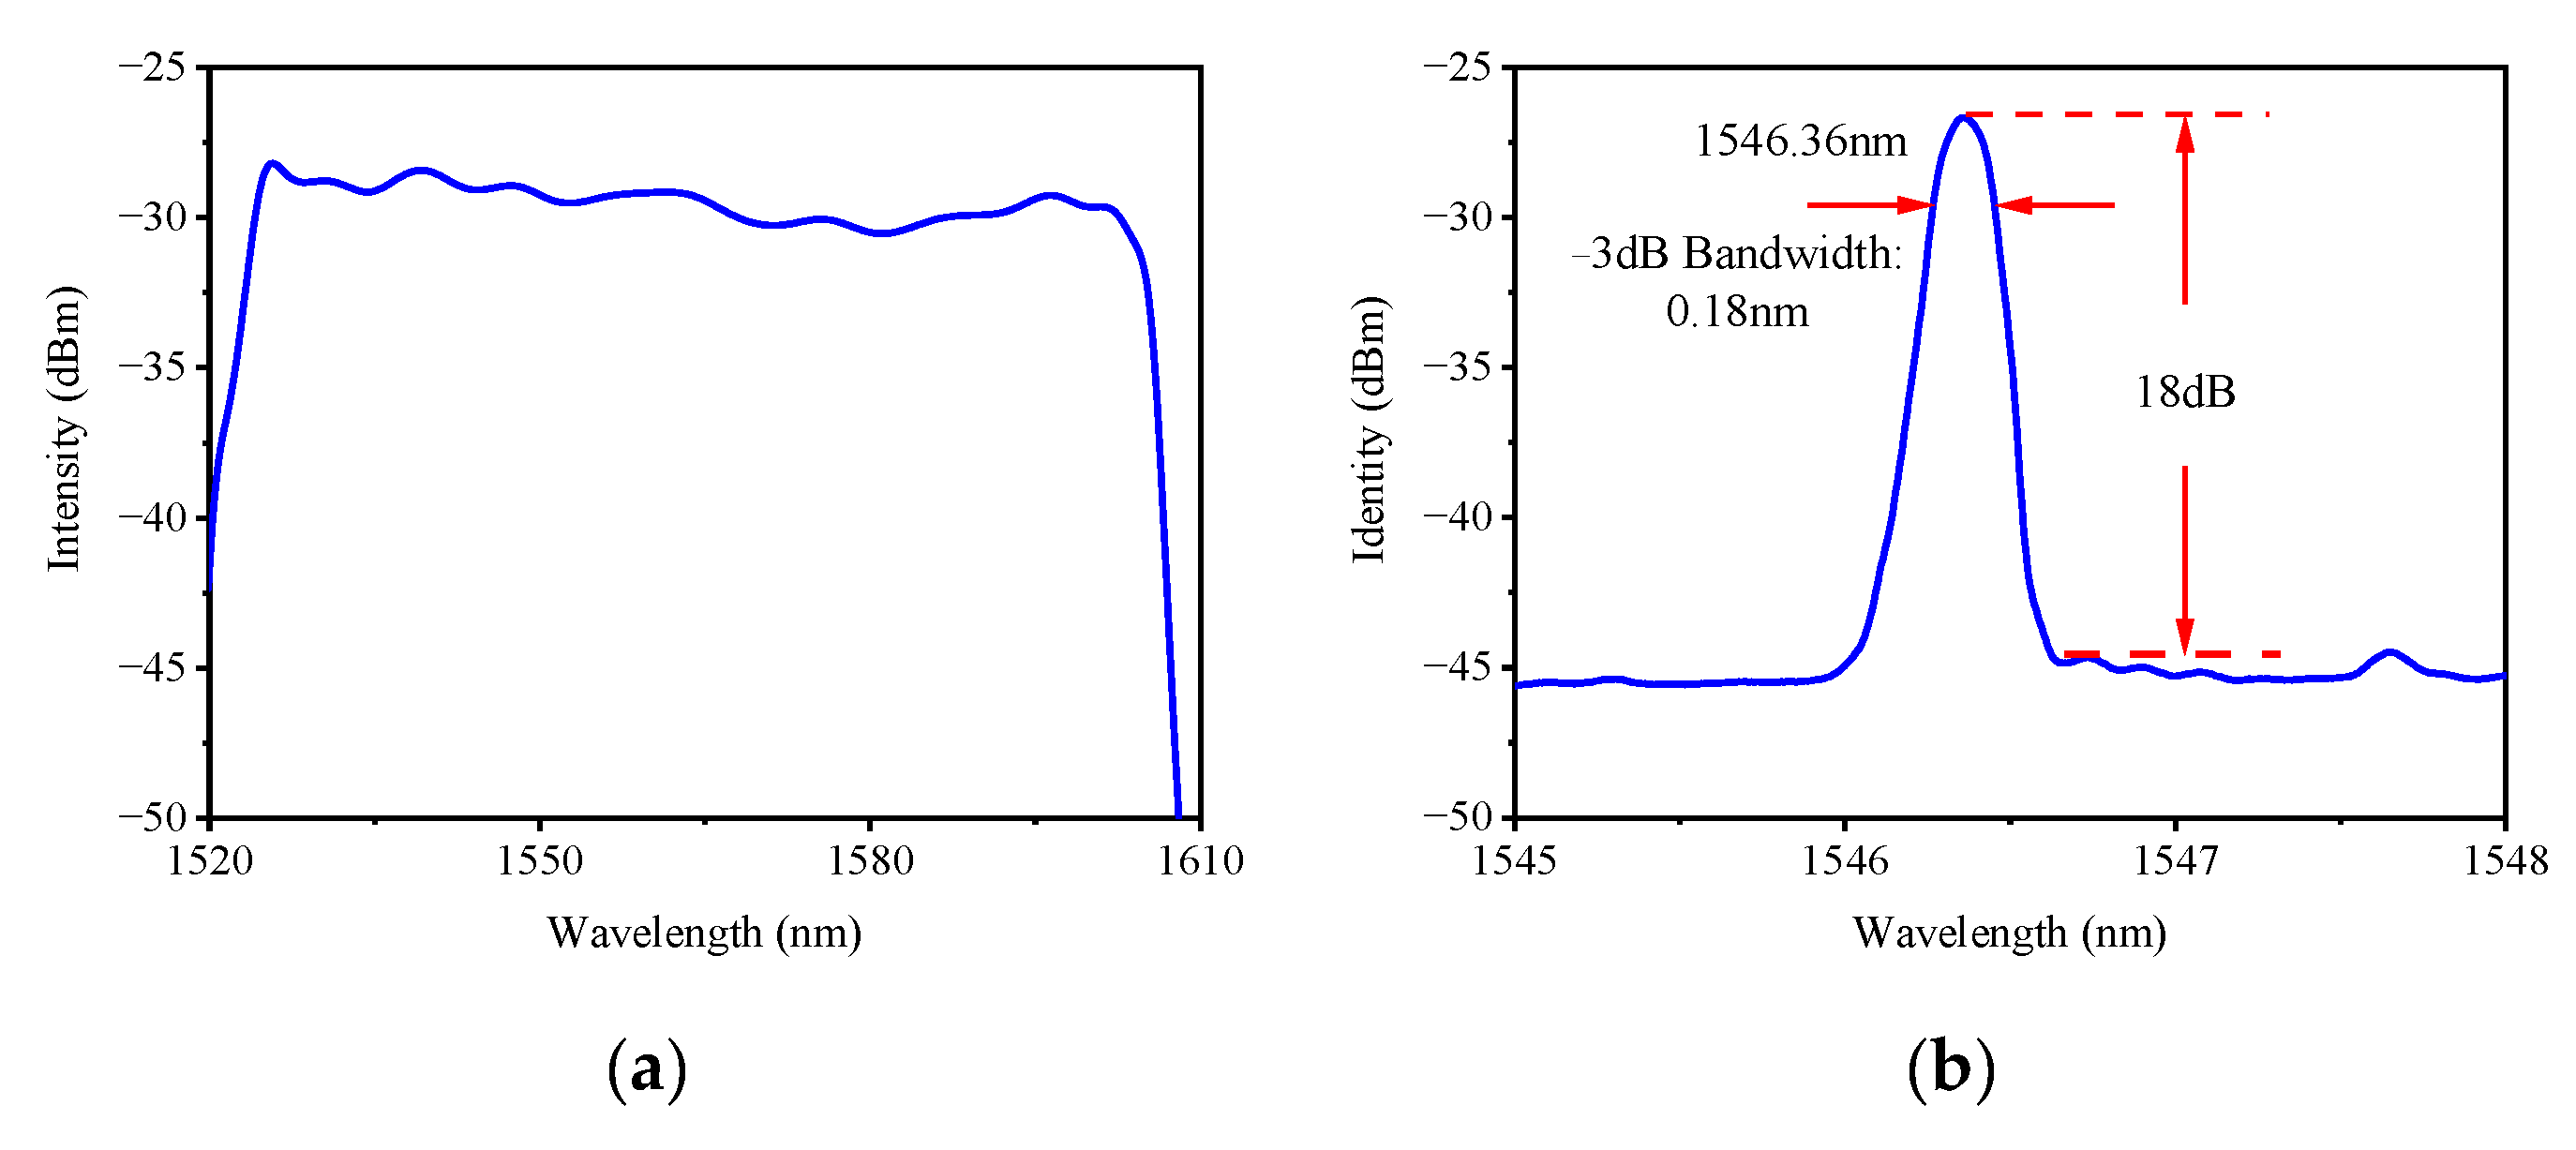
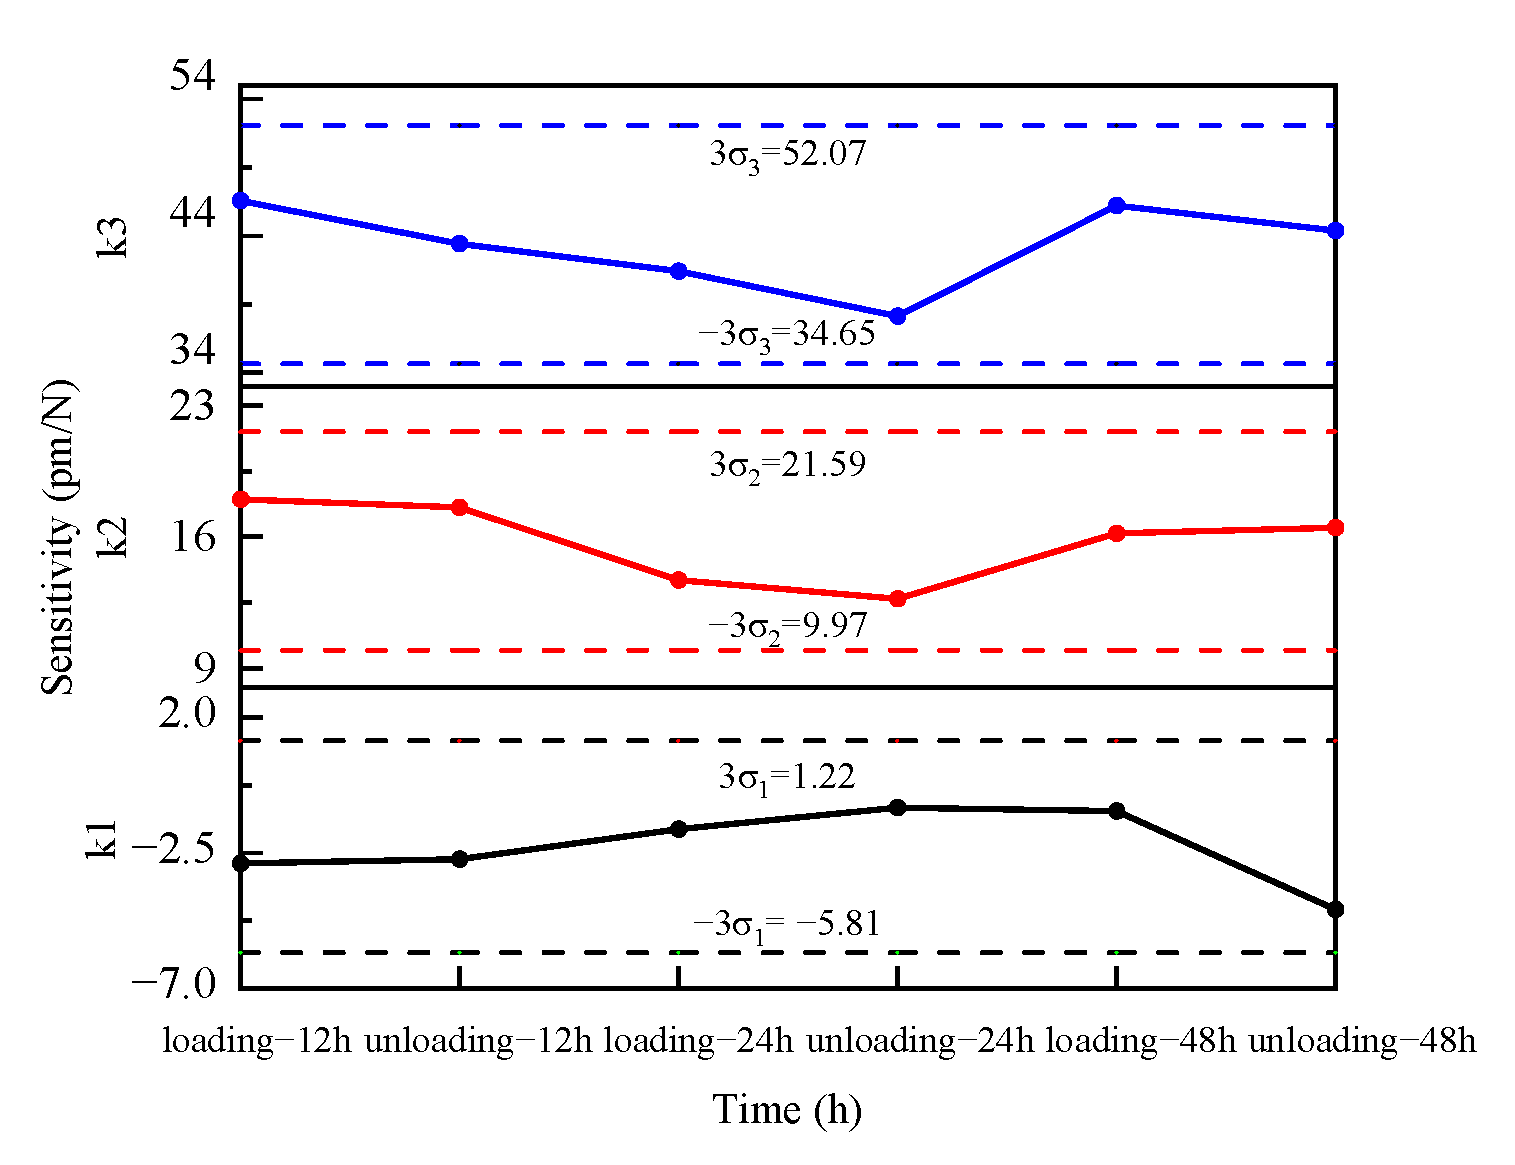
4. Results and Discussion
5. Conclusions
Author Contributions
Funding
Institutional Review Board Statement
Informed Consent Statement
Data Availability Statement
Conflicts of Interest
References
- Hoschke, N.; Price, D.C.; Scott, D.A.; Richards, W.L. Structural Health Monitoring of Space Vehicle Thermal Protection Systems. In Proceedings of the 4th Asia-Pacific Workshop on Structural Health Monitoring, Melbourne, Australia, 5–7 December 2012; pp. 268–280. [Google Scholar]
- Rickman, S.L.; Richards, W.L.; Christiansen, E.L.; Piazza, A.; Pena, F.; Parker, A.R. Micrometeoroid/Orbital Debris (MMOD) Impact Detection and Location Using Fiber Optic Bragg Grating Sensing Technology. In Proceedings of the 6th Asia-Pacific Workshop on Structural Health Monitoring (APWSHM), Hobart, Australia, 7–9 December 2016; pp. 233–240. [Google Scholar]
- Qi, L.; Zeng, Z.M.; Sun, L.C.; Rui, X.B.; Fan, F.; Yue, G.X.; Zhao, Y.Y.; Feng, H. An Impact Location Algorithm for Spacecraft Stiffened Structure Based on Posterior Possibility Correlation. Sensors 2020, 20, 68. [Google Scholar] [CrossRef] [PubMed] [Green Version]
- Wang, L.M.; Xiao, C.C.; Ding, W.Q.; Wu, J.Y.; Shi, C.L. Application Overview of Fiber Bragg Grating Sensors in Structural Health Monitoring. In Proceedings of the 6th IEEE Advanced Information Technology, Electronic and Automation Control Conference (IEEE IAEAC), Beijing, China, 3–5 October 2022; pp. 1946–1950. [Google Scholar]
- García, I.; Zubia, J.; Durana, G.; Aldabaldetreku, G.; Illarramendi, A.M. Optical Fiber Sensors for Aircraft Structural Health Monitoring. Sensors 2015, 15, 15494–15519. [Google Scholar] [CrossRef] [PubMed] [Green Version]
- Li, W.Y.; Chen, S.; Chu, Y.Y.; Huang, P.Y.; Yan, G. Wide-range fiber Bragg grating strain sensor for load testing of aircraft landing gears. Optik 2022, 262, 13. [Google Scholar] [CrossRef]
- Okagawa, S.; Bernus, P.; Noran, O. Realtime Health Monitoring of Composite Structures Using FBG Sensors. In Proceedings of the 5th International-Federation-of-Automatic-Control (IFAC) Workshop on Advanced Maintenance Engineering, Services and Technologies (AMEST), Bogota, Colombia, 26–29 July 2022; pp. 157–162. [Google Scholar]
- Jensen, D.W.; Pascual, J. Degradation of graphite/bismaleimide laminates with multiple embedded fiber optic sensors. In Proceedings of the SPIE Microelectronic Interconnect and Integrated Processing Symposium, San Jose, CA, USA, 16–21 September 1990; Volume 1370. [Google Scholar] [CrossRef]
- Lee, D.C.; Lee, J.J.; Yun, S.J. The mechanical characteristics of smart composite structures with embedded optical fiber sensors. Compos. Struct. 1995, 32, 39–50. [Google Scholar] [CrossRef]
- Luyckx, G.; Voet, E.; Lammens, N.; Degrieck, J. Strain measurements of composite laminates with embedded fibre bragg gratings: Criticism and opportunities for research. Sensors 2011, 11, 384–408. [Google Scholar] [CrossRef] [PubMed] [Green Version]
- Bednarska, K.; Sobotka, P.; Wolinski, T.R.; Zakrecka, O.; Pomianek, W.; Nocon, A.; Lesiak, P. Hybrid Fiber Optic Sensor Systems in Structural Health Monitoring in Aircraft Structures. Materials 2020, 13, 2249. [Google Scholar] [CrossRef] [PubMed]
- Iadicicco, A.; Natale, D.; Di Palma, P.; Spinaci, F.; Apicella, A.; Campopiano, S. Strain Monitoring of a Composite Drag Strut in Aircraft Landing Gear by Fiber Bragg Grating Sensors. Sensors 2019, 19, 2239. [Google Scholar] [CrossRef] [PubMed] [Green Version]
- Goossens, S.; Pauw, B.D.; Geernaert, T.; Salmanpour, M.S.; Khodaei, Z.S.; Karachalios, E.; Saenz-Castillo, D.; Thienpont, H.; Berghmans, F. Aerospace-grade surface mounted optical fibre strain sensor for structural health monitoring on composite structures evaluated against in-flight conditions. Smart Mater. Struct. 2019, 28, 065008. [Google Scholar] [CrossRef]
- Udd, E. Multiparameter sensor system using a multiple grating fiber optic birefringent fiber. U.S. Patent No. 5,591,965, 7 January 1997. [Google Scholar]
- Lawrence, C.M.; Nelson, D.V.; Udd, E. Measurement of transverse strains with fiber Bragg gratings. In Smart Structures and Materials 1997: Smart Sensing, Processing, and Instrumentation; SPIE: Bellingham, WA, USA, 1997; Volume 3042, pp. 218–228. [Google Scholar]
- Bosia, F.; Giaccari, P.; Botsis, J.; Facchini, M.; Limberger, H.G.; Salathe, R.P. Characterization of the response of fibre Bragg grating sensors subjected to a two-dimensional strain field. Smart Mater. Struct. 2003, 12, 925–934. [Google Scholar] [CrossRef]
- Prabhugoud, M.; Peters, K. Finite element model for embedded fiber Bragg grating sensor. Smart Mater. Struct. 2006, 15, 550–562. [Google Scholar] [CrossRef]
- Edmon, C.; Chen-Chun, Y.; Stephen, E.S.; Stephen, W.J.; Ralph, P.T. Characterization of the response of fibre Bragg gratings fabricated in stress and geometrically induced high birefringence fibres to temperature and transverse load. Smart Mater. Struct. 2004, 13, 888. [Google Scholar] [CrossRef]
- Sun, Y.D.; Liu, K.X.; Yang, G.H.; Cao, F.H.; Chen, C.Y. Study on spectral characteristics of polarization maintaining fiber Bragg grating under lateral pressure. In Proceedings of the 3rd International Conference on Photonics and Optical Engineering, Xi’an, China, 5–8 December 2018. [Google Scholar]
- Tao, X.; Zhang, A.P.; Yang, D.; Tam, H.Y. Spectrum Response of Embedded Fiber Bragg Grating Sensors in Complicated Strain Field; The Hong Kong Polytechnic University: Hong Kong, China, 2001. [Google Scholar]
- Espejo, R.J.; Dyer, S.D. Transverse-Stress Fiber Bragg Grating Sensor With High Spatial Resolution and Temperature Stability. J. Light. Technol. 2007, 25, 1777–1785. [Google Scholar] [CrossRef]
- Madhav, K.; Rahman, A.; Asokan, S.; Srinivasan, B. Strain and Temperature Discrimination Using Fiber Bragg Gratings in a Cross-Wire Configuration. U.S. Patent No. 9,267,854 B2, 4 November 2010. [Google Scholar]
- Gafsi, R.; El-Sherif, M.A. Analysis of Induced-Birefringence Effects on Fiber Bragg Gratings—ScienceDirect. Opt. Fiber Technol. 2000, 6, 299–323. [Google Scholar] [CrossRef]
- Peng, B.-J.; Zhao, Y.; Yang, J.; Zhao, M. Pressure sensor based on a free elastic cylinder and birefringence effect on an FBG with temperature-compensation. Measurement 2005, 38, 176–180. [Google Scholar] [CrossRef]
- Wada, D.; Murayama, H.; Igawa, H. Lateral Load Measurements Based on a Distributed Sensing System of Optical Frequency-Domain Reflectometry Using Long-Length Fiber Bragg Gratings. J. Light. Technol. 2012, 30, 2337–2344. [Google Scholar] [CrossRef]
- Fazzi, L.; Rajabzadeh, A.; Milazzo, A.; Groves, R.M. Analysis of FBG reflection spectra under uniform and non-uniform transverse loads. In Sensors and Smart Structures Technologies for Civil, Mechanical, and Aerospace Systems 2019; SPIE: Bellingham, WA, USA, 2019; Volume 10970. [Google Scholar]


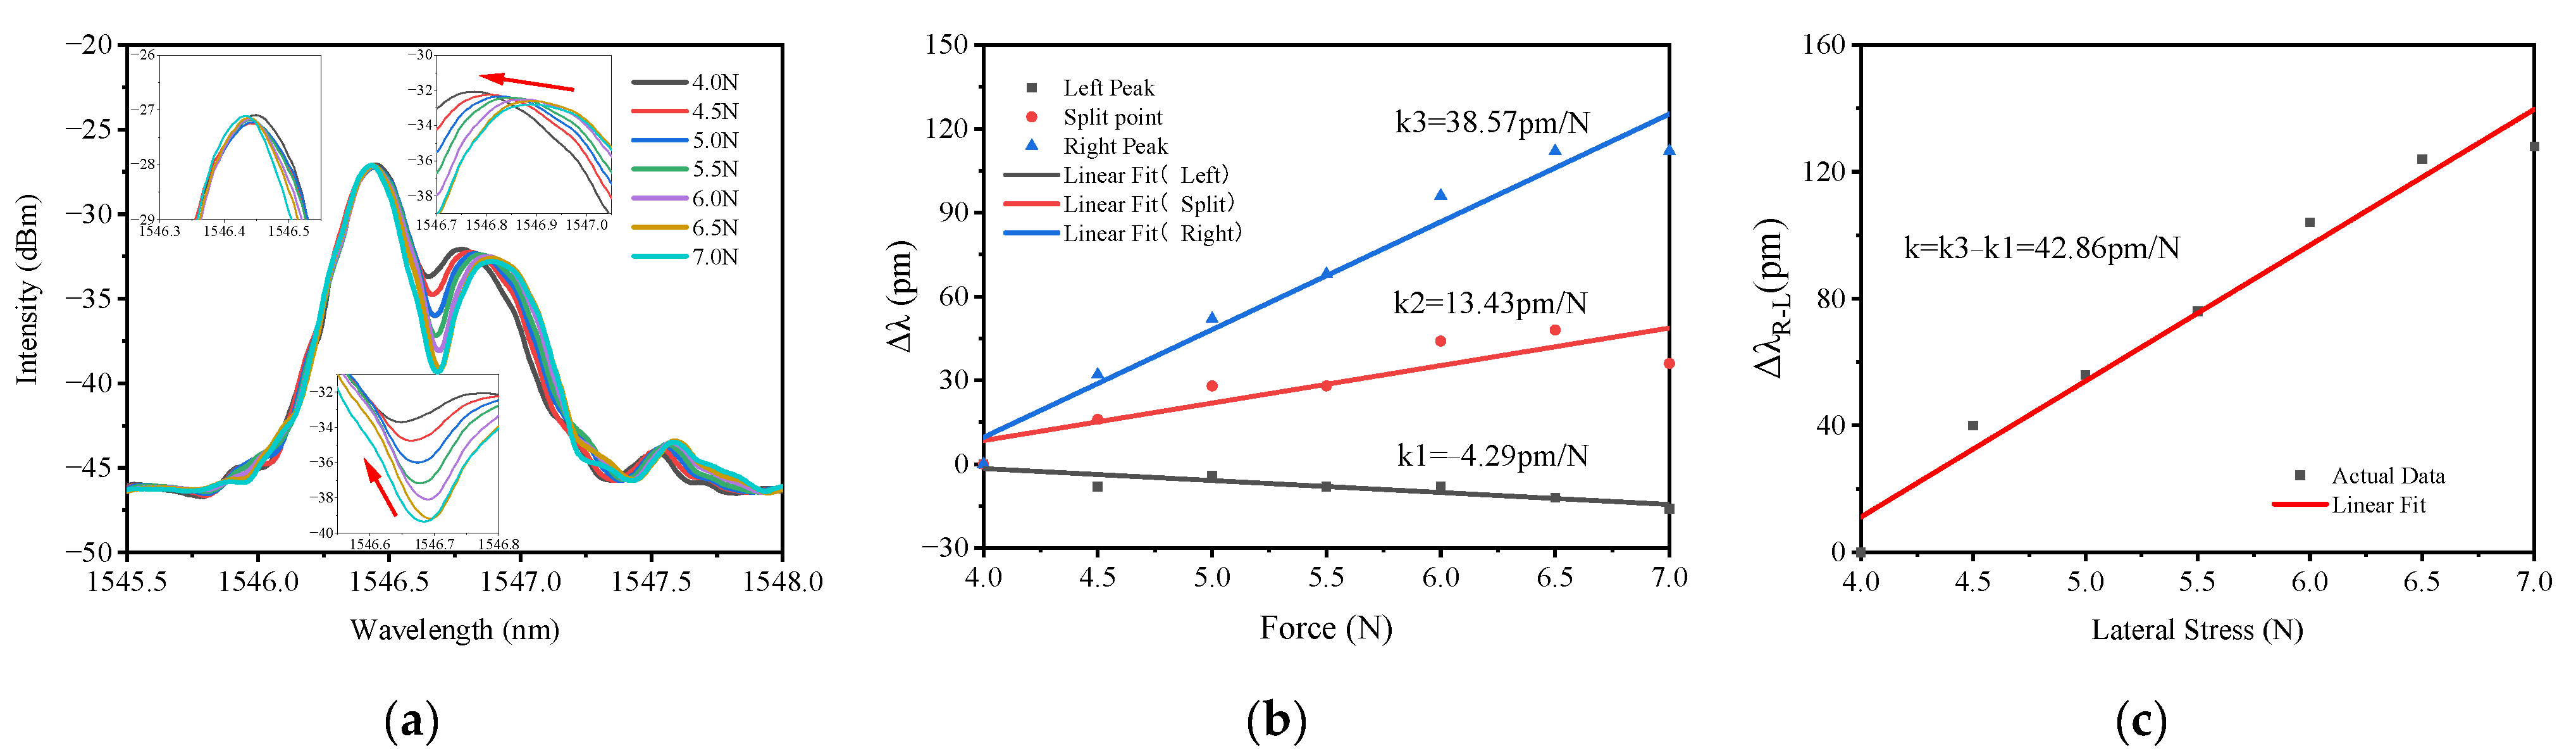
| Force/N | Left Peak /nm | Split Point /nm | Right Peak /nm | ||||||
|---|---|---|---|---|---|---|---|---|---|
| Loading | Unloading | Error | Loading | Unloading | Error | Loading | Unloading | Error | |
| 4.0 | 1546.444 | 1546.448 | 0.004 | 1546.632 | 1546.648 | 0.016 | 1546.752 | 1546.776 | 0.024 |
| 4.5 | 1546.440 | 1546.440 | 0.000 | 1546.644 | 1546.664 | 0.020 | 1546.784 | 1546.808 | 0.024 |
| 5.0 | 1546.436 | 1546.444 | 0.008 | 1546.648 | 1546.676 | 0.028 | 1546.804 | 1546.828 | 0.024 |
| 5.5 | 1546.436 | 1546.440 | 0.004 | 1546.652 | 1546.676 | 0.024 | 1546.816 | 1546.844 | 0.028 |
| 6.0 | 1546.436 | 1546.440 | 0.004 | 1546.668 | 1546.692 | 0.024 | 1546.848 | 1546.872 | 0.024 |
| 6.5 | 1546.436 | 1546.436 | 0.000 | 1546.672 | 1546.696 | 0.024 | 1546.868 | 1546.888 | 0.020 |
| 7.0 | 1546.432 | 1546.432 | 0.000 | 1546.684 | 1546.684 | 0.000 | 1546.892 | 1546.888 | −0.004 |
| Interval Time (h) | Force/N | Left Peak /nm | Split Point /nm | Right Peak /nm | |||
|---|---|---|---|---|---|---|---|
| Loading | Unloading | Loading | Unloading | Loading | Unloading | ||
| 12 | 4.0 | 1546.424 | 1546.444 | 1546.596 | 1546.636 | 1546.716 | 1546.752 |
| 4.5 | 1546.424 | 1546.442 | 1546.596 | 1546.644 | 1546.732 | 1546.784 | |
| 5.0 | 1546.420 | 1546.440 | 1546.604 | 1546.652 | 1546.748 | 1546.808 | |
| 5.5 | 1546.416 | 1546.438 | 1546.612 | 1546.656 | 1546.764 | 1546.848 | |
| 6.0 | 1546.416 | 1546.438 | 1546.624 | 1546.662 | 1546.796 | 1546.852 | |
| 6.5 | 1546.412 | 1546.436 | 1546.628 | 1546.678 | 1546.812 | 1546.868 | |
| 7.0 | 1546.420 | 1546.436 | 1546.652 | 1546.692 | 1546.864 | 1546.884 | |
| 24 | 4.0 | 1546.428 | 1546.428 | 1546.596 | 1546.596 | 1546.696 | 1546.716 |
| 4.5 | 1546.426 | 1546.424 | 1546.600 | 1546.602 | 1546.728 | 1546.728 | |
| 5.0 | 1546.426 | 1546.424 | 1546.604 | 1546.606 | 1546.744 | 1546.744 | |
| 5.5 | 1546.422 | 1546.426 | 1546.612 | 1546.612 | 1546.756 | 1546.764 | |
| 6.0 | 1546.422 | 1546.426 | 1546.624 | 1546.624 | 1546.780 | 1546.792 | |
| 6.5 | 1546.422 | 1546.422 | 1546.632 | 1546.628 | 1546.808 | 1546.812 | |
| 7.0 | 1546.424 | 1546.424 | 1546.632 | 1546.632 | 1546.824 | 1546.822 | |
| 48 | 4.0 | 1546.431 | 1546.424 | 1546.604 | 1546.600 | 1546.724 | 1546.718 |
| 4.5 | 1546.424 | 1546.426 | 1546.598 | 1546.602 | 1546.739 | 1546.738 | |
| 5.0 | 1546.429 | 1546.426 | 1546.609 | 1546.611 | 1546.753 | 1546.755 | |
| 5.5 | 1546.425 | 1546.423 | 1546.614 | 1546.619 | 1546.772 | 1546.771 | |
| 6.0 | 1546.417 | 1546.417 | 1546.625 | 1546.627 | 1546.805 | 1546.799 | |
| 6.5 | 1546.412 | 1546.420 | 1546.632 | 1546.629 | 1546.813 | 1546.818 | |
| 7.0 | 1546.422 | 1546.427 | 1546.653 | 1546.652 | 1546.867 | 1546.866 | |
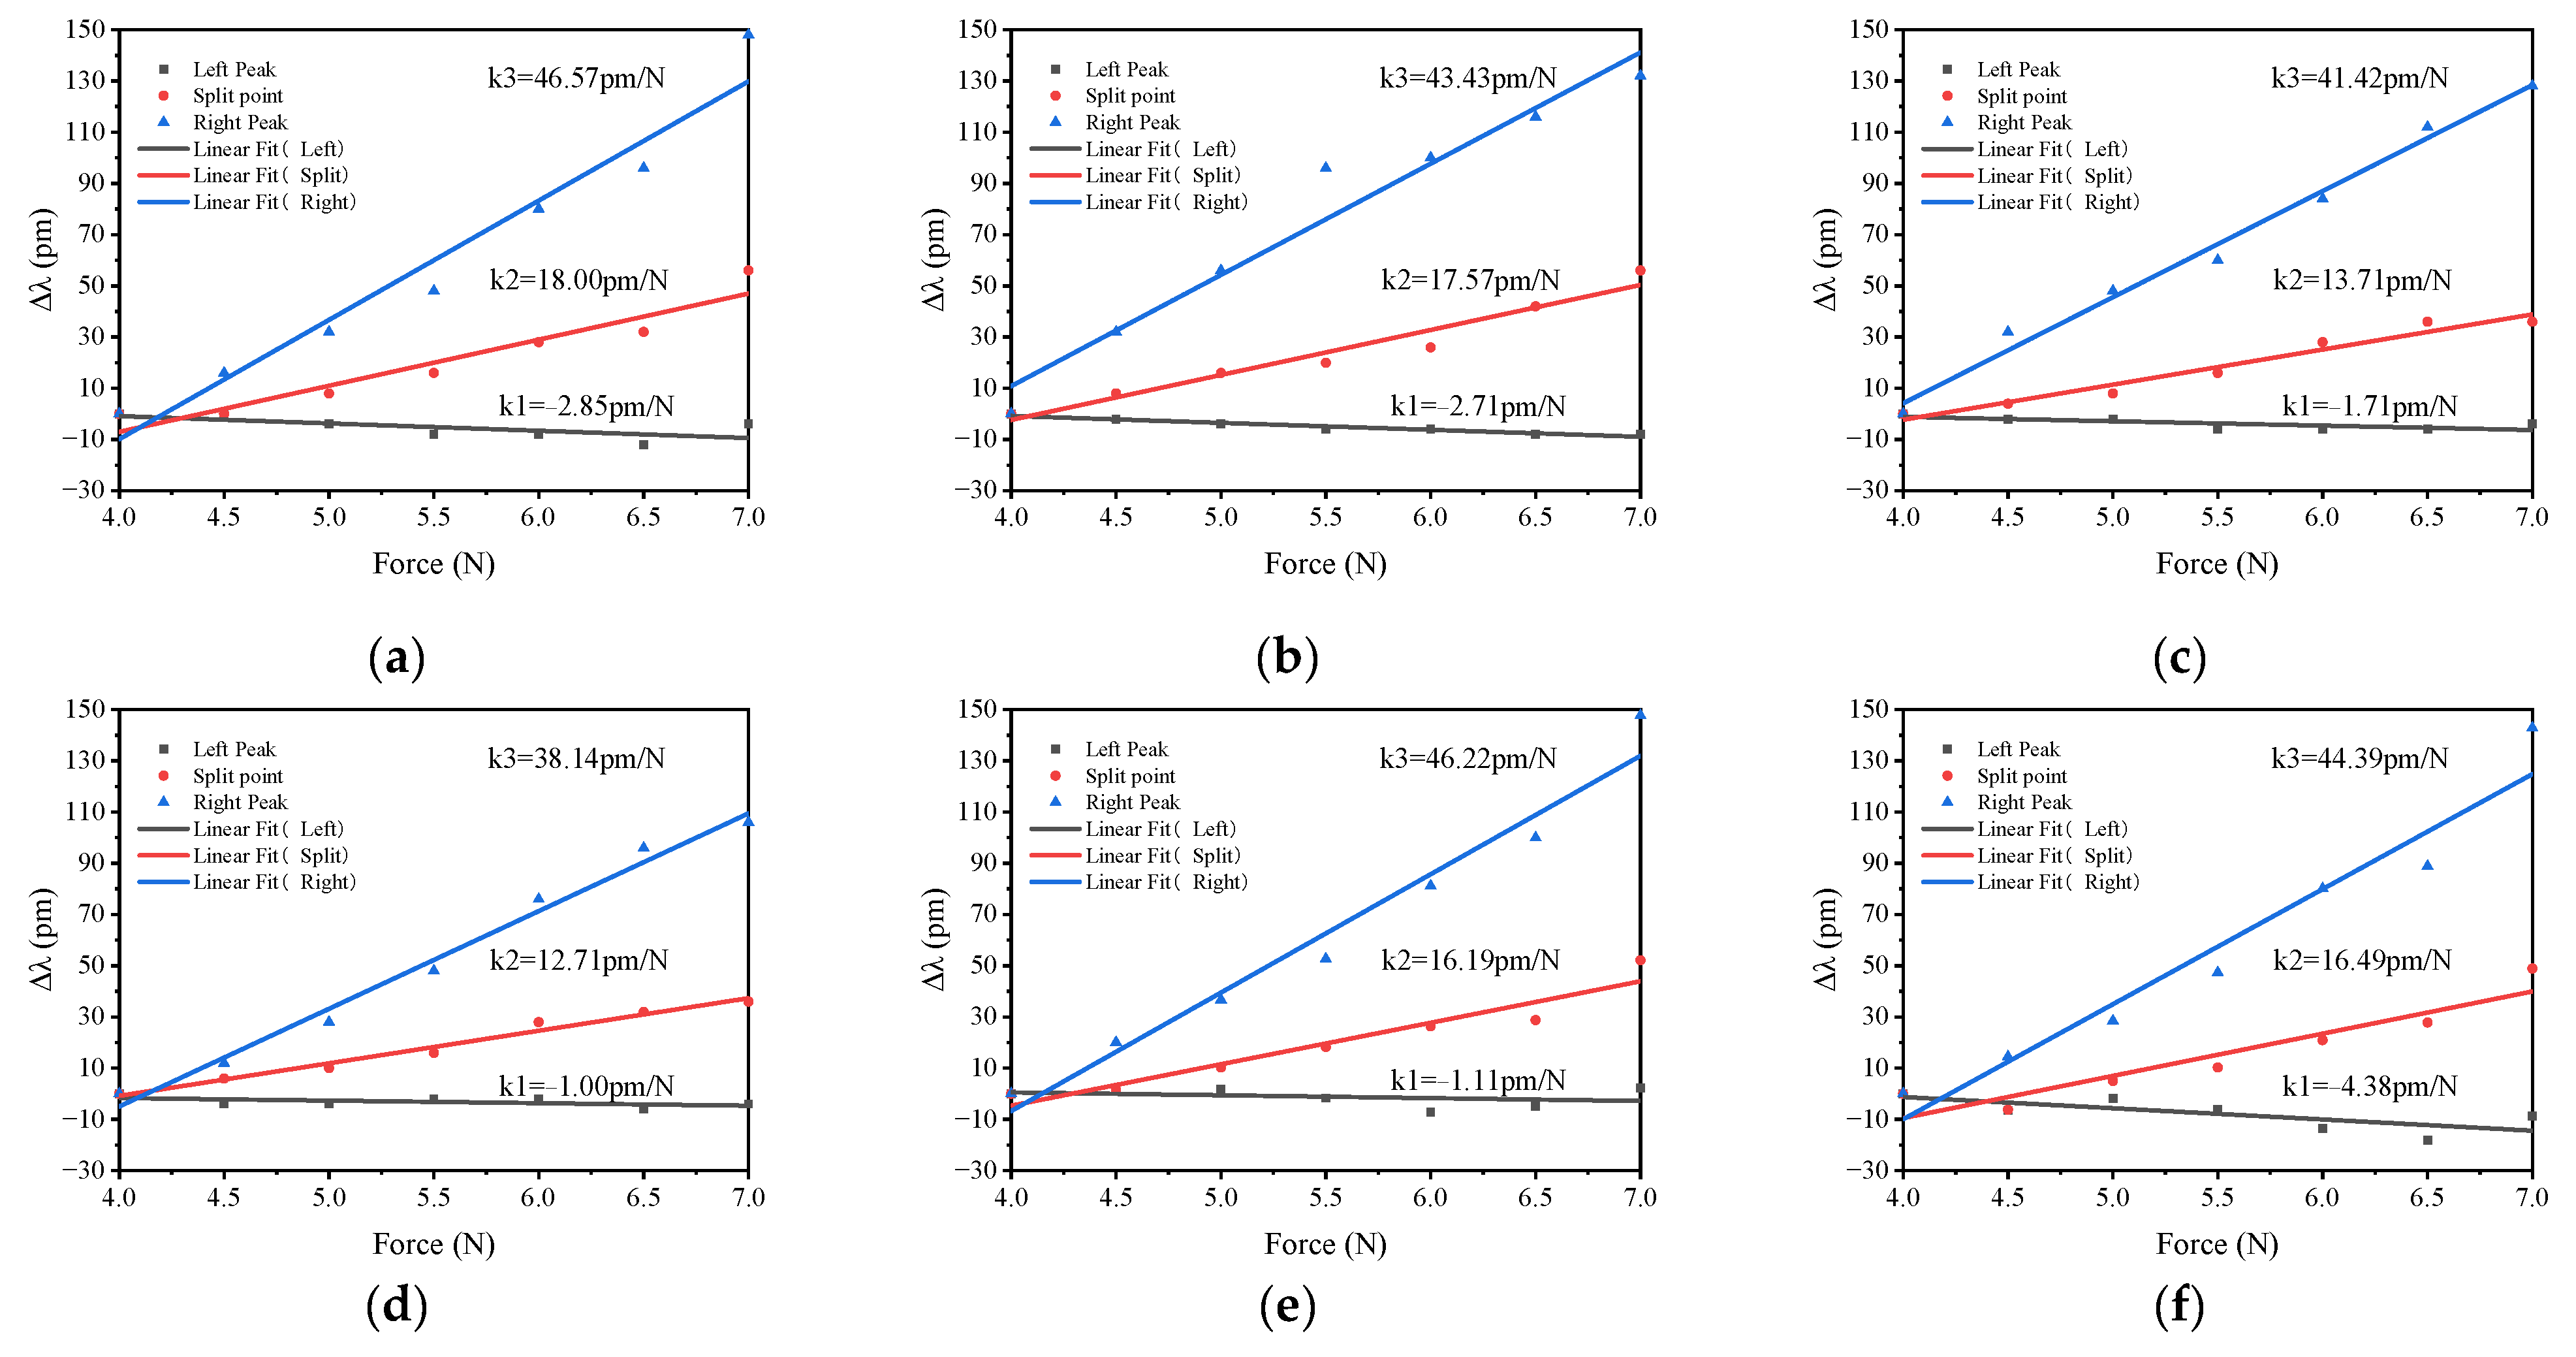
| Interval Time (h) | Sensitivity (pm/N) | ||||||
|---|---|---|---|---|---|---|---|
| Left Peak (k1) | Error | Split Point (k2) | Error | Right Peak (k3) | Error | ||
| 12 | Loading | −2.85 | −0.56 | 18.00 | 2.22 | 46.57 | 3.21 |
| Unloading | −2.71 | −0.42 | 17.57 | 1.79 | 43.43 | 0.07 | |
| 24 | Loading | −1.71 | 0.58 | 13.71 | −2.07 | 41.42 | −1.94 |
| Unloading | −1.00 | 1.29 | 12.71 | −3.07 | 38.14 | −5.22 | |
| 48 | Loading | −1.11 | 1.18 | 16.19 | 0.41 | 46.22 | 2.86 |
| Unloading | −4.38 | −2.09 | 16.49 | 0.71 | 44.39 | 1.03 | |
Disclaimer/Publisher’s Note: The statements, opinions and data contained in all publications are solely those of the individual author(s) and contributor(s) and not of MDPI and/or the editor(s). MDPI and/or the editor(s) disclaim responsibility for any injury to people or property resulting from any ideas, methods, instructions or products referred to in the content. |
© 2023 by the authors. Licensee MDPI, Basel, Switzerland. This article is an open access article distributed under the terms and conditions of the Creative Commons Attribution (CC BY) license (https://creativecommons.org/licenses/by/4.0/).
Share and Cite
Xiong, J.; Zhang, W.; Song, Y.; Wen, K.; Zhou, Y.; Chen, G.; Zhu, L. Spectral Splitting Sensing Using Optical Fiber Bragg Grating for Spacecraft Lateral Stress Health Monitoring. Appl. Sci. 2023, 13, 4161. https://doi.org/10.3390/app13074161
Xiong J, Zhang W, Song Y, Wen K, Zhou Y, Chen G, Zhu L. Spectral Splitting Sensing Using Optical Fiber Bragg Grating for Spacecraft Lateral Stress Health Monitoring. Applied Sciences. 2023; 13(7):4161. https://doi.org/10.3390/app13074161
Chicago/Turabian StyleXiong, Jie, Wen Zhang, Yanming Song, Ke Wen, Yinghao Zhou, Guanghui Chen, and Lianqing Zhu. 2023. "Spectral Splitting Sensing Using Optical Fiber Bragg Grating for Spacecraft Lateral Stress Health Monitoring" Applied Sciences 13, no. 7: 4161. https://doi.org/10.3390/app13074161