Article

Performance of Pavement Temperature Prediction Models

by
Angella Lekea
1,* and
Wynand J. vdM. Steyn
2
1
TRL Limited, Workingham RG40 3GA, UK
2
Department of Civil Engineering, University of Pretoria, Pretoria 0002, South Africa
*
Author to whom correspondence should be addressed.
Appl. Sci. 2023, 13(7), 4164; https://doi.org/10.3390/app13074164
Submission received: 14 February 2023 / Revised: 22 March 2023 / Accepted: 23 March 2023 / Published: 24 March 2023
(This article belongs to the Section Civil Engineering)

Abstract

:
Appropriate asphalt binder selection is dependent on the correct determination of maximum and minimum pavement temperatures. Temperature prediction models have been developed to determine pavement design temperatures. Accordingly, accurate temperature prediction is necessary to ensure the correct design of climate-resilient pavements and for suitable pavement overlay design. Research has shown that the complexity of the model, input variables, geographical location among others affect the accuracy of temperature prediction models. Calibration has also proved to improve the accuracy of the predicted temperature. In this paper, the performance of three pavement temperature prediction models with a sample of materials, including asphalt, was examined. Furthermore, the effect of calibration on model accuracy was evaluated. Temperature data sourced from Pretoria were used to calibrate and test the models. The performance of both the calibrated and uncalibrated models in a different geographical location was also assessed. Asphalt temperature data from two locations in Ghana were used. The determination coefficient (R2), Variance Accounted For (VAF), Maximum Relative Error (MRE) and Root Mean Square Error (RMSE) statistical methods were used in the analysis. It was observed that the models performed better at predicting maximum temperature, while minimum temperature predictions were highly variable. The performance of the models varied for the maximum temperature prediction depending on the material. Calibration improved the accuracy of the models, but test data relevant to each location ought to be used for calibration to be effective. There is also a need for the models to be tested with data sourced from other continents.

1. Introduction

It is important that the right asphalt binder is selected to ensure the longevity of the pavement with low maintenance and repair costs given the high cost of hot mix asphalt. The performance of asphalt binders on the road is affected by environmental factors such as air temperature and moisture. While moisture can be controlled through drainage provisions, the sensitivity of the pavement’s performance to temperature [1] is of particular concern.
Asphalt binders are selected based on their performance under expected pavement temperature extremes, i.e., the average seven-day maximum pavement temperature and the minimum pavement temperature, in the location of their intended use. The pavement temperatures are determined from air temperature. The maximum pavement temperature is determined at a depth of 20 mm below the pavement surface. Shear stresses arising from a combination of pavement temperature and traffic loading were determined to be critical at this depth [2].
At high temperatures, asphalt softens and pavement damage such as rutting will appear on the pavement, while at low temperatures asphalt stiffens and is subject to thermal cracking. The penetration grading system of measuring asphalt binder performance ensures that the asphalt binder used has sufficient stiffness to resist rutting and adequate resistance to thermal cracking. The correct selection of asphalt binders thus ensures that the asphalt binder chosen meets both the expected maximum and minimum pavement temperature requirements for the serviceability of the road under the given environmental conditions.
Extensive research has been carried out across the world and in different climatological regions to formulate pavement temperature prediction models that can be used to select asphalt binder materials for asphalt roads [3,4]. The models can be categorised as theoretical—based on the principles of heat transfer—or empirical models—based on statistical analysis of the measured environmental factors to determine pavement temperature.
Theoretical models are widely acceptable, but they are more complex and require several input variables than the latter. This makes it more difficult to obtain accurate results when using theoretical models [5]. Empirical models, on the other hand, are simpler but require calibration. Their accuracy is highly dependent on the database used in developing the model. Kassem et al. [6] also found that calibration of the models improved the accuracy of the pavement temperature predicted values. The accuracy of predicted pavement temperature is also affected by the availability and accuracy of weather data, as well as variability of thermal properties of pavement materials [7].
According to Qin et al. [8], pavement temperature is mainly affected by air temperature, but other factors such as geographical location play a major role. Asefzadeh et al. and Dzotepe [9,10] noted that geographical location significantly affects the accuracy of predicted pavement temperature. The effect of geographical location has been considered in most models through the inclusion of the latitude of the area under study.
Several studies have been undertaken in different parts of the world (India, Pakistan, Iraq, Kuwait, Thailand, Egypt, Libya (cited from Tutu et al. [11]), Oman [12], Ghana [11] and Australia [13]) to determine the applicability of pavement prediction models in performance grade selection. Denneman et al. [13] observed good agreement in the predicted maximum pavement temperature for both internationally and locally developed models; however, they [13] noted more variability between model predictions for minimum pavement temperature. Tutu et al. [11] in their study identified the need for locally developed models. They [11] established that the Strategic Highway Research Program (SHRP) Superpave model did not perform reliability for performance binder selection in Ghana.
Developing temperature prediction models would require resources in terms of time, finances and labour. In the absence of local models, published models that are widely used in pavement design for binder selection have to be used. This paper reviewed pavement prediction models based on ambient temperatures and latitude as input variables. Most temperature prediction models have been developed to predict pavement temperature for use in asphalt binder selection. In this study, the performance of temperature prediction models with other pavement materials (gravel, concrete, block paving) including asphalt was examined. The effect of calibration on predicted values, for the different materials, was also examined. The performance of both the calibrated and uncalibrated models in different geographical locations was also evaluated. Asphalt pavement temperature data sourced from two locations in Ghana were used.

2. Materials and Methods

2.1. Literature Review

A review of five location-based temperature prediction models was carried out. These included the Strategic Highway Research Program (SHRP) Superpave model [2], South Africa model developed by Viljoen [14], Saudi Arabia model developed by Wahab et al. [15], United States of America (USA) model developed by Diefenderfer et al. [16] and an Oman model developed by Hassan et al. [17]. The data collection process and the strengths and weaknesses of the three models are discussed in the following sections.

2.1.1. SHRP Superpave Model

SHRP developed the first Superpave™ method for asphalt mix design between 1987 and 1993 that included temperature models as part of the design method [2]. Two models are used to estimate minimum and maximum pavement temperatures, from air temperature. A theoretical model is used to estimate maximum pavement temperature from the maximum air temperature and geographical location (latitude). This model was developed based on the results of heat-transfer modelling and regression analysis. Huber [18] further simplified the equations for maximum and minimum pavement temperatures. Pavement and air temperatures collected at 30 test sites throughout North America were used. Thus, the model may require verification and calibration for use at other geographical locations.

2.1.2. Viljoen Model

Viljoen [14] used local pavement temperature data to develop temperature prediction equations for asphalt pavements in South Africa. A difference in the final form of the equations of Viljoen [14] and Superpave is the inclusion of the zenith angle, in addition to the latitude. The inclusion of the zenith angle allows for seasonal, and daily, variation in solar energy potential.
Denneman [19] further validated the model using new pavement temperature data from outside the datasets with which the model was developed. It was demonstrated that both Viljoen’s model and the SHRP Superpave model provide accurate predictions of the maximum surface temperature. The Viljoen model, generally, had less scatter, and therefore a smaller standard deviation for the error of the maximum surface temperature prediction. The difference in consistency was attributed to the inclusion of the zenith angle in the Viljoen model. It was concluded that the Viljoen model provides a pavement temperature prediction with an accuracy that is acceptable for use in hot mixed asphalt (HMA) design. It is important, however, to select a nearby weather station in an area that has a very similar climate.

2.1.3. Saudi Arabia Model

Wahab et al. [15] investigated trends in pavement temperature variation in an arid environment in Saudi Arabia. Pavement temperature variation with pavement depth was monitored for two years, and a statistically reliable correlation developed between air temperature and pavement temperature at any depth if the surface or air temperature is known.
Measurements were carried out at two test sites, in Riyadh and Dharan. The Riyadh test site used asphalt concrete slabs of 15, 20 and 30 cm thickness. The Dharan test site used a 25 cm asphalt-bound layer on top of a compacted aggregate subbase. The asphalt slabs comprised a 5 cm dense graded wearing course mix and a dense graded base course mix with variable thickness. Temperature measurements were taken at 2, 4, 8 and 16 cm and at the bottom of the pavement. The air temperature was measured at a height of 1.5 m above the pavement surface. A good correlation (R2 = 93%) was established between recorded air temperature and pavement surface and depth temperature. This model, however, was developed for Saudi Arabia, which has a desert climate.

2.1.4. Diefenderfer Model

Diefenderfer et al. [16] developed a model to predict daily maximum or minimum pavement temperatures using daily maximum or minimum ambient temperatures, the day of the year and the depth of pavement temperature required. The model was further developed by Diefenderfer et al. [20] to include the daily amount of solar radiation at a given location, thus enabling the model to predict pavement temperatures at any location. Data from the Virginia Smart Road were used to develop specific models to predict the daily maximum and minimum pavement temperature. In addition to using latitude as an input variable, the model also included the solar declination angle as an input variable, as in the Viljoen model. Thus, the performance of this model has also been considered.

2.1.5. Oman Model

Research was undertaken in Oman [17] to develop models to predict maximum and minimum asphalt pavement temperatures. A pavement monitoring station was set up at the Sultan Qaboos University campus to monitor air, pavement temperatures and solar radiation. Data were collected for 445 days. Daily minimum and maximum temperatures were recorded. Regression analysis was used to develop the minimum and maximum pavement temperature models, using air temperature, solar radiation and duration of solar radiation as independent variables. The maximum temperature prediction depth, however, is limited to the top 20 mm of the pavement.
Hassan et al. [17] also noted that solar radiation can be estimated using the relationship described in Diefenderfer et al. [20], which estimates solar radiation using the geographical latitude of any given location and day of the year.

2.2. Selection of Models

Of the five reviewed models, the SHRP Superpave model used in LTTPBind software, the Viljoen model used in Pavement Analysis and Design Software (PADS) and the Diefenderfer model, which includes the solar declination angle as an input variable as in the Viljoen model, were carried forward for evaluation of their performance. These were found to be applicable to different geographical locations and are not limited by the ambient temperatures like the Saudi Arabia model or the test depth as in the Oman model.

2.3. Data Collection

Empirical temperature data for air and asphalt, gravel, concrete and block paving materials were collected from Pretoria (South Africa) to determine the application of the temperature prediction models to different materials, including asphalt. Half of the data were used for calibrating the models, while the other half were used for validating the calibrated models.
Pavement temperature and air temperature data from two sites in Ghana were also obtained to evaluate the performance of the models in predicting pavement temperature at other geographical locations. This section describes the data collection process at the different locations.

2.3.1. Pretoria Data Collection

Temperature data for air, asphalt, gravel, concrete and block paving materials were measured over six months, from April 2021 to September 2021, in Pretoria. The temperature, for each of the different materials, was measured within the top 20 mm of the material. The sections were located within a radius of 500 m of one another. Data were collected every 15 min, using thermocouples installed in the pavement that were linked via a LoRAWAN network to a central hub. The temperature data from Pretoria were cleaned to remove any missing values.

2.3.2. Ghana Data Collection

Maximum ambient and asphalt pavement temperature data measured at two test sites in Ghana were obtained from Koranteng-Yorke [21] and used to validate the models. The temperature data were measured at Akumadan, on the Kumasi-Akumadan-Techiman national road, and Sogakope, on the Tema-Sogakope-Aflao national road. The ambient temperature was measured using a thermometer and the pavement temperature was measured using a thermocouple placed 1 m across an HMA wearing course at 20 mm depth for one year. Hourly temperature data measured over 24 h were used to validate the models.

2.4. Analysis

2.4.1. Pavement Temperature Prediction

The ambient temperature measured at the test sections was used to predict the temperature at 20 mm within the different materials. The predicted temperatures were determined using formulas presented in Huber [18] for the SHRP Superpave model; Viljoen [14] for the Viljoen model; and Diefenderfer et al. [20] for the Diefenderfer model; Microsoft Excel was used.

2.4.2. Data Randomization

The measured temperature and the corresponding predicted temperature were randomised for each of the three models, using the random function in Microsoft Excel. Random numbers were generated in a column beside the pavement temperatures. The random numbers were copied and pasted in an adjacent empty column. The pasted values were then dragged to replace the random numbers generated in the previous step. The dataset, including pavement temperature data and random numbers, was sorted in ascending order. This ensured that the data were randomised to avoid bias likely to arise from effects of using data from one season.

2.4.3. Calibration

After randomisation of the temperature data, scatter plots were plotted with one half of the data. The predicted pavement temperature was plotted on the y-axis and the measured temperature on the x-axis. The line of best fit for the plotted points was determined. To calibrate the models for each of the materials, adjustments were applied to the intercept and slope of the line of best fit to reduce the error between measured and predicted values until the predicted pavement temperatures plotted closer to the line y = x. The adjusted equation was taken as the calibrated equation for the respective model and used to predict pavement temperature for the remaining half of the dataset.
The predicted pavement temperature using the calibrated equation was compared with the model predicted pavement temperature to evaluate the effect of calibration on model accuracy.

2.4.4. Statistical Analysis

Statistical analysis methods, including the determination coefficient (R2), Variance Accounted For (VAF), Maximum Relative Error (MRE) and Root Mean Square Error (RMSE) were used to evaluate model performance for the different materials, for both calibrated and uncalibrated data, as well as model performance at the Akumadan and Sogakope test sites in Ghana.
  • R2 measures goodness of fit, i.e., how well a linear regression model fits the measured data, where R 2 = i = 1 N ( x x ) ( y y ) i = 1 N ( x x ) 2 i = 1 N ( y y ) 2 2 . R2 varies between 0 and 1; the closer it is to 1, the better the model, i.e., 100% of the variation in the model can be explained by the predictor variables;
  • VAF measures the variance accounted for between measured values and predicted values, where V A F = 100 1 v a r x y v a r x . The closer the VAF is to 100, the better the model;
  • MRE is defined as the ratio of the absolute error of the predicted value to the measured value, where M R E = m a x 100 x y x . This provides a measure of how large the error is relative to measured values, so that the closer the value is to zero, the better the model;
  • RMSE measures the extent to which predicted values deviate from measured/actual values, on average, where R M S E = 1 N i = 1 N ( x y ) 2 . RMSE decreases as the error in the predicted values decreases, so that the closer the value is to zero, the better the model.
Here, x and y are measured values and predicted values, respectively; x and y are average measured values and average predicted values, respectively; var(.) is the variance.
The statistical results for R2 were expressed as a percentage and plotted on graphs alongside the VAF (%) and MRE (%). The RMSE was not converted to percentage to avoid vertical scale exaggeration. The plots are presented in Figure 1, Figure 2 and Figure 3. The closer the R2 (%) and VAF (%) are to 100, the more accurate the model predictions, while the closer the MRE (%) and RMSE are to zero, the more accurate the model predictions.

3. Results

The performance of the models for maximum and minimum temperature prediction was evaluated using the statistical methods discussed above. The performance of the models with different pavement materials (asphalt, concrete, block paving and gravel), the effect of calibration on the accuracy of the models’ predicted values and the effect of geographical location on both the calibrated and uncalibrated models were examined.

3.1. Performance of Pavement Temperature Prediction Models for Different Pavement Materials, before Calibration

3.1.1. Predicted Maximum Temperature

The results of the different statistical tests were examined and compared to identify the best model for predicting the maximum temperature for the different materials. A summary of the predicted maximum temperature for both the calibrated and uncalibrated models is presented in Figure 1. The detailed results are presented in Table 1.
The lower the MRE and RMSE of the model predicted maximum temperature, the more accurate the model is. For the different materials evaluated, the Viljoen model had the lowest MRE and low RMSE for asphalt and gravel, and the Diefenderfer model had the lowest MRE and RMSE for concrete as shown in Figure 1. The performance of the models for block paving was highly variable and thus inconclusive. For predicted maximum temperature in block paving, the Viljoen model had the lowest MRE but the lowest VAF; the Diefenderfer model had the lowest RMSE but a higher MRE than the Viljoen model; while the SHRP Superpave model had the highest VAF but the highest MRE. The SHRP Superpave model performed best with gravel.

3.1.2. Predicted Minimum Temperature

A summary of results for the minimum predicted temperature for both the calibrated and uncalibrated models is presented in Figure 2. The detailed results are presented in Table 2.
The model predictions for minimum temperature were variable and inconsistent as shown by the low VAF values. The lower the MRE and RMSE of the model-predicted minimum temperature, the more accurate the model is. For the different materials examined, the Diefenderfer model performed best for minimum temperature prediction for all the materials tested. The Diefenderfer model, however, had the least goodness of fit and VAF for asphalt. Thus, the accuracy of the models for minimum predicted temperature in asphalt was inconsistent.

3.2. Performance of Calibrated Models

The R2 value for the maximum and minimum temperature calibrated models was equal to that of the uncalibrated models; therefore, the variation in the models was the same for both the calibrated and uncalibrated models.

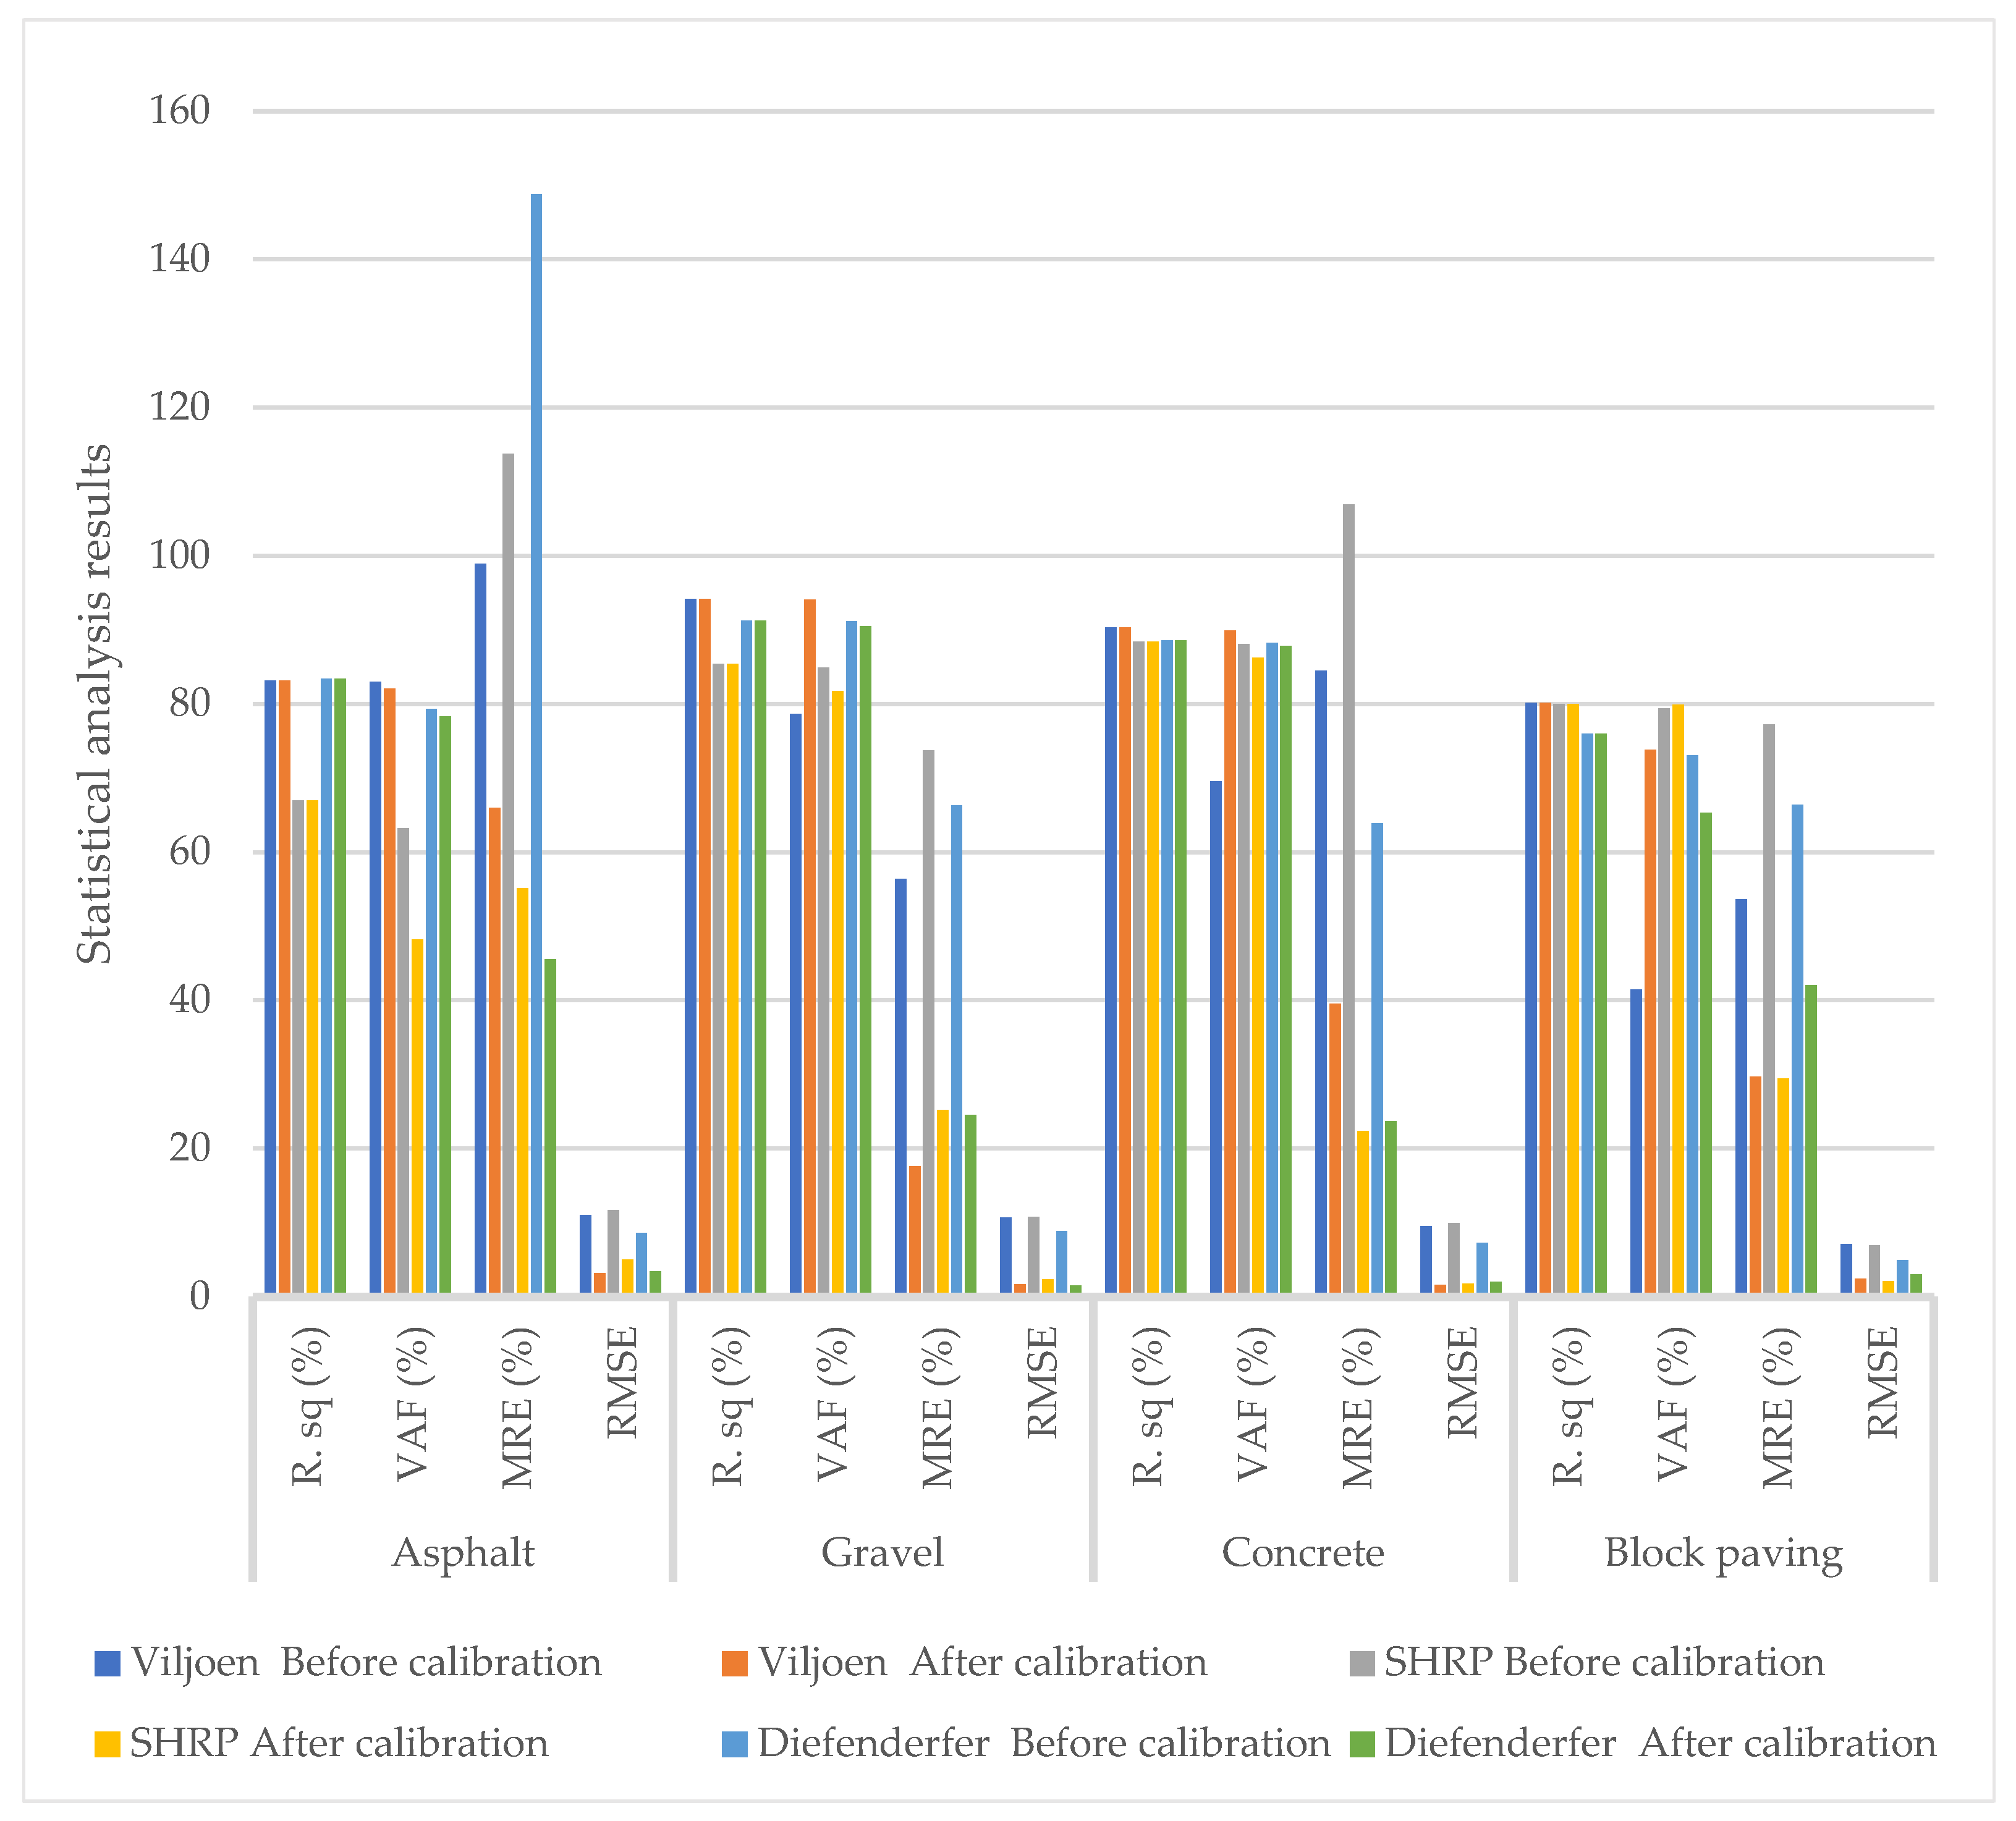
3.2.1. Calibrated Maximum Temperature Models

Calibration of the maximum temperature prediction models improved the accuracy of predicted temperatures. This is shown in Figure 1 by the reduction in RMSE and MRE for all the models. The greatest improvement in the accuracy of predicted maximum temperature values after calibration was observed with the Viljoen model for gravel, concrete and block paving. Increment in the VAF of the calibrated model was observed for the Viljoen model in gravel, concrete and block paving, while the VAF of the other models did not increase after calibration. For asphalt, the Diefenderfer model showed the greatest improvement for predicted maximum temperature values after calibration.

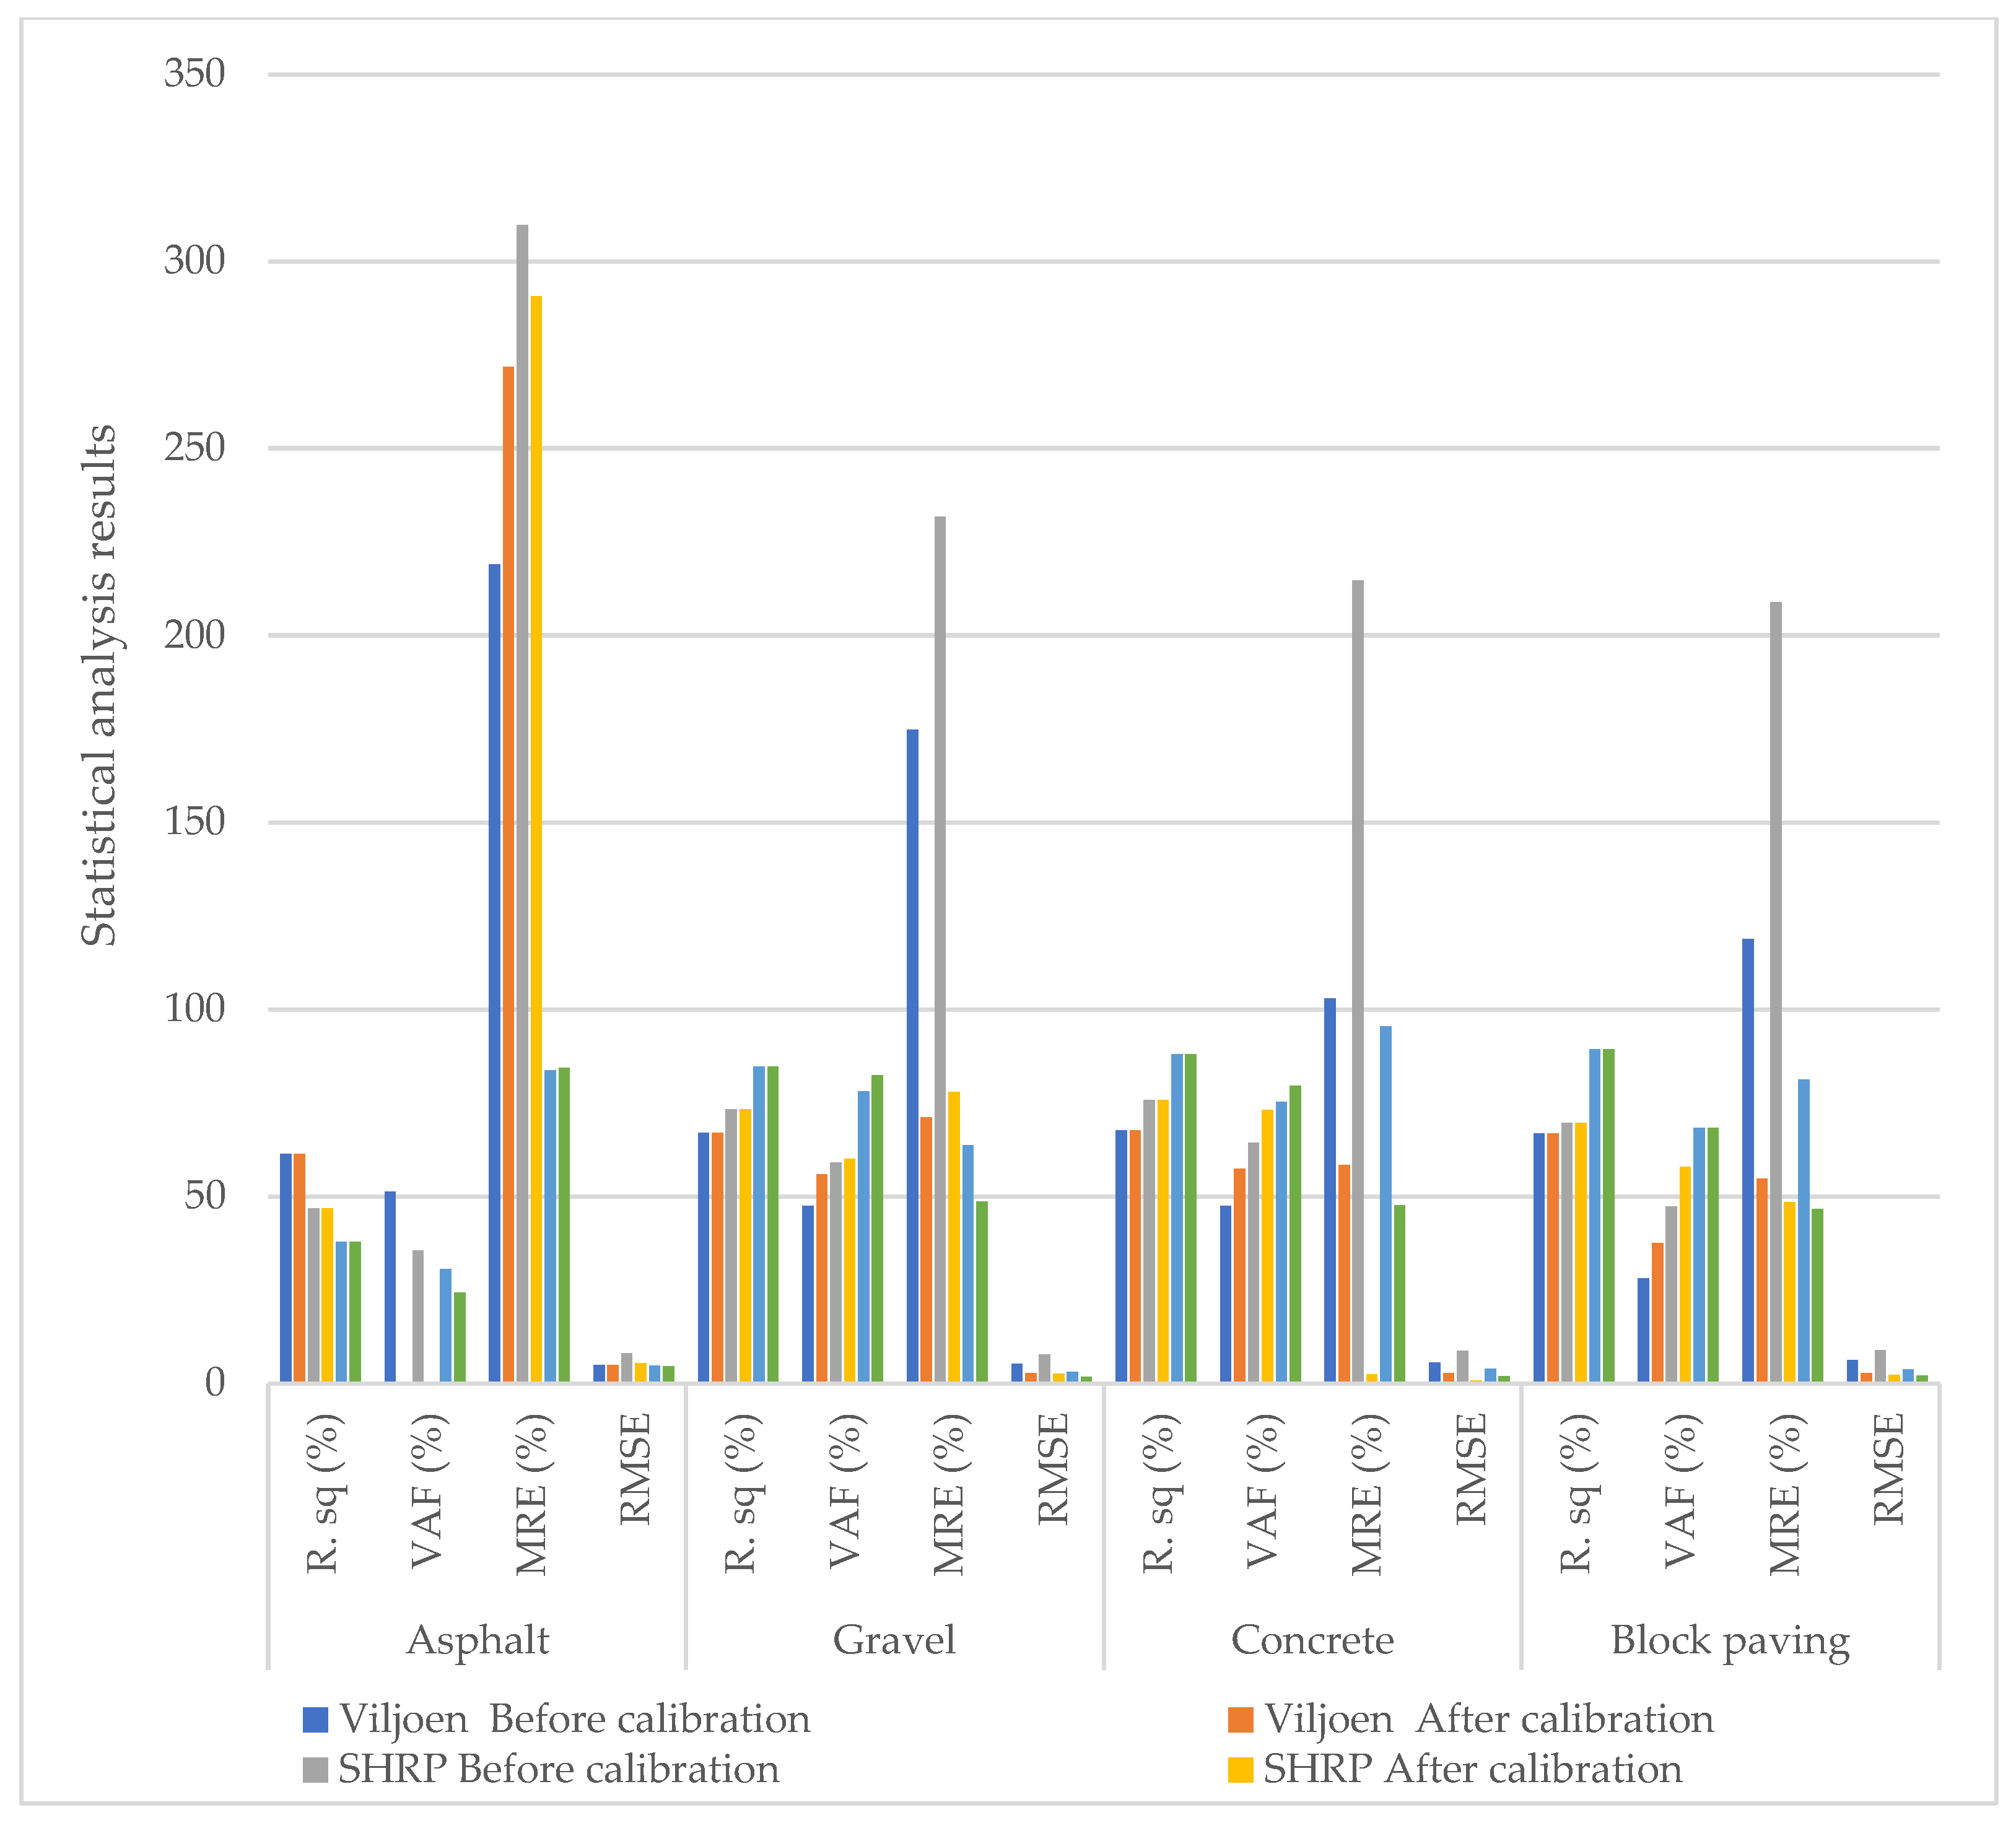
3.2.2. Calibrated Minimum Temperature Models

Higher variability was observed for minimum predicted temperatures, as shown by the lower VAF percentages. Calibration was effective at improving the accuracy of the models for the minimum predicted temperature of gravel, concrete and block paving. This is shown by the increase in VAF and reduced MRE and RMSE between the uncalibrated and calibrated models as shown in Figure 2. The greatest improvement in the accuracy of predicted minimum temperatures was observed with the SHRP Superpave model for gravel, concrete and block paving. Calibration was not effective for improving the accuracy of the Viljoen and Diefenderfer minimum temperature predictions for asphalt. The accuracy of the SHRP Superpave model was only slightly improved for asphalt. This is shown by the reduced RMSE and MRE, but lower VAF for asphalt in Figure 2.

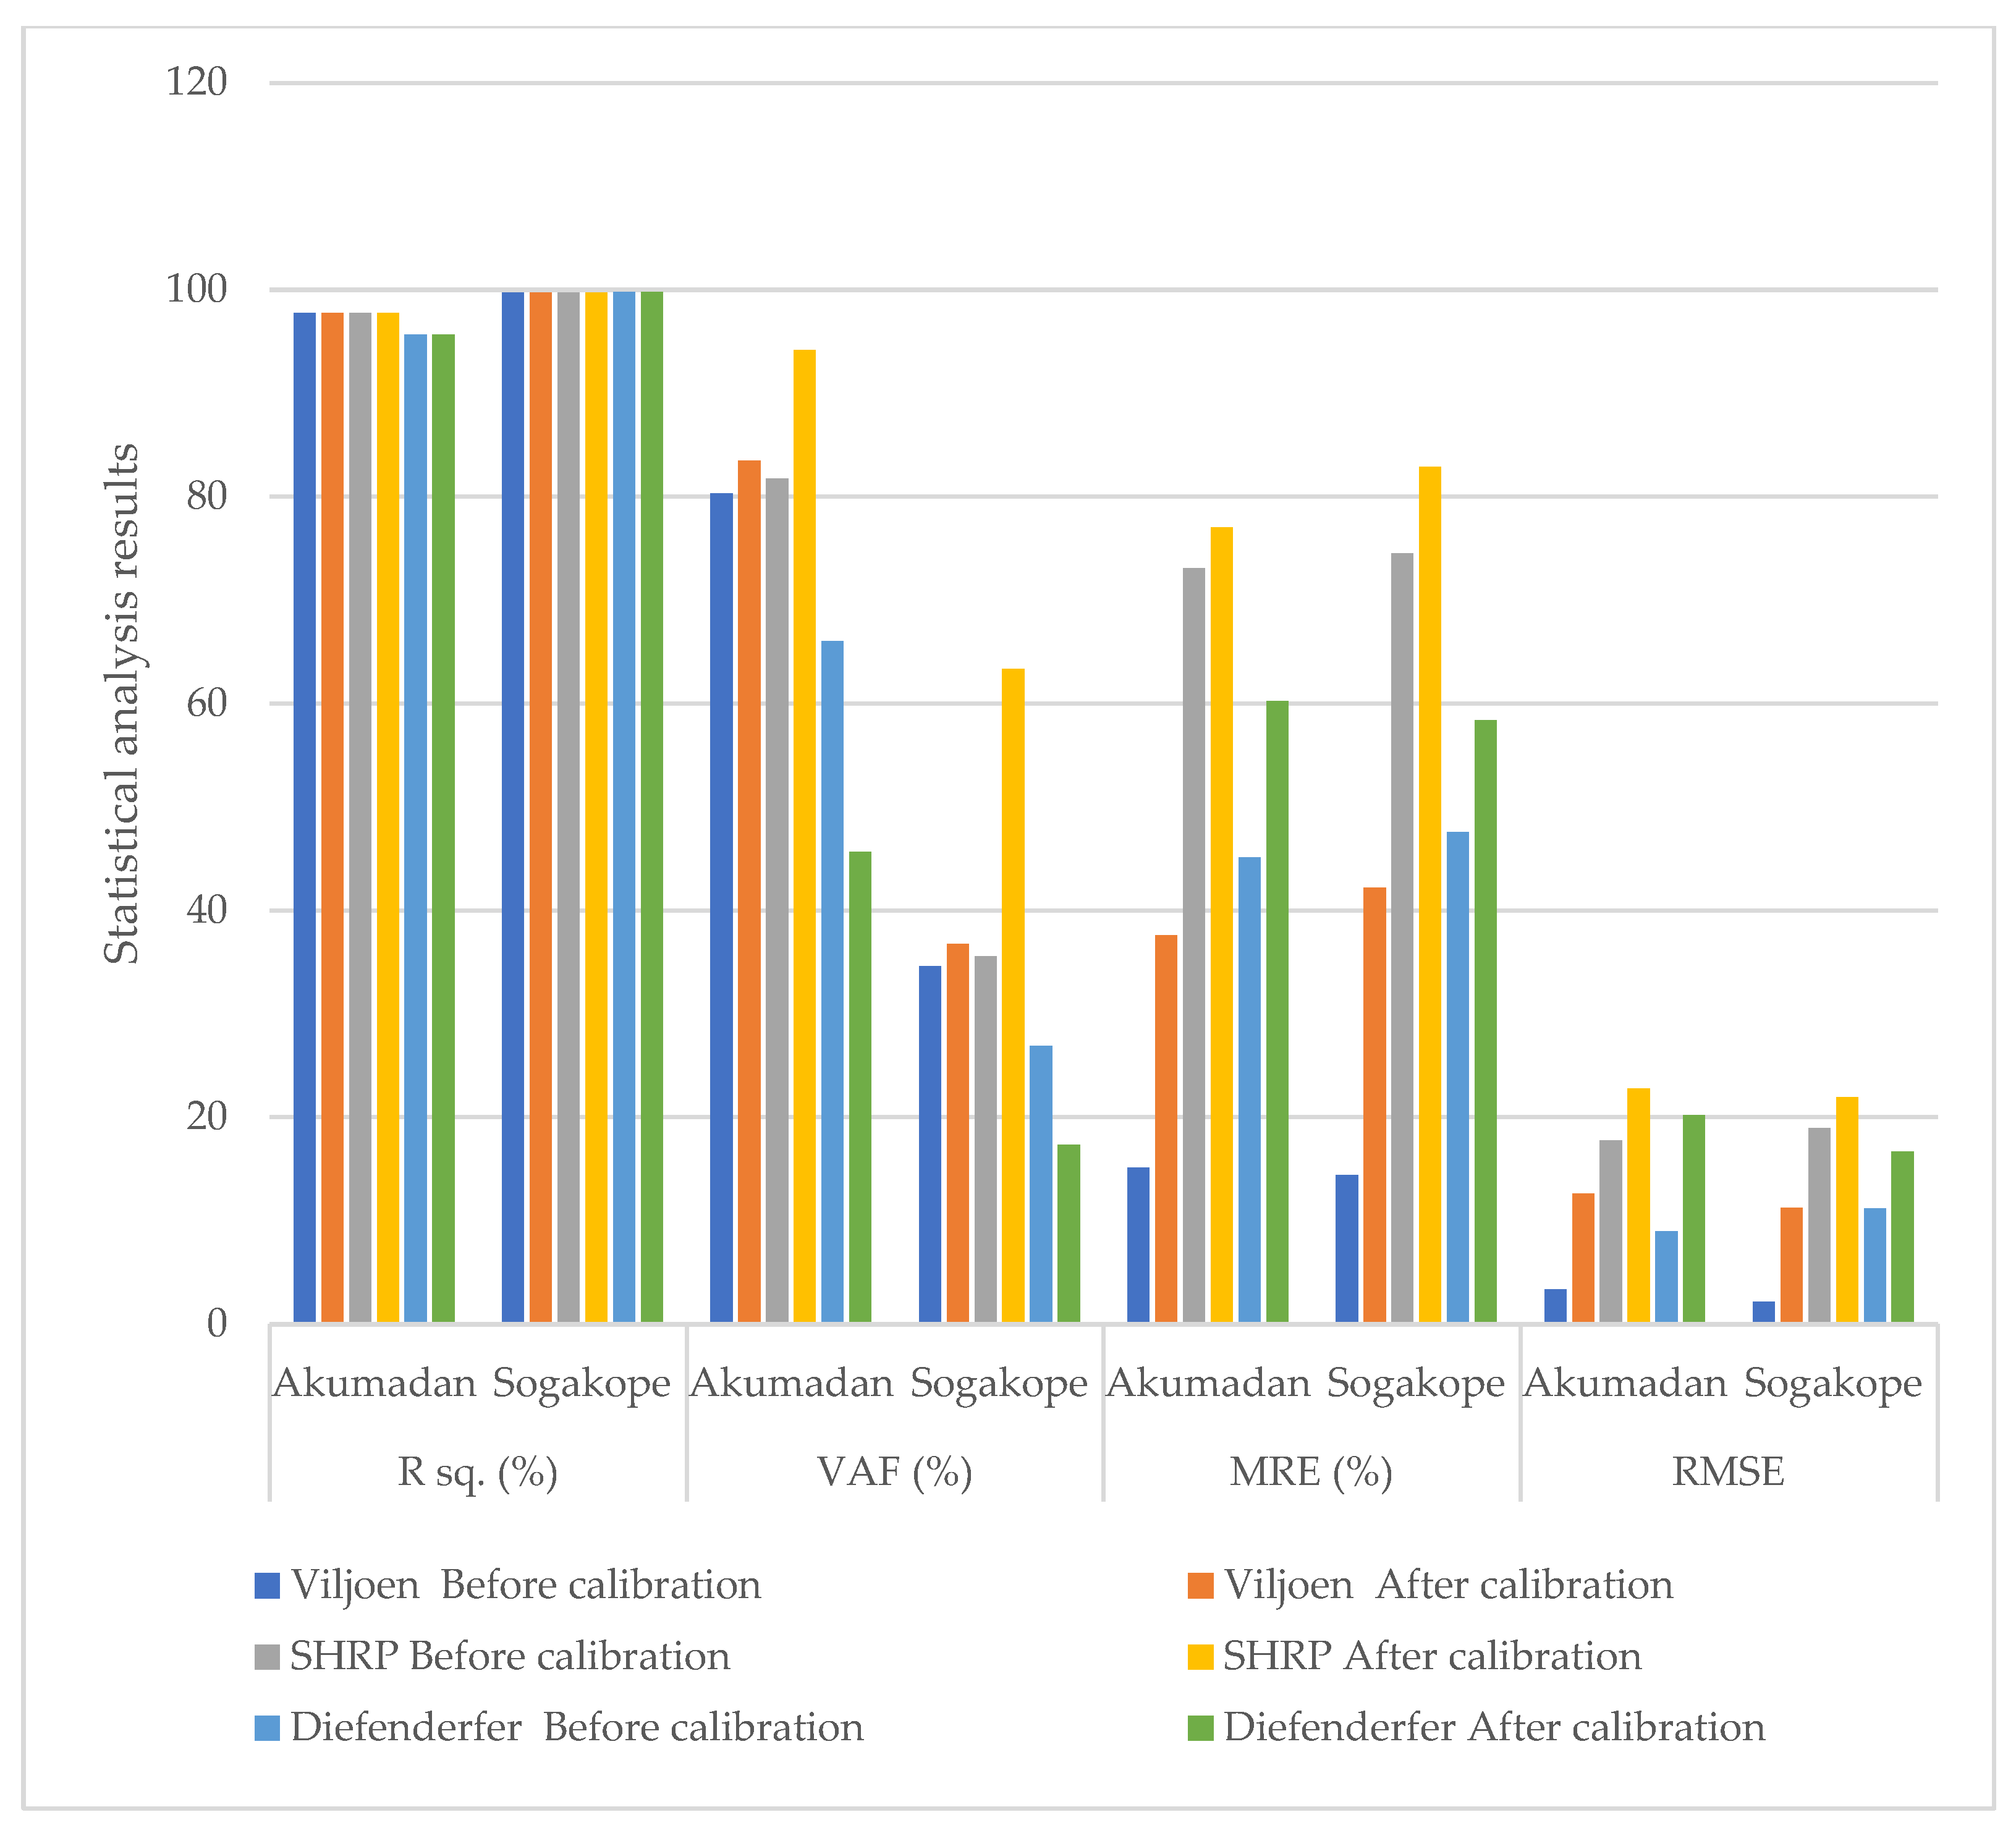
3.3. Performance of Models at Different Geographical Locations

The R2 value was the same for both calibrated and uncalibrated models, thus the goodness of fit remained unchanged. A summary of the results of statistical analysis is presented in Figure 3, with the detailed results in Table 3.
The uncalibrated models performed better than the calibrated models, as shown by the higher RMSE and MSE values for the calibrated models. The Viljoen model had the lowest RMSE and MRE values at both sites and thus performed best. This was followed by the Diefenderfer model and then the SHRP Superpave model. Thus, calibration should be carried out for each location, using data obtained from the respective location to improve prediction accuracy.

4. Discussion

The performance of three temperature prediction models with different materials, and at different geographical locations, was evaluated using statistical analysis. The effect of calibration on model accuracy was also examined.

4.1. Materials Performance

The performance of the models varied based on the material tested. The results showed that all three models performed better at predicting maximum pavement temperature than minimum pavement temperature.
For maximum temperature prediction, the Viljoen model performed best for asphalt and gravel, while the Diefenderfer model performed best for concrete. The SHRP Superpave model performed best at predicting maximum temperature in gravel; while it is not the best for predicting maximum temperature for gravel, it could be used as an alternative. High variability was observed in model performance for predicting maximum temperature for block paving.
Higher variability was observed for the minimum predicted temperatures. This is in agreement with what was observed in Australia by Denneman [19]. Nonetheless, the Diefenderfer model performed best for all the materials examined. The minimum temperature prediction models, however, would require revising to improve their accuracy for reliable use in pavement design.

4.2. Calibration

Calibration does not affect the goodness of fit of the models (R2), thus the variance attributable to the models remains the same even after calibration. The accuracy of the predicted temperature for all the models improved with calibration, particularly for predicted maximum temperature. This was similar to the observations made by Kassem [6]. Calibration was most effective in improving the accuracy of the predicted maximum temperature of the Viljoen model in gravel, concrete and block paving, and the Diefenderfer model in asphalt. For minimum predicted temperature, calibration was mostly effective for the SHRP Superpave model in gravel, concrete and block paving.
While the accuracy of predicted temperature improved when a model was calibrated with part of the data from the dataset, it did not improve when the same calibrated model was used to predict data from a different geographical location. It is important, therefore, to acquire sufficient empirical data from the geographical location where the model is to be applied to calibrate the models and thereby improve their prediction accuracy. Ideally, this should be performed for each material.

4.3. Effect of Geographical Location

The Viljoen model performed best followed by the Diefenderfer model and then the SHRP Superpave model for the predicted maximum temperature in asphalt at the two locations (Akumadan and Sogakope) in Ghana. It was noted from the literature review that the prediction accuracy of the models is highly dependent on the geographical location. The Viljoen model was developed in South Africa and the temperature data of the materials were also sourced from South Africa. In addition, the effect of geographical location has been tested with data sourced from Ghana, on the African continent. Thus, it would be necessary to test the models with data sourced from other continents. There is also a need to have locally developed models for use in pavement design.

5. Conclusions

Accurate temperature prediction is important in choosing a suitable asphalt binder for the respective climate to ensure the design of climate-resilient pavements. Maximum and minimum temperature prediction models have been developed for use in asphalt pavement design. These have proven to perform reliably well for maximum temperature prediction with other materials such as gravel, concrete and block paving. The performance of all the three models, though, was highly variable for minimum temperature prediction. Thus, the assumptions made in building the minimum temperature models would require revision to improve the accuracy of the models.
Calibration can also improve temperature models’ accuracy. It is important, however, that calibration is undertaken using data sourced from the test location to improve the accuracy of predicted values. Consequently, sufficient empirical data should be collected at each location if the advantages of calibration are to be utilised.
The Viljoen model developed in South Africa had the best performance of the three models when examined using asphalt temperature data sourced from Ghana and Pretoria. However, this has been evaluated using data sourced from Africa. There is a need therefore to evaluate the performance of the models using data sourced from other continents. It is recommended that temperature data, such as those presented in Picado-Santos [22] for Portugal, Europe, and models developed on the European continent, for example Minhoto et al. [23], be considered for further assessment in future work.

Author Contributions

Conceptualization and methodology, W.J.v.S.; formal analysis, A.L.; investigation, W.J.v.S.; data curation, A.L.; writing—original draft preparation, A.L.; writing—review and editing, W.J.v.S. All authors have read and agreed to the published version of the manuscript.

Funding

The funding for the analysis of the data collected and the time taken to author the paper was obtained through the High Volume Transport research programme, funding number HVT050, managed by DT Global, and financed by the Foreign, Commonwealth, and Development Office (FCDO) of the United Kingdom. The data used were collected as part of the Digital Twining project of the Department of Civil Engineering with funding from the University of Pretoria. The views expressed in this paper are not necessarily those of the FCDO or the UK Government.

Institutional Review Board Statement

Not applicable.

Informed Consent Statement

Not applicable.

Data Availability Statement

The data presented in this study are available on request from the co-author. The data are not publicly available in line with University of Pretoria policy.

Conflicts of Interest

The authors declare no conflict of interest. The funders had no role in the design of the study; in the collection, analyses, or interpretation of data; in the writing of the manuscript; or in the decision to publish the results.

References

  1. Sun, L.; Qin, J. Prediction model on temperature field in asphalt pavement. J. Tongji Univ. (Nat. Sci.) 2006, 34, 480–483. [Google Scholar]
  2. Kennedy, T.; Huber, G.; Harringan, T.; Cominsky, R.; Hughes, C.; Von Quintis, H.; Moultrop, J. Superior Performing Asphalt Pavements (SUPERPAVE): The Product of the SHRP Asphalt Research Program; Report No: SHRP-A-410; Strategic Highway Research Program, National Research Council: Washington, DC, USA, 1994. [Google Scholar]
  3. Adwan, I.; Milad, A.; Memon, Z.A.; Widyatmoko, I.; Zanuri, N.A.; Memon, N.A.; Yusoff, N.I.M. Asphalt pavement tem-perature prediction models: A review. Appl. Sci. 2021, 11, 3794. [Google Scholar] [CrossRef]
  4. Mokoena, R.; Mturi, G.; Maritz, J.; Mateyisi, M.; Klein, P. African Case Studies: Developing Pavement Temperature Maps for Performance-Graded Asphalt Bitumen Selection. Sustainability 2022, 14, 1048. [Google Scholar] [CrossRef]
  5. Chao, J.; Jinxi, Z. Prediction Model for Asphalt Pavement Temperature in High-Temperature Season in Beijing. Adv. Civ. Eng. 2018, 2018, 1837952. [Google Scholar] [CrossRef] [Green Version]
  6. Kassem, E.; Bayomy, F.; Williams, C.; Saasita, E.; Lamichane, S.; Permadi, D.D. Development of Pavement Temperature Prediction Model (No. FHWA-ID-20-279); Idaho Transportation Department: Moscow, ID, USA, 2020.
  7. Chen, J.; Wang, H.; Xie, P. Pavement temperature prediction: Theoretical models and critical affecting factors. Appl. Therm. Eng. 2019, 158, 113755. [Google Scholar] [CrossRef]
  8. Qin, Y.; Zhang, X.; Tan, K.; Wang, J. A review on the influencing factors of pavement surface temperature. Environ. Sci. Pollut. Res. 2022, 29, 67659–67674. [Google Scholar] [CrossRef]
  9. Asefzadeh, A.; Hashemian, L.; Bayat, A. Development of statistical temperature prediction models for a test road in Edmonton, Alberta, Canada. Int. J. Pavement Res. Technol. 2017, 10, 369–382. [Google Scholar] [CrossRef]
  10. Dzotepe, G.A. The Effect of Environmental Factors on the Implementation of the Mechanistic-Empirical Pavement Design Guide (Mepdg); University of Wyoming: Laramie, WY, USA, 2011. [Google Scholar]
  11. Tutu, K.A.; Ntramah, S.; Tuffour, Y.A. Superpave performance graded asphalt binder selection for asphalt mixture design in Ghana. Sci. Afr. 2022, 17, e01348. [Google Scholar] [CrossRef]
  12. Abo-Hashema, M.A.; Mousa, R.M.; Al-Zedjali, S.A.; Abdullah, Q.; Al Balushi, M.M.; Al-Rashdi, M.H. Development of Oman performance grade paving map for superpave asphalt mix design. Int. J. Pavement Eng. Asph. Technol. 2016, 2016, 1–21. [Google Scholar] [CrossRef]
  13. Denneman, E.; Edmunds, A.; Alex, P.; Wilson, G. Application of pavement temperature prediction algorithms in per-formance grade (PG) binder selection for Australia. Aust. J. Civ. Eng. 2022, 2022, 2082632. [Google Scholar] [CrossRef]
  14. Viljoen, A. Estimating Asphalt Temperatures from Air Temperatures and Basic Sky Parameters; Internal Report; Transportek, CSIR: Pretoria, South Africa, 2001. [Google Scholar]
  15. Wahab, H.; Asia, I.; Ramadhan, R. Modelling resilient modulus and temperature correction for Saudi roads. J. Mater. Civ. Eng. 2001, 13, 298–305. [Google Scholar] [CrossRef]
  16. Diefenderfer, B.; Al-Qadi, I.; Diefenderfer, S. Model to predict pavement temperature profile: Development and validation. J. Transp. Eng. 2006, 132, 162–167. [Google Scholar] [CrossRef]
  17. Hassan, H.; Al-Nuaimi, A.; Taha, R.; Jafar, T. Development of Asphalt Pavement Temperature Models for Oman. J. Eng. Res. [TJER] 2005, 2, 32–42. [Google Scholar] [CrossRef] [Green Version]
  18. Huber, G. Weather Data Base for the Superpave Mix Design System; Report No. SHRP-A-648A; Strategic Highway Research Program, National Research Council: Washington, DC, USA, 1994. [Google Scholar]
  19. Denneman, E. The application of locally developed pavement temperature prediction algorithms in performance grade binder selection. In Proceedings of the 26th Southern African Transport Conference, CSIR International Convention Centre, Pretoria, South Africa, 9–12 July 2007. [Google Scholar]
  20. Diefenderfer, B.; Al-Qadi, I.; Reubush, S.; Freeman, E. Development and validation of a model to predict pavement temperature profile. In Proceedings of the TRB 2003 Annual Meeting, Transportation Research Board, Washington, DC, USA, 12–16 January 2003. [Google Scholar]
  21. Koranteng-Yorke, J.B. A Proposed Framework for Asphaltic Concrete Pavement Design for Tropical Soils—Case Study of Ghana. Ph.D. Thesis, University of Birmingham, Birmingham, UK, 2012. [Google Scholar]
  22. de Picado-Santos, L. Design Temperature on Flexible Pavements. Road Mater. Pavement Des. 2000, 1, 355–371. [Google Scholar] [CrossRef]
  23. Minhoto, M.J.; Pais, J.C.; Pereira, P.A.; Picado-Santos, L.G. Predicting asphalt pavement temperature with a three-dimensional finite element method. Transp. Res. Rec. 2005, 1919, 96–110. [Google Scholar] [CrossRef]
Figure 1. Comparison of statistical analysis results for uncalibrated and calibrated predicted maximum temperatures.
Applsci 13 04164 g001
Figure 2. Comparison of statistical analysis results for uncalibrated and calibrated predicted minimum temperatures.
Applsci 13 04164 g002
Figure 3. Statistical analysis results of the effect of geographical location on both calibrated and uncalibrated models.
Applsci 13 04164 g003
Table 1. Analysis of uncalibrated and calibrated predicted maximum temperatures.
AnalysisMaterialViljoen ModelSHRP Superpave ModelDiefenderfer Model
Before CalibrationAfter CalibrationBefore CalibrationAfter CalibrationBefore CalibrationAfter Calibration
R2Asphalt0.83130.83130.66940.66940.83380.8338
Gravel0.94110.94110.85360.85360.91260.9126
Concrete0.90310.90310.88420.88420.88580.8858
Block paving0.80170.80170.79980.79980.75980.7598
RMSEAsphalt11.01323.146311.66095.01668.59953.3905
Gravel10.66011.708310.78822.32938.81781.5449
Concrete9.47481.57389.95041.71757.25531.9641
Block paving7.08642.44416.89192.11664.95823.0033
MRE (%)Asphalt98.8665.99113.7455.13148.7545.57
Gravel56.3417.6273.7125.2066.2724.54
Concrete84.5139.55106.9122.3463.9123.65
Block paving53.6229.6577.2229.4266.4241.99
VAF (%)Asphalt83.0182.0663.2348.1779.3078.34
Gravel78.6394.0884.9281.7491.1390.47
Concrete69.5689.9288.0686.2588.2587.81
Block paving41.4573.7679.3979.8973.0865.31
Table 2. Analysis of predicted minimum temperatures.
AnalysisMaterialViljoen ModelSHRP Superpave ModelDiefenderfer Model
Before CalibrationAfter CalibrationBefore CalibrationAfter CalibrationBefore CalibrationAfter Calibration
R2Asphalt0.61370.61370.46740.46740.37760.3776
Gravel0.67020.67020.73210.73210.84710.8471
Concrete0.67660.67660.75720.75720.87940.8794
Block paving0.66780.66780.69620.69620.89390.8939
RMSEAsphalt4.85244.83168.06445.33904.62424.5878
Gravel5.18732.66737.67552.59062.96831.7031
Concrete5.53432.75278.69760.75723.80051.8192
Block paving6.17292.79668.77452.29073.77492.0786
MRE (%)Asphalt219.06271.73309.69290.5983.6984.40
Gravel174.8371.08231.7877.8663.6248.65
Concrete102.9858.36214.772.331595.4647.58
Block paving118.7454.72208.9648.3681.1946.59
VAF (%)Asphalt51.30−3.3035.43−13.2930.4824.20
Gravel47.4755.8759.0960.0078.0482.43
Concrete47.4957.3064.2673.1575.3379.50
Block paving28.0137.4947.2257.8968.2568.25
Table 3. Results of statistical analysis of predicted temperature values at other locations.
AnalysisLocationViljoen ModelSHRP Superpave ModelDiefenderfer Model
Before CalibrationAfter CalibrationBefore CalibrationAfter CalibrationBefore CalibrationAfter Calibration
R2Akumadan0.97720.97720.97720.97720.95670.9567
Sogakope0.99710.99710.99710.99710.99760.9976
RMSEAkumadan3.3812.6017.7622.768.9520.22
Sogakope2.1811.2618.9621.9111.2016.69
MRE (%)Akumadan15.1437.5973.0977.0345.1260.27
Sogakope14.3842.2174.5682.8747.6058.39
VAF (%)Akumadan80.3083.4781.7194.1766.0445.68
Sogakope34.6336.7835.5763.3326.9117.32
Disclaimer/Publisher’s Note: The statements, opinions and data contained in all publications are solely those of the individual author(s) and contributor(s) and not of MDPI and/or the editor(s). MDPI and/or the editor(s) disclaim responsibility for any injury to people or property resulting from any ideas, methods, instructions or products referred to in the content.

