Article

Adapting the GACT-X Aligner to Accelerate Minimap2 in an FPGA Cloud Instance

by
Carolina Teng
1,*,
Renan Weege Achjian
2,
Jiang Chau Wang
1 and
Fernando Josepetti Fonseca
1
1
Department of Electronic Systems Engineering, School of Engineering, University of São Paulo, São Paulo 05508-010, Brazil
2
Department of Parasitology, Institute of Biomedical Sciences, University of São Paulo, São Paulo 05508-000, Brazil
*
Author to whom correspondence should be addressed.
Appl. Sci. 2023, 13(7), 4385; https://doi.org/10.3390/app13074385
Submission received: 20 February 2023 / Revised: 20 March 2023 / Accepted: 28 March 2023 / Published: 30 March 2023
(This article belongs to the Special Issue Field-Programmable Gate Array (FPGA) and Microprocessor Systems)

Abstract

:

Featured Application

Fast long-read assembly to reference in AWS cloud FPGA instances.

Abstract

In genomic analysis, long reads are an emerging type of data processed by assembly algorithms to recover the complete genome sample. They are, on average, one or two orders of magnitude longer than short reads from the previous generation, which provides important advantages in information quality. However, longer sequences bring new challenges to computer processing, undermining the performance of assembly algorithms developed for short reads. This issue is amplified by the exponential growth of genetic data generation and by the slowdown of transistor technology progress, illustrated by Moore’s Law. Minimap2 is the current state-of-the-art long-read assembler and takes dozens of CPU hours to assemble a human genome with clinical standard coverage. One of its bottlenecks, the alignment stage, has not been successfully accelerated on FPGAs in the literature. GACT-X is an alignment algorithm developed for FPGA implementation, suitable for any size input sequence. In this work, GACT-X was adapted to work as the aligner of Minimap2, and these are integrated and implemented in an FPGA cloud platform. The measurements for accuracy and speed-up are presented for three different datasets in different combinations of numbers of kernels and threads. The integrated solution’s performance limitations due to data transfer are also analyzed and discussed.

1. Introduction

Genetic sequencing has been contributing valuable information in a wide variety of medical procedures. In preventative medicine, some genetic variations are shown to raise the risk of the development of certain diseases, such as breast cancer, heart disease, and type II diabetes. For some of these diseases, therapies or preventative strategies may provide a better prognosis and quality of life. With assisted reproductive technology, genetic sequencing can also be used to indicate whether an individual is a carrier of variants that will cause diseases in their children, such as cystic fibrosis, fragile X syndrome, and sickle cell anemia [1]. Collecting and analyzing genetic data is also crucial in biology studies, including biodiversity [2], evolution [3], and metabolic pathways [4]. It has even become a commodity of public interest, providing people with insights into their ancestry and personal phenotypes.
Current sequencing technology is incapable of reading straightaway a complete human genome, which contains about 3.2 billion nucleotides in each DNA (deoxyribonucleic acid) strand. Because of this, the DNA molecules in an analysis sample need to be cleaved into smaller nucleotide sequences called fragments. The fragments that are sequenced, or translated into the digital characters A-T-C-G for computer processing, are then called reads.
A set of reads contains redundancy in such a way that a complete genome can be mounted back with computer support in a process known as read assembly. A lot of attention has been given to read assembly methodologies and algorithms; this processing phase is currently considered a major bottleneck in the genome analysis pipeline [5], which also includes laboratory sampling, sequencing, and annotating. This happens because sequencing technologies have been increasing their output capacity at an exponential rate [6], whereas computational power has been slowly reaching the limits of transistor technology [7]. The speed of acquiring and interpreting genomic information is crucial in several applications, such as prenatal testing [8,9] or infection outbreak investigations, i.e., the latest COVID-19 (coronavirus disease 2019) pandemic [10,11].
The most efficient assembly method for long genomes is mapping and aligning the reads against an existing genome reference for the species, using it as a guide. The latest published human genome reference is the GRCh38.p14 (Genome Reference Consortium Human Build 38 patch release 14) [12]. In human clinical trials, this method requires the assembly to have a minimum coverage of 8–20 times the length of the genome or exome. This allows the distinction of variants with higher accuracy (i.e., statistically covers sequencing errors and mapping or aligning heuristics) and the identification of heterozygous states [13].
Several reference-guided assembly algorithms and programs have been proposed [14,15,16], and most of them apply the seed-and-extend strategy, illustrated in Figure 1. In the seeding stage, the algorithm finds exact or non-exact matches of very short sequences between the read and the reference. Given the fact that the seeding stage might result in a set of matches with a significant number of false positives, an intermediate filtering stage is often required to reduce the number of selected items. During the extending stage, guided by the matches that remain after filtering, each read sequence is aligned to one or more regions in the reference; therefore, it is also known as the alignment stage.
The seeding and filtering strategies are, in general, specific for different algorithms, while the alignment strategies are mostly based on the classic Smith–Waterman–Gotoh (SWG) algorithm [17,18], which uses dynamic programming to align two character strings. It was published in 1981–1990 and is still used to this day in read assembly programs but with different heuristics and/or transformations added on to reduce its complexity. One recurrent example is the banding heuristic: by calculating only a band of the SWG matrix, where the optimal alignment path is more probable to be, the time and memory complexities can be reduced from a quadratic to a linear ratio in relation to the inputs’ lengths [19,20].
The genome assembly algorithms may perform differently depending on the type of input reads, obtained through different sequencing technologies. There are short reads, with lengths of a few hundred bases, and long reads, with many thousands of bases on average. Currently, the so-called second generation of sequencing technology, which produces short reads, dominates the market and is expected to stay prevalent for years to come due to its high throughput and relatively low cost [21].
In recent years, the third generation of sequencers, which produces long reads, has emerged as the technology of the future in the market, presenting several advantages with respect to the previous technologies. For instance, long reads are more effective in detecting structural variants (SVs), which are insertions, deletions, duplications, inversions, or translocations that affect more than 50 nucleotide bases in the genome. Each human genome has >20,000 SVs, and most of them remained undetected until long reads were introduced. That posed a serious problem since SVs account for the highest number of divergent bases across human genomes [22]. The current shortcomings in long-read technologies are their higher sequencing costs [23] and their higher error rates [13] in comparison to their established short-read counterparts.
Many programs, such as Bowtie2 [16], have been developed to efficiently assemble short reads on the second-generation technology. However, their strategies are often unsuitable for processing long reads; in this condition, they present low performance or require a large sum of resources to compute. BWA-MEM [15] and Minimap2 [14] are examples of programs/algorithms that have been proposed to fill the long-read gap; the latter is 50 times faster than the former in addition to having better mapping accuracy than most other programs.
Minimap2 is the current state-of-the-art program for assembling long reads. Its filtering stage corresponds to a chaining algorithm that takes advantage of the higher load of information carried by long reads to find approximate mapping positions with high performance and high accuracy. Its extending/alignment stage corresponds to a transformed version of the SWG algorithm, proposed by Suzuki and Kasahara (SK) [24], that limits data size in Streaming SIMD (single instruction, multiple data) extensions’ (SSE) vector instructions to maximize the parallelization of cell data computation.
Despite the efficient techniques adopted, processing in Minimap2 is still time-consuming; dozens of central processing unit (CPU) hours on an Intel® Xeon® processor are required to assemble one human genome sample of long reads with high coverage [25]. In order to improve the computational performance of software-based algorithms, one alternative is designing domain-specific architectures (DSAs), particularly with application-specific integrated circuits (ASICs), field programmable gate arrays (FPGAs), or graphic processing units (GPUs). The design of an ASIC or FPGA solution takes a longer time and is usually more expensive than programming a GPU system. However, the hardware performs better when comparing solutions under the same integrated circuit technology node [26]. Despite having the best performances [27], ASICs present a high fabrication cost and become impracticable under a small volume production. In addition to that, the genomics field continues to evolve constantly, with new algorithms being published every year, so fixed solutions as such are avoided.
With a focus on Minimap2 acceleration, previous studies have determined that the chaining and extending steps are its runtime bottlenecks when assembling long reads, taking together around 70% of the total execution time. Authors of such works have already successfully accelerated Minimap2’s chaining step on FPGA and GPU [26]. Others have also implemented the extending step on CPU, GPU, and KNL (Knights Landing) [28]. To the authors’ knowledge, no work in the literature has successfully accelerated Minimap2’s extending step on an FPGA.
The authors of [26] have concluded that FPGAs may achieve better thread performance than GPUs on algorithms such as the SWG algorithm. They induced this by considering the irregular-width integer type used and the availability of in/out data in BRAM (block random-access memory) for immediate access by the FPGA’s combinational logic. Furthermore, GPUs’ performance relies on parallelism, whereas read assembly, although parallelizable along reads, presents an extensive sequential processing pipeline for each read.
FPGA hardware acceleration has been proposed for short-read alignment algorithms [19,29], but they could not support long-read sequences of many thousands of nucleotides. This is due to the linear memory scaling factor in relation to the inputs’ lengths present in the SWG algorithm’s banding heuristics, coupled with the alignment score’s increase with the number of matching nucleotides. The acceleration of alignment algorithms that have large inputs is impaired by the FPGA’s limited processing memory resources.
After Minimap2, a novel FPGA design that calculates the banded SWG alignment was submitted in Darwin-WGA [30], a whole genome aligner developed on an Amazon Web Services’ (AWS) FPGA Instance. Darwin-WGA is a tool developed for comparison between two short genomes, not for read assembly. Its hardware aligner design, called GACT-X, is based on a systolic array architecture that has fixed memory consumption for arbitrarily sized sequences. Because of this, it may be considered for the processing of emerging long reads and conjectured as an alternative FPGA implementation to Minimap2’s aligner.
The GACT-X solution has raised an important issue in FPGA acceleration of genome-related algorithms, which has the fastest progress and change rate seen in the genomics field. This conflicts with the FPGA platforms’ low accessibility and high maintenance overhead, since FPGAs consist of a very specific processor that is difficult to design, configure, and integrate into a general computer. Cloud instances with integrated FPGAs, such as the AWS’ FPGA instances [31], make FPGAs accessible to users who do not wish to be subjected to the high initial development cost. AWS specifically also provides a hardware shell that facilitates integration with the CPU host, by wrapping any kernel to fit its FPGA’s I/O (input/output) resources. Cloud solutions are also easier to replicate since they standardize the computation platform and environment.
Although FPGA cloud providers announce up to 100× acceleration for applications when compared to software implementations, previous works have indicated that the actually achievable acceleration is strongly limited by the platform’s virtualized PCIe (peripheral component interconnect express) transfer’s throughput and latency. The latter is dependent on the driver’s technology and whether the virtual machines add extra virtual interrupts [32].
All of these culminate into the objective of this work, which is to infer whether it is possible to accelerate Minimap2’s extending step on a cloud FPGA design, given the memory challenges bound to long reads and the limitations of implementing memory-based algorithms on FPGA clouds. This work proposes an adaptation of the GACT-X long-read alignment architecture to achieve its best performance as a substitute for Minimap2’s SK alignment in software. As a first contribution, a thorough profiling of Minimap2 with simulated and real human long-read datasets was carried out; by focusing on the throughput, observations were made to validate the use of the datasets and to confirm the algorithm’s bottlenecks. Then, a series of tests were performed with the same datasets to obtain an optimized version of GACT-X; in order to validate its use when adapted to long-read processing, the performance and accuracy were compared to those of Minimap2’s SK algorithm running as software regarding. This work also contributes to a full integration of Minimap2 and the adapted GACT-X’s host on an AWS f1.2xlarge instance, with one to two FPGA kernels and one to eight software threads. The results are presented regarding processing speed and acceleration in comparison to those of Minimap2 in software, allowing inferences from the measurements to further improve the performance. Finally, the results are analyzed against the observations presented in [32] about implementing applications in virtualized FPGA environments.

2. Materials and Methods

2.1. Research Approach

This paper proposes an approach to accelerate the Minimap2 algorithm with an FPGA hardware design, targeting its extending step because it has been shown in previous works [26,28] to be one of Minimap2’s bottlenecks that has not been successfully accelerated in the literature. The approach substitutes Minimap2’s SK-based extending step [24] with the GACT-X algorithm [30] and implements the hybrid system in an FPGA cloud platform. Analyses and discussion are provided for the results obtained from this setting. FPGA cloud platforms bring advantages in terms of maintenance, cost, development speed, and replicability. Currently, there are several available FPGA cloud platforms; in this research, the Amazon Web Services platform was opted for since GACT-X was developed and can be mirrored on it. Figure 2 illustrates Minimap2’s software pipeline and the GACT-X switch in dashed arrows.
Regarding the input data for the ksw function, which performs the SK algorithm, or for GACT-X, Minimap2 uses the seed-and-extend strategy presented in Figure 1. Indexing is performed with a hash table, where unique sequences are associated to unique index numbers, which in turn are used to store all positions of those sequences in the reference and in the read. In seeding, the positions in the read and the reference are matched in a process called anchoring (from the figure, it can be noticed that a seed in the read may be anchored in different parts of the reference). Parallel-positioned anchors between the read and the reference are considered candidates for forming a chain, and the best scoring chain is selected to indicate the read’s mapping position in the reference. In the original Minimap2 program, aimed at software implementation, read alignment is performed incrementally by sets of anchor-separated sub-sequences, e.g., fragments from both read- and reference-separated anchors are aligned separately in the ksw function and their outputs are then stitched back together.
In order to improve the performance of Minimap2 with GACT-X implementation, some optimizations have been necessary, as will be presented in later sections. They refer to the transfer of data sub-sequences and to GACT-X’s tiling strategy.

2.2. Collecting Read-Assembly Data

2.2.1. Collecting and Preparing the Human Genome Reference

The primary assembly of a genome reference contains the assembled chromosomes, the unlocalized sequences (known to belong to a specific chromosome but with an unknown order or orientation) and the unplaced sequences (with unknown chromosomes). In this work, the primary assembly of the human genome reference GRCh38 (RefSeq assembly accession GCF_000001405.26) was used for assembly of the read sets. In the “.fna” format file downloaded from [33], the primary assembly has 193 sequences (24 chromosomes + 127 unplaced + 42 unlocalized). The sequences that are not included in the primary assembly were removed from the file. The resulting human genome file contains 2,948,611,470 nucleotide bases.

2.2.2. Collecting Long-Read Datasets

Three long-read human datasets, two real and one synthetic, were selected and prepared for the comparison between the alignment algorithms. Real datasets can provide insights into the real runtime and accuracy behaviors of Minimap2. Two datasets were selected based on size, which is expected to be over the minimum coverage for clinical applications ( 8 × ), and on origination from current and known sequencing technologies. The datasets were selected from ethnicities that lack representation in the most renowned databases; therefore, it is expected for these to diverge more from the genome reference used. This divergence can expose assembly algorithms to more situational adversities.
The first dataset was collected from real human ONT (Oxford Nanopore Technologies) reads at the European Nucleotide Archive (ENA) [34], from a project that sequenced and produced the Yoruba reference genome NA19240, using 5 PromethION flow cells [35]. The reads have on average 16,900 bases according to ENA’s base and read counts (28,528,692,209 and 1,688,000, respectively) and are referred to as “real ONT” reads in this work.
The second dataset was collected from real PacBio Sequel II reads at the NCBI (National Center for Biotechnology Information) [36]. The reads were collected from a Sri Lankan individual. The reads have an average length of 13,329 bases according to NCBI’s base and read counts ( 52.2 × 10 9 and 3,916,231) and are referred to as “real PacBio” reads in this work.
The third read set to be assembled with Minimap2 was generated with the PBSIM tool [37], which simulates a set of human long reads, produced by PacBio’s technology. The model-based simulator collects stretches of a reference sequence, mimicking the read length distribution, and adds variants and sequencing errors to them. The simulated long reads were extracted from the GRCh38’s primary assembly file, with an error profile sampled from the model file “m131017_060208_42213_*.1.*”, which was downloaded at [38]. This group of reads will be referred to as the "simulated" reads. Simulated reads are useful for evaluating the mapping accuracy, due to the lack of truth in real data because, from the read sets alone, it is not possible to prove the original position of each read. Minimap2’s paper presented this process to compare their mapping accuracy with other assembly tools [14].
For each of the 193 sequences in the GRCh38 reference’s primary assembly, PBSIM outputs the simulated reads in files with FASTQ format, while the read origins and alignments in relation to the reference are in files with MAF format, which are useful for evaluating the mapping accuracy. The tool provides the merging of all output files in corresponding formats, resulting in 121 GB of data in total. The coverage depth is set to 20, and the default read length thresholds were from 100 to 25,000; the mean length, deviation, mean accuracy, and accuracy deviation were sampled from the model file given. Some simulated reads had lengths outside the determined threshold and were filtered out.
Simulation statistics are presented in Table 1. Over seven million reads were generated in total, which corresponds to a 20× coverage depth. The read lengths’ mean, standard deviation, minimum, and maximum values are, respectively, 8310, 106.26, 100, and 24,988. The reads’ similarity rate to the reference strand is, on average, 0.85 with 0.00017 s.d. The substitution, insertion, and deletion rates are 0.015, 0.090, and 0.046, respectively. Note that, in the sample given, there were almost twice as many insertions than deletions.
The read length histograms of the simulated and two real datasets were obtained, and the results are displayed in Figure 3. The average read length alone sometimes cannot provide all of the information. For example, the real PacBio dataset and the real ONT dataset have close mean lengths (13,329 and 16,900), but their length distributions are drastically different, as can be seen in the figure. The real PacBio read lengths concentrated between 10,000 and 20,000 nucleotides, whereas the real ONT read lengths were distributed at lower frequencies reaching over 30,000 nucleotides. It is important to notice that the last length interval to the right corresponds with the accumulated frequency of all reads larger than 30,000. Simulated reads presented shorter lengths in comparison, concentrated with up to 15,000 nucleotides.

2.3. Profiling Minimap2’s Execution Time

The throughput and the assembly results of Minimap2 were initially collected using 40 threads. Then the gprof Linux tool [39] was used to profile Minimap2’s execution time. This time, each execution was performed with one thread. Only the first 200,000 reads of each dataset were separated into separate files and used to reduce the execution time. The “-pg” flag was added to the CFLAGS in the MakeFile. For the PacBio reads, the command line used was “minimap2 -ax map-pb -t 1 ref.mmi pacbio-reads.fq > aln.sam”, and, for ONT reads, the command line used was “minimap2 -ax map-ont -t 1 ref.mmi ont-reads.fq > aln.sam”. After each execution, the command line “gprof minimap2 > report.txt” was used to output the profiling results. The throughput and profile measurements are displayed in Section 3.

2.4. Adapting GACT-X for Minimap2 on an FPGA Platform

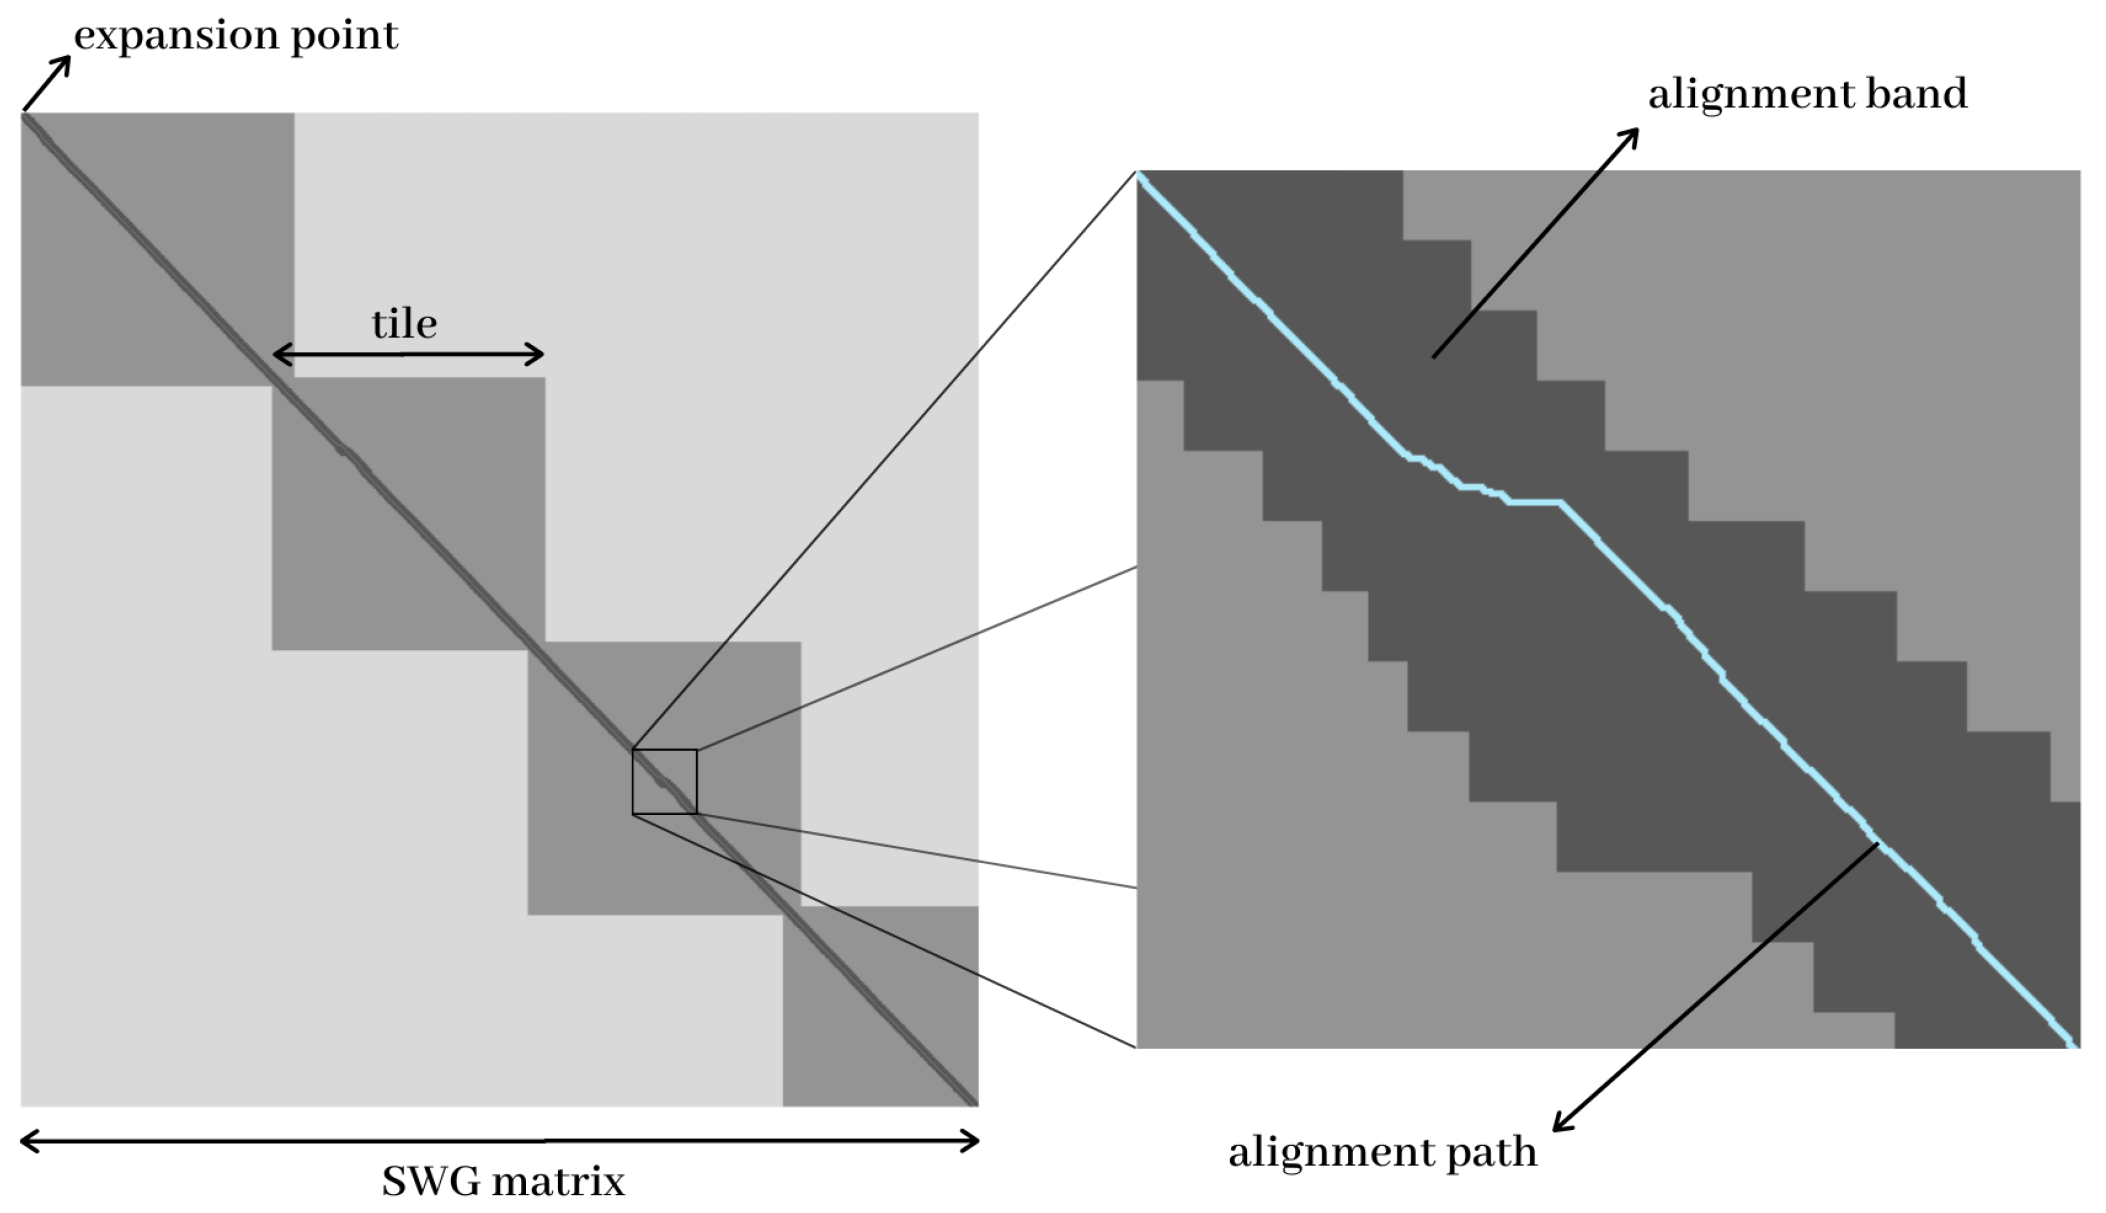
2.4.1. The Tile Approach

The aligning task in assembly algorithms has been carried out fundamentally by the Smith–Waterman–Gotoh algorithm [18], with the computation of the best alignments between two sequences using a matrix-based dynamic programming method. The alignment allows for comparisons involving matches when the characters or strings are in identical in the same position(s) of alignment; mismatches occur when the characters are different in the same position; and gaps occur when either one of the sequences has an insertion or a deletion of a nucleotide or a sub-sequence.
In order to save memory and improve performance, generations of alignment algorithms [19,29], including the SK algorithm in Minimap2 [24], have adopted the use of a band to limit the number of cells computed in the matrix. These banding strategies improve the efficiency of software-implemented algorithms but still leave a linear memory complexity to the input’s lengths, which poses a challenge in hardware applications since there are limited resources available.
GACT-X computes the banded SWG matrix with limited trace-back memory for any input lengths. Memory usage is limited because the computation is performed in scaffolding tiles of a fixed size, instead of the entire matrix in one go. One tile overlaps a previous one by a certain number of bases to expand the alignment, forming a scaffold band on the SWG matrix. GACT-X’s expansion starts from the anchoring point and stops when the last tile’s max score is negative or zero or when the alignment has reached the border of query or target sequences.
For each tile, the computation of cells is limited within a band. The matrix is filled row-wise while tracking the maximum score V m a x of the tile. Stripes with a number of rows equivalent to the number of processing elements (PEs) are calculated with wave-front parallelism. The computation in a stripe is limited to columns containing at least one cell with a score close to the V m a x by an X threshold. This process is called the X-drop banding algorithm. Figure 4 illustrates an example of a GACT-X alignment with expansion from the top-left corner. Four tiles are computed, and bands are adopted inside the tiles. Figure 5 presents GACT-X’s architecture based on a systolic array with 32 processing nodes.

2.4.2. The FPGA Cloud Platform

An AWS instance was created with the FPGA Developer AMI (Amazon Machine Image) [40], version 1.4.1, in the region “US West (Oregon)”. The instance type is f1.2xlarge, the smallest one that has an FPGA in a coupled board, which is enough for the purposes of this research. Moreover, it currently presents a higher performance/cost ratio as compared to instances with a larger number of FPGAs [32]. The instance provides a server under the Intel Xeon E5-2686 v4 processor, with 122 GiB of memory and 480 GB of SSD (solid-state drive) storage. The Puttygen, WinSCP, and Tmux [41] tools were used to control and manage the instance remotely from Windows. The Minimap2 version 2.18 was collected from GitHub [42] and installed on the server. The Minimap2 was configured to different settings according to experiments seen in the following sections.
In the instance configuration, the “aws-fpga” library was cloned from [43], and its version was swapped to an older version since GACT-X was developed on the SDAccel environment, and, from 2020 on, the default environment changed to Vitis. The Darwin-WGA project was cloned from GitHub [44] (git commit 8e0894e). There were no other versions of it at the time of writing. The Amazon FPGA Image (AFI) was created for GACT-X execution following the recommendations by AWS.
Part of the software written in OpenCL for GACT-X on the host had to be adapted for this implementation. Darwin-WGA is a whole genome aligner, so it sends the two genomes in their entirety to the DRAM, to be aligned with each other by looping the pairs of extending positions. In contrast, in Minimap2, each pair of references and read sub-sequences resulting from the chaining process is streamed to the DRAM to calculate the extending results. Additionally, the process described in the paper of creating and managing tiles [30] was not implemented in the original GACT-X host deposited on GitHub [44]; thus, this was added as well.

2.5. GACT-X in Minimap2: Performance Assessment and Optimization

In the first series of experiments, the cloud FPGA implementation of GACT-X was evaluated and optimized. Sub-sequences were generated from Minimap2 installed in the server of the f1.2xlarge instance, through its chaining step, and used as input to the GACT-X module installed in the FPGA board. Alternatively, Minimap2 also runs its original version with the ksw function, which is used as a comparison reference. The three datasets described in Section 2.2.2 were assembled in Minimap2, in a single thread execution, to collect the intermediate results after chaining. All three read sets were mapped to the primary assembly of the GRCh38 reference. Minimap2 was executed to output the alignment in the “.sam” format.
Figure 6 shows the adapted flowchart for transferring data to the FPGA with the tile algorithm. The input sub-sequences were collected from Minimap2 after the seeding and chaining steps (left of the figure). Each sub-sequence is transferred once to the cloud FPGA, and, during its tile processing, the parameters and results are transferred back and forth to the host. In the figure, the loop cycles 5 times, since five tiles are considered for this example.
The alignment parameters of GACT-X were changed to have the same proportions as the default in Minimap2 (Table 2) through the file “params.cfg”. The alignment parameters directly influence the alignment scores and the alignment paths resulting from the SWG algorithm. The match, mismatch, and gap scores are 2, −4, −4, −2 for Minimap2, so they were set as 10, −20, −30, −10 for the adapted GACT-X. The difference in the gap opening score is due to different interpretations of whether an extension occurs when opening a gap, but the resulting alignment is the same. GACT-X only supports one gap function, so only Minimap2’s affine gap function with a higher slope and lower translocation was used in GACT-X since it picks the more frequent short indels (insertion/deletions). The X-drop value was adjusted proportionally to the new match score.
The first 100,000 simulated long reads were aligned with Minimap2 to the GRCh38 genome reference. This quantity was enough for the initial evaluation and displayed a similar length distribution to the entire dataset. The simulated dataset was chosen because it was confirmed to present a good mapping accuracy in Minimap2. The ksw function’s input lengths and the function’s processing time were measured in the “ksw2_extd2_sse.c” file. Time was measured using the function “ftime”. Minimap2’s method of breaking reads into sub-sequences separated by anchors in a chain reduced the query and target lengths from thousands of bases to mostly 200–300 bases. The same inputs for ksw were written in a “.txt” file and aligned with GACT-X, with the processing time measured in the host using the “high_resolution_clock::now()” function. GACT-X performed considerably worse than the ksw function from Minimap2, as presented in Figure 7. The performances for ksw and GACT-X meet only for sequences larger than 1000 bases. This is because GACT-X’s processing time has a shifted constant of about 500 us that corresponds to the data transfer time from the host to FPGA and back throughout the PCIe line. This creates a heavy transfer latency that undermines the gains obtained with a faster alignment performed in the kernel.
The first optimization proposed for the GACT-X implementation was to reduce the number of transfers between the host and FPGA, mitigating the aforementioned latency issue. Instead of aligning each anchor-separated sub-sequence, the strategy was changed in this work to consider the alignment of the first-anchor-extended sub-sequences, i.e., the portion from the first anchor to the end of the read sequence and its corresponding reference sub-sequence. With this, the alignment was performed in a semi-global fashion. The new query and target lengths were almost the same as the reads’ lengths. The remainder sub-sequence on the left side of the first anchor was processed in Minimap2’s software, and its alignment result was clipped to GACT-X’s alignment result. Regarding Figure 6, the input sub-sequences on the left, generated by the chaining step, are changed to longer ones.
With this optimization, longer sub-sequences demand larger tiles; otherwise, the number of tile processing cycles, seen on the right side of Figure 6, will be large, corresponding to a high number of data transfers through the PCIe interface. In GACT-X’s original Verilog files, used to build the binary code of the kernels, the tile size is set up to be at most 2048. In order to test the behavior of the software–hardware implementation, its performance was measured under different tile sizes, and a new AFI was generated with an increased limit.
The same process of measuring times for the alignment of the first 100,000 simulated reads was performed. This time, the multiple ksw functions call for each read after the first anchor had its processing times added up, whereas GACT-X performed the alignment of the first-anchor-extended sequences. The total processing times for GACT-X were measured for 8 different tile sizes from 1000 to 8000. Figure 8 shows that GACT-X’s performance improved as the tile sizes increased from 1000 to their peak at 4000. However, subsequently, the performance started to worsen. It is suspected that this is due to BRAM saturation since the direction pointer storage is linearly cumulative and increases with the tile size. A new optimization is established for the GACT-X’s implementation with the tile size set to 4000, which has provided a speed-up of 1.68× over Minimap2’s ksw software. The speed-up increased with the input sub-sequence’s lengths, reaching up to 1.91×.

2.6. Acquiring Mapping and Alignment Accuracy

Minimap2’s mapping accuracy was evaluated by checking whether the simulated reads were mapped to the correct RefSeq and, from the correct results, by checking how much the alignment overlaps with the original position of the read, calculated as a percentage of its length. Under the optimizations provided in the previous section, GACT-X’s alignment accuracy was evaluated against Minimap2’s ksw function for the first 100,000 reads of each of the three datasets. Minimap2’s alignment results could be collected from the CIGAR (Concise Idiosyncratic Gapped Alignment Reports) strings in the SAM files, whereas the nucleotide input files had to be generated from Minimap2 for GACT-X, and the alignment results from these were reported as CIGARs on an output file. The accuracy was measured according to the alignment score, considering Minimap2’s parameters in Table 2. Ideally, all algorithms would find the optimal alignments, i.e., the maximum score possible for any pair of sequence inputs. However, heuristics such as banding and tiling can eventually miss the optimal alignment path in exchange for great performance advantages. The alignment lengths, with respect to the query sequences, were also measured and calculated as percentages. This measurement is relevant because both the ksw and the GACT-X functions perform semi-global alignments on the edges of the reads, which can result in higher alignment scores but, at the same time, can also discard the information contained on these edges. Ideally, the complete read sequences should be aligned with the reference. All of the data are presented in Section 3.

2.7. Integrating GACT-X into Minimap2

As the main objective of this work, the optimized version of GACT-X, as defined in Section 2.5, was totally integrated with Minimap2, substituting for the SK block. The software–hardware implementation was tested under different configurations. Minimap2’s original implementation allows multi-threading, during which each thread performs the sequential processing of seeding, chaining, and aligning one read at a time. Threads can be distributed to cores in the host server for concurrent processing. On the hardware end, OpenCL supports multi-kernels in the same FPGA, with as many kernels as the resources can fit. The AWS f1.2xlarge instance allows for implementations with up to 64 kernels and eight cores. However, only two GACT-X kernels can fit in total in the AWS instance’s FPGA due to the number of BRAMs available in the FPGA device.
Generally speaking, any thread could be assigned to any kernel to optimize concurrent processing. However, in Minimap2, only a limited form of concurrency in using the kernels related to GACT-X is possible because of the sequential aspect of data processing, as mentioned in the previous paragraph: the number of threads needs to correspond to at least the number of kernels; otherwise, the excess kernels will be idle. A kernel cannot carry the execution of different threads interchangeably before completing the alignment of the read.
The restrictions above require that, whenever there are more threads than kernels running, and the corresponding sequences generated by the chaining steps are ready for the alignment processing, a waiting list must be used for the threads in order to access an available/free kernel. On the other hand, in situations of a single thread run (single core), whatever the number of kernels, only one may be used.
GACT-X was integrated into Minimap2 in a hybrid system that accommodates the multi-threading and multi-kernel capabilities of the AWS instance. To implement it, a new C++ file containing the hardware’s host lines was added to the original Minimap2’s source code. To add one more GACT-X kernel, in the host code, the OpenCL cl_kernel variable was converted into an array of size two. When creating the kernels, they were assigned to separate memory banks. Similarly, different buffers and other variables were created for each of the two kernels. The kernel’s variables were declared global variables to be shared among the threads.
The configuration and setup of the kernels, which included the creation of the buffers, was added to a function, which was called once at the beginning of Minimap2’s main function. Shutdown and cleanup was added to another function and called at the end of the main. A new function was created for decoding the input sequences from Minimap2, writing them to the buffers, executing the kernels, and retrieving and encoding the results back to Minimap2. This function is called in the function “mm_align1” from file “align.c”, right after the execution of the sub-sequence that precedes the first anchor. An OpenCL cl_event variable “write_read_event” was used as a synchronization flag to avoid transfer clashes, since both of the kernels and all the threads use the same PCIe channel.
Before being processed, each thread enters a global FIFO queue. The thread stays in a loop until it is first in line and until there is one kernel available. The selected kernel is then set as unavailable to other threads. This process is protected by a mutex resource.
The tests were run with up to eight Minimap2 cores and up to two GACT-X kernels. The number of threads in each execution was selected on the command line, and the number of kernels was adjusted in the code. The analyses were made with the 100,000 first reads from all three datasets (simulated, real PacBio, and real ONT). The executions compare the hybrid system, consisting of Minimap2 integrated with GACT-X, with the original Minimap2 system running in software with a ksw-based alignment. The total execution time was acquired from the value displayed by Minimap2 in the command prompt at the end of the execution. The accuracy was already evaluated for these data as described in Section 2.6.

3. Results

3.1. Minimap2’s Throughput and Profile

To certify the appropriateness of accelerating Minimap2’s alignment step, as indicated in Section 2.3, its original software version was executed and analyzed on a Dell PowerEdge R910 server with 4 Intel® Xeon® CPU E7-4870 processors, 80 cores, and 504 GB of memory, running Ubuntu 16.04.7 LTS (GNU/Linux 4.4.0-201-generic x86_64). All three read sets were mapped to the primary assembly of the GRCh38 reference. Minimap2 was executed to output the alignment in the ".sam" format and with optimization for ONT or PacBio reads.
For the throughput and total execution time measurements, the three datasets were mapped completely using 40 threads, and the results are presented from columns 2 to 5 in Table 3. The throughput was calculated based on the datasets’ sizes and the CPU time. For the simulated reads with 61.99 Gbases of data, Minimap2 took 2:46 h to compute with 40 threads, corresponding to 42:41 CPU hours, which is a throughput of 403.46 kbases/s. For the real ONT reads with 52.2 Gbases of data, Minimap2 took 4:55 h to compute with 40 threads, corresponding to 88:21 CPU hours, which is a throughput of 164.11 kbases/s. Finally, for the real PacBio reads with 28.53 Gbases of data, Minimap2 took 2:14 h to compute with 40 threads, corresponding to 34:27 CPU hours, which is a throughput of 230.00 kbases/s. For the simulated, real ONT and the real PacBio reads, 6%, 27.5%, and 0.04% of the reads were not mapped, respectively.
Each function’s execution time was also collected to verify its contribution to Minimap2’s total runtime. The gprof Linux tool [39] was used, and, for safety, each execution was done with one thread. Because of this, only the first 200,000 reads of each dataset were selected for use; otherwise, the execution would have taken too long. The results are presented from columns 6 to 8 in Table 3. For the simulated reads, chaining and extending (functions ksw_extd2_sse41 and mm_chain_dp) took 8% and 49% of the execution time, respectively. For the real ONT reads, chaining and extending took 50% and 25% of the execution time, respectively. For the real PacBio reads, chaining and extending took 27% and 42% of the execution time, respectively.

3.2. GACT-X and Minimap2’s ksw Alignment Accuracy

Following the method indicated in Section 2.6, with the software version of Minimap2 running on the simulated reads, 99.45% of the reads were mapped to the correct RefSeq. From these, over 99.6% of the reads were mapped with an overlap greater than 90% of the expected mapping region.
To provide a qualitative view, Table 4 shows the alignment accuracy of GACT-X with respect to ksw’s accuracy—for each dataset, the percentage of alignment cases presenting a better or worse accuracy is based on the alignment score differences. Three score columns are defined: lower accuracy (<0 difference); equal accuracy (0 difference); and higher accuracy (>0 difference). For the simulated dataset, 3.90% of GACT-X’s results had a lower alignment score compared to Minimap2’s ksw function, 95.42% had the same score, and 0.68% had a higher score. For the real ONT dataset, 41.21% of GACT-X’s results had a lower alignment score than ksw, 47.79% had the same score, and 11.00% had a higher score. For the real PacBio dataset, 14.90% of GACT-X’s results had a lower alignment score than ksw, 66.83% had the same score, and 18.28% had a higher score.
Table 5 presents the distribution of query (read data) alignment lengths in the ranges 0–80, 80–90, 90–100, and 100 percent of the query. The alignment length indicates the quantity (proportion) of bases in the read data that is used effectively in the final alignment; the closer to 100 percent, the better. Note that the alignment length can be shorter because semi-global alignment is performed by both algorithms, which allows early interruption to not compromise the alignment score. For the simulated dataset, Minimap2’s ksw presented 1.06%, 0.22%, 60.97%, and 37.62% of the cases with base alignment results within those ranges, respectively, whereas GACT-X presented 1.52%, 0.23%, 55.21%, and 43.04%. For the real ONT dataset, ksw presented 21.56%, 2.59%, 73.57%, and 2.29% of the cases with base alignment results within those ranges, respectively, whereas GACT-X presented 36.24%, 3.64%, 58.47%, and 1.64%. For the real PacBio dataset, ksw presented 18.42%, 0.76%, 13.15%, and 67.67% of the cases with base alignment results within those ranges, respectively, whereas GACT-X presented 12.01%, 2.71%, 19.59%, and 65.69%.

3.3. Hybrid Minimap2 with GACT-X and Software Minimap2’s Alignment Speed

The performance measurements for the integrated software–hardware implementation, as described in Section 2.7, are presented in Table 6 and Figure 9. In the table, each one of the columns from 4 to 11 has as its number of CPU threads a value from 1 to 8. Each merged line in column 1 represents one of the three datasets: the simulated, the real ONT, and the real PacBio. For each dataset, there are measurements in seconds of the total software execution time (Minimap2) and the total hybrid system’s execution time (Minimap2 integrated with GACT-X) with one or two kernels. From these measurements, the hardware acceleration was calculated for each thread configuration in comparison to the software’s counterpart. The thread acceleration of each algorithm configuration (software, one kernel, or two kernels) was calculated regarding the performance of the corresponding single thread execution. Figure 9 is included to provide an easier visual comparison of the execution times. The figure makes it evident that this parameter is negatively affected by a large number of threads; additionally, the hybrid implementation with one or two kernels allows shorter execution times for an equal number of threads.

4. Discussion

4.1. Analyzing Minimap2’s Throughput and Profile

The Minimap2’s software execution presented different throughput and profile measurements for each dataset tested, as shown in Section 3.1. The highest throughput occurred for the mapping of the simulated dataset, with 40,336 kbases/s, about double that of the real dataset. This can be explained by the fact the simulated dataset was derived from the reference and might present a greater similarity. All dataset cases make it evident that the total execution time is very high, reinforcing the importance of hardware acceleration in genome assembly.
In profiling, the main identified bottlenecks are the chaining and the extending steps, representing together more than 57% of the execution time on all three datasets. Previous works reinforce this conclusion [26,28] or reveal that these are also the same bottlenecks of Minimap2 on short-read execution [45]. The extending step had a higher contribution running on the two PacBio datasets, whereas the chaining step had a higher contribution running on the ONT dataset.
These differences in profile could have been influenced by input data characteristics, such as read length distribution and similarities between references and reads. They could also have been affected by the mapping rate since the alignment step is skipped when a read fails to be mapped to the reference. However, the only clear direct correlation observed on the three datasets was between the throughput and the extending step time. The simulated case shows little chaining overhead, probably due to the high similarity to the reference, which eases the identification of correlated anchors.

4.2. Comparing Alignment Accuracy

Regarding the results from Section 3.2, Minimap2’s ksw mapping accuracy was satisfactory on the simulated dataset with an overall correct mapping position for 99.05% of the reads, considering that it is correctly mapped when there is an overlap of above 90% of the original region. It was not possible to evaluate this performance on the real datasets due to the lack of truth.
GACT-X’s alignment scores were very similar to Minimap2’s ksw on the simulated data, considerably worse on the real ONT data, and dissimilar but equivalent on the real PacBio data since there was a high rate of alignments that were worse and better. The absence of a second affine gap function in GACT-X might be responsible for most of the performances with worse alignment scores since the comparison was performed considering this second gap function. GACT-X’s tile and banding heuristics can also perform differently in comparison to Minimap2’s chaining and banding techniques, but a fairer comparison could be done with equal alignment parameters in the future.
Regarding query alignment lengths, both algorithms presented similar distributions on the two PacBio datasets. For the real ONT dataset, both GACT-X and ksw presented a high rate of alignment of less than 80% of the query, although GACT-X early interrupted more alignments than the ksw function did. These results, coupled with the low mapping rate of the real ONT reads, indicate that the real ONT dataset has a significant disparity from the genome reference used, which may affect the mapping and alignment accuracies of both of the algorithms.

4.3. Comparing Alignment Speed for Software Minimap2 with the ksw Function and Hybrid Minimap2 wit GACT-X

Regarding the results from Section 3.3, the execution times of the software-only implementation for all datasets have shown a steady decrease for an increasing number of threads. However, the relation is not linear due to the increase in the management complexity for a larger number of threads. The execution times for the integrated software–hardware systems also decreased in the initial addition of threads, as expected, but stabilized and increased again from about five or six threads, regardless of the number of kernels, reflecting reduced thread acceleration.
Instances with seven and eight threads saw their execution times explode, which is inconsistent with the change rate for the other measured times and makes them unreliable for analysis. Considering there are eight available cores for processing, possibly two of them are used for system management and conflict with the GACT-X’s host lines.
The use of two kernels improved the execution time when compared to the single kernel case, as expected, but this trend changes after five threads, similar to the single kernel case. The improvement is also not consistent with a double increase in performance; the reduced time with three or more threads was limited, with the maximum of close to 10%. It would be expected that, with more available kernels, the workload from a larger number of threads could be alleviated, with better acceleration.
The highest achieved acceleration, therefore, was of 1.41× with one thread for the simulated dataset with one and two kernels and for the real ONT dataset with two kernels. The second-highest speed-up was of 1.38× for the simulated dataset with one thread and one kernel and for the real ONT dataset with two threads and two kernels.

4.4. The Transfer Channel Issue

The discussion in the previous section indicates a possible performance limitation due to the competition for the PCIe transfer channel. In [32], the authors have shown that the experiments made on communication-intensive applications (i.e., spam filtering and face detection) presented a maximum of 2× acceleration performed on single board instances of different cloud service providers. Their results corroborate with the results shown in Section 2.5 and Section 3.3. A maximum speed-up of 1.91× during the extending step corresponds to a maximum speed-up of 1.41× in the integrated system, considering the time profile of Minimap2. This paper makes clear the influence of the PCIe transfer channel on the overall system’s performance.
In order to verify the behavior of GACT-X with respect to the data transfer, a second run of experiments was made. Time measurements were taken for every kernel processing, data transfer, and waiting-in-line instance and were accumulated, respectively. These instances in each thread were measured independently of any other part of Minimap2’s execution that could occur concurrently. Therefore, the total accumulated time cannot be directly correlated to the total execution time, shown in Table 6, except for the case of a single thread, which is completely sequential.
The kernel processing times were measured using the function “clGetEventProfilingInfo” and START and END event flags. The data transfer times, which include the times to transfer sequences and tile information, as can be seen by items 1 and 2, respectively, in Figure 6, are measured similarly. The time spent by the threads waiting in line for a kernel was measured using “clock_t”. Each writing, reading, and kernel event had to be completed for the execution of the code to proceed to the next line by setting an OpenCL blocking resource so that the measurements could be taken.
The results are displayed in Table 7. The datasets listed in column 1 are separated into one- or two-kernel cases in column 2. Column 3 divides into rows the times measured in seconds for processing, data transfer, and waiting in line. All eight threads cases are treated in the remaining columns.
Considering that the kernel processing time reflects the computation of the total amount of the inputs, which is constant throughout the different kernel and thread configurations, most of the results were consistent. Considerate inconsistency was observed on configurations of six or more threads. Since the OpenCL’s clEnqueueTask command is a macro, the management of large numbers of threads probably starts to affect the measurements of its time span.
For all datasets, the data transfer time increased with the number of threads (for a fixed implementation) and with the number of kernels (for a fixed number of threads). This reinforces the suspicion about a single-channel conflict of the data transfer.
With respect to the time in line, for all datasets, in the single thread cases that have a sequential nature, there will always be a kernel available, and the observed waiting time is close to zero. In the case of two threads, for a two-kernel implementation, the same occurs. However, for a one-kernel implementation, a second thread has to wait for the kernel to be liberated from the computation of a first thread; therefore, the waiting time in line is larger, for example, 83.11 seconds for the simulated PacBio dataset.
Another observation regarding the time in line is that, for all datasets and implementations, it increases with the number of threads. That indicates that the kernels are becoming more occupied and less available to take new jobs and clear the waiting queue. The management complexity for the threads, which affects the data dispatching time, is especially critical for seven or eight threads, probably due to the superposition with the operating system execution. This time-in-line effect has a strong impact on the total execution time, leading to the figures observed in Table 6.
The increase in the time in line indicates that one or two kernels were not always available for the threads, becoming the bottleneck of the integrated system. Additionally, not all of the availability of a second kernel is occupied, indicating a dispute in the PCIe interface. Still, the waiting time for the two-kernel implementation, for all datasets, showed to be, for the varied number of threads, significantly shorter than the corresponding ones in the one-kernel implementation.
This previous discussion suggests that a larger number of kernels (and, therefore, more hardware resources) can yield better results in a multi-threading system. The above results on queue delay, along with the analysis made on the OpenCL code and the GACT-X’s data transfer, indicate that it is advisable to include more transfer channels (i.e., a multi-FPGA system), avoiding the kernel PCIe competition. Adding trace-back hardware support may also bring benefits in this direction. By also including the chaining FPGA implementation from [26], a robust accelerated hybrid solution in FPGA cloud may be expected for a Minimap2-based read assembler.

4.5. Future Work

Some future developments could be carried out to improve the results of this work:
  • A multi-FPGA design could sustain the acceleration of more threads of Minimap2 with more kernels. For this, the implementation has to be updated to the Vitis environment since SDAccel instances have been deprecated during the length of this work, and a new multi-FPGA AWS instance has to be created with an additional cost. All of these must be evaluated since, according to the findings in [32], the best performance/cost instance is the single FPGA one, and, for memory and communication intensive applications, the increase in the number of FPGAs may not bring a proportional performance increase, unless careful management of the virtual machine is executed.
  • Trace-back support could be added to the design to increase the acceleration, mainly by reducing the size of the transferred data (from trace-back pointers to CIGAR strings). This implies changing the Verilog RTL description with a probable increase in the hardware area in the programmable logic, which has to be evaluated with the current design.
  • A second affine function could be incorporated into the GACT-X’s hardware design to properly mirror Minimap2’s alignment scores and improve the compared accuracy, especially for datasets with many long gaps.

5. Conclusions

This work has proposed a hybrid software–hardware implementation to accelerate Minimap2’s extending step on a cloud FPGA design. The limitations in the face of the challenges in implementing memory-based and communication-intensive algorithms on cloud FPGAs have been identified. The hardware aligner GACT-X was adapted to substitute for Minimap2’s SK software long-read alignment algorithm and was integrated into the Minimap2 assembler.
In order to have reliable and robust benchmarking, three different read datasets (one simulated and two real) were used and validated through Minimap2’s execution and profiling. The results have shown that varied long-read patterns were available as input, in addition to certifying that the extending step consists of a bottleneck in Minimap2 data processing.
GACT-X was hosted on an AWS f1.2xlarge instance FPGA cloud for a series of tests with the three datasets. The tests have aimed to optimize the implementation under the long-read alignment environment for increased performance. The tests have shown 4000 bases as the best tile length to be adopted. The results with this GACT-X stand-alone version have shown that GACT-X can be up to 1.91× faster than SK from Minimap2, including the data transfer time with the FPGA’s DRAM. The GACT-X implementation was also compared to Minimap2’s ksw function, which performs the SK algorithm. GACT-X’s alignment accuracy was close to Minimap2’s in two datasets, and worse than Minimap2’s on one real dataset that also presented a high rate of unmapped reads.
GACT-X was fully integrated into Minimap2 in an f1.2xlarge instance and executed on combinations with one to two FPGA kernels and one to eight software threads. The results were presented regarding the processing speed and acceleration in comparison to those of Minimap2 in software. The integrated system achieved the highest speed-up of 1.41× over Minimap2’s software performance. The data transfer delays were measured and, for multiple concurrent threads and two kernels, a dispute for the PCIe channel was reported in the observations.
GACT-X’s performance in AWS was consistent with what was reported in earlier works on FPGA clouds regarding communication-intensive applications. Additionally, the results on data transfer delays with GACT-X allowed for the identification of bottlenecks in the tile processing, revealing new hardware design strategies for further acceleration in future work. These actions, added to the previously proposed hardware acceleration for the chaining step, may lead to a sturdy FPGA cloud Minimap2.

Author Contributions

Conceptualization, C.T., R.W.A. and J.C.W.; methodology, C.T. and J.C.W.; software, C.T. and R.W.A.; validation, J.C.W. and F.J.F.; formal analysis, C.T. and R.W.A.; investigation, C.T. and R.W.A.; resources, C.T. and J.C.W.; data curation, C.T. and R.W.A.; writing—original draft preparation, C.T. and J.C.W.; writing—review and editing, C.T., J.C.W. and F.J.F.; visualization, C.T.; supervision, J.C.W. and F.J.F.; project administration, J.C.W. and F.J.F.; funding acquisition, C.T., J.C.W. and F.J.F. All authors have read and agreed to the published version of the manuscript.

Funding

This research was partially supported by the National Council for Scientific and Technological Development with grant number 133892/2020-4. The APC was disbursed by the Coordination of Superior Level Staff Improvement and by the University of São Paulo.

Informed Consent Statement

Patient consent was waived due to their data being collected from public repositories.

Data Availability Statement

Publicly available datasets were analyzed in this study. These data can be found here: [33,34,36,38]. The original programs used in this study can be found here: [42,44]. The adapted code presented in this study is available at [46].

Acknowledgments

The authors express their gratitude to Carlos Menck from the Institute of Biomedical Sciences at University of São Paulo for granting access to the Bioinformatics Seal server used in this work.

Conflicts of Interest

The authors declare no conflict of interest. The funders had no role in the design of the study; in the collection, analysis, or interpretation of data; in the writing of the manuscript; or in the decision to publish the results.

Abbreviations

The following abbreviations are used in this manuscript:
ASIC   Application Specific Integrated Circuit
AMI   Amazon Machine Image
AWS   Amazon Web Services
BRAM   Block Random-Access Memory
CIGAR   Concise Idiosyncratic Gapped Alignment Report
COVID-19   coronavirus disease 2019
CPU   Central Processing Unit
CUDA   Compute Unified Device Architecture
DNA   deoxyribonucleic acid
DRAM   Dynamic Random Access Memory
DSA   domain-specific architecture
ENA   European Nucleotide Archive
FPGA   Field Programmable Gate Array
GPU   Graphic Processing Unit
GRCh38.p14   Genome Reference Consortium Human Build 38 patch release 14
indel   insertion/deletion
I/O   Input/Output
KNL   Knights Landing
MDPI   Multidisciplinary Digital Publishing Institute
NCBI   National Center for Biotechnology Information
ONT   Oxford Nanopore Technologies
OpenCL   Open Computing Language
PacBio   Pacific Biosciences
PCIe   Peripheral Component Interconnect Express
PE   processing element
SSD   Solid-state drive
SIMD   Single Instruction, Multiple Data
SK   Suzuki–Kasahara
SSE   Streaming SIMD Extensions
SV   structural variant
SWG   Smith–Waterman–Gotoh

References

  1. Kushnick, T. Thompson & Thompson Genetics in Medicine. JAMA 1992, 267, 2115. [Google Scholar] [CrossRef]
  2. Heng, J.; Heng, H.H. Karyotype coding: The creation and maintenance of system information for complexity and biodiversity. Biosystems 2021, 208, 104476. [Google Scholar] [CrossRef] [PubMed]
  3. Orteu, A.; Jiggins, C.D. The genomics of coloration provides insights into adaptive evolution. Nat. Rev. Genet. 2020, 21, 461–475. [Google Scholar] [CrossRef] [PubMed]
  4. Georgakopoulos-Soares, I.; Chartoumpekis, D.V.; Kyriazopoulou, V.; Zaravinos, A. EMT Factors and Metabolic Pathways in Cancer. Front. Oncol. 2020, 10, 499. [Google Scholar] [CrossRef] [PubMed]
  5. Alser, M.; Bingol, Z.; Cali, D.S.; Kim, J.; Ghose, S.; Alkan, C.; Mutlu, O. Accelerating Genome Analysis: A Primer on an Ongoing Journey. IEEE Micro 2020, 40, 65–75. [Google Scholar] [CrossRef]
  6. Reuter, J.A.; Spacek, D.V.; Snyder, M.P. High-Throughput Sequencing Technologies. Mol. Cell 2015, 58, 586–597. [Google Scholar] [CrossRef] [Green Version]
  7. Hennessy, J.L.; Patterson, D.A. A New Golden Age for Computer Architecture. Commun. ACM 2019, 62, 48–60. [Google Scholar] [CrossRef] [Green Version]
  8. Samura, O. Update on noninvasive prenatal testing: A review based on current worldwide research. J. Obstet. Gynaecol. Res. 2020, 46, 1246–1254. [Google Scholar] [CrossRef]
  9. Gadsbøll, K.; Petersen, O.B.; Gatinois, V.; Strange, H.; Jacobsson, B.; Wapner, R.; Vermeesch, J.R.; NIPT-map Study Group; Vogel, I. Current use of noninvasive prenatal testing in Europe, Australia and the USA: A graphical presentation. Acta Obstet. Et Gynecol. Scand. 2020, 99, 722–730. [Google Scholar] [CrossRef]
  10. Liu, T.; Chen, Z.; Chen, W.; Chen, X.; Hosseini, M.; Yang, Z.; Li, J.; Ho, D.; Turay, D.; Gheorghe, C.P.; et al. A benchmarking study of SARS-CoV-2 whole-genome sequencing protocols using COVID-19 patient samples. iScience 2021, 24, 102892. [Google Scholar] [CrossRef]
  11. Thiel, V.; Ivanov, K.A.; Putics, A.; Hertzig, T.; Schelle, B.; Bayer, S.; Weißbrich, B.; Snijder, E.J.; Rabenau, H.; Doerr, H.W.; et al. Mechanisms and enzymes involved in SARS coronavirus genome expression. J. Gen. Virol. 2003, 84, 2305–2315. [Google Scholar] [CrossRef]
  12. GRCh38.p14. Available online: https://www.ncbi.nlm.nih.gov/assembly/GCF_000001405.40 (accessed on 18 February 2023).
  13. Amarasinghe, S.L.; Su, S.; Dong, X.; Zappia, L.; Ritchie, M.E.; Gouil, Q. Opportunities and challenges in long-read sequencing data analysis. Genome Biol. 2020, 21, 1–16. [Google Scholar] [CrossRef] [Green Version]
  14. Li, H. Minimap2: Pairwise alignment for nucleotide sequences. Bioinformatics 2018, 34, 3094–3100. [Google Scholar] [CrossRef] [Green Version]
  15. Burrows-Wheeler Aligner. Available online: http://bio-bwa.sourceforge.net/ (accessed on 18 February 2023).
  16. Langmead, B.; Salzberg, S.L. Fast gapped-read alignment with Bowtie 2. Nat. Methods 2012, 9, 357–359. [Google Scholar] [CrossRef] [PubMed] [Green Version]
  17. Smith, T.F.; Waterman, M.S. Identification of common molecular subsequences. J. Mol. Biol. 1981, 147, 195–197. [Google Scholar] [CrossRef] [PubMed]
  18. Gotoh, O. Optimal sequence alignment allowing for long gaps. Bull. Math. Biol. 1990, 52, 359–373. [Google Scholar] [CrossRef] [PubMed]
  19. Fujiki, D.; Wu, S.; Ozog, N.; Goliya, K.; Blaauw, D.; Narayanasamy, S.; Das, R. SeedEx: A Genome Sequencing Accelerator for Optimal Alignments in Subminimal Space. In Proceedings of the 2020 53rd Annual IEEE/ACM International Symposium on Microarchitecture (MICRO), Athens, Greece, 17–21 October 2020; pp. 937–950. [Google Scholar] [CrossRef]
  20. Liao, Y.L.; Li, Y.C.; Chen, N.C.; Lu, Y.C. Adaptively Banded Smith-Waterman Algorithm for Long Reads and Its Hardware Accelerator. In Proceedings of the 2018 IEEE 29th International Conference on Application-Specific Systems, Architectures and Processors (ASAP), Milano, Italy, 10–12 July 2018; pp. 1–9. [Google Scholar] [CrossRef]
  21. Adewale, B.A. Will long-read sequencing technologies replace short-read sequencing technologies in the next 10 years? Afr. J. Lab. Med. 2020, 9, 1–5. [Google Scholar] [CrossRef]
  22. Mantere, T.; Kersten, S.; Hoischen, A. Long-Read Sequencing Emerging in Medical Genetics. Front. Genet. 2019, 10, 426. [Google Scholar] [CrossRef] [Green Version]
  23. Antipov, D.; Korobeynikov, A.; McLean, J.S.; Pevzner, P.A. hybridSPAdes: An algorithm for hybrid assembly of short and long reads. Bioinformatics 2015, 32, 1009–1015. [Google Scholar] [CrossRef] [Green Version]
  24. Suzuki, H.; Kasahara, M. Introducing difference recurrence relations for faster semi-global alignment of long sequences. BMC Bioinform. 2018, 19, 33–47. [Google Scholar] [CrossRef]
  25. Goyal, A.; Kwon, H.; Lee, K.; Garg, R.; Yun, S.; Kim, Y.; Lee, S.; Lee, M. Ultra-Fast Next Generation Human Genome Sequencing Data Processing Using DRAGENTM Bio-IT Processor for Precision Medicine. Open J. Genet. 2017, 7, 9–19. [Google Scholar] [CrossRef] [Green Version]
  26. Guo, L.; Lau, J.; Ruan, Z.; Wei, P.; Cong, J. Hardware Acceleration of Long Read Pairwise Overlapping in Genome Sequencing: A Race Between FPGA and GPU. In Proceedings of the 2019 IEEE 27th Annual International Symposium on Field-Programmable Custom Computing Machines (FCCM), San Diego, CA, USA, 28 April–1 May 2019; pp. 127–135. [Google Scholar] [CrossRef]
  27. Kaplan, R.; Yavits, L.; Ginosar, R. RASSA: Resistive Prealignment Accelerator for Approximate DNA Long Read Mapping. IEEE Micro 2019, 39, 44–54. [Google Scholar] [CrossRef] [Green Version]
  28. Feng, Z.; Qiu, S.; Wang, L.; Luo, Q. Accelerating Long Read Alignment on Three Processors. In Proceedings of the Proceedings of the 48th International Conference on Parallel Processing, Kyoto, Japan, 5–8 August 2019; Association for Computing Machinery: New York, NY, USA, 2019. [Google Scholar] [CrossRef]
  29. Koliogeorgi, K.; Voss, N.; Fytraki, S.; Xydis, S.; Gaydadjiev, G.; Soudris, D. Dataflow Acceleration of Smith-Waterman with Traceback for High Throughput Next Generation Sequencing. In Proceedings of the 2019 29th International Conference on Field Programmable Logic and Applications (FPL), Barcelona, Spain, 8–12 September 2019; pp. 74–80. [Google Scholar] [CrossRef] [Green Version]
  30. Turakhia, Y.; Goenka, S.D.; Bejerano, G.; Dally, W.J. Darwin-WGA: A Co-processor Provides Increased Sensitivity in Whole Genome Alignments with High Speedup. In Proceedings of the 2019 IEEE International Symposium on High Performance Computer Architecture (HPCA), Washington, DC, USA, 16–20 February 2019; pp. 359–372. [Google Scholar] [CrossRef]
  31. Amazon EC2 F1 Instances. Available online: https://aws.amazon.com/ec2/instance-types/f1/?nc1=h_ls (accessed on 18 February 2023).
  32. Wang, X.; Niu, Y.; Liu, F.; Xu, Z. When FPGA Meets Cloud: A First Look at Performance. IEEE Trans. Cloud Comput. 2020, 10, 1344–1357. [Google Scholar] [CrossRef]
  33. GRCh38. Available online: https://www.ncbi.nlm.nih.gov/assembly/GCF_000001405.26 (accessed on 18 February 2023).
  34. Run: ERR2585114. Available online: https://www.ebi.ac.uk/ena/browser/view/ERR2585114 (accessed on 18 February 2023).
  35. Coster, W.D.; Rijk, P.D.; Roeck, A.D.; Pooter, T.D.; D’Hert, S.; Strazisar, M.; Sleegers, K.; Broeckhoven, C.V. Structural variants identified by Oxford Nanopore PromethION sequencing of the human genome. Genome Res. 2019, 29, 1178–1187. [Google Scholar] [CrossRef] [Green Version]
  36. SRX9063500: PacBio SMRT Whole Genome Sequencing of Sri Lankan Tamil H. sapiens. Available online: https://www.ncbi.nlm.nih.gov/sra/SRX9063500[accn] (accessed on 18 February 2023).
  37. Ono, Y.; Asai, K.; Hamada, M. PBSIM: PacBio reads simulator—toward accurate genome assembly. Bioinformatics 2013, 29, 119–121. [Google Scholar] [CrossRef] [Green Version]
  38. Human 54x Dataset. Available online: http://datasets.pacb.com/2014/Human54x/fast.html (accessed on 18 February 2023).
  39. GNU Gprof. Available online: https://ftp.gnu.org/old-gnu/Manuals/gprof-2.9.1/html_mono/gprof.html (accessed on 18 February 2023).
  40. FPGA Developer AMI. Available online: https://aws.amazon.com/marketplace/pp/prodview-gimv3gqbpe57k (accessed on 18 February 2023).
  41. tmux. Available online: https://github.com/tmux/tmux (accessed on 18 February 2023).
  42. Minimap2-2.18. Available online: https://github.com/lh3/minimap2/releases/tag/v2.18 (accessed on 18 February 2023).
  43. aws-fpga. Available online: https://github.com/aws/aws-fpga (accessed on 18 February 2023).
  44. Darwin-WGA. Available online: https://github.com/gsneha26/Darwin-WGA (accessed on 18 February 2023).
  45. Teng, C.; Achjian, R.W.; Braga, C.C.; Zuffo, M.K.; Chau, W.J. Accelerating the base-level alignment step of DNA assembling in Minimap2 Algorithm using FPGA. In Proceedings of the 2021 IEEE 12th Latin America Symposium on Circuits and System (LASCAS), Arequipa, Peru, 22–25 February 2021; pp. 1–4. [Google Scholar] [CrossRef]
  46. Adapting-the-GACT-X-Aligner-to-Accelerate-Minimap2-in-an-FPGA-Cloud-Instance. Available online: https://github.com/carolina-teng/Adapting-the-GACT-X-Aligner-to-Accelerate-Minimap2-in-an-FPGA-Cloud-Instance (accessed on 19 March 2023).
Figure 1. The seed-and-extend reference-guided read assembly strategy. This is a simplified example of the steps adopted in Minimap2 [14]. (1) The seeding stage implements a position table indexing method for each unique sequence of a length k (k-mer) in the reference; this allows for efficient computation of the exact matches of k-mers between the read and reference, defining the anchors along them. (2) The filtering stage is performed via the chaining algorithm, which selects correlated anchors to form chains that are sorted by their corresponding scores. (3) In the extending stage, read sub-sequences are aligned to reference sub-sequences, guided by the anchoring positions in the selected chain(s).
Applsci 13 04385 g001
Figure 2. Diagram of Minimap2’s pipeline with GACT-X replacing the ksw function for alignment. Minimap2 computes the seeding and chaining steps from a reference sequence and reads inputs. The ksw function, performing the SK algorithm, and GACT-X receive as inputs the read sequences and their mapping positions in the reference, and deliver as outputs the SWG alignments. The alignments are organized and written to an output file that corresponds to the assembly of that set of reads.
Applsci 13 04385 g002
Figure 3. Simulated, real ONT, and real PacBio read length percentage histograms. Read lengths are grouped in intervals of 5000 nucleotide bases, except for the rightmost column, which represents all reads longer than 30,000 bases.
Applsci 13 04385 g003
Figure 4. Example of a GACT-X SWG semi-global alignment with expansion from the top-left corner. For reference, the scale is based on the values of query and target lengths of 14,000 bases, tile size being 4000, the tile overlap being 128, and 32 rows in each stripe. The SWG matrix is the widest light square on the left; the alignment was finished with 4 tiles in medium gray. The X-drop band of calculated cells is in dark gray, which can be seen more clearly on the zoom-in on the right, with the final alignment path in light blue.
Applsci 13 04385 g004
Figure 5. GACT-X’s systolic array architecture with 32 PEs. The host transfers the target and the query sequences to the DRAM. N P E = 32 query characters are loaded to the PEs, and target elements are streamed in a systolic fashion. A fixed memory of 1 BRAM bank per PE is allocated to store the 4-bit trace-back pointers, sequentially—2 bits for the main matrix and 2 bits for gap matrices. The start and stop positions of each stripe are stored in separate BRAMs.
Applsci 13 04385 g005
Figure 6. Illustration of GACT-X’s host-FPGA data transfer flowchart. The inputs correspond to many pairs of read and reference anchor-separated sub-sequences (as seen in Section 2.1), which were collected from Minimap2 after the seeding and chaining steps (left of the figure). The sequence of steps for the software–hardware interaction is as follows: (1) sequential transfer of each anchor-separated sub-sequence from the host server to the FPGA board into the “ref_seq” and “query_seq” buffers; (2) the execution of each anchor-separated sub-sequence with a looped data transfer between the host and the FPGA, corresponding to the number of tiles. For this looped execution (5 tiles): (a) the host sets the tile’s starting indexes with variables “ref_offset” and “query_offset”, and the tile’s size with variables “ref_len” and “query_len”, sending them to the FPGA; (b) the FPGA kernel calculates the alignment for the tile and writes the alignment score, the maximum score’s indexes with variables “ref_pos” and “query_pos”, and the number of trace-back pointers in the band back to the host, all from the “tile_output” buffer. The trace-back pointers are transferred from the “tb_output” buffer.
Applsci 13 04385 g006
Figure 7. Ksw function and GACT-X average processing times per length for anchor-separated sub-sequences for the simulated dataset. The processed subsequences are classified by their length, in 100 base intervals, up to 1000 bases. The times are longer for GACT-X (dashed and dotted curve) compared to the ksw function execution (dotted curve).
Applsci 13 04385 g007
Figure 8. Processing times for the ksw function from Minimap2 and for GACT-X with different tile sizes for first-anchor-extended sub-sequences (for the first 100,000 reads of the simulated dataset). The first bar corresponds to the original ksw function. All other bars correspond to GACT-X’s implementations configured to different tile sizes (from 1000 to 8000 bases). The shortest processing time was measured for a tile size of 4000.
Applsci 13 04385 g008
Figure 9. Processing times for Minimap2 in software with the ksw function and for the integrated hybrid system Minimap2-GACT-X. Each chart corresponds to one of the three datasets used as inputs. The hybrid system may run with 1 or 2 kernels (gray and hatched bars, respectively). Minimap2 can be set to run in multi-thread mode (with 1 to 8 threads).
Applsci 13 04385 g009
Table 1. Statistics of long reads generated with PBSIM in sampling mode.
Number of ReadsCoverage DepthRead LengthRead AccuracyVariant Rates
Means.d.min.max.Means.d.SubstitutionInsertionDeletion
7,460,510208310106.2610024,9880.850.000170.0150.0900.046
Table 2. Minimap2 and GACT-X’s alignment parameters.
Match ScoreMismatch Score1st Affine Function2nd Affine FunctionX-Drop
Gap OpenGap ExtendGap OpenGap Extend
Minimap22−4−4−2−24−1-
GACT-XOriginal91 to 100−31 to −125−430−30--9430
Adapted10−20−30−10--943
Table 3. Minimap2’s throughput and bottlenecks running on long-read datasets.
Average
Length (nt)
Real Time
(Hours) *
CPU Time
(Hours) *
Dataset Size
(Gbases)
Throughput
(kbases/s)
Chaining
Time **
Extending
Time **
Simulated PacBio Reads83002:4642:4161.99403.468%49%
Real PacBio Reads13,3004:5588:2152.20164.1150%25%
Real ONT Reads16,9002:1434:2728.53230.0027%42%
* 40 threads, complete dataset. ** 1 thread, first 200,000 reads.
Table 4. Minimap2’s ksw and GACT-X’s alignment score differences for three datasets.
GACT-X ksw Score Difference<00>0
Simulated PacBio3.90%95.42%0.68%
Real ONT41.21%47.79%11.00%
Real PacBio14.90%66.83%18.28%
Table 5. Minimap2’s ksw and GACT-X’s aligned bases percentage of query sequences for three datasets.
Percentage of Aligned Bases0–8080–9090–100100
Simulated
PacBio
Minimap2’s ksw1.06%0.22%60.97%37.62%
GACT-X 40001.52%0.23%55.21%43.04%
Real ONTMinimap2’s ksw21.56%2.59%73.57%2.29%
GACT-X 400036.24%3.64%58.47%1.64%
Real
PacBio
Minimap2’s ksw18.42%0.76%13.15%67.67%
GACT-X 400012.01%2.71%19.59%65.69%
Table 6. Execution times and acceleration in the Minimap2-GACT-X integrated system.
Number of Threads (sw)12345678
Simulated
PacBio
softwaretotal execution (s)759.157390.198266.926206.255197.863186.727177.508169.927
1 kerneltotal execution (s)539.56299.76233.88208.93203.74253.84409.03453.26
acceleration1.411.301.140.990.970.740.430.37
thread acceleration1.001.802.312.582.652.131.321.19
2 kernelstotal execution (s)538.996289.557211.837198.700203.366228.516273.066313.150
acceleration1.411.351.261.040.970.820.650.54
thread acceleration1.001.862.542.712.652.361.971.72
Real ONTsoftwaretotal execution (s)3105.501559.591056.77806.37774.30719.29684.98646.35
1 kerneltotal execution (s)2243.691,168.48837.14712.91653.68660.44937.681258.13
acceleration1.381.331.261.131.181.090.730.51
thread acceleration1.001.922.683.153.433.402.391.78
2 kernelstotal execution (s)2197.2651126.070794.728638.109586.025576.393672.990858.846
acceleration1.411.381.331.261.321.251.020.75
thread acceleration1.001.952.763.443.753.813.262.56
Real
PacBio
softwaretotal execution (s)4255.212132.711431.381083.291037.82965.57904.33858.31
1 kerneltotal execution (s)3570.251,813.391243.761003.40919.39889.681077.631575.97
acceleration1.191.181.151.081.131.090.840.54
thread acceleration1.001.972.873.563.884.013.312.27
2 kernelstotal execution (s)3470.7991765.3411239.144994.346885.107831.761855.4541117.282
acceleration1.231.211.161.091.171.161.060.77
thread acceleration1.001.972.803.493.924.174.063.11
Table 7. Processing, transferring, and waiting times in the Minimap2-GACT-X system.
Number of Threads (sw)12345678
Simulated
PacBio
1 kernel
time (s)
processing94.1494.6295.1696.1696.7198.11132.26150.40
data transfer26.9028.8132.0733.2434.1337.59152.30150.51
time in line0.2183.11318.66845.771789.563377.4813,990.1121,404.43
2 kernels
time (s)
processing94.2094.9995.4395.8996.49110.83129.61141.75
data transfer27.0034.7737.8737.2547.99146.70165.48166.65
time in line0.150.2444.49186.04619.473813.987592.4712,094.00
Real ONT1 kernel
time (s)
processing322.29323.02324.33326.42327.82331.18388.75476.91
data transfer12.2048.5451.6653.7259.8875.27361.88503.51
time in line0.15148.91544.151310.522548.164926.2724,567.7650,482.29
2 kernels
time (s)
processing322.66324.16324.98326.04327.69346.86376.96420.51
data transfer42.8053.1561.2560.1186.25227.04347.46476.46
time in line0.240.2754.48242.43802.664210.8811,777.9925,100.46
Real
PacBio
1 kernel
time (s)
processing255.12255.52257.62259.56261.43264.64324.07465.84
data transfer53.2857.3861.3765.2774.1991.04383.26723.37
time in line0.2063.13219.84499.16962.391909.1016,175.7253,765.80
2 kernels
time (s)
processing255.79257.62258.97259.90261.93284.62333.82388.27
data transfer53.6464.2970.0270.5991.89275.96452.71683.43
time in line0.100.4115.7868.70228.422063.878240.6523,054.56
Disclaimer/Publisher’s Note: The statements, opinions and data contained in all publications are solely those of the individual author(s) and contributor(s) and not of MDPI and/or the editor(s). MDPI and/or the editor(s) disclaim responsibility for any injury to people or property resulting from any ideas, methods, instructions or products referred to in the content.

