
Feasibility of Conventional Non-Destructive Testing Methods in Detecting Embedded FRP Reinforcements
 , , ,
, , ,
Abstract
:1. Introduction
2. Materials and Methods
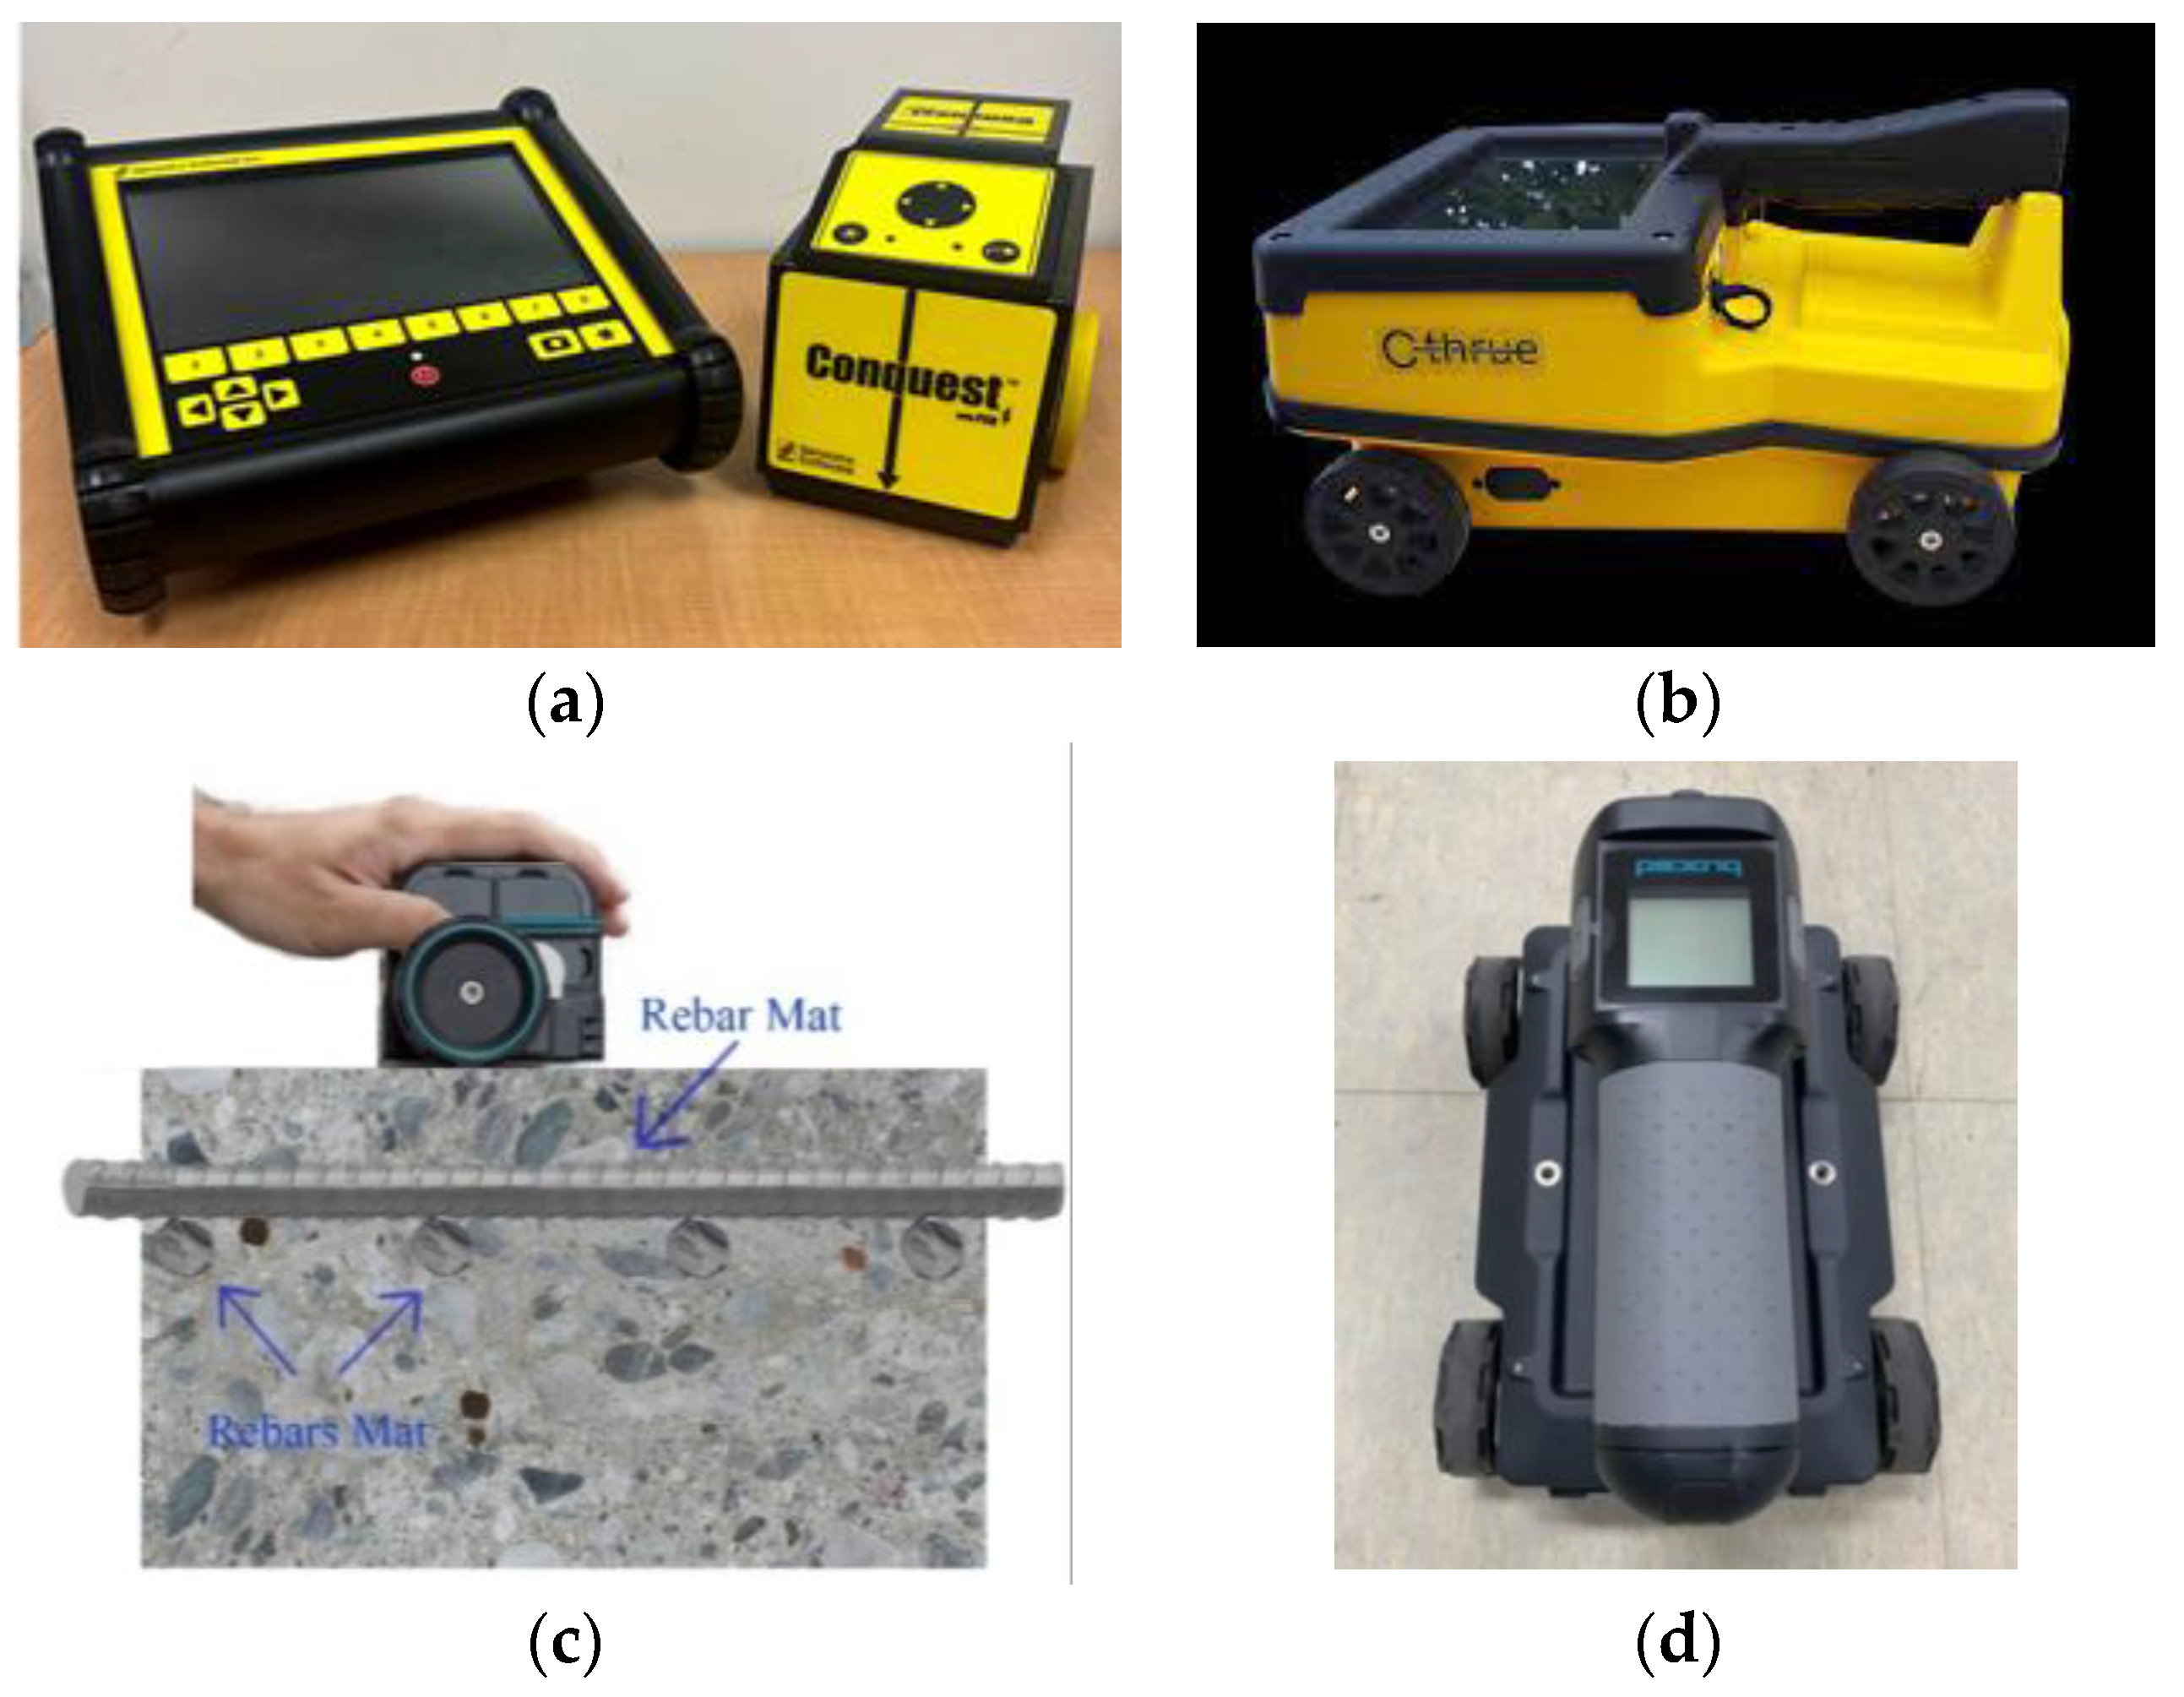
2.1. GPR Tests

| GPR Systems | Center Frequency | Radar Technology | Depth Range | Manufacturer |
|---|---|---|---|---|
| Conquest 100 Enhanced | 1000 MHz | Monostatic GPR antenna | 24 in. (60 cm) | Sensors and Software, Canada |
| C-Thrue radar | 2000 MHz | Dual polarization antenna for multi-level detection | 31.5 in. (80 cm) | IDS GeoRadar, Italy |
| Proceq GP8800 | 400–6000 MHz | Stepped-frequency continuous-wave (SFCW) GPR | 25.6 in. (65 cm) | Screening Eagle Technologies, Switzerland |
| Proceq GP8000 | 200–4000 MHz | Stepped-frequency continuous-wave (SFCW) GPR | 31.5 in. (80 cm) | Screening Eagle Technologies, Switzerland |
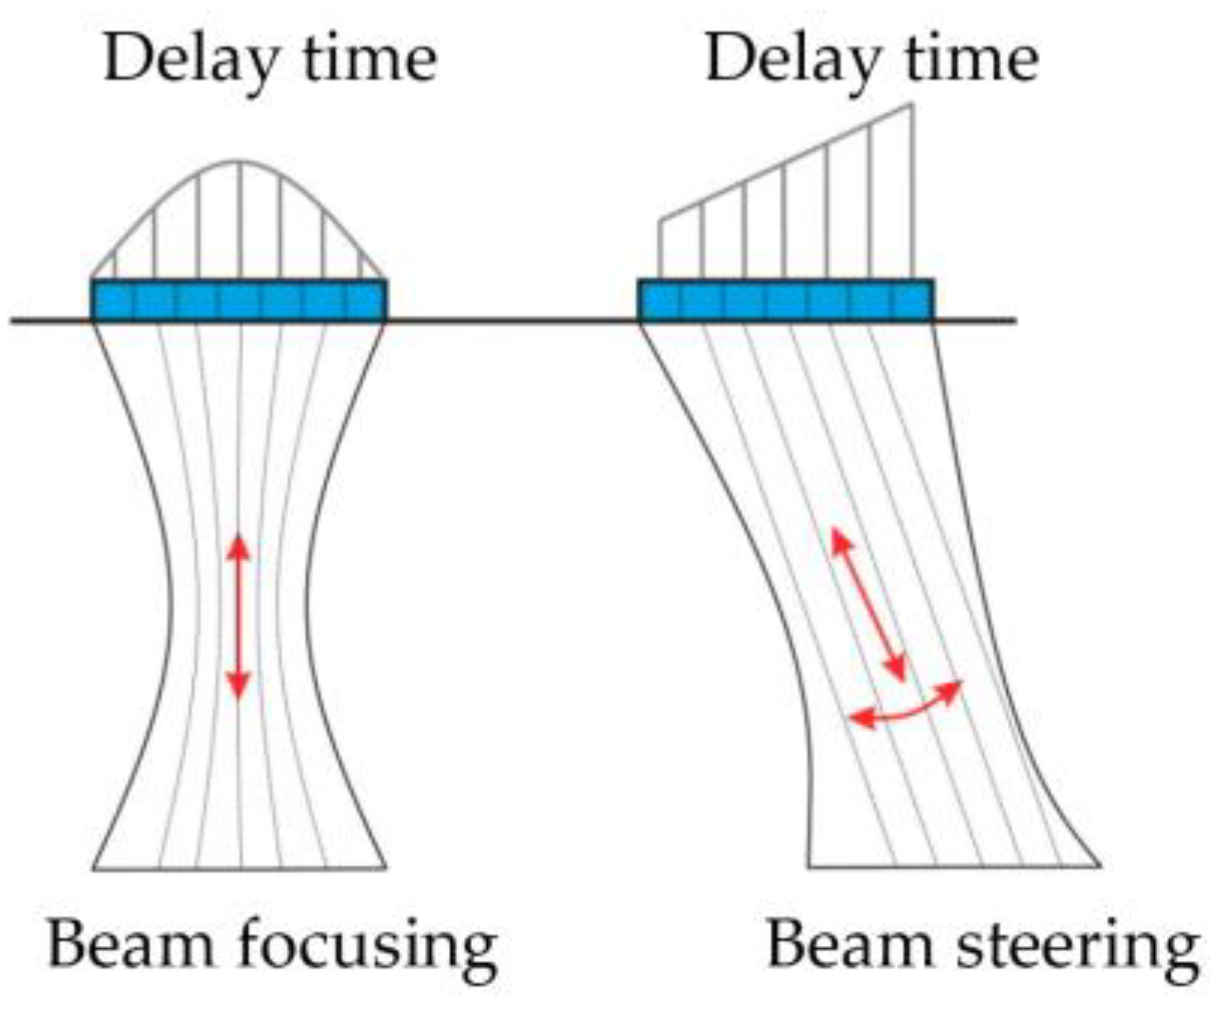
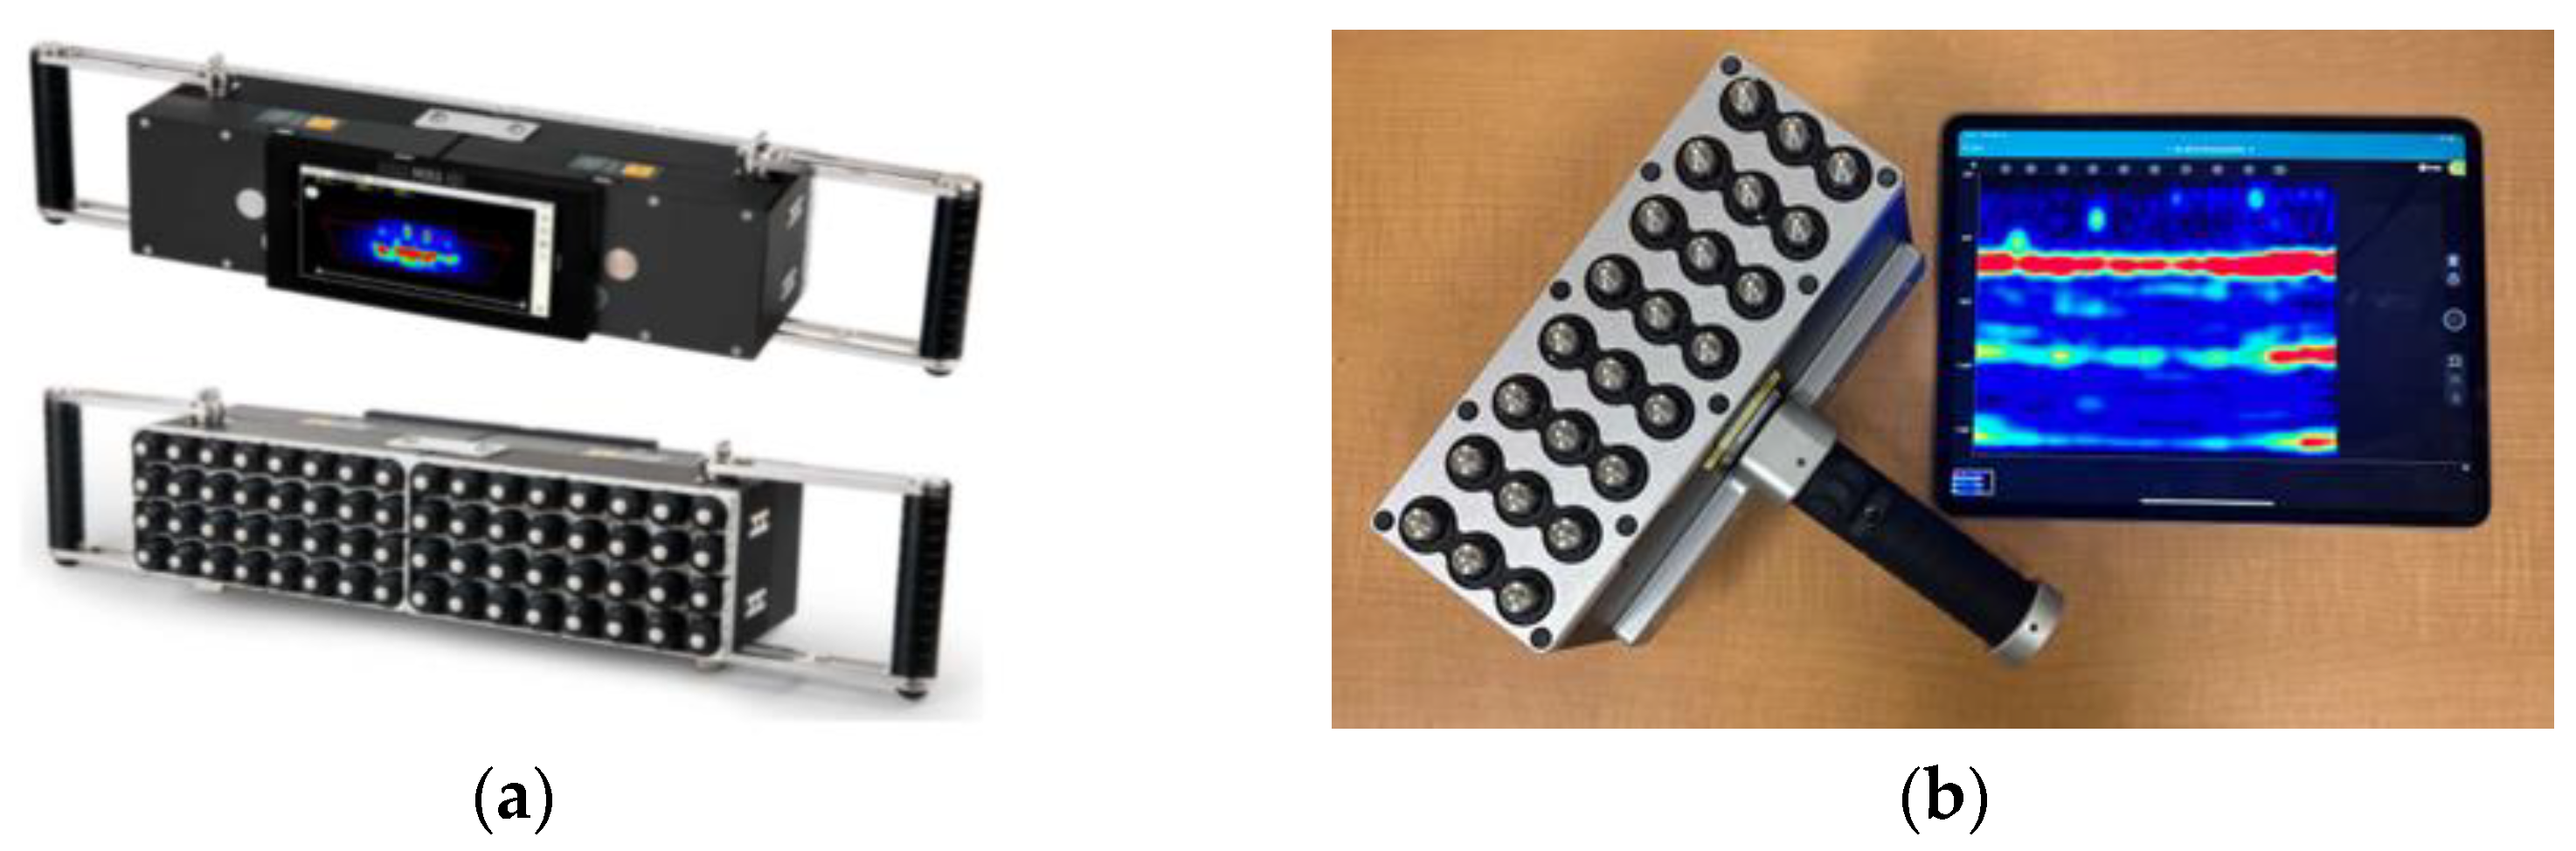
2.2. PAU Tests
| PAU Systems | Number of Channels | Technology | Transducer | Bandwidth | Depth Range | Manufacturer |
|---|---|---|---|---|---|---|
| A1040 MIRA 3D | 8 × 4 (extendable to 16 × 4, 24 × 4, etc.) | Multi-channel ultrasonic pulse echo tomograph | Active dry point contact (A-DPC) transducers | 10–100 KHz | 6.5 ft (2 m) | ACS-Solutions GmbH, Germany |
| Pundit live array pro | 8 × 3 (with upgrade option to 16 × 3) | Phased array ultrasonic pulse echo | Dry-contact Pundit Array transducer | 15–100 KHz | 6.6 ft (2 m) | Screening Eagle Technologies, Switzerland |
3. Results
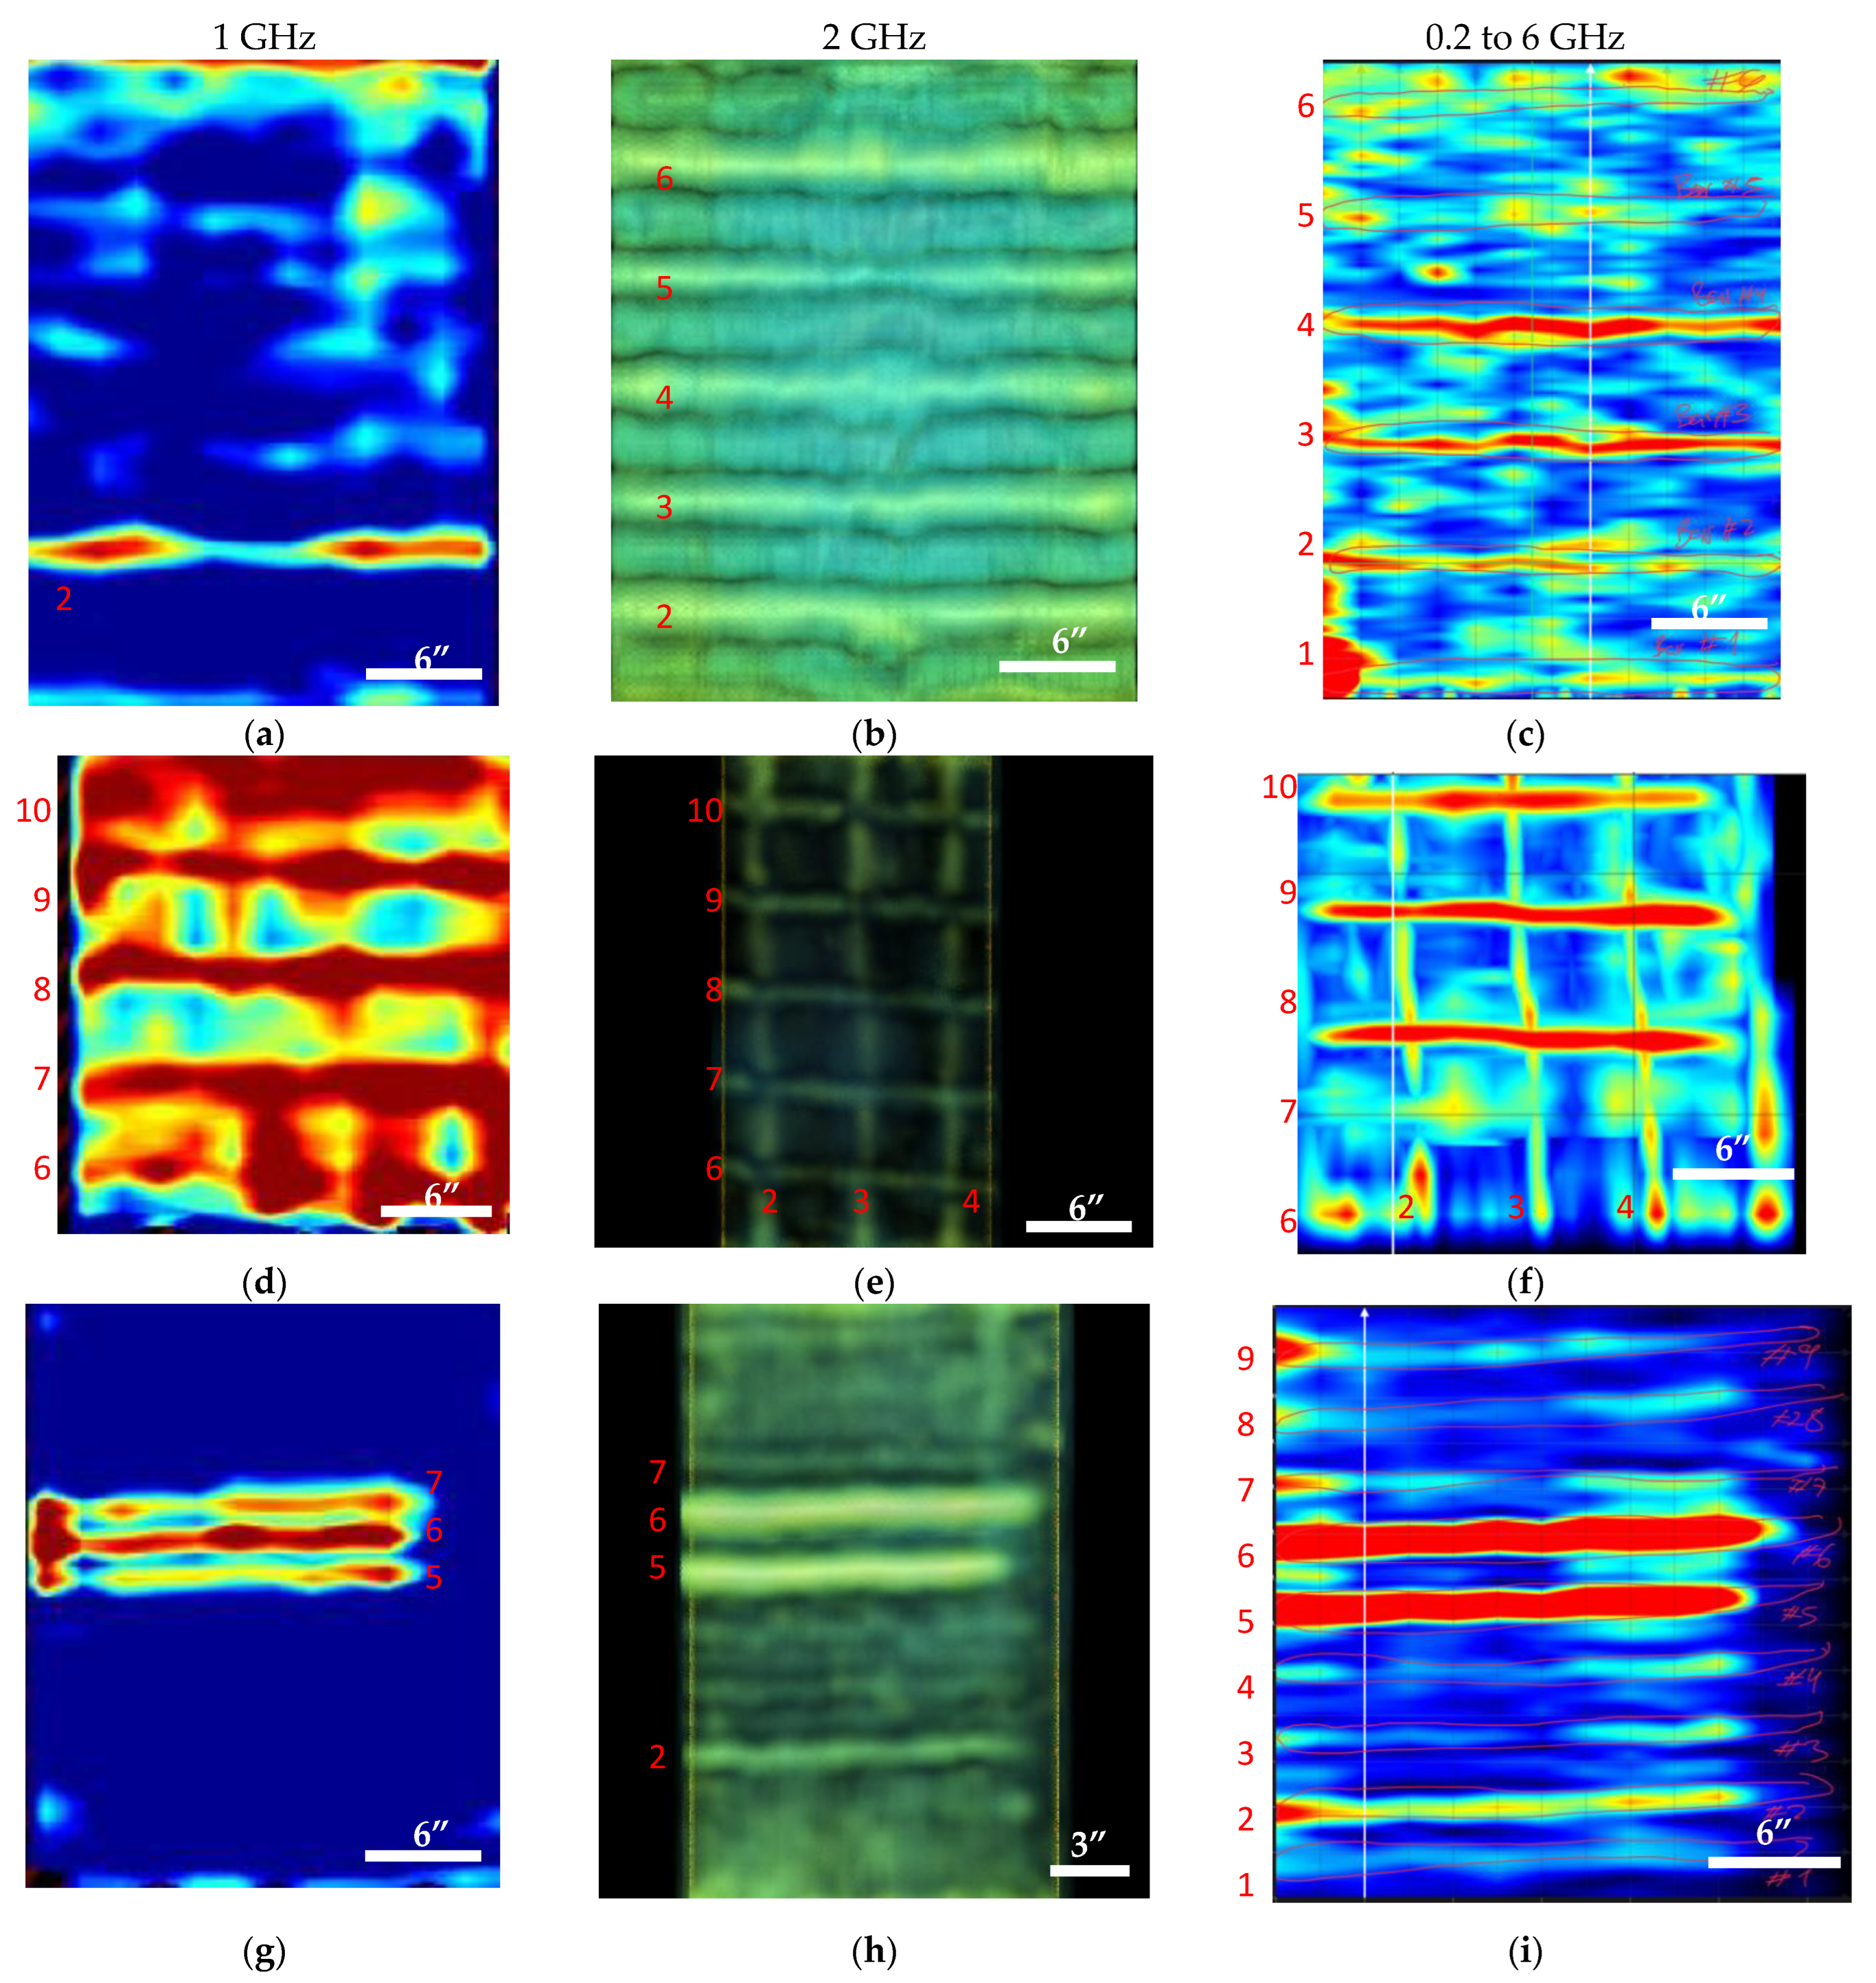
3.1. GPR Tests Results
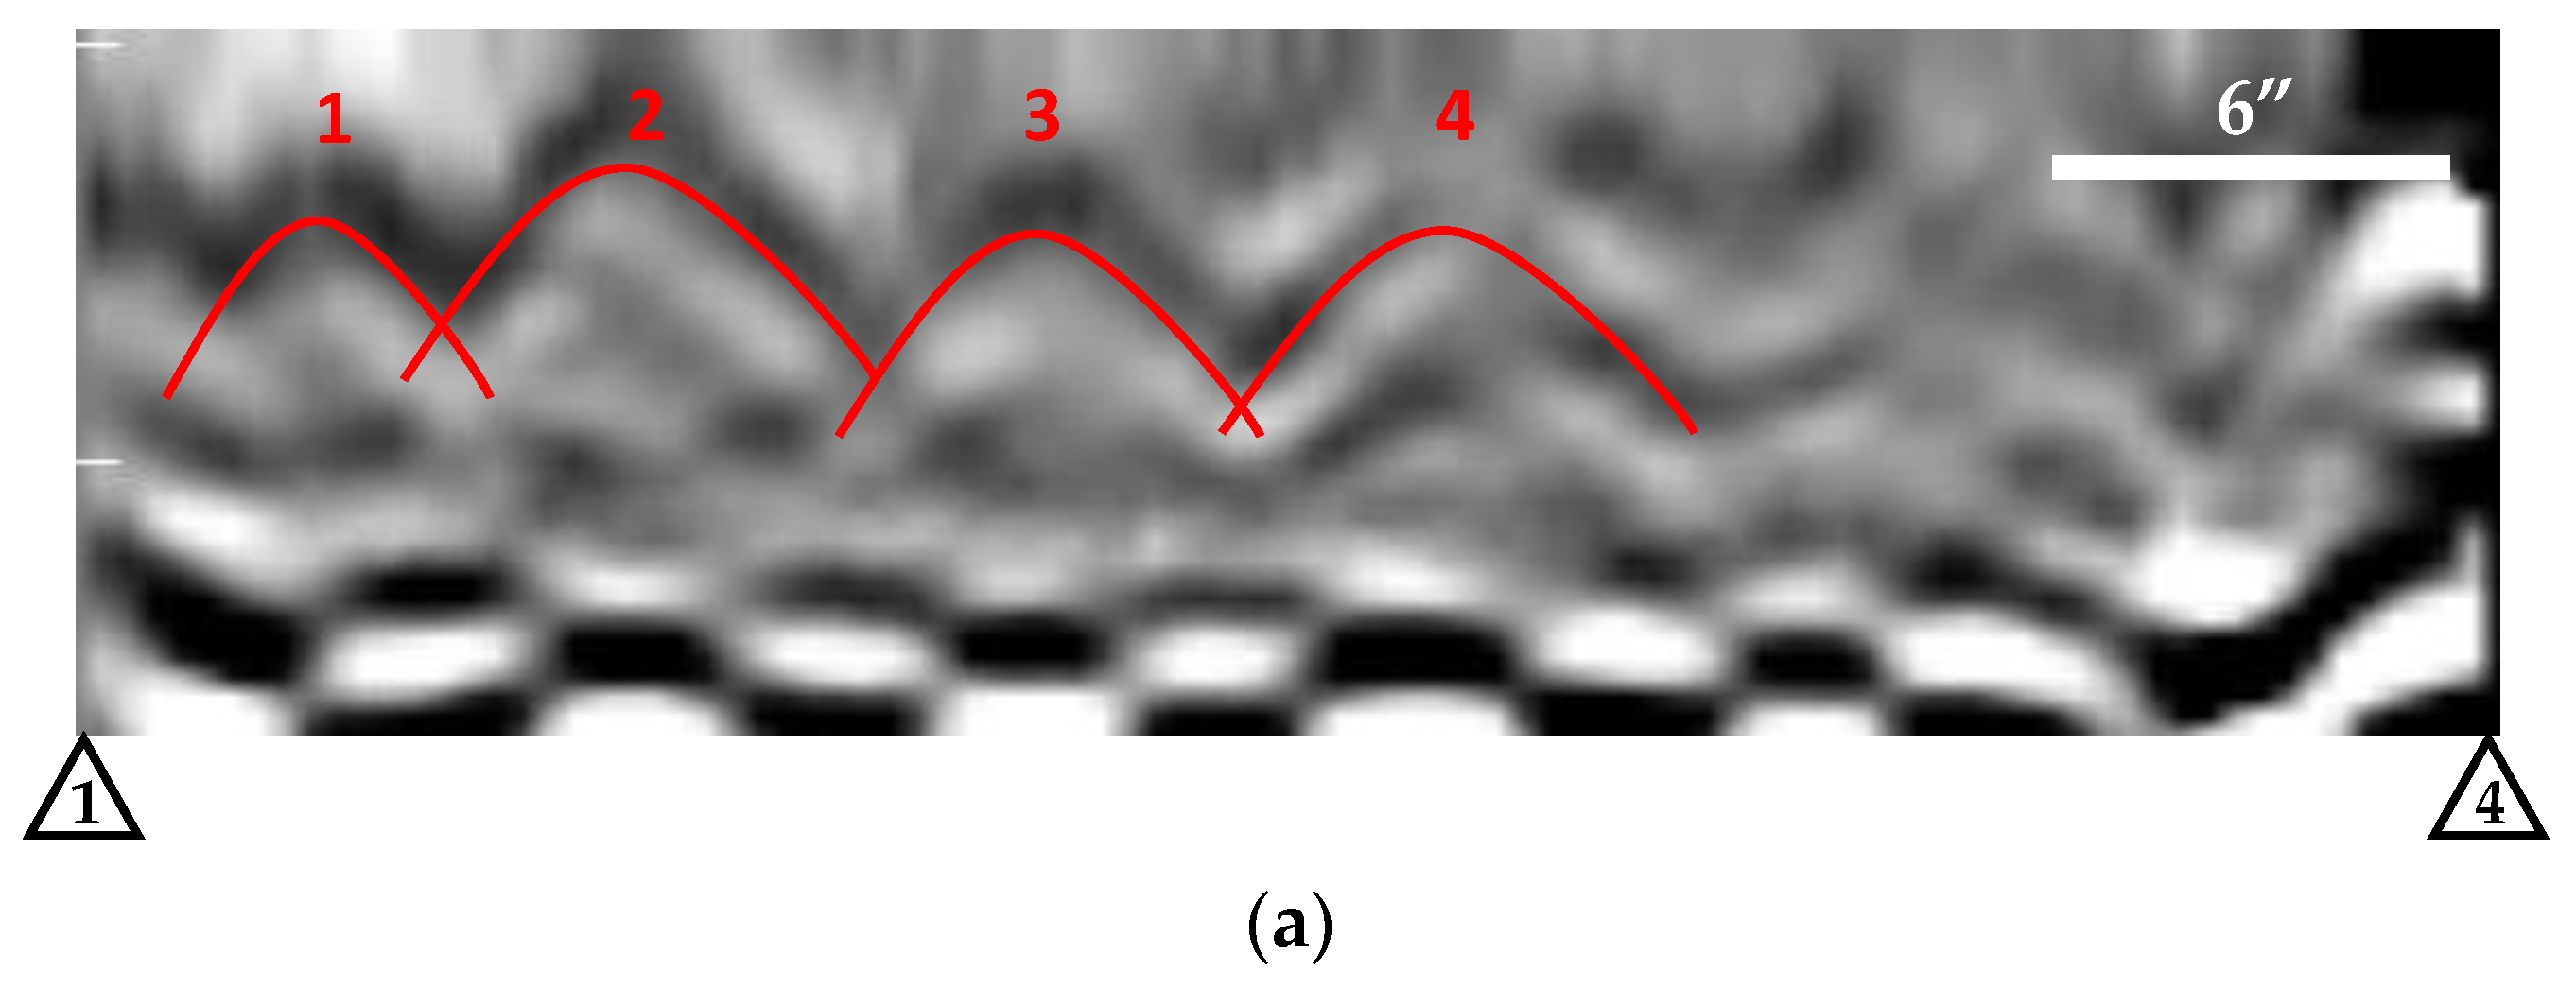
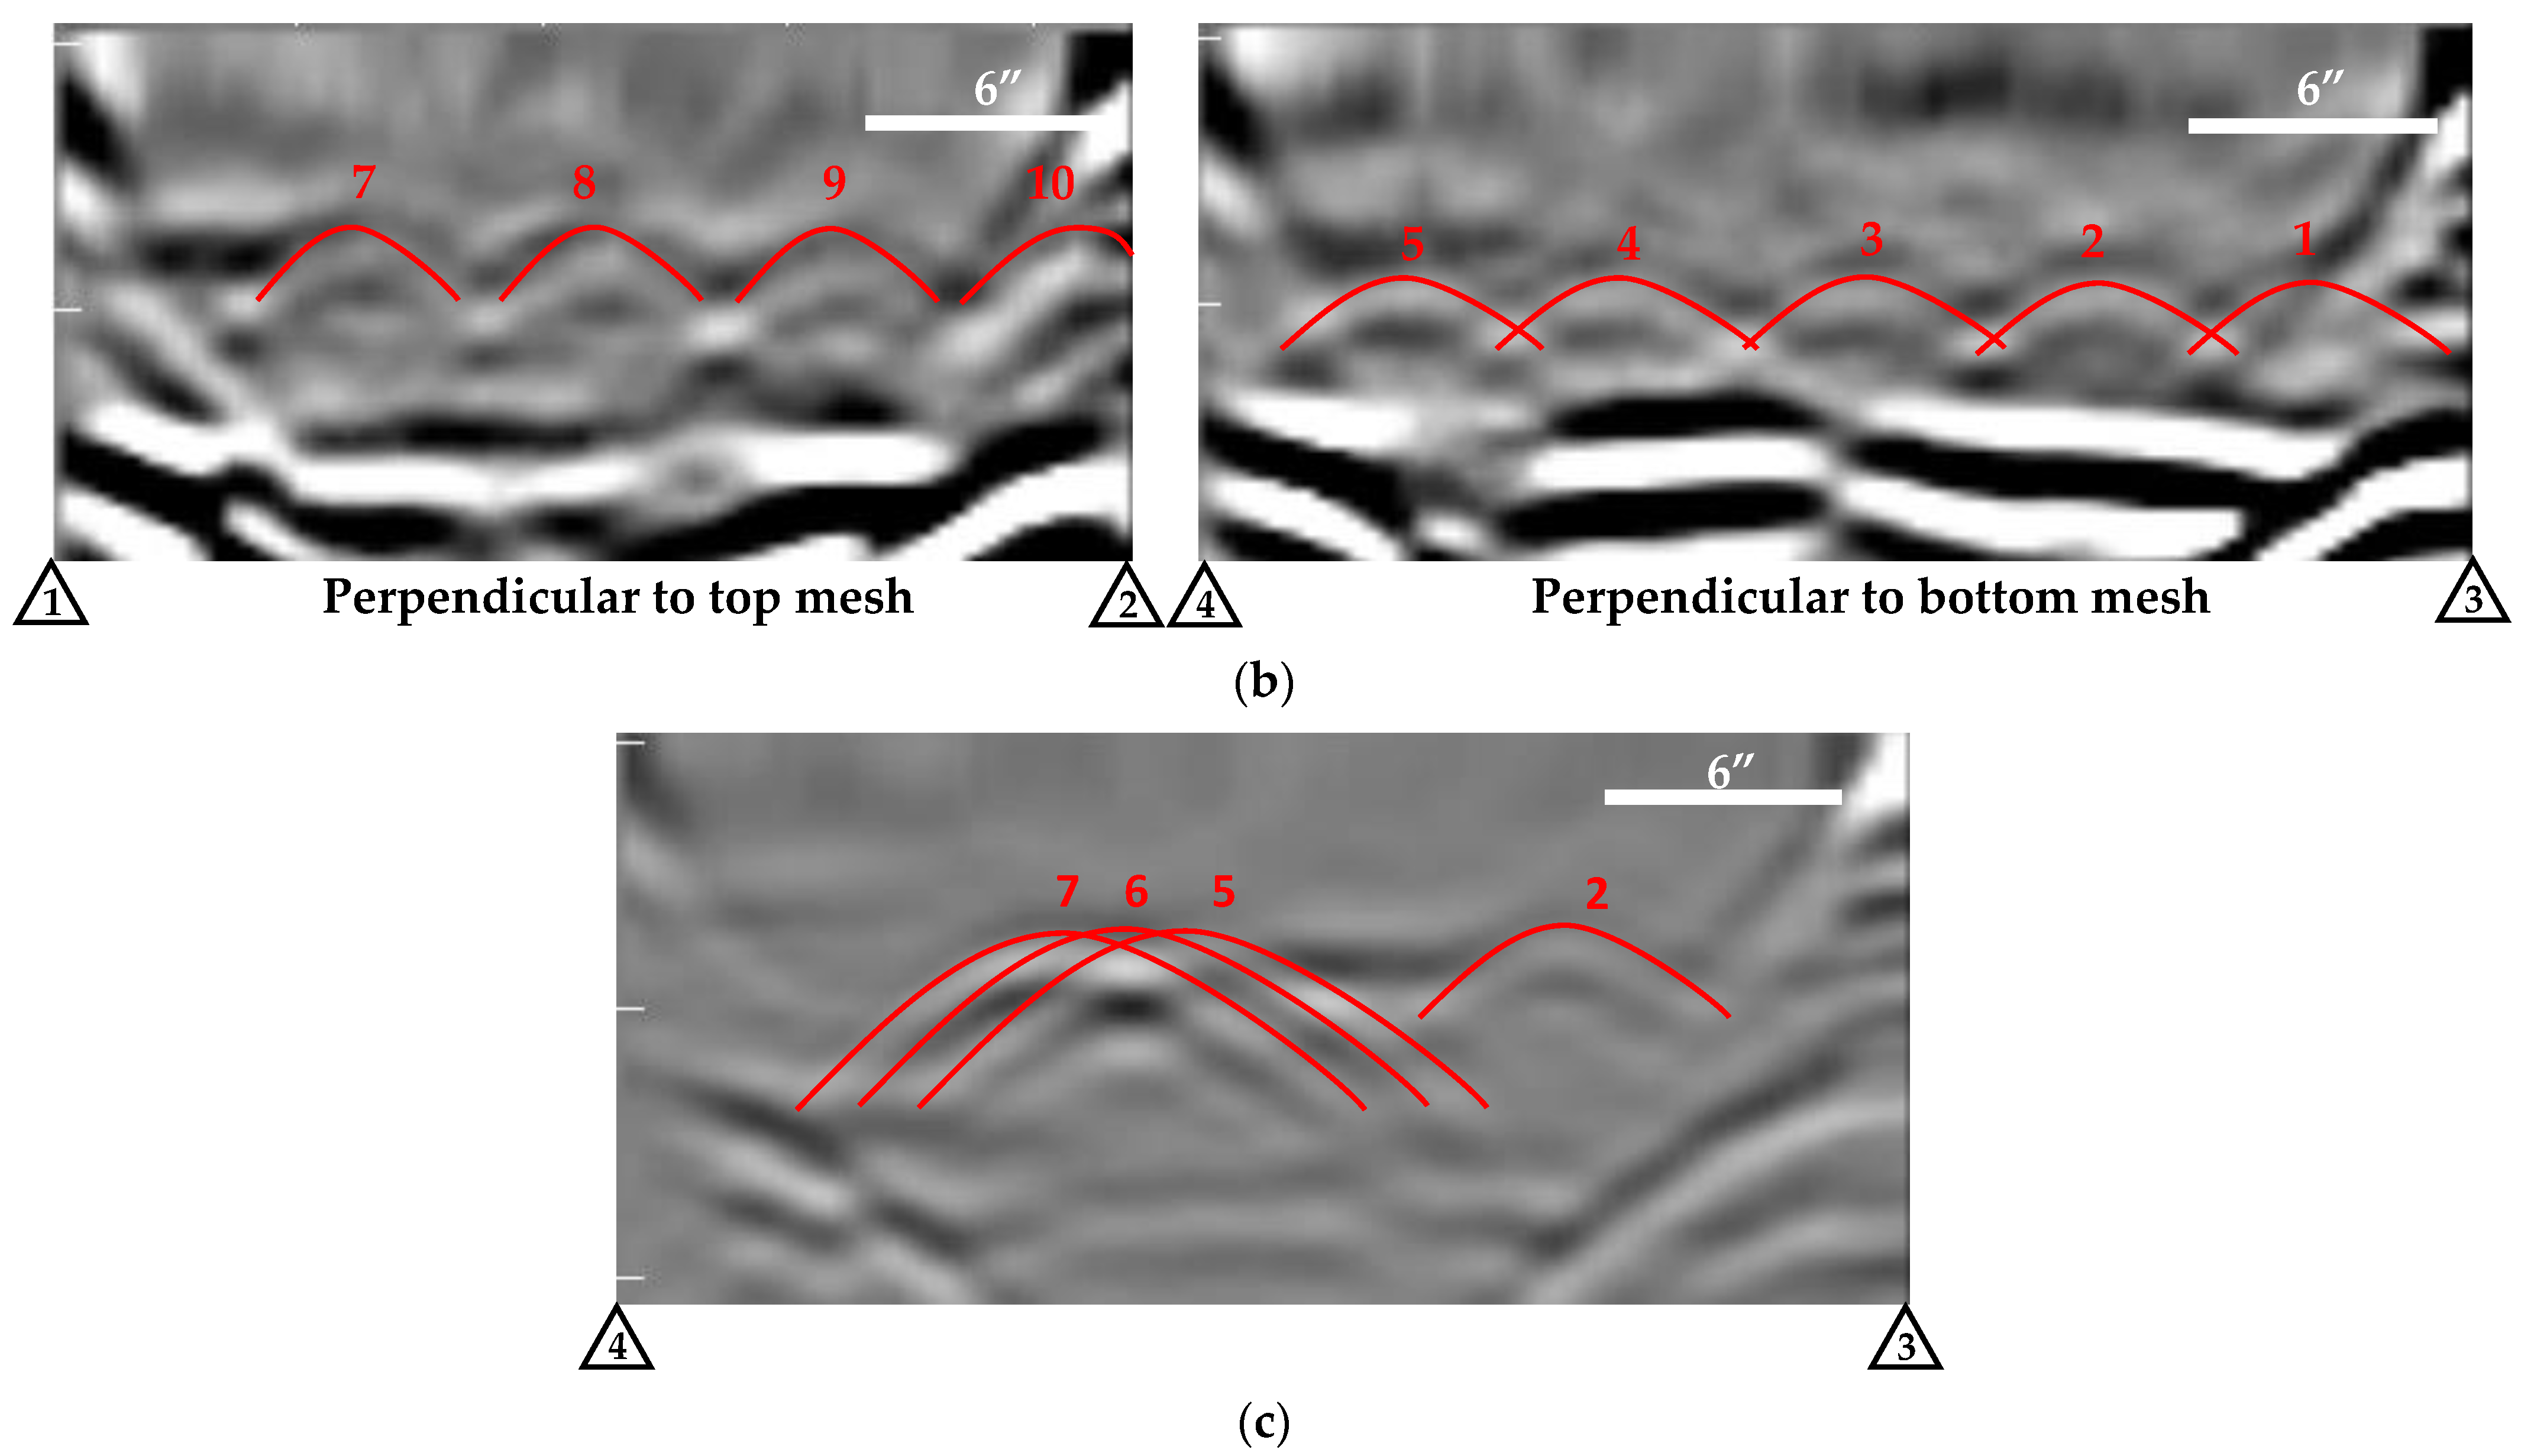
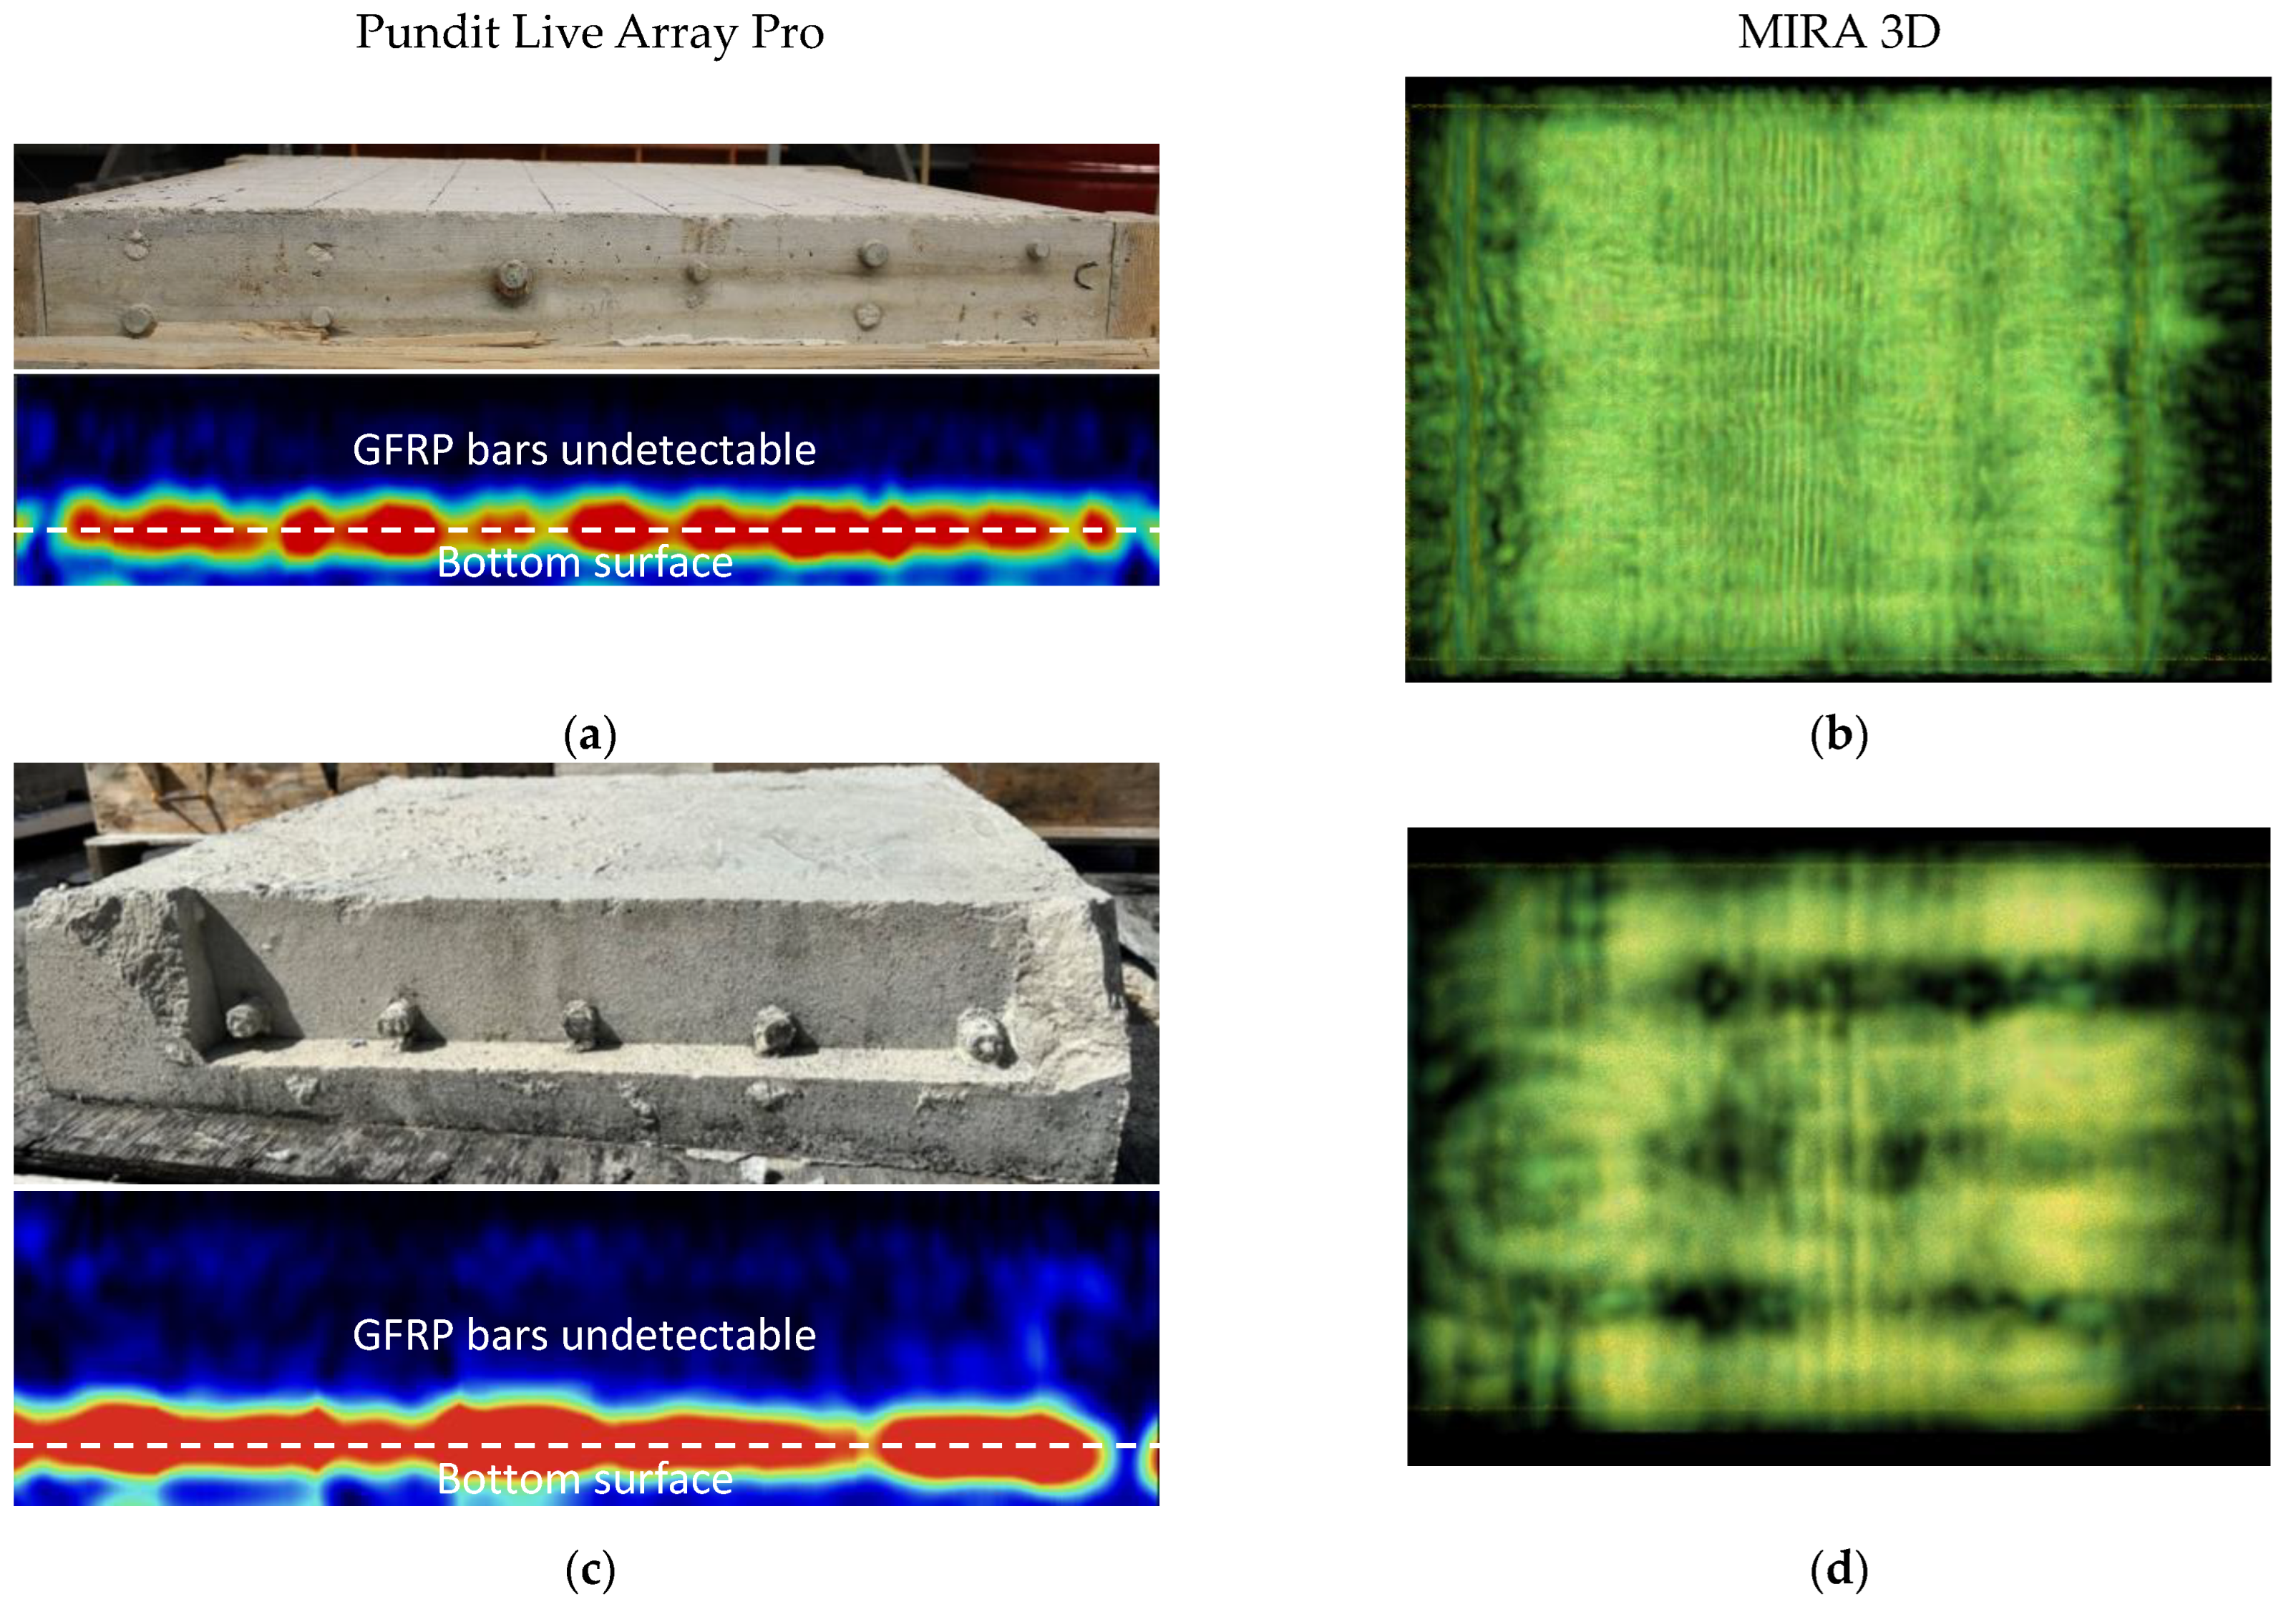
3.2. PAU Tests Results
4. Discussion
5. Summary and Conclusions
Author Contributions
Funding
Institutional Review Board Statement
Informed Consent Statement
Data Availability Statement
Acknowledgments
Conflicts of Interest
References
- Wang, W. Durability Behavior of Fiber Reinforced Polymer and Steel Reinforced Polymer for Infrastructure Applications; Missouri University of Science and Technology: Rolla, MO, USA, 2017. [Google Scholar]
- Benmokrane, B.; El-Salakawy, E.; El-Ragaby, A.; Lackey, T. Designing and Testing of a Concrete Bridge Deck Reinforced with Glass FRP Bars. J. Bridg. Eng. 2006, 11, 217–229. [Google Scholar] [CrossRef] [Green Version]
- Khedmatgozar Dolati, S.S.; Mehrabi, A. NSM FRP Pile-Splice System for Prestressed Precast Concrete Piles. Pract. Period. Struct. Des. Constr. 2022, 27, 4022046. [Google Scholar] [CrossRef]
- Dolati, S.S.K.; Mehrabi, A. FRP Sheet/Jacket System as an Alternative Method for Splicing Prestressed-Precast Concrete Piles. Case Stud. Constr. Mater. 2022, 16, e00912. [Google Scholar]
- Mehrabi, A.; Khedmatgozar Dolati, S.S. NSMB Pile Splice System for Precast Concrete Piles. U.S. Patent 11,319,689, 3 May 2022. [Google Scholar]
- Khedmatgozar Dolati, S.S.; Mehrabi, A. FRP Splice System for Joining Structural Elements. U.S. Patent 11,319,706, 3 May 2022. [Google Scholar]
- Mohamed, H.M.; Benmokrane, B. Design and Performance of Reinforced Concrete Water Chlorination Tank Totally Reinforced with GFRP Bars: Case Study. J. Compos. Constr. 2014, 18, 1–11. [Google Scholar] [CrossRef] [Green Version]
- Benmokrane, B.; Mohamed, H.M.; Mousa, S.; Elsafty, A.; Nolan, S. Design, Construction, Testing, and Behavior of Driven Precast Concrete Piles Reinforced with GFRP Bars and Spirals. J. Bridg. Eng. 2021, 26, 1–13. [Google Scholar] [CrossRef]
- Yazdani, N.; Garcia, E.C.; Riad, M. Field Assessment of Concrete Structures Rehabilitated with FRP; Elsevier Ltd.: Amsterdam, The Netherlands, 2018; ISBN 9780081021811. [Google Scholar]
- Dolati, S.S.K.; Matamoros, A.; Ghannoum, W. Evaluating the Effects of Loading Protocol on the Strength and Deformation Capacity of Flexure-Shear Critical Concrete Columns. Eng. Struct. 2023, 279, 115592. [Google Scholar] [CrossRef]
- Javed, A.; Krishna, C.; Ali, K.; Afzal, M.F.U.D.; Mehrabi, A.; Meguro, K. Micro-Scale Experimental Approach for the Seismic Performance Evaluation of RC Frames with Improper Lap Splices. Infrastructures 2023, 8, 56. [Google Scholar] [CrossRef]
- Malnati, P. A Hidden Revolution: FRP Rebar Gains New Strength. Compos. Technol. 2011, 17, 6. [Google Scholar]
- Mirmiran, A.; Wei, Y. Damage Assessment of FRP-Encased Concrete Using Ultrasonic Pulse Velocity. J. Eng. Mech. 2001, 127, 126–135. [Google Scholar] [CrossRef]
- Ghaib, M. Detection and Localization of Damage in Fiber Reinforced Polymer Bars Using Acoustic Emission, Micro Computed Tomography, and Scanning Electron Microscopy Techniques. Ph.D. Thesis, University of Manitoba, Winnipeg, MB, Canada, 2018. [Google Scholar]
- Telang, N.M.; Dumlao, C.; Mehrabi, A.B.; Ciolko, A.T.; Gutierrez, J. NCHRP Report 564: Field Inspection of In-Service FRP Bridge Decks. Transp. Res. Board 2006, 564, 175. [Google Scholar] [CrossRef]
- Khedmatgozar Dolati, S.S.; Malla, P.; Ortiz, J.D.; Mehrabi, A.; Nanni, A. Non-Destructive Testing Applications for in-Service FRP Reinforced/Strengthened Concrete Bridge Elements. In Nondestructive Characterization and Monitoring of Advanced Materials, Aerospace, Civil Infrastructure, and Transportation XVI; SPIE: Bellingham, WA, USA, 2022; Volume 12047, pp. 59–74. [Google Scholar]
- Ortiz, J.D.; Khedmatgozar Dolati, S.S.; Malla, P.; Nanni, A.; Mehrabi, A. FRP-Reinforced/Strengthened Concrete: State-of-the-Art Review on Durability and Mechanical Effects. Materials 2023, 16, 1990. [Google Scholar] [CrossRef]
- Kim, Y.J. Use of Fiber-Reinforced Polymers in Highway Infrastructure; National Academics: Washington, DC, USA, 2017; ISBN 9780309390040. [Google Scholar]
- Karbhari, V.M.; Chin, J.W.; Hunston, D.; Benmokrane, B.; Juska, T.; Morgan, R.; Lesko, J.J.; Sorathia, U.; Reynaud, D. Durability Gap Analysis for Fiber-Reinforced Polymer Composites in Civil Infrastructure. J. Compos. Constr. 2003, 7, 238–247. [Google Scholar] [CrossRef] [Green Version]
- Mohammedameen, A.; Gülşan, M.E.; Alzeebaree, R.; Çevik, A.; Niş, A. Mechanical and Durability Performance of FRP Confined and Unconfined Strain Hardening Cementitious Composites Exposed to Sulfate Attack. Constr. Build. Mater. 2019, 207, 158–173. [Google Scholar] [CrossRef]
- Benmokrane, B.; El-Salakawy, E.; El-Ragaby, A.; El-Gamal, S. Performance Evaluation of Innovative Concrete Bridge Deck Slabs Reinforced with Fibre-Reinforced-Polymer Bars. Can. J. Civ. Eng. 2007, 34, 298–310. [Google Scholar] [CrossRef]
- Ettouney, S.; Alampalli, M. Infrastructure Health in Civil Engineering; National Academics: Washington, DC, USA, 2011; ISBN 9781439866542. [Google Scholar]
- Khanal, S. Review of Modern Nondestructive Testing Techniques for Civil Infrastructure; West Virginia University: Morgantown, WV, USA, 2020. [Google Scholar]
- Wheeler, A.S. Nondestructive Evaluation of Concrete Bridge Columns Rehabilitiated with Fiber Reinforced Polymers Using Digital Tap Hammer and Infrared Thermography Nondestructive Evaluation of Concrete Bridge Columns; West Virginia University: Morgantown, WV, USA, 2018. [Google Scholar]
- Halabe, U.B.; Joshi, R.M.; Gangarao, H.V.S. Nondestructive Testing of FRP Composite Structural Components and FRP Rehabilitated Bridge Using Digital Tap Testing. J. Multidiscip. Eng. Sci. Technol. 2020, 7, 11477–11482. [Google Scholar]
- Taillade, F.; Quiertant, M.; Benzarti, K.; Dumoulin, J.; Aubagnac, C. Nondestructive Evaluation of FRP Strengthening Systems Bonded on RC Structures Using Pulsed Stimulated Infrared Thermography. In Infrared Thermography; IntechOpen: London, UK, 2012; Chapter 9; pp. 193–208. [Google Scholar]
- Ekenel, M.; Myers, J.J. Nondestructive Evaluation of RC Structures Strengthened with FRP Laminates Containing Near-Surface Defects in the Form of Delaminations. Sci. Eng. Compos. Mater. 2007, 14, 299–315. [Google Scholar] [CrossRef]
- Hsieh, C.T.; Lin, Y. Detecting Debonding Flaws at the Epoxy-Concrete Interfaces in near-Surface Mounted CFRP Strengthening Beams Using the Impact-Echo Method. NDT E Int. 2016, 83, 1–13. [Google Scholar] [CrossRef]
- Crawford, K.C. Non-Destructive Testing of FRP-Structural Systems Applied to Concrete Bridges. In Nondestructive Testing of Materials and Structures; Springer: Dordrecht, The Netherlands, 2013; pp. 835–840. [Google Scholar]
- Crawford, K.C. NDT Evaluation of Long-Term Bond Durability of CFRP-Structural Systems Applied to RC Highway Bridges. Int. J. Adv. Struct. Eng. 2016, 8, 161–168. [Google Scholar] [CrossRef] [Green Version]
- ACI Committee 228; ACI 228.2R-13: Report on Nondestructive Test Methods for Evaluation of Concrete in Structures. ACI: Farmington Hills, MI, USA, 2013.
- Dong, Y.; Ansari, F. Non-Destructive Testing and Evaluation (NDT/NDE) of Civil Structures Rehabilitated Using Fiber Reinforced Polymer (FRP) Composites. Serv. Life Estim. Ext. Civ. Eng. Struct. 2011, 1, 193–222. [Google Scholar] [CrossRef]
- Gower, M.; Lodeiro, M.; Aktas, A.; Shaw, R.; Maierhofer, C.; Krankenhagen, R.; Augustin, S.; Rollig, M.; Knazovicka, L.; Blahut, A.; et al. Design and Manufacture of Reference and Natural Defect Artefacts for the Evaluation of NDE Techniques for Fibre Reinforced Plastic (FRP) Composites in Energy Applications. In Proceedings of the 19th World Conference on Non-Destructive Testing, Munich, Germany, 13–17 June 2016. [Google Scholar]
- Aboukhousa, M.; Qaddoumi, N. Near-Field Microwave Imaging of Subsurface Inclusions in Laminated Composite Structures. In Proceedings of the 16th World Conference on Nondestructive Testing, Montreal, QC, Canada, 30 August–3 September 2004. [Google Scholar]
- Kharkovsky, S.; Ryley, A.C.; Stephen, V.; Zoughi, R. Dual-Polarized near-Field Microwave Reflectometer for Noninvasive Inspection of Carbon Fiber Reinforced Polymer-Strengthened Structures. IEEE Trans. Instrum. Meas. 2008, 57, 168–175. [Google Scholar] [CrossRef] [Green Version]
- Navagato, M.D.; Narayanan, R.M. Microwave Imaging of Multilayered Structures Using Ultrawideband Noise Signals. NDT E Int. 2019, 104, 19–33. [Google Scholar] [CrossRef]
- Ekenel, M.; Stephen, V.; Myers, J.J.; Zoughi, R. Microwave NDE of Reinforced Concrete Beams Strengthened with CFRP Laminates Containing Surface Defects and Tested under Cyclic Loading. In Proceedings of the 16th World Conference on Nondestructive Testing, Montreal, QC, Canada, 30 August–3 September 2004. [Google Scholar]
- Akuthota, B.; Hughes, D.; Zoughi, R.; Myers, J.; Nanni, A. Near-Field Microwave Detection of Disbond in Carbon Fiber Reinforced Polymer Composites Used for Strengthening Cement-Based Structures and Disbond Repair Verification. J. Mater. Civ. Eng. 2004, 16, 540–546. [Google Scholar] [CrossRef]
- Dutta, S.S. Nondestructive Evaluation of FRP Wrapped Concrete Cylinders Using Infrared Thermography and Groud Penetrating Radar. Master of Science Thesis, West Virginia University, Morgantown, WV, USA, 2006. [Google Scholar]
- Jackson, D.; Islam, M.; Alampalli, S. Feasibility of Evaluating the Performance of Fiber Reinforced Plastic (FRP) Wrapped Reinforced Concrete Columns Using Ground Penetrating RADAR (GPR) and Infrared (IR) Thermography Techniques. In Structural Materials Technology IV—An NDT Conference; CRC Press: Boca Raton, FL, USA, 2000; pp. 390–395. [Google Scholar]
- Hing, C.L.C.; Halabe, U.B. Nondestructive Testing of GFRP Bridge Decks Using Ground Penetrating Radar and Infrared Thermography. J. Bridg. Eng. 2010, 15, 391–398. [Google Scholar] [CrossRef]
- Yazdani, N.; Beneberu, E.; Riad, M. Nondestructive Evaluation of FRP-Concrete Interface Bond Due to Surface Defects. Adv. Civ. Eng. 2019, 2019, 2563079. [Google Scholar] [CrossRef]
- Büyüköztürk, O.; Yu, T.Y. Far-Field Radar NDT Technique for Detecting GFRP Debonding from Concrete. Constr. Build. Mater. 2009, 23, 1678–1689. [Google Scholar] [CrossRef]
- Sen, R. Developments in the Durability of FRP-Concrete Bond. Constr. Build. Mater. 2015, 78, 112–125. [Google Scholar] [CrossRef]
- Riad, M.; Yazdani, N.; Almomani, Y.; Gonzalez, E. Utilization of Ground Penetrating Radar (GPR) in the Non-Destructive Assessment of FRP Laminate-Concrete Bond Strength. In Advances and Challenges in Structural Engineering, Proceedings of the International Congress and Exhibition “Sustainable Civil Infrastructures”, Cairo, Egypt, 10–19 November 2019; Springer Science and Business Media: Berlin, Germany, 2019; pp. 244–267. [Google Scholar]
- Jaishankar, P.; Kanchidurai, S.; Thomas, A.C.; Mohan, K.S.R. Experimental Investigation on Non-Destructive Behaviour of Repaired FRP Concrete Beams. Mater. Today Proc. 2022, 64, 990–994. [Google Scholar] [CrossRef]
- Liu, Z.; Gu, X.; Chen, J.; Wang, D.; Chen, Y.; Wang, L. Automatic Recognition of Pavement Cracks from Combined GPR B-Scan and C-Scan Images Using Multiscale Feature Fusion Deep Neural Networks. Autom. Constr. 2023, 146, 104698. [Google Scholar] [CrossRef]
- La Malfa Ribolla, E.; Hajidehi, M.R.; Rizzo, P.; Scimemi, G.F.; Spada, A.; Giambanco, G. Ultrasonic Inspection for the Detection of Debonding in CFRP-Reinforced Concrete. Struct. Infrastruct. Eng. 2017, 14, 807–816. [Google Scholar] [CrossRef]
- Concu, G.; Trulli, N. Direct and Semi-Direct Ultrasonic Testing for Quality Control of FRC-Concrete Adhesion. Structures 2021, 32, 54–64. [Google Scholar] [CrossRef]
- Gunes, O. Failure Modes in Structural Applications of Fiber-Reinforced Polymer (FRP) Composites and Their Prevention. In Developments in Fiber-Reinforced Polymer (FRP) Composites for Civil Engineering; Woodhead Publishing Series in Civil and Structural Engineering; Woodhead Publishing: Sawston, UK, 2013; ISBN 9781845691455. [Google Scholar]
- Ribolla, E.L.M.; Hajidehi, M.R.; Scimemi, G.F.; Spada, A.; Giambanco, G. Assessment of Bonding Defects in FRP Reinforced Structures via Ultrasonic Technique. Chall. J. Struct. Mech. 2016, 2, 3. [Google Scholar] [CrossRef] [Green Version]
- Ray, B.C.; Hasan, S.T.; Clegg, D.W. Evaluation of Defects in FRP Composites by NDT Techniques. J. Reinf. Plast. Compos. 2007, 26, 1187–1192. [Google Scholar] [CrossRef]
- Taheri, H.; Hassen, A.A. Nondestructive Ultrasonic Inspection of Composite Materials: A Comparative Advantage of Phased Array Ultrasonic. Appl. Sci. 2019, 9, 1628. [Google Scholar] [CrossRef] [Green Version]
- Boychuk, A.S.; Generalov, A.S.; Stepanov, A.V. Nondestructive Testing of FRP by Using Phased Array Ultrasonic Technology. In Proceedings of the ICNDT 2013: 12th International NDT Conference—Application of Contemporary Non-Destructive Testing in Engineering, Portorož, Slovenia, 4–6 September 2013; pp. 51–55. [Google Scholar]
- Meola, C.; Boccardi, S.; Carlomagno, G.M.; Boffa, N.D.; Monaco, E.; Ricci, F. Nondestructive Evaluation of Carbon Fibre Reinforced Composites with Infrared Thermography and Ultrasonics. Compos. Struct. 2015, 134, 845–853. [Google Scholar] [CrossRef]
- Wen, B.; Zhou, Z.; Zeng, B.; Yang, C.; Fang, D.; Xu, Q.; Shao, Y.; Wan, C. Pulse-Heating Infrared Thermography Inspection of Bonding Defects on Carbon Fiber Reinforced Polymer Composites. Sci. Prog. 2020, 103, 36850420950131. [Google Scholar] [CrossRef]
- Caldeira, M.M.; Padaratz, I.J. Potentialities of Infrared Thermography to Assess Damage in Bonding between Concrete and GFRP. Rev. IBRACON Estrut. Mater. 2015, 8, 296–322. [Google Scholar] [CrossRef] [Green Version]
- Brown, J.R.; Chittineni, S.H. Comparison of Lock-in and Pulse-Phase Thermography for Defect Characterization in FRP Composites Applied to Concrete. Therm. Infrared Appl. XXXVII 2015, 9485, 94850B. [Google Scholar] [CrossRef] [Green Version]
- Milovanović, B.; Banjad Pečur, I. Review of Active IR Thermography for Detection and Characterization of Defects in Reinforced Concrete. J. Imaging 2016, 2, 11. [Google Scholar] [CrossRef]
- Riad, M. Quantitative Non-Destructive Evaluation (NDE) of FRP Laminate-Concrete Bond Strength. Ph.D. Thesis, The University of Texas at Arlington, Arlington, TX, USA, 2017. [Google Scholar]
- Tashan, J.; Al-Mahaidi, R.; Mamkak, A. Defect Size Measurement and Far Distance Infrared Detection in CFRP-Concrete and CFRP-Steel Systems. Aust. J. Struct. Eng. 2016, 17, 2–13. [Google Scholar] [CrossRef] [Green Version]
- Mabry, N.J.; Peters, K.J.; Seracino, R. Depth Detection of Bond Defects in Multilayered Externally Bonded CFRP-to-Concrete Using Pulse Phase Thermography. J. Compos. Constr. 2015, 19, 04015002. [Google Scholar] [CrossRef]
- Gu, J.C.; Unjoh, S.; Naito, H. Detectability of Delamination Regions Using Infrared Thermography in Concrete Members Strengthened by CFRP Jacketing. Compos. Struct. 2020, 245, 112328. [Google Scholar] [CrossRef]
- Yumnam, M.; Gupta, H.; Ghosh, D.; Jaganathan, J. Inspection of Concrete Structures Externally Reinforced with FRP Composites Using Active Infrared Thermography: A Review. Constr. Build. Mater. 2021, 310, 125265. [Google Scholar] [CrossRef]
- Wang, B.; Zhong, S.; Lee, T.-L.; Fancey, K.S.; Mi, J. Non-Destructive Testing and Evaluation of Composite Materials/Structures: A State-of-the-Art Review. Adv. Mech. Eng. 2020, 12, 1687814020913761. [Google Scholar] [CrossRef] [Green Version]
- Carpinteri, A.; Lacidogna, G.; Paggi, M. Acoustic Emission Monitoring and Numerical Modeling of FRP Delamination in RC Beams with Non-Rectangular Cross-Section. Mater. Struct. Constr. 2007, 40, 553–566. [Google Scholar] [CrossRef]
- Degala, S.; Rizzo, P.; Ramanathan, K.; Harries, K.A. Acoustic Emission Monitoring of CFRP Reinforced Concrete Slabs. Constr. Build. Mater. 2009, 23, 2016–2026. [Google Scholar] [CrossRef]
- Saeedifar, M.; Fotouhi, M.; Ahmadi Najafabadi, M.; Hosseini Toudeshky, H.; Minak, G. Prediction of Quasi-Static Delamination Onset and Growth in Laminated Composites by Acoustic Emission. Compos. Part B Eng. 2016, 85, 113–122. [Google Scholar] [CrossRef]
- Taillade, F.; Quiertant, M.; Benzarti, K.; Aubagnac, C.; Moser, E. Non-Destructive Evaluation (NDE) of Composites: Using Shearography to Detect Bond Defects. In Non-Destructive Evaluation (NDE) of Polymer Matrix Composites; Woodhead Publishing Series in Composites Science and Engineering; Woodhead Publishing: Sawston, UK, 2013; pp. 542–556. [Google Scholar] [CrossRef]
- Yu, T.; Cheng, T.K.; Zhou, A.; Lau, D. Remote Defect Detection of FRP-Bonded Concrete System Using Acoustic-Laser and Imaging Radar Techniques. Constr. Build. Mater. 2016, 109, 146–155. [Google Scholar] [CrossRef]
- Qiu, Q.; Lau, D. Defect Detection of FRP-Bonded Civil Structures under Vehicle-Induced Airborne Noise. Mech. Syst. Signal Process. 2021, 146, 106992. [Google Scholar] [CrossRef]
- Qiu, Q.; Lau, D. A Novel Approach for Near-Surface Defect Detection in FRP-Bonded Concrete Systems Using Laser Reflection and Acoustic-Laser Techniques. Constr. Build. Mater. 2017, 141, 553–564. [Google Scholar] [CrossRef]
- Qiu, Q.; Lau, D. Experimental Evaluation on the Effectiveness of Acoustic-Laser Technique towards the FRP-Bonded Concrete System. In Structural Health Monitoring and Inspection of Advanced Materials, Aerospace, and Civil Infrastructure 2015, Proceedings of the SPIE Smart Structures and Materials + Nondestructive Evaluation and Health Monitoring, San Diego, CA, USA, 8–12 March 2015; SPIE: San Diego, CA, USA; Volume 9437, p. 943705. [CrossRef]
- Yang, L. Recent Developments in Digital Shearography for Nondestructive Testing. Mater. Eval. 2006, 64, 704–709. [Google Scholar]
- Choi, S.W.; Lee, J.H. Nondestructive Evaluation of Internal Defects for Composite Materials by Using Shearography. Key Eng. Mater. 2004, 270–273, 781–786. [Google Scholar] [CrossRef]
- Wan, B. Using Fiber-Reinforced Polymer (FRP) Composites in Bridge Construction and Monitoring Their Performance: An Overview; Woodhead Publishing: Sawston, UK, 2014; ISBN 9780857097019. [Google Scholar]
- Garney, G. Defects Found Through Non-Destructive Testing Methods of Fiber Reinforced Polymeric Composites; California State University: Fullerton, CA, USA; Ann Arbor, MI, USA, 2006. [Google Scholar]
- Weissenböck, J.; Reh, A.; Salaberger, D.; Heinzl, C.; Kastner, J. Advanced Visualization and Exploration Techniques for Fiber Reinforced Polymers. In Proceedings of the 11th European Conference on Non-Destructive Testing (ECNDT 2014), Prague, Czech Republic, 6–11 October 2014; pp. 1–10. [Google Scholar]
- Rodríguez-Hortalá, M.; Hatzmann, J.; Degischer, H.P. Structural Characterisation of Defects in CFRP Laminates Produced with Different Epoxy Resin Systems and Their Influence on the Mechanical Properties. In Proceedings of the ECCM 2012—Composites at Venice, 15th European Conference on Composite Materials, Tarrytown, NY, USA, 6–8 June 2012; pp. 24–28. [Google Scholar]
- Khosravani, M.R.; Reinicke, T. On the Use of X-Ray Computed Tomography in Assessment of 3D-Printed Components. J. Nondestruct. Eval. 2020, 39, 75. [Google Scholar] [CrossRef]
- Kim, S.Y.; Sesso, M.L.; Franks, G.V. In-Situ 4-Point Flexural Testing and Synchrotron Micro X-Ray Computed Tomography of 3D Printed Hierarchical-Porous Ultra-High Temperature Ceramic. Addit. Manuf. 2022, 54, 102728. [Google Scholar] [CrossRef]
- Karbhari, V.M.; Kaiser, H.; Navada, R.; Ghosh, K.; Lee, L. Methods for Detecting Defects in Composite Rehabilitated Concrete Structures; Oregon Department of Transportation: Salem, OR, USA; Federal Highway Administration: Washington, DC, USA, 2005. [Google Scholar]
- Alampalli, S. Field Performance of an FRP Slab Bridge. Compos. Struct. 2006, 72, 494–502. [Google Scholar] [CrossRef]
- Guan, H.; Karbhari, V.M.; Sikorsky, C.S. Long-Term Structural Health Monitoring System for a FRP Composite Highway Bridge Structure. J. Intell. Mater. Syst. Struct. 2007, 18, 809–823. [Google Scholar] [CrossRef]
- Hag-elsafi, O.; Kunin, J.; Alampalli, S.; Conway, T. Strengthening of Route 378 Bridge Over Wynantskill Creek In New York Using FRP Laminates; National Academies of Sciences, Engineering, and Medicine: Washington, DC, USA, 2001. [Google Scholar]
- Hag-elsafi, O.; Lund, R.; Alampalli, S. Strengthening of Church Street Bridge Pier Capbeam Using Bonded FRP Composite Plates: Strengthening and Load Testing; Transportation Research and Development Bureau: New York, NY, USA, 2002. [Google Scholar]
- Afzal, M.F.U.D.; Matsumoto, Y.; Nohmi, H.; Sakai, S.; Su, D.; Nagayama, T. Comparison of Radar Based Displacement Measurement Systems with Conventional Systems in Vibration Measurements at a Cable Stayed Bridge. In Proceedings of the 11th German-Japan Bridge Symposium, Osaka, Japan, 30–31 August 2016. [Google Scholar]
- Li, W.; Ho, S.C.M.; Patil, D.; Song, G. Acoustic Emission Monitoring and Finite Element Analysis of Debonding in Fiber-Reinforced Polymer Rebar Reinforced Concrete. Struct. Health Monit. 2017, 16, 674–681. [Google Scholar] [CrossRef]
- Xu, K.; Ren, C.; Deng, Q.; Jin, Q.; Chen, X. Real-Time Monitoring of Bond Slip between GFRP Bar and Concrete Structure Using Piezoceramic Transducer-Enabled Active Sensing. Sensors 2018, 18, 2653. [Google Scholar] [CrossRef] [Green Version]
- Sharma, G.; Sharma, S.; Sharma, S.K. Fracture Monitoring of Steel and GFRP Reinforced Concrete Beams Using Acoustic Emission and Digital Image Correlation Techniques. Struct. Concr. 2021, 22, 1962–1976. [Google Scholar] [CrossRef]
- Dolati, S.S.K.; Mehrabi, A.; Dolati, S.S.K.; Caluk, N. NDT Methods for Damage Detection in Steel Bridges. Proc. SPIE 2022, 12048, 385–394. [Google Scholar]
- Khedmatgozar Dolati, S.S.; Caluk, N.; Mehrabi, A.; Khedmatgozar Dolati, S.S. Non-Destructive Testing Applications for Steel Bridges. Appl. Sci. 2021, 11, 9757. [Google Scholar] [CrossRef]
- Drobiec, Ł.; Jasiński, R.; Mazur, W. The Use of Non-Destructive Methods to Detect Non-Metallic Reinforcement in Concrete and Masonry. Preprints 2019, 2019010021, Preprints. [Google Scholar] [CrossRef] [Green Version]
- ASTM C39; Standard Test Method for Compressive Strength of Cylindrical Concrete Specimens. ASTM: West Conshohocken, PA, USA, 2010.
- Hameed, A.; Rasool, A.M.; Ibrahim, Y.E.; Afzal, M.F.U.D.; Qazi, A.U.; Hameed, I. Utilization of Fly Ash as a Viscosity-Modifying Agent to Produce Cost-Effective, Self-Compacting Concrete: A Sustainable Solution. Sustainability 2022, 14, 1559. [Google Scholar] [CrossRef]
- ACI CODE-440.11-22; Building Code Requirements for Structural Concrete Reinforced with Glass Fiber-Reinforced Polymer (GFRP) Bars—Code and Commentary. ACI: Farmington Hills, MI, USA, 2022.
- Javed, A.; Sadeghnejad, A.; Rehmat, S.; Yakel, A.; Azizinamini, A. Magnetic Flux Leakage Method for Damage Detection in Internal Post-Tensioning Tendons; Florida Department of Transportation: Tallahassee, FL, USA, 2021; 166p. [Google Scholar]
- Tosti, F.; Ferrante, C. Using Ground Penetrating Radar Methods to Investigate Reinforced Concrete Structures; Springer: Dordrecht, The Netherlands, 2020; Volume 41, ISBN 0123456789. [Google Scholar]
- Liu, Z.; Yeoh, J.K.W.; Gu, X.; Dong, Q.; Chen, Y.; Wu, W.; Wang, L.; Wang, D. Automatic Pixel-Level Detection of Vertical Cracks in Asphalt Pavement Based on GPR Investigation and Improved Mask R-CNN. Autom. Constr. 2023, 146, 104689. [Google Scholar] [CrossRef]
- Capozzoli, L.; Rizzo, E. Combined NDT Techniques in Civil Engineering Applications: Laboratory and Real Test. Constr. Build. Mater. 2017, 154, 1139–1150. [Google Scholar] [CrossRef]
- Sensors and Software. Conquest 100 User’s Guide; Sensors and Software: Mississauga, ON, Canada, 2015. [Google Scholar]
- IDS Georadar. C-Thrue User Manual: All-in-One Ground Penetrating Radar (GPR) for Non-Destructive Testing of Concrete Structures User; IDS Georadar: Pisa, Italy, 2017. [Google Scholar]
- Screening Eagle. Sales Flyer: Proceq Ground Penetrating Radars GP8000; Screening Eagle: Austin, TX, USA, 2022. [Google Scholar]
- Screening Eagle. Sales Flyer: Proceq Ground Penetrating Radars GP8800; Screening Eagle: Austin, TX, USA, 2022. [Google Scholar]
- Chen, R.; Tran, K.T.; Dinh, K.; Ferraro, C.C. Evaluation of Ultrasonic SH-Waveform Tomography for Determining Cover Thickness and Rebar Size in Concrete Structures. J. Nondestruct. Eval. 2022, 41, 1–16. [Google Scholar] [CrossRef]
- Torres-González, M.; Mantero, J.; Hurtado, S.; Flores-Alés, V.; Alejandre, F.J.; Alducín-Ochoa, J.M. Characterization and Radioactive Evaluation of the Concrete from a Radiotherapy Bunker. Struct. Concr. 2022, 23, 3102–3113. [Google Scholar] [CrossRef]
- Park, S.; Kim, J.; Jeon, K.; Kim, J.; Park, S. Improvement of Gpr-Based Rebar Diameter Estimation Using Yolo-V3. Remote Sens. 2021, 13, 2011. [Google Scholar] [CrossRef]
- Shull, P.J. Nondestructive Evaluation Theory, Techniques, and Applications; Marcel Dekker, Inc.: New York, NY, USA, 2001; ISBN 0824788729. [Google Scholar]
- Boychuk, A.S.; Generalov, A.S.; Stepanov, A.V. CFRP Structural Health Monitoring by Ultrasonic Phased Array Technique. In Proceedings of the 7th European Workshop on Structural Health Monitoring. EWSHM 2014—2nd European Conference of the Prognostics and Health Management Society, Nantes, France, 8–11 July 2014; pp. 2206–2211. [Google Scholar]
- Ryan, T.W.; EricMann, J.; Chill, Z.M.; Ott, B.T. Bridge Inspector’s Reference Manual. Fhwa 2012, BIRM 1, 1020. [Google Scholar]
- Taheri, H.; Delfanian, F.; Du, J. Acoustic Emission and Ultrasound Phased Array Technique For Composite Material Evaluation. In Proceedings of the ASME 2013 International Mechanical Engineering Congress and Exposition, San Diego, CA, USA, 15–21 November 2013; pp. 1–8. [Google Scholar]
- Prabhakara, P.; Mielentz, F.; Stolpe, H.; Behrens, M.; Lay, V.; Niederleithinger, E. Validation of Novel Ultrasonic Phased Array Borehole Probe by Using Simulation and Measurement. Sensors 2022, 22, 9823. [Google Scholar] [CrossRef]
- Screening Eagle. Sales Flyer: Pundit Live Array Pro Pulse Echo Testing with A.I.; Screening Eagle: Austin, TX, USA, 2018. [Google Scholar]
- Acoustic Control Systems. Product Flyer: A1040 MIRA 3D; Acoustic Control Systems: North Yorkshire, UK, 2022. [Google Scholar]
- Dinh, K.; Tran, K.; Gucunski, N.; Ferraro, C.C.; Nguyen, T. Imaging Concrete Structures with Ultrasonic Shear Waves—Technology Development and Demonstration of Capabilities. Infrastructures 2023, 8, 53. [Google Scholar] [CrossRef]
- Annan, A.P. Ground Penetrating Radar Principles, Procedures & Applications. In Ground Penetrating Radar Theory and Application; Elsevier Science: Amsterdam, The Netherlands, 2009; p. iv. [Google Scholar] [CrossRef]
- Gehrig, M.D.; Morris, D.V.; Bryant, J.T. Ground Penetrating Radar for Concrete Evaluation Studies. In Proceedings of the Foundation Performance Association Meeting, London, UK, 24 March 2004; pp. 1–17. [Google Scholar]
- Tsalicoglou, I. The Three (Four) Musketeers of Multi-Technology Concrete NDT for Accuracy and Productivity. In Proceedings of the 3rd Japanese-Swiss Workshop—“Durability Testing of Concrete, on Site and in the Lab”, Wildegg, Switzerland, 16 October 2018. [Google Scholar]


| Specimen Group | Slab ID | Bar Diameter | No. of Bars |
|---|---|---|---|
| Slabs with GFRP bars in one direction | Slab C | #4 and #6 | 6 |
| Slabs with GFRP bars in two directions (mesh) | Slab J | #6 | 10 |
| Slab with different FRP bars in one direction | Slab L | #3, #5, #8 GFRP bars, #5 CFRP strand, #3 steel bar, #6 GFRP strand, #3, #5 BFRP bars | 9 |
| Slab ID | Parameter [Symbol/Units] | Reference Side | Bar 1 | Bar 2 | Bar 3 | Bar 4 | Bar 5 | Bar 6 | Bar 7 | Bar 8 | Bar 9 | Bar 10 |
|---|---|---|---|---|---|---|---|---|---|---|---|---|
| C | Distance to edge reference (L/in.) | 3 | 3 | 9 | 15 | 21 | 27 | 33 | ||||
| Depth to surface (C/in.) | 0.75 | 0.75 | 1.5 | 1.5 | 3 | 3 | ||||||
| Diameter of bar (ɸ/in.) | #4 | #6 | #4 | #6 | #4 | #6 | ||||||
| Material of bar (T) | Glass | |||||||||||
| Depth of slab (h/in.) | 5.0 | |||||||||||
| J | Distance to edge reference (L/in.) | 3 | 3.3 | 8.6 | 14.5 | 20.2 | 25.4 | (Bottom mesh) | ||||
| Depth to surface (C/in.) | 3.3 | 3.3 | 3.6 | 3.5 | 3.8 | |||||||
| Diameter of bar (ɸ/in.) | #6 | |||||||||||
| Material of bar (T) | Glass | |||||||||||
| Depth of slab (h/in.) | 7.0 | |||||||||||
| Distance to edge reference (L/in.) | 1 | (Top Mesh) | 3.3 | 8.6 | 14.5 | 20.2 | 25.4 | |||||
| Depth to surface (C/in.) | 2.6 | 2.6 | 2.9 | 2.8 | 3.1 | |||||||
| Diameter of bar (ɸ/in.) | #6 | |||||||||||
| Material of bar (T) | Glass | |||||||||||
| Depth of slab (h/in.] | 7.0 | |||||||||||
| L | Distance to edge reference (L/in.) | 3 | 4.3 | 7.1 | 10.3 | 13.1 | 16.4 | 18.8 | 21.6 | 24.8 | 27.6 | |
| Depth to surface (C/in.) | 4.2 | 3.3 | 3.6 | 3.9 | 3.9 | 4.0 | 3.8 | 4.1 | 4.0 | |||
| Diameter of bar (ɸ/in.) | #3 | #8 | #5 | #5 | #5 | #3 | #6 | #3 | #5 | |||
| Material of bar (T) | Glass | C-Std * | Steel | G-Std * | Basalt | |||||||
| Depth of slab (h/in.) | 7.0 | |||||||||||
| Slab ID | Bar 1 | Bar 2 | Bar 3 | Bar 4 | Bar 5 | Bar 6 | Bar 7 | Bar 8 | Bar 9 | Bar 10 |
|---|---|---|---|---|---|---|---|---|---|---|
| C | ✓ | ✓ | ✓ | ✓ | X | X | - | - | - | - |
| J | ✓ | ✓ | ✓ | ✓ | ✓ | X | ✓ | ✓ | ✓ | ✓ |
| L | X | ✓ | X | X | ✓ | ✓ | ✓ | X | X | - |
| Interface | Relative Dielectric Constant or Permittivity, ε | GPR Reflection Coefficient, R | Acoustic Impedance (106 kg/m2 s), Z | PAU Reflection Coefficient, R | ||
|---|---|---|---|---|---|---|
| ε1 | ε2 | Z1 | Z2 | |||
| Concrete-Air | 7 | 1 | 45% | 9.6 | 0.000429 | 99% |
| Concrete-Steel | 7 | ∞ | 100% | 9.6 | 46.5 | 43% |
| Concrete-GFRP | 7 | <5 | <8% | 9.6 | 10.7 | 0.30% |
| Slab ID | Center Frequency | Bar 1 | Bar 2 | Bar 3 | Bar 4 | Bar 5 | Bar 6 | Bar 7 | Bar 8 | Bar 9 | Bar 10 |
|---|---|---|---|---|---|---|---|---|---|---|---|
| C | 1 GHz | X | ✓ | X | X | X | X | - | - | - | - |
| 2 GHz | ✓ | ✓ | ✓ | ✓ | ✓ | ✓ | - | - | - | - | |
| 0.2 to 6 GHz | ✓ | ✓ | ✓ | ✓ | ✓ | ✓ | - | - | - | - | |
| J | 1 GHz | ✓ | ✓ | ✓ | ✓ | ✓ | X | X | X | X | X |
| 2 GHz | ✓ | ✓ | ✓ | ✓ | ✓ | ✓ | ✓ | ✓ | ✓ | ✓ | |
| 0.2 to 6 GHz | ✓ | ✓ | ✓ | ✓ | ✓ | ✓ | ✓ | ✓ | ✓ | ✓ | |
| L | 1 GHz | X | X | X | X | ✓ | ✓ | ✓ | X | X | - |
| 2 GHz | X | ✓ | X | X | ✓ | ✓ | ✓ | X | X | - | |
| 0.2 to 6 GHz | ✓ | ✓ | ✓ | ✓ | ✓ | ✓ | ✓ | ✓ | ✓ | - |
Disclaimer/Publisher’s Note: The statements, opinions and data contained in all publications are solely those of the individual author(s) and contributor(s) and not of MDPI and/or the editor(s). MDPI and/or the editor(s) disclaim responsibility for any injury to people or property resulting from any ideas, methods, instructions or products referred to in the content. |
© 2023 by the authors. Licensee MDPI, Basel, Switzerland. This article is an open access article distributed under the terms and conditions of the Creative Commons Attribution (CC BY) license (https://creativecommons.org/licenses/by/4.0/).
Share and Cite
Malla, P.; Khedmatgozar Dolati, S.S.; Ortiz, J.D.; Mehrabi, A.B.; Nanni, A.; Dinh, K. Feasibility of Conventional Non-Destructive Testing Methods in Detecting Embedded FRP Reinforcements. Appl. Sci. 2023, 13, 4399. https://doi.org/10.3390/app13074399
Malla P, Khedmatgozar Dolati SS, Ortiz JD, Mehrabi AB, Nanni A, Dinh K. Feasibility of Conventional Non-Destructive Testing Methods in Detecting Embedded FRP Reinforcements. Applied Sciences. 2023; 13(7):4399. https://doi.org/10.3390/app13074399
Chicago/Turabian StyleMalla, Pranit, Seyed Saman Khedmatgozar Dolati, Jesus D. Ortiz, Armin B. Mehrabi, Antonio Nanni, and Kien Dinh. 2023. "Feasibility of Conventional Non-Destructive Testing Methods in Detecting Embedded FRP Reinforcements" Applied Sciences 13, no. 7: 4399. https://doi.org/10.3390/app13074399