Review

A Literature Review of Parameter-Based Models for Walkability Evaluation

1
Department of Technical Sciences, State University of Novi Pazar, 36300 Novi Pazar, Serbia
2
Faculty of Technical Sciences, University of Novi Sad, 21000 Novi Sad, Serbia
3
Faculty of Technical Sciences, University of Pristina, 38220 Kosovska Mitrovica, Serbia
*
Author to whom correspondence should be addressed.
Appl. Sci. 2023, 13(7), 4408; https://doi.org/10.3390/app13074408
Submission received: 27 January 2023 / Revised: 27 March 2023 / Accepted: 28 March 2023 / Published: 30 March 2023

Abstract

:
Many scientific papers that deal with the topic of the pedestrian environment use a predefined form for assessing or evaluating its quality as a basic methodological instrument. The aim of this research is to emphasize the dimension of the available audit tools or methodologies in order to develop a full-scale database of indices that can be used for the measurement and evaluation of the pedestrian environment. By analyzing 115 research papers selected according to predefined selection criteria, the basic methodological apparatus or the evaluation instrument was observed. Based on the analysis carried out in this way, a number of 40 valid instruments were identified by which it was possible to evaluate the pedestrian environment. The observed instruments have a high level of reliability according to the high values of the ICC coefficient, IRR test, or Kappa value. There are 193 items for the evaluation of the pedestrian environment that were derived from the observed instruments. The items were arranged over seven groups regarding the quality of the pedestrian environment, namely, Functionality, Safety, Comfort, Mobility, Environment, Connectivity, and Aesthetics. On average, the items distributed over those seven groups are in use throughout the entire pool of instruments at the level of 47.41% across all groups. There are 30 instruments or methodologies that are objectively based, 4 subjectively oriented, and 6 with elements of both approaches. Of the instruments, 14 measure and assess the pedestrian environment through a quantitative data set, while 20 are designed for qualitative assessment. Only six of the instruments contain both qualitative and quantitative measuring items. A large percentage of analyzed papers that use a predefined methodology or instrument indicate the need to deepen the field of research and to include additional aspects that would give more authoritative results.

1. Introduction

In light of global problems such as overpopulation, exploitation of fossil fuels, global warming, issues of ecology, and general and mental health, by analyzing the factors, influences and whom they affect, we can first extract the human as a universal variable. Analyzing the quality of human life and looking at these aspects and factors, we can say that there are a number of problems in relation: human–society, human–needs, and human–space. In this sense, it is possible to describe the principle of modern human life through the needs of the place of residence, work and way of working, style, and living standard. This opens up many questions in the field of culture of living, existential principles, technical and technological means of support, general physical and mental health, and other closely related issues.
Many aspects are related to the quality of space in the built environment. With the aim of increasing the quality of life, worldwide activities are directed at the improvement of the living environment by applying the principles of sustainability and introducing new principles that lead to greater resilience of the places where we live. The principles of sustainability and resilience of cities are advocated by Jan Gehl, the leading representative of theorists and critics of the development of sustainable architecture and urbanism in the 21st century. Jan Gehl stands for the idea of returning cities to their people by verifying these attitudes through the filter of the human dimension of space [1]. Cities such as Copenhagen, Amsterdam, Stockholm, Vienna, Munich, Boston, New York, Athens, Rome, and others have already adopted strategies and plans for central pedestrian areas of the city as a direction towards sustainable and resilient cities. Besides Gehl, there are several other statements supporting the development of sustainable architecture and urbanism [2,3]. This is also supported by research and projects, such as Shared space—application of contemporary alternative methods of urban planning [4]; COST C6 i COST 358 action (https://www.cost.eu/ (accessed on 29 March 2023)); ADONIS (Analysis and Development Of New Insight into Substitution of short car trips by cycling and walking); WALCYNG, walking and cycling strategy and action plan (https://safety.fhwa.dot.gov/ (accessed on 22 September 2020)); Sydney2030/Green/Global/Connected, Walking strategy and action plan (https://apo.org.au/ (accessed on 23 September 2020)); Your city, your space: Dublin city public realm strategy (https://www.dublincity.ie/ (accessed on 23 September 2020)); Reclaiming city streets for people. Chaos or quality of life?—EU commission (https://op.europa.eu/ (accessed on 23 September 2020)); Pedestrian safety guidelines for residential streets, Boston transportation department (https://www.boston.gov/ (accessed on 24 September 2020)), etc.
Besides various studies and actions in a practical sense, through projects, applications, and strategies, contribution is actively provided through scientific research at the level of pedestrian experience and perception [5,6,7,8], technical analysis considering various aspects [9,10,11,12,13], and theoretical research worldwide [14,15,16].
By using the descriptive method and SWOT analysis, Bagheri et al. [17] state the need to improve undeveloped areas in the direction of sustainable urbanism and architecture through strategies for the development of sustainable transport modalities, of which the greatest emphasis is on walking as a form of transport. In this sense, walkability is a current topic that considers the parameters that affect the quality of the environment used by pedestrians. Southworth [18] emphasizes the most important criteria with indicators relevant to raising the quality of the pedestrian environment in cities. Among those criteria, the most important are Connectivity, Transport Modes, Safety, Land Use, Design of the Environment, and Natural Environment. Brownson et al. [19] assert general groups of indicators, which refer to Population and Demographic Data, Land Use, Accessibility, Street Pattern, Traffic Data, Crime and Traffic Safety, and Environment. A more detailed analysis is given by Tabatabaee et al. [20], which indicates several attributes: Accessibility, Comfort, Pleasurability, Traffic Factors, Safety (from crime and traffic), Geometry/Environmental/Footpath Factors, Pedestrian Movement Factors, Aesthetics, Functionality, Destinations, Environmental Appearance, Activity Potential, Shade, Convenience, Walking Facilities, Usability, and Exploration.
In addition, it is important to observe the way of evaluating the pedestrian environment from a subjective or objective aspect [21,22,23,24]. Most auditing-based walkability assessment models objectively measure the association between built environmental walkability and individuals’ perception and preference of route selection, but cannot measure this correlation subjectively [25]. Subjective measures have received less attention so far in research studies due to the complex form of surveys and data processing, as well as problems of perceptions of different dimensions/items of perceived walkability [21].
By analyzing the available methodologies and procedures for the evaluation of the pedestrian environment, this paper aims to present the details of the measuring instruments that are used to evaluate the pedestrian environment in order to be able to derive adequate elements and indicators for evaluation. Therefore, the aim of this research is to emphasize the dimension of the available audit tools or methodologies in order to develop a full-scale database of indices that are used for the measurement and evaluation of the pedestrian environment. There are several research questions that arise according to the aim of this paper:
  • Which domain do the instruments cover/apply to?
  • Which method of data collection is used in the instruments?
  • Which level of application does the instrument refer to?
  • Which type of users is the instrument adjusted to?
  • Which aspect of analysis is in focus?
  • What level of reliability does the instrument provide?
  • What are the groups of indices that represent the instrument?
  • What is the level of significance and contribution of each of the indicators for the observed methodologies?

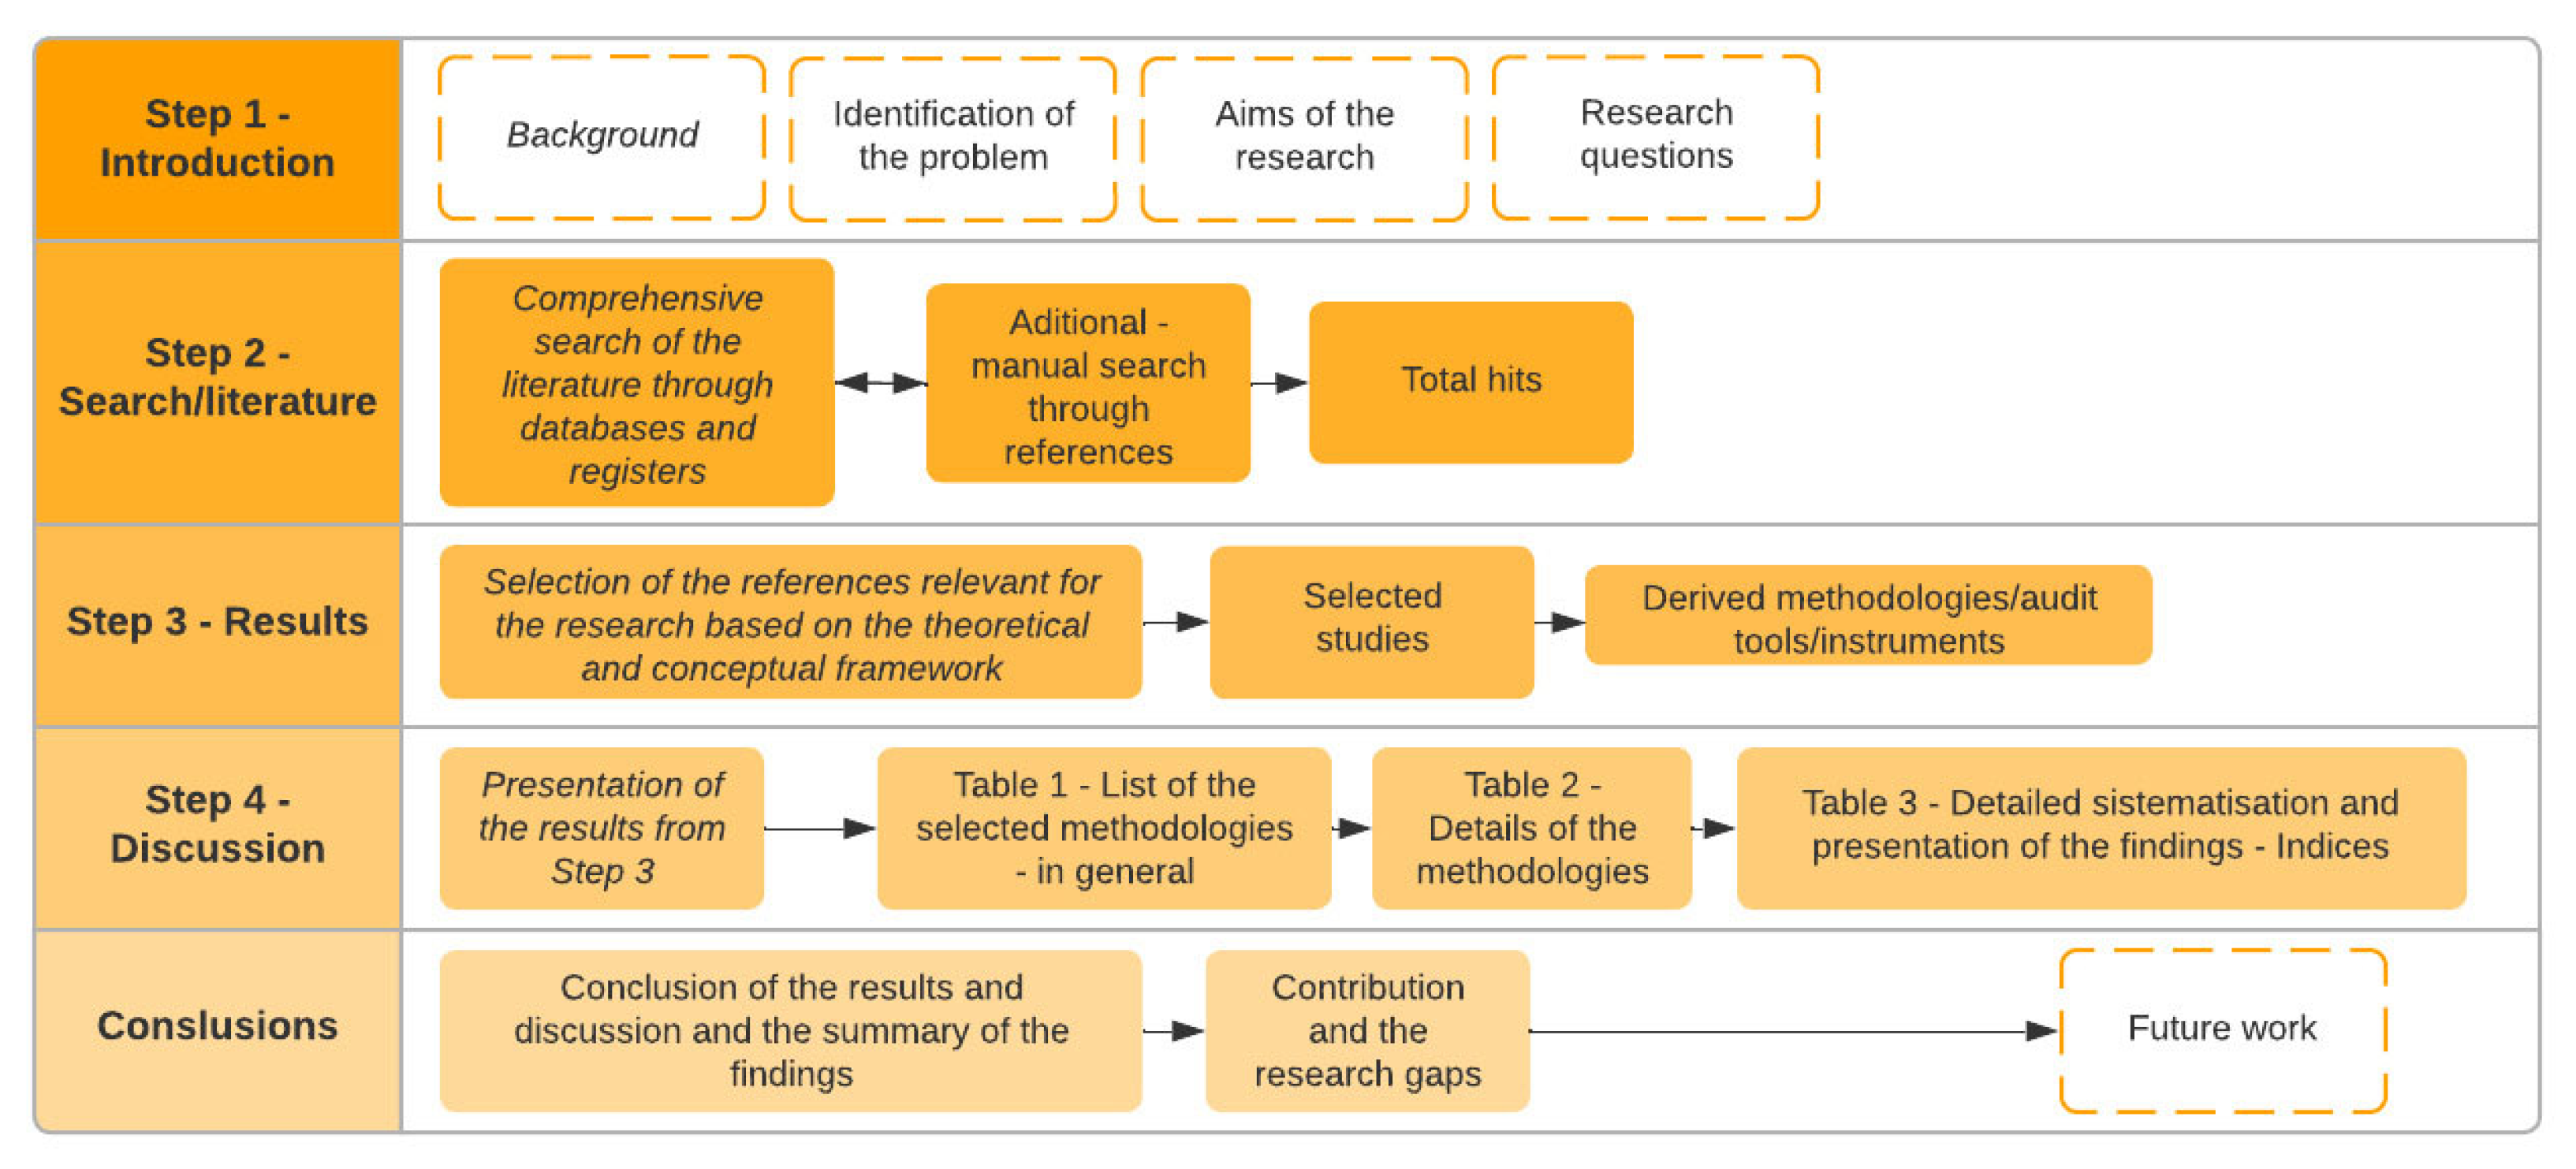
2. Research Database Materials and Analysis

The methodological procedure of this paper refers to an extensive review of the literature and articles on the topic of pedestrian environment evaluation. The research of this paper was performed using the following phases: Introduction (Section 1), with research problems and questions, also with the aims and goals; Online search of the literature (Section 2); Results with the criteria for the selection of the research and analysis of the selected papers and discussion of the presented results, with presentation (Section 3); Conclusion (Section 4); Literature and references. The methodology of this paper is presented in Figure 1.
By searching databases of academic papers, e.g., Scopus, Web of Science, and MEDLINE, we found a significant number of articles on the general topic: pedestrians as a group of traffic participants, pedestrian aspects—field of expertise, spaces used by pedestrians, general characteristics of traffic participants, and other aspects that affect the analysis. The search of the papers was conducted under the PRISMA statement [26].
In order to identify appropriate studies, we applied a predefined criteria search through two categories: (1) papers considering the pedestrian environment or walkability or the neighborhood environment and (2) audit-tool-related or papers with a specific measurement instrument or assessment procedure or scale or tool. During the search of relevant literature through these databases, keywords were used according to the following model: PEDESTRIAN ENVIRONMENT (and) (WALKABILITY (or) AUDIT TOOL (or) ASSESSMENT. The search strategy for the mentioned databases is shown in Figure 2.
Figure 3 provides an overview of the review process of the papers, as well as the number of papers selected for the analysis from each stage. The flowchart in Figure 3 shows the criteria for the selection of the papers relevant for further analysis.
During the screening process, articles were included if they met the following criteria: papers available in English language and other languages that we were able to understand (such as Balkan native languages); papers from the group of environmental studies, engineering studies, social studies, and other relevant areas; papers focused on the usage of specific tools or assessment or an audit tool or questionnaire or survey; general studies considering age and gender; relatively fresh literature; literature with full text available.
Articles were excluded if they met the following criteria: language other than English that we were not able to understand (or Southern Balkan native languages); focused on medical and clinical trials, general health-oriented, technical report opinions, and discussions; studies with a focus on obesity, body mass index, walking inside buildings, and pedestrian simulations; strict age/gender studies; older than the year 2000; and full text not available or missing. A preview of the inclusion or exclusion criteria is shown in Figure 4.
From all available platforms for scientific research, a number of research papers dealing with the analysis of the pedestrian environment regarding certain aspects were selected. All of the papers use some form of predetermined methodology, use their own designed instrument, or deal with the comparison of several of the most significant and available methodologies/instruments. A total of 115 papers were selected for analysis. In the observed research papers, 40 methodological procedures/instruments for evaluation appear, which represent the subject of the research of this paper. These instruments were extracted from the context of the analyzed scientific research, and they were observed independently. This means that if the research deals with designing the instrument, it is observed in its original form. The instrument that was used for the research in its predetermined form was observed independently from that research.

3. Results and Discussion

From the pool of analyzed papers, there are a certain number of articles that use the same evaluation instrument. In that sense, they are considered as one observed instrument. The dimension of acquired instruments can be seen in Figure 5.
According to the dimension of the observed tools, their domains and aspects, their level of significance, and their level of reliability, there are several tools identified: the Pedestrian Health-Oriented Audit (PHOA) [27]; Study of Environmental and Individual Determinants of Physical Activity (SEID) [28]; Neighborhood Environment Walkability Scale (NEWS) [29,30,31,32,33,34,35]; Microscale Audit of Pedestrian Streetscapes (MAPS) [36,37,38]; Neighborhood Brief Observation Tool (NBOT) [39,40]; Irvine–Minnesota Inventory Form (IMI) [41,42,43,44]; SPOTLIGHT-Virtual Audit Tool (S-VAT) [45]; Collaborative Research of AGEing in EU (COURAGE) [46]; Active Neighborhood Checklist (ANC) [47,48,49,50]; Systematic Pedestrian and Cycling Environmental Scan (SPACES) [51,52,53]; Environmental Profile of a Community Health (EPOCH) [54]; Path Walkability Assessment (PWA) [25]; Walkability Assessment Checklist (WAC) [55]; Senior Walking Environment Audit Tool (SWEAT) [56,57,58,59]; International Physical Activity Questionnaire (IPAQ) [60,61,62,63,64,65,66]; Path Walkability Indicators (PWI) [67]; International Physical Activity & Environment Network (IPEN) [68,69]; Road Safety Audit (RSA) [70]; Pedestrian Level of Service (PLOS) [71,72]; Gross Sidewalk Walkability Index (GSWI) [73]; Pedestrian Environment Data Scan (PEDS) [74,75]; Path Environment Audit Tool (PEAT) [76]; Active Accessibility (AA) [77]; Field Survey Instrument (FSI) [78]; Physical Activity Resource Assessment (PARA) [79]; Analytic Hierarchy Process (AHP) [80]; Utah Household Travel Index (UHTS) [81]; Pedestrian Environment Quality Index (PEQI) [82]; Parks, Activity and Recreations among Kids (PARK) [83]; China Urban Built Environment Data Scan Tool (CUBEST) [84]; Pedestrian Environment Review System (PERS) [85]; Virtual—Systematic Tool for Evaluating Pedestrian Streetscapes (V-STEPS) [86]; Audit of Physical Activity Resources for Seniors (APARS) [87]; Physical Activity Neighborhood Environment Scale (PANES) [88,89,90,91,92,93]; Graduate Ready for Activity Daily (GRAD) [94,95,96]; Environmental Assessment of Public Recreation Spaces (EAPRS) [97,98]; Walk Score Index (WSI) [99,100,101,102,103]; School Audit Tool (SAT) [104]; Public Space Quality Index (PSQI) [105,106,107]; Walking Suitability Index for Territory (T-WSI) [108,109,110].

3.1. Pedestrian Health-Oriented Audit

Moudon and Chanam [27] analyze several classes of parameters that refer to the walking and bicycling environment by using the Pedestrian Health-Oriented Audit (PHOA) instrument. In general, the main groups of parameter classes are Roadway characteristics, Network, and Area. They are defined as spatial–physical aspects. The parameters that influence the quality of traffic flow are listed as spatial–behavioral aspects. Considering a user feedback system, the authors define a group of such parameters as spatial–psychosocial aspects.

3.2. Study of Environmental and Individual Determinants of Physical Activity

McCormack et.al. [28] use the Rach model of analysis, a mathematical model based on the latent property of the stochastic joint measurement of pedestrians and objects using the property of the equal scale interval. They perform the Study of Environmental and Individual Determinants of Physical Activity (SEID). The general characteristics of this study refer to the assessment of the psychometric properties of the instrument for the valorization of the pedestrian environment and the design of indicators that show the degree of support for walking in a pedestrian environment. The two relevant groups of parameters are Functionality/Safety and Aesthetics.

3.3. Neighborhood Environment Walkability Scale

Weiss et al. [29], Brownson et al. [30], Saelens et al. [31], Rosenberg et al. [32], and several others [33,34,35] use the Neighborhood Environment Walkability Scale (NEWS) instrument. The main aspects of this instrument are Land use, Connectivity, Aesthetics, and Pedestrian safety.

3.4. Microscale Audit of Pedestrian Streetscapes

Millstein et al. [36], Sallis et al. [37], and Cain et al. [38] use the Microscale Audit of Pedestrian Streetscapes (MAPS), developed by James Sallis and a group of other authors, available at: https://drjimsallis.org/measures.html (accessed on 10 January 2023). The authors analyze details related to the pedestrian space relative to the physical activity of users. The tool is designed for the analysis of movement paths, network segments, crossing systems, and blind corridors. It relies on screening through approximately 84 applicable items.

3.5. Neighborhood Brief Observation Tool

Evenson et al.’s [39] and Caughy’s [40] Neighborhood Brief Observation Tool (NBOT) is an instrument that relies on the factorial analysis of environmental data or EFA (exploratory factorial analysis). The authors perform a comparative analysis between two types of pedestrian environments, rural and urban, through seven groups of indicators, which are Functionality, Safety, Aesthetics, Destinations, Territoriality, Social spaces, and Physical incivilities. Data collected from the field were obtained by using a modified PIN3 tool. The PIN3 pedestrian environment assessment tool refers to pedestrians and cyclists as users. The instrument is intended for objective data collection through four groups of indicators: Street network (Arterial road), Walkable neighborhood, Untidiness (Physical incivilities), and Decorations. The tool was originally developed for use in the urban and rural areas of North Carolina in America. Spatial and physical parameters were processed by EFA analysis, while mutual comparisons were made by CFA (confirmatory factor analysis).

3.6. Irvine–Minnesota Inventory

Gasević et al. [41], Brown et.al. [42], Gallimore et al. [43], and Boarnet et al. [44] use the Irvine–Minnesota Inventory (IMI) form. Speaking in the sense of the methodology, the analysis comes down to a subjective and objective evaluation of the pedestrian environment. Individual groups of indices regarding this methodology are Traffic safety, Security (Personal safety), Attractiveness, Social environment, and Amenities. As the main drawback of this methodology, the authors state the impossibility of subjective assessment.

3.7. Virtual Audit Tool

Betlehem et al. [45], by relying on online available information based on the GIS platform and Street View tools, create the tool SPOTLIGHT-Virtual Audit Tool (S-VAT), which functions as part of the larger SPOTLIGHT research. The tool proved to be reliable based on the research conducted by the authors, and it consists of eight groups of indicators related to Walking, Cycling, Public transport, Aesthetics, Land Use, Retails, and level of physical activity.

3.8. Universal Design and Health Promotion

Quintas et al. [46] present the Universal Design and Health Promotion Project, which represents a platform for the unification of available pedestrian assessment methodologies. This project listed 101 methodological tools that evaluate the degree of quality of the living environment. With exclusions, the final list considered 15 instruments applicable on the European continent with 77 relevant and generally applicable indicators for the valorization of the pedestrian environment, both for people with unrestricted movement and for people with disabilities. General groups of indicators are from the domain of Land use, Functionality, and General infrastructure of the pedestrian environment. Tools and a list of indicators can be found at https://sdc.ahslabs.uic.edu/wp-content/uploads/sites/4/2014/04/ (accessed on 18 January 2023).

3.9. Active Neighborhood Checklist

The tool developed for field data collection, the Active Neighborhood Checklist (ANC), by Hoehner et al. [47] is a common instrument in various studies [48,49,50]. This tool is structured into the six categories: Land use, Public transportation, Street infrastructure, Pedestrian environment quality, Pedestrian, Cyclist, and other infrastructure. This tool includes 72 indicators from those groups.

3.10. Systematic Pedestrian and Cycling Environmental Scan

The research tool SPACES (Systematic Pedestrian and Cycling Environmental Scan), which includes aspects of infrastructure design, location, and the user themselves, was developed according to a large amount of data collected from the field. This tool was developed by Pikora et al. [51] and is a common research instrument for several other studies [52,53]. The parameters that affect the results are related to traffic, infrastructure design, and design of intersections, but also the design of pedestrian avenues. Ease of use, reliability, and practical collection of data are elements of the methodological procedure of this tool.

3.11. Environmental Profile of a Community Health

Research regarding the EPOCH methodology conducted by Chow et al. [54] includes an overview of several methodological procedures for the valorization of the pedestrian environment. Among them, the most influential and significant are the SPACES, IMI, WI, and NEWS tools, which use the direct method (application in the field) of evaluation and user perception as an additional aspect. Due to a more universal approach and application around the world, data availability, and data collection time, the analysis of this research discards the user aspects, and the EPOCH (Environmental Profile of a Community Health) tool was developed, designed to refer only to the physical aspect of the built environment. The basic groups of indicators used by this novel tool are Aesthetics, Community disorder level, Urban density, and Overall appeal. Although a subjective aspect, the last group refers to the evaluation of the person who performs the evaluation and not of the user of the space.

3.12. Path Walkability Assessment

Due to different movement needs, the platform that was developed by Keyvanfar et al. [25] for the needs of this research is PWA (Path Walkability Assessment), and it is based on checking the quality of the pedestrian environment through five classes of indicators: Safety and security, Connectivity, Comfort, Convenience, Aesthetics, and Attractiveness. The authors believe that the model is universally applicable throughout the world, considering that it uses the physical qualities of the observed environment.

3.13. Walkability Assessment Checklist

By comparing the opinions of children and the opinions of parents, from the aspect of safety when it comes to the behavior of pedestrians in a pedestrian environment, Mendoza et al. [55] obtain an overview and feedback on the degree of safe movement in the network. In this sense, they use two tools, the WAC (Walkability Assessment Checklist) obtained as a free evaluation tool as part of the SRTS (Safe Routes to School) program and a tool for evaluating the behavior of pedestrians on the path of movement. The disadvantages of these tools are the impossibility of examining several different ages and structures of children in combination with parental observations, but also the fact that the tools are reduced to almost physical indicators of the observed pedestrian environment. The conclusion of this research refers to the guidelines for the tool improvement, i.e., to expand the areas that include more criteria for evaluating the pedestrian environment.

3.14. Senior Walkability Environment Audit Tool

For most studies regarding the pedestrian environment, it is necessary to set the target group of respondents, considering that all measurement instruments are adapted to the different needs of users of the pedestrian environment. The basic tool for evaluating the environment used by seniors is SWEAT (Senior Walkability Environment Audit Tool). developed by Cunningham et al. [56]. Other studies [57,58,59] use the revised or adjusted version of the SWEAT tool. The basic feature of this tool is the ability to evaluate the functionality of the space, destinations, aesthetics, and personal/traffic safety and comfort. The reliability level of this tool is classified as highly reliable through a high percentage of indicators.

3.15. International Physical Activity Questionnaire

With the aim of harmonizing the objective evaluation with the subjective evaluation of the quality of walking space, a tool for collecting subjective data, the IPAQ International Physical Activity Questionnaire was designed as part of the PLACE (Physical Activity in Localities and Community Environments) study, based on the NEWS (Neighborhood Environment Walkability Scale) tool. The basic groups of indicators are Land use and Connectivity. The tool used in this way gave good results in evaluating the set criteria. The authors who deal with this research [60,61,62,63,64,65,66] and use the IPAQ tool indicate a great possibility for misunderstandings of evaluation data if the criteria are not defined very precisely at the beginning of the work. This means that objective measurements and subjective measurements must be harmonized at the start so that the results can be used in a valid and reliable way.

3.16. Path Walkability Indicators

Based on several groups of indicators considering a pedestrian-friendly environment according to Moaeyedi et al. [67] the quality of the pedestrian environment is valorized through Accessibility, Convenience, Personal safety, and Traffic safety. In addition, this research emphasizes and examines, thereby indicating an exceptional connection with parameters from groups of indicators such as Distances, Topography, Climate and weather conditions, Land use, and Social factors. They use the Path Walkability Indicators tool, consisting of 92 indicators for analysis.

3.17. International Physical Activity and Environment Network

The IPEN (International Physical Activity and Environment Network) platform is a comprehensive review of the various studies. The methodologies are applied in those studies, techniques, samples, target groups, and criteria for the valorization of the pedestrian environment. As part of the platform, a multidisciplinary team of experts [68,69] covers the state of research in several countries of the world and presents guidelines for further coordination of future research, because due to the type of environment being observed, subjective indicators (preferred in measurement), objective indicators (obligatory in measurement), psychosocial measures, general quality of life (indicators based on health assessment, annual income and standard of living), and demographic variables, it is not possible to adopt a uniform tool model for evaluating the pedestrian environment. In terms of data collection within the IPEN study, the main base of indicators was extracted from the IPAQ (International Physical Activity Questionnaire) and NEWS (Neighborhood Environment Walkability Scale) tools.

3.18. Road Safety Audit

Institutional studies only speak in favor of the need to deal with certain topics, with the aim of recognizing the importance of a given topic and research area, when viewed in relation to individual researchers. Regarding this, the systematic approach to the analysis of factors important for the safety of pedestrians in the built environment carried out by this research provides an exceptional contribution and support for the continuation of research in the field of pedestrian environment evaluation. The basic parameters taken into consideration in this study conducted by Thomas et al. [70] are Roadway data, Motorized traffic (traffic data), Non-motorized traffic (Non-motorized data), Public transport (Transit data), Land use, Socioeconomic aspect (Socioeconomic data), and Risk factor (Pedestrian crash data). For the purposes of data collection, three developed methodologies were used as part of this study: SSPST (Systemic Safety Project Selection Tool), PBISI (Pedestrian and Bicyclist Intersection Safety Indices), and ATPT (Active Trans Priority Tool). These methodologies were developed at the institutional level, and the customer is the FHWA (Federal Highway Administration). Several evaluation tools can be found at this site: https://www.road-safety-audit-wa.org/_home/check.html (accessed on 18 January 2023).

3.19. Pedestrian Level of Service

From the aspect of traffic safety in a pedestrian environment, dealing with the evaluation of the pedestrian environment on a micro level, Landis et al. [71,72] use street infrastructure segments (a street segment between two intersections) as a polygon for experiments. Indicator groups are related to Road infrastructure design, Traffic characteristics, and Pedestrian traffic characteristics in order to assess the level of pedestrian safety from the impact of motor vehicles. The methodological approach gave satisfactory results when it comes to the micro level of one segment, but in terms of looking at the wider picture, when it comes to the level of quality of pedestrian circulation, it is necessary to include more aspects.

3.20. Gross Sidewalk Walkability Index

The Gross Sidewalk Walkability Index (GSWI) is a methodological tool for the evaluation of the physical infrastructure of pedestrian areas developed by Gokhale et al. [73]. It refers to the parameters related to sidewalk infrastructure. The model was developed based on the level of service of the pedestrian network and structured for evaluation based on five levels scale from A to E (from best to worst). Basic measurable indicators are the width, the length of the sidewalks, the general state of the infrastructure, equipment, and part of the physical environment.

3.21. Pedestrian Environment Data Scan

Slifton et al. [74], based on the research of several available methodologies, develop a very reliable instrument for evaluating the pedestrian environment, PEDS Pedestrian Environment Data Scan. The advantage of this tool compared to other tools is the subjective assessment of certain segments that affect the quality of the pedestrian environment. The basic groups of indicators of the quality of the pedestrian environment are Land use, Physical structure of the network (Sidewalk and street design), Vehicle and pedestrian collision aspect, and Safety and Security. The tool is considered a very acceptable and reliable instrument, because it is universally applicable to any built environment, both urban and rural. This tool is also applied in other studies [75].

3.22. Path Environment Audit Tool

Troped et al. [76] develops the tool PEAT (Path Environment Audit Tool). The characteristic of this analyzed tool is the evaluation of the quality of the pedestrian environment on a predefined course of pedestrian movement, evaluating segment-by-segment on that path. The use of the tool is reduced to evaluation through groups of indicators, namely, Design, Amenities, and Aesthetic values. The authors believe, based on their research, that the tool has acceptable reliability, as well as readiness to be used in practice.

3.23. Active Accessibility

It is of great interest to investigate as many aspects as possible that influence the quality of the pedestrian environment. Vale et al. [77] look at the given problem in a comprehensive way and through five groups of indicators, they analyze the level of quality of the pedestrian environment. The first four groups of indicators of distance-based indicators, gravitational-based indicators, infrastructure-based indicators, and walkability—walk score indicators refer to the individual indicators from these four groups that are related to the environment in general, but also to indicators that directly affect the quality of walking. The fifth group refers to certain common indicators or surpluses from the previous four groups. Although the indicators are determined to show the level of quality of the pedestrian environment, they are classified into such groups, sorted, and comprehensively classified. There are limitations in their computational use, because there are disagreements in the conceptual approach, as well as in the conditions under which certain parameters are used. In addition, it is necessary to carry out a sensitivity analysis in order to improve current practice, theory, and research.

3.24. Field Survey Instrument

Ewing et al. [78] use the FSI field survey instrument for the analysis of the quality of the pedestrian environment. Through nine indicators of Visual recognition (Imageability), Spatial completeness and comprehensibility (Legibility), Structured environment (Enclosure), Scale (Human scale), Visibility and readability (Transparency), Linkage (Linkage), Complexity (Complexity), Coherence (Coherence), Cleanliness—Sustainability (Tidiness), they show how the urban environment and the pedestrian environment can be qualitatively evaluated. The main advantage of this research lies in the use of relatively simple and measurable characteristics of the built environment. The instrumental approach showed a high level of reliability; however, the disadvantage lies in the need for trained experts to handle the measurements, as well as the complicated methodological procedure of data collection.

3.25. Physical Activity Resource Assessment

By using a simply structured survey sheet of the PARA (Physical Activity Resource Assessment instrument), Lee et al. [79] evaluate the pedestrian space primarily based on land use, i.e., the type of content in the environment, and then the market price of real estate, content, equipment, quality, and untidiness of observed environment. The tool proved to be reliable in principle in differentiating the resources of physical activity when the degree of organization of the observed environment is in question. It is necessary to include more parameters for a more detailed analysis of the pedestrian environment.

3.26. Analytic Hierarchy Process

With a few existing methodologies that assess the pedestrian risk factor at crossings and intersections, Basile et al. [80] start from the assumption that it is possible to develop such a tool. By using the AHP (analytic hierarchy process) methodology, with which it is possible to find the adequate share and importance of each factor that affects pedestrian safety, it developed a platform that evaluates the degree of pedestrian safety in the pedestrian environment. The basic groups of indicators that affect pedestrian safety, and concern the pedestrian environment, refer to Infrastructure Design, Visibility during the day, Visibility at night, as well as general accessibility. The main advantage of the tool developed in this way is its application, which does not require traffic data as input parameters.

3.27. Utah Household Travel Survey

Based on the UHTS (Utah Household Travel Survey) tool, which combines physical activity parameters and convenience for walking (Walkability), the authors [83] of this research examine the interdependence of these two observed topics. According to this research, the aspect of convenience for walking is observed through five groups of indicators (5D’s): building Density (Density), Diversity in types of buildings (Diversity), Design and functionality of the infrastructure (Design), Accessibility (Destination accessibility), and Distance from transit and public points (Distance to transit). The results indicate that the optimal range of observation of the built environment is from 800 to 1600 m distance, that is, up to a 20 min walk from a pedestrian’s point of view. Additionally, land use and socio-demographic status are dominant factors in determining the level of physical activity, while building density and design (urban plan) are key elements for promoting physical activity.

3.28. Pedestrian Environment Review System

By analyzing several methodologies that refer to the research of indicators that affect the quality of the pedestrian environment, Amoroso et al. [82] recognize the importance of the PERS (Pedestrian Environment Review System) tool, which is mostly related to the area of England; PEQI, which is mainly related to the area of America (Pedestrian Environment Quality Index); and the most widespread tool worldwide, which serves for synthesized evaluation of the pedestrian environment, through numerical indicators, HCM LOS (Highway Capacity Manual Level of Service). Based on these tools, the authors highlight the four groups of indicators relevant to the evaluation and observation of the pedestrian environment and hiking in general, namely, Functionality, Aesthetics, Safety and Security, and Practicality. Since the PERS tool is a software-based instrument for the analysis, it offers a quantitative set of parameters regarding lighting, surface quality, traffic conflicts, facilities, obstructions, cleaning and drainage, crossings at the cross-sections, rest points, public spaces, and permeability. The PERS audit tool considers mobility issues through bus stops, waiting areas, etc. It has great graphical output, which can provide more information for the analysis. There are findings from the applied research in the field [83] by using the software benefits

3.29. Parks, Activity, and Recreations among Kids

The PARK (Parks, Activity and Recreations among Kids) platform was developed by Bird et al. [84] as part of the much larger project in Canada, the QUALITY (Quebec Adipose and Lifestyle Investigation in Youth), from the aspect of public health screening primarily young adults. Analyzing a large number of the relevant literature, the authors develop the PARK tool, which relies on five conceptual domains of evaluation, namely, Activities, Environmental quality, Services, Safety, and General impression. The tool showed some reliability based on the measured indicators, but the general conclusion is that it should be developed further, with the aim of increasing the reliability results and general applicability.

3.30. China Urban Built Environment Data Scan Tool

Relying on several existing methodologies for evaluating pedestrian space, such as ANC (Active Neighborhood Checklist), IMI (Irvine–Minnesota Inventory), SPACES (Systematic Pedestrian and Cycling Environmental Scan), PEDS (Pedestrian Environment Data Scan), PARA (Physical Activity Resource Assessment), and a few more, Su et al. [85] create their own methodology adapted to the geographical and cultural characteristics of China’s climate. Based on the indicators analyzed in the existing methodologies, the CUBEST tool was formed with 28 indicators of the quality of the pedestrian environment, divided into 6 basic groups of indicators: Density, Street Connectivity, Accessibility, Sidewalk quality, Bike lane quality, and Aesthetics. The tool is classified as reliable in collecting values of the quality of pedestrian space, i.e., the built environment that supports active physical activity.

3.31. Pedestrian Environment Review System

With the aim of applying the highest possible degree of objectivity in the evaluation of the pedestrian environment in the function of walking as a physical activity, the research of Griew et al. [86] deals with the reliability of the evaluation tool based on computer platforms (Google Street View), in relation to the evaluation in the field. The tool tested in this paper (FASTVIEW (Forty Area Study view)) is based on a commercial evaluation instrument, PERS (Pedestrian Environment Review System), which can be found at the link: https://trlsoftware.com/products/road-safety/street-auditing/streetaudit-pers/ (accessed on 18 January 2023).
The PERS instrument as the basis for this research relies on six groups of indicators, namely, Link, Crossings, Route, Public Transport, Interchange Space, and Public Space. In terms of the practical application of the FASTVIEW platform, there are certain limitations that can affect data collection (camera position, inability to see a real image, lack of data on ephemeral factors, etc.). Although there are shortcomings, the tool has shown some reliability, and wider application at the macro level is possible. Guidelines for further improvement refer to the review of walking behavior in the network, extended analysis of physical structure, and objectively evaluated physical activity in the sense of walking.

3.32. Virtual Systematic Tool for Evaluating Pedestrian Streetscapes

Most recent research shows that it is necessary that the evaluation be performed by a person qualified for such work in the field or regarding the instrument, by a person who does not have to be an expert. There is a growing tendency to activate digital technologies, software, and applications that evaluate pedestrian areas. Steinmetz-Wood et al. [87] rely on the virtual context obtained by using digital platforms (Google Street View), which they evaluate using their own tool Virtual-STEPS (Virtual Systematic Tool for Evaluating Pedestrian Streetscapes). This tool is constructed from six categories of indicators. These indicators are classified according to the structure of the segments to which they are applied, namely, Pedestrian infrastructure, Design of streets and signaling systems, Characteristics of surrounding buildings, Transit traffic (Heavy and public transport), Bicycle infrastructure, and Aesthetics of space or disorder (Aesthetics/disorder). These indicators are used according to the grading system or simply existing in the field. In this sense, the auditor is able to perform a quick evaluation. According to the success of the auditor, the tool showed reliability in evaluation. One of the advantages is that the tool formulated in this way is cheap and quick to use.

3.33. Audit of Physical Activity Resources for Seniors

APARS—The Audit of Physical Activity Resources for Seniors [88] is designed to evaluate the pedestrian environment by addressing physical activity as a main aspect. It is designed for an objective quantitative measurement of physical activity in the neighborhood. It consists of two scales, the inside and outside facilities with 21 out of 90 items considering the outside pedestrian environment. The main items considering the pedestrian environment are Functionality of the Space, Aesthetics, and Amenities.

3.34. Physical Activity Neighborhood Environment Scale

PANES—The Physical Activity Neighborhood Environment Scale is an addition to the IPAQ tool. Revised in 2002 [89,90,91,92,93,94], it uses 17 single items instead of multi-item scales. It is a subjective-oriented tool regarding the support for walking and bicycling in terms of Pedestrian Infrastructure, Density, Aesthetics, Land use, and Safety from traffic and crime.

3.35. Graduate Ready for Activity Daily

Project GRAD—Graduate Ready for Activity Daily is a health-oriented subjective and quantitative analysis of physical activity through the transition of university graduation [95,96,97]. It relies on a survey that, among other items, consists of at least 10 items regarding the built environment. The reviewed articles indicate a low level of reliability.

3.36. Environmental Assessment of Public Recreation Spaces

EAPRS—Environmental Assessment of Public Recreation Spaces is a measurement tool that provides a comprehensive quantitative and qualitative assessment of the physical environments of public spaces. The main domains of this tool are Aesthetics, Functionality, and Amenities. The tool consists of 122 items for evaluation, of which 19 regard the physical characteristics of the environment [98,99].

3.37. Walk Score Index

WSI—The Walk Score Index refers to a systematic analysis of the Walk Score tool and web application. The Walk Score tool has a lot of limitations, and the general conclusion is that it should be modified and improved so that it can be applied elsewhere from the area of American-oriented pedestrian environments [100,101,102,103,104].

3.38. School Audit Tool

SAT—The School Audit Tool is a qualitative and reliable evaluation tool designed by Shaaban et al. [105] that consists of a 30-item checklist. The main domains of the tool are School site assessment, Road network, Parking/loading assessment, and Active transport system.

3.39. Public Space Quality Index

PSQI—The Public Space Quality Index is based on a multi-criteria decision analysis (MCDA) method for the analysis of the pedestrian environment and public space [106,107,108]. It is a mathematical procedure for a qualitative and quantitative assessment of the environment, which relies on the 26 items from the 5C concept of the evaluation of the environment. The main groups of the 5C concept are Connections, Comfort, Convenience, Conviviality, and Conspicuous.

3.40. Walking Suitability Index for Territory

T-WSI—The Walking Suitability Index for Territory is a 12-item evaluation tool divided into 4 categories of indicators: Safety, Pleasantness, Practicability, and Urbanity. The application of the tool shows that it is an easy-to-use instrument with a high level of reliability [109,110,111].

3.41. GIS-Based Research and Theoretical Approach

The search of the databases for the studies that refer to the assessment of the pedestrian environment has shown that there is a great number of articles whose methodology relies on the usage of a GIS (geographic information system) platform [112,113,114,115,116,117,118]. It is most commonly used for the spatial analysis and visualization of inputs and variables regarding the pedestrian environment. Although it is not the exact methodology or survey form used for the assessment, it is a great tool for understanding the geospatial processes of the environment.
Regardless of the methodology of the analyzed articles, their topic, study sample, observed context, etc., this paper refers to the basic instrument that was used to conduct the observed research. Table 1 provides an overview of the abbreviations and full names of the methodology/instruments, original research place, year, and number of indicators on which the methodology relies.
Table 2 shows the characteristics of the selected methodological instruments for the evaluation of the pedestrian environment and, additionally, the cycling environment from several aspects.
From 115 relevant studies, by analyzing the basic characteristics of the tools or procedures designed for the evaluation of such an environment, such tools that deal with evaluation in their full form are emphasized.
In general, there are seven groups or domains of the items, distributed according to the type of the parameter. The identified groups of items are Functionality, Safety, Comfort, Mobility, Environment, Connectivity, and Aesthetics. These domains are distributed over 31 subgroups.
Over these subgroups, we identified 193 items that are used in the observed instruments for the evaluation of the pedestrian environment.
The number of each parameter over the mentioned 31 subgroups are as follows: Land-use subgroup, 5 item types; Motor traffic, 13 item types; Non-motor traffic—Pedestrians, 23 item types; Non-motor traffic—Bicyclists, 8 item types; Accessibility, 8 item types; Safety—Crime, 9 item types; Safety—Traffic, 5 item types; Comfort—Pedestrians, 6 item types; Comfort—Bicyclists, 1 item type; Conflicts, 1 item type; Speed, 1 item type; Vehicle type, 2 item type; Vehicle volume, 9 item types; Safety, 3 item types; Perception, 27 item types; Intersection, 10 item type; Imageability, 6 item types; Enclosure, 4 item types; Human scale, 4 item types; Transparency, 4 item type; Amenities, 6 item type; Pollution, 6 item type; Environment, 13 item type; Public art, 1 item type; Public spaces, 1 item type; Building architecture, 1 item type; Street design, 1 item type; Landscape, 5 item type; Complexity, 5 item type; Attractiveness, 1 item type; General atmosphere, 1 item type.
The complete database of evaluation items, sorted according to groups and subgroups, with a preview of the matching items in the observed evaluation instrument is given in Table S1, provided in the Supplementary Materials.

4. Conclusions

During the analysis of the relevant papers, it is evident that the used tools are officially recognized by world research organizations and supported by national committees for the evaluation of pedestrian and other non-motorized traffic, which is confirmed by the database of available evaluation tools. Several notable platforms for the research and distribution of freely available evaluation tools were identified:
By presenting the original research, and the authors that created the evaluation instrument, it can be seen that most research was conducted in the United States, parts of Europe, Australia, and a small part of Asia.
Observing the period of research or creation of individual instruments, it can be seen that the topic is very current and that it is treated in the context of contemporary world problems of life in urban areas. The vast majority of instruments are designed for micro-level evaluation, meaning that the details of the pedestrian environment are important to observe.
The main aspects of observation in the papers are:
  • Physical activity;
  • General or physical health, obesity, and body mass index;
  • Movement (movement, path/route decision choice, type of walking: leisure; physical activity; shopping);
  • Pedestrian behavior (behavior: rules of compliance, system functionality);
  • Environment—built environment—urban patterns (land use);
  • Environment—living environment (environment, climate, land, and air pollution);
  • Social aspect—demography (gender, age, social, economic status).
The groups that define the degree of quality of the pedestrian environment through parameters or indicators can be distinguished:
(a)
Design of space and infrastructure—Functionality of space;
(b)
Safety and security (traffic safety, security depending on the level of criminality or natural phenomena);
(c)
Aesthetic values;
(d)
Connectivity;
(e)
Accessibility;
(f)
Modes of transport—mobility;
(g)
Comfort.
From these groups arise 193 specific parameters that influence the quality of the pedestrian environment. Based on them, it is possible to create a model for evaluating the pedestrian environment because, in this way, a number of aspects that directly affect quality are covered.
The level of reliability of the selected methodologies depends on the comparative assessment of pedestrian environment assessors (Kappa or ICC coefficient in the confidence zone of 90–100%) or the IRR (inter-rater reliability). According to the analyzed papers, the level of reliability of the selected methodologies is at a high rate.
Most of the papers collect data through questionnaires, survey forms, audit tools, or specific procedures regarding the method of data collection, i.e., field data collection or digitally collected data through online available software and GIS applications. There are 30 instruments or methodologies that are objectively based, 4 subjectively oriented, and 6 with elements of both approaches. Of the instruments, 14 measure and assess the pedestrian environment through a quantitative data set, while 20 of them are designed for qualitative assessment. Only six of the instruments contain both qualitative and quantitative measuring items.
In general, all of the analyzed papers indicate that it is necessary to further investigate the aspects that have impacts on the quality of the pedestrian environment.
Several gaps are identified: (a) Most of the instruments are single-country oriented or adjusted for a specific region; (b) Due to the different approaches, most of the instruments are restricted to certain aspects, i.e., they do not cover all available aspects; (c) Most of the available methodologies lack the ability to integrate subjective and objective types of data into the evaluation procedure; (d) Persons with disabilities are not covered with methodologies for the assessment of the built environment.
Regarding the next steps of this research, it is necessary to carry out an analysis of the individual parameters. To reduce the instruments to their final forms and based on them, the elements must be extracted to create a new instrument adjusted for application in a wider area. It is necessary to adjust the system of the evaluation of the pedestrian area in terms of a more universal approach regarding the difficulties of collecting data objectively and subjectively.
It is also necessary to develop a system for the evaluation of the built environment for persons with disabilities since there has been little or no evidence of such tools for evaluation.

Supplementary Materials

The following supporting information can be downloaded at: https://www.mdpi.com/article/10.3390/app13074408/s1, Table S1: Complete database of evaluation items.

Author Contributions

Writing—original draft preparation, D.D.; writing—review and editing, M.K.; methodology, B.S.; formal analysis, J.A., A.R., L.Z., M.A. and E.H. All authors have read and agreed to the published version of the manuscript.

Funding

This research received no external funding.

Institutional Review Board Statement

Not applicable.

Informed Consent Statement

Not applicable.

Data Availability Statement

No new data were created or analyzed in this study. Data sharing is not applicable to this article.

Conflicts of Interest

The authors declare no conflict of interest.

References

  1. Gehl, J. Gradovi za Ljude, 2nd ed.; Gradjevinska Knjiga: Beograd, Serbia, 2018. [Google Scholar]
  2. Nakamura, K. Experimental analysis of walkability evaluation using virtual reality application. Environ. Plan. B Urban Anal. City Sci. 2021, 48, 2481–2496. [Google Scholar] [CrossRef]
  3. Silvennoinen, H.; Kuliga, S.; Herthogs, P.; Recchia, D.R.; Tunçer, B. Effects of Gehl’s urban design guidelines on walkability: A virtual reality experiment in Singaporean public housing estates. Environ. Plan. B Urban Anal. City Sci. 2022, 49, 2409–2428. [Google Scholar] [CrossRef]
  4. Hamilton-Baillie, B. Shared space: Reconciling people, places and traffic. Built Environ. 2008, 34, 161–181. [Google Scholar] [CrossRef] [Green Version]
  5. Tian, M.; Li, Z.; Xia, Q.; Peng, Y.; Cao, T.; Du, T.; Xing, Z. Walking in China’s historical and cultural streets: The factors affecting pedestrian walking behavior and walking experience. Land 2022, 11, 1491. [Google Scholar] [CrossRef]
  6. Vukmirovic, M.; Raspopovic Milic, M.; Jovic, J. Twitter Data Mining to Map Pedestrian Experience of Open Spaces. Appl. Sci. 2022, 12, 4143. [Google Scholar] [CrossRef]
  7. Kim, H.; Hong, S. Differences in the Influence of Microclimate on Pedestrian Volume According to Land-Use. Land 2021, 10, 37. [Google Scholar] [CrossRef]
  8. Panagopoulos, T.; Tampakis, S.; Karanikola, P.; Karipidou-Kanari, A.; Kantartzis, A. The Usage and Perception of Pedestrian and Cycling Streets on Residents’ Well-being in Kalamaria, Greece. Land 2018, 7, 100. [Google Scholar] [CrossRef] [Green Version]
  9. Jiao, J.; Rollo, J.; Fu, B.; Liu, C. Exploring Effective Built Environment Factors for Evaluating Pedestrian Volume in High-Density Areas: A New Finding for the Central Business District in Melbourne, Australia. Land 2021, 10, 655. [Google Scholar] [CrossRef]
  10. Iacono, M.; Krizek, K.J.; El-Geneidy, A. Measuring non-motorized accessibility: Issues, alternatives, and execution. J. Transp. Geogr. 2010, 18, 133–140. [Google Scholar] [CrossRef] [Green Version]
  11. Wu, Z.; Wang, Y.; Gan, W.; Zou, Y.; Dong, W.; Zhou, S.; Wang, M. A Survey of the Landscape Visibility Analysis Tools and Technical Improvements. Int. J. Environ. Res. Public Health 2023, 20, 1788. [Google Scholar] [CrossRef]
  12. Fernández-Aguilar, C.; Brosed-Lázaro, M.; Carmona-Derqui, D. Effectiveness of Mobility and Urban Sustainability Measures in Improving Citizen Health: A Scoping Review. Int. J. Environ. Res. Public Health 2023, 20, 2649. [Google Scholar] [CrossRef]
  13. Shaaban, K. Assessing Sidewalk and Corridor Walkability in Developing Countries. Sustainability 2019, 11, 3865. [Google Scholar] [CrossRef] [Green Version]
  14. Resch, B.; Puetz, I.; Bluemke, M.; Kyriakou, K.; Miksch, J. An Interdisciplinary Mixed-Methods Approach to Analyzing Urban Spaces: The Case of Urban Walkability and Bikeability. Int. J. Environ. Res. Public Health 2020, 17, 6994. [Google Scholar] [CrossRef] [PubMed]
  15. Arranz-López, A.; Soria-Lara, J.A.; Witlox, F.; Páez, A. Measuring relative non-motorized accessibility to retail activities. Int. J. Sustain. Transp. 2019, 13, 639–651. [Google Scholar] [CrossRef]
  16. Gerike, R.; Koszowski, C.; Schröter, B.; Buehler, R.; Schepers, P.; Weber, J.; Wittwer, R.; Jones, P. Built Environment Determinants of Pedestrian Activities and Their Consideration in Urban Street Design. Sustainability 2021, 13, 9362. [Google Scholar] [CrossRef]
  17. Bagheri, B.; Najari, S.; Hasanvand, S.; Ghamari, M. Analyzing the indicators walkability of cities, in order to improving urban vitality. Int. J. Mod. Eng. Res. 2014, 4, 61–68. [Google Scholar]
  18. Southworth, M. Designing the Walkable City. J. Urban Plan. Dev. 2005, 131, 246–257. [Google Scholar] [CrossRef]
  19. Brownson, R.; Hoehner, C.; Day, K.; Forsyth, A.; Sallis, J. Measuring the Built Environment for Physical Activity: State of the Science. Am. J. Prev. Med. 2009, 36, S99–S123.e12. [Google Scholar] [CrossRef] [Green Version]
  20. Tabatabaee, S.; Aghaabbasi, M.; Mahdiyar, A.; Zainol, R.; Ismail, S. Measurement Quality Appraisal Instrument for Evaluation of Walkability Assessment Tools Based on Walking Needs. Sustainability 2021, 13, 11342. [Google Scholar] [CrossRef]
  21. Saadi, I.; Aganze, R.; Moeinaddini, M.; Asadi-Shekari, Z.; Cools, M. A Participatory Assessment of Perceived Neighbourhood Walkability in a Small Urban Environment. Sustainability 2022, 14, 206. [Google Scholar] [CrossRef]
  22. Chiang, Y.-C.; Sullivan, W.; Larsen, L. Measuring Neighborhood Walkable Environments: A Comparison of Three Approaches. Int. J. Environ. Res. Public Health 2017, 14, 593. [Google Scholar] [CrossRef] [PubMed] [Green Version]
  23. Chen, Q.; Yan, Y.; Zhang, X.; Chen, J. A Study on the Impact of Built Environment Elements on Satisfaction with Residency Whilst Considering Spatial Heterogeneity. Sustainability 2022, 14, 15011. [Google Scholar] [CrossRef]
  24. McCormack, G.R.; McLaren, L.; Salvo, G.; Blackstaffe, A. Changes in Objectively-Determined Walkability and Physical Activity in Adults: A Quasi-Longitudinal Residential Relocation Study. Int. J. Environ. Res. Public Health 2017, 14, 551. [Google Scholar] [CrossRef] [PubMed] [Green Version]
  25. Keyvanfar, A.; Ferwati, M.S.; Shafaghat, A.; Lamit, H. A Path Walkability Assessment Index Model for Evaluating and Facilitating Retail Walking Using Decision-Tree-Making (DTM) Method. Sustainability 2018, 10, 1035. [Google Scholar] [CrossRef] [Green Version]
  26. Haddaway, N.R.; Page, M.J.; Pritchard, C.C.; McGuinness, L.A. PRISMA2020: An R package and Shiny app for producing PRISMA 2020-compliant flow diagrams, with interactivity for optimised digital transparency and Open Synthesis. Campbell Syst. Rev. 2022, 18, e1230. [Google Scholar] [CrossRef]
  27. Moudon, A.; Chanam, L. Walking and Bicycling: An Evaluation of Environmental Audit Instruments. Am. J. Health Promot. 2003, 18, 21–37. [Google Scholar] [CrossRef]
  28. McCormac, G.R.; Masse, L.C.; Bulsara, M.; Pikora, T.J.; Giles-Corti, B. Constructing indices representing supportiveness of the physical environment for walking using the Rasch measurement model. Int. J. Behav. Nutr. Phys. Act. 2006, 3, 44–57. [Google Scholar] [CrossRef] [PubMed] [Green Version]
  29. Weiss, R.L.; Maantay, J.A.; Fahs, M. Promoting Active Urban Aging: A Measurement Approach to Neighborhood Walkability for Older Adults. Cities Environ. 2010, 3, 12. [Google Scholar] [CrossRef]
  30. Brownson, R.C.; Chang, J.J.; Eyler, A.A.; Ainsworth, B.E.; Kirtland, K.A.; Saelens, B.; Sallis, J.F. Measuring the environment for friendliness toward physical activity: A comparison of the reliability of 3 questionnaires. Am. J. Public Health 2004, 94, 473–483. [Google Scholar] [CrossRef]
  31. Saelens, B.E.; Sallis, J.F.; Black, J.B.; Chen, D. Neighborhood-based differences in physical activity: An environment scale evaluation. Am. J. Public Health 2003, 93, 1552–1558. [Google Scholar] [CrossRef]
  32. Rosenberg, D.; Ding, D.; Sallis, J.F.; Kerr, J.; Norman, G.J.; Durant, N.; Harris, S.K.; Saelens, B.E. Neighborhood Environment Walkability Scale for Youth (NEWS-Y): Reliability and Relationship with Physical Activity. Prev. Med. 2009, 49, 213–218. [Google Scholar] [CrossRef]
  33. Adlakha, D.; Hipp, J.A.; Brownson, R.C. Adaptation and Evaluation of the Neighborhood Environment Walkability Scale in India (NEWS-India). Int. J. Environ. Res. Public Health 2016, 13, 401. [Google Scholar] [CrossRef] [PubMed] [Green Version]
  34. Jensen, W.A.; Brown, B.B.; Smith, K.R.; Brewer, S.C.; Amburgey, J.W.; McIff, B. Active Transportation on a Complete Street: Perceived and Audited Walkability Correlates. Int. J. Environ. Res. Public Health 2017, 14, 1014. [Google Scholar] [CrossRef] [PubMed] [Green Version]
  35. Yu, R.; Cheung, O.; Lau, K.; Woo, J. Associations between Perceived Neighborhood Walkability and Walking Time, Wellbeing, and Loneliness in Community-Dwelling Older Chinese People in Hong Kong. Int. J. Environ. Res. Public Health 2017, 14, 1199. [Google Scholar] [CrossRef] [PubMed]
  36. Millstein, R.A.; Cain, K.L.; Sallis, J.F. Development, scoring, and reliability of the Microscale Audit of Pedestrian Streetscapes (MAPS). BMC Public Health 2013, 12, 403. [Google Scholar] [CrossRef] [Green Version]
  37. Sallis, J.F.; Cain, K.L.; Conway, T.L.; Gavand, K.A.; Milstein, R.A.; Geremia, C.M.; Frank, L.D.; Saelens, B.E.; Glanz, K.; King, A.C. Is Your Neighborhood Designed to Support Physical Activity? A Brief Streetscape Audit Tool. Prev. Chronic Dis. 2005, 12, E141. [Google Scholar] [CrossRef] [Green Version]
  38. Cain, K.L.; Gawand, K.; Conway, T.L.; Geremia, R.; Millstein, R.; Frank, L.; Saelens, B.; Adams, M.; Glanz, K.; King, A.; et al. Developing and Validating an Abbreviated Version of the Microscale Audit for Pedestrian Streetscapes (MAPS-Abbreviated). J. Transp. Health 2017, 5, 84–96. [Google Scholar] [CrossRef]
  39. Evenson, K.R.; Sotres-Alvarez, D.; Herring, A.H.; Messer, L.; Laraia, B.A.; Rodríguez, D.A. Assessing urban and rural neighborhood characteristics using audit and GIS data: Derivation and reliability of constructs. Int. J. Behav. Nutr. Phys. Act. 2009, 6, 44. [Google Scholar] [CrossRef] [Green Version]
  40. Caughy, M.O.; O’Campo, P.J.; Patterson, J. A brief observational measure for urban neighborhoods. Health Place 2001, 7, 225–236. [Google Scholar] [CrossRef]
  41. Gasevic, D.; Vukmirovich, I.; Yusuf, S.; Teo, K.; Chow, C.; Dagenais, G.; Lear, S.A. A direct assessment of “obesogenic” built environments: Challenges and recommendations. J. Environ. Public Health 2011, 2011, 161574. [Google Scholar] [CrossRef]
  42. Brown, B.B.; Werner, C.M.; Amburgey, J.W.; Szalay, C. Walkable Route Perceptions and Physical Features: Converging Evidence for En Route Walking Experiences. Environ. Behav. 2007, 39, 34–61. [Google Scholar] [CrossRef]
  43. Gallimore, J.M.; Brown, B.B.; Werner, C.M. Walking routes to school in new urban and suburban neighborhoods: An environmental walkability analysis of blocks and routes. J. Environ. Psychol. 2011, 31, 184–191. [Google Scholar] [CrossRef]
  44. Boarnet, M.G.; Forsyth, A.; Day, K.; Oakes, J.M. The Street Level Built Environment and Physical Activity and Walking: Results of a Predictive Validity Study for the Irvine Minnesota Inventory. Environ. Behav. 2011, 43, 735–775. [Google Scholar] [CrossRef]
  45. Bethlehem, J.R.; Mackenbach, J.D.; Ben-Rebah, M.; Compernolle, S.; Glonti, K.; Bárdos, H.; Rutter, H.R.; Charreire, H.; Oppert, J.-M.; Brug, J.; et al. The SPOTLIGHT virtual audit tool: A valid and reliable tool to assess obesogenic characteristics of the built environment. Int. J. Health Geogr. 2014, 13, 52. [Google Scholar] [CrossRef] [PubMed] [Green Version]
  46. Quintas, R.; Koutsogeorgou, E.; Raggi, A.; Bucciarelli, P.; Cerniauskaite, M.; Leonardi, M. The selection of items for the preliminary version of the COURAGE in Europe built environment instrument. Maturitas 2012, 71, 147–153. [Google Scholar] [CrossRef] [PubMed]
  47. Hoehner, C.M.; Ivy, A.; Ramirez, L.K.; Handy, S.; Brownson, R.C. Active neighborhood checklist: A user-friendly and reliable tool for assessing activity friendliness. Am. J. Health Promot. AJHP 2007, 21, 534–537. [Google Scholar] [CrossRef]
  48. Kelly, C.M.; Wilson, J.S.; Baker, E.A.; Miller, D.K.; Schootman, M. Using Google Street View to audit the built environment: Inter-rater reliability results. Ann. Behav. Med. A Publ. Soc. Behav. Med. 2013, 45, 108–112. [Google Scholar] [CrossRef] [Green Version]
  49. Kelly, C.; Wilson, J.S.; Schootman, M.; Clennin, M.; Baker, E.A.; Miller, D.K. The built environment predicts observed physical activity. Front. Public Health 2014, 2, 52. [Google Scholar] [CrossRef] [Green Version]
  50. Brownson, R.C.; Hoehner, C.M.; Brennan, L.K.; Cook, R.A.; Elliott, M.T.; Mcmullen, K.M. Reliability of 2 Instruments for Auditing the Environment for Physical Activity. J. Phys. Act. Health 2004, 1, 191–208. [Google Scholar] [CrossRef]
  51. Pikora, T.J.; Bull, F.C.; Jamrozik, K.; Knuiman, M.; Giles-Corti, B.; Donovan, R.J. Developing a reliable audit instrument to measure the physical environment for physical activity. Am. J. Prev. Med. 2002, 23, 187–194. [Google Scholar] [CrossRef]
  52. Pikora, T.; Giles-Corti, B.; Bull, F.C.; Jamrozik, K.D.; Donovan, R.J. Developing a framework for assessment of the environmental determinants of walking and cycling. Soc. Sci. Med. 2003, 56, 1693–1703. [Google Scholar] [CrossRef]
  53. Gullón, P.; Badland, H.M.; Alfayate, S.; Bilal, U.; Escobar, F.; Cebrecos, A.; Diez, J.; Franco, M. Assessing Walking and Cycling Environments in the Streets of Madrid: Comparing On-Field and Virtual Audits. J. Urban Health 2015, 92, 923–939. [Google Scholar] [CrossRef] [PubMed] [Green Version]
  54. Chow, C.K.; Corsi, D.J.; Lock, K.; Madhavan, M.; Mackie, P.; Li, W.; Yi, S.; Wang, Y.; Swaminathan, S.; Lopez-Jaramillo, P.; et al. A novel method to evaluate the community built environment using photographs--Environmental Profile of a Community Health (EPOCH) photo neighbourhood evaluation tool. PLoS ONE 2014, 9, e110042. [Google Scholar] [CrossRef] [PubMed]
  55. Mendoza, J.A.; Watson, K.; Baranowski, T.; Nicklas, T.A.; Uscanga, D.K.; Hanfling, M.J. Validity of instruments to assess students’ travel and pedestrian safety. BMC Public Health 2010, 10, 257. [Google Scholar] [CrossRef] [PubMed] [Green Version]
  56. Cunningham, G.O.; Michael, Y.L.; Farquhar, S.A.; Lapidus, J. Developing a reliable Senior Walking Environmental Assessment Tool. Am. J. Prev. Med. 2005, 29, 215–217. [Google Scholar] [CrossRef] [PubMed]
  57. Chaudhury, H.; Sarte, A.; Michael, Y.; Mahmood, A.; Keast, E.; Dogaru, C.; Wister, A. Use of a Systematic Observational Measure to Assess and Compare Walkability for Older Adults in Vancouver, British Columbia and Portland, Oregon Neighbourhoods. J. Urban Des. 2011, 16, 433–454. [Google Scholar] [CrossRef]
  58. McGregor, E.M. Validation of a Senior Walking Environmental Assessment Tool. Ph.D. Thesis, Oregon Health & Science University, Portland, OR, USA, 2007. [Google Scholar] [CrossRef]
  59. Michael, Y.L.; Keast, E.M.; Chaudhury, H.; Day, K.; Mahmood, A.; Sarte, A.F. Revising the senior walking environmental assessment tool. Prev. Med. 2009, 48, 247–249. [Google Scholar] [CrossRef] [PubMed] [Green Version]
  60. Gebel, K.; Bauman, A.E.; Sugiyama, T.; Owen, N. Mismatch between perceived and objectively assessed neighborhood walkability attributes: Prospective relationships with walking and weight gain. Health Place 2011, 17, 519–524. [Google Scholar] [CrossRef]
  61. Owen, N.; Cerin, E.; Leslie, E.; duToit, L.; Coffee, N.; Frank, L.D.; Bauman, A.E.; Hugo, G.; Saelens, B.E.; Sallis, J.F. Neighborhood walkability and the walking behavior of Australian adults. Am. J. Prev. Med. 2007, 33, 387–395. [Google Scholar] [CrossRef]
  62. Ryan, D.J.; Wullems, J.A.; Stebbings, G.K.; Morse, C.I.; Stewart, C.E.; Onambele-Pearson, G.L. Reliability and validity of the international physical activity questionnaire compared to calibrated accelerometer cut-off points in the quantification of sedentary behaviour and physical activity in older adults. PLoS ONE 2018, 13, e0195712. [Google Scholar] [CrossRef] [Green Version]
  63. Craig, C.L.; Marshall, A.L.; Sjöström, M.; Bauman, A.E.; Booth, M.L.; Ainsworth, B.E.; Pratt, M.; Ekelund, U.; Yngve, A.; Sallis, J.F.; et al. International physical activity questionnaire: 12-country reliability and validity. Med. Sci. Sport. Exerc. 2003, 35, 1381–1395. [Google Scholar] [CrossRef] [PubMed] [Green Version]
  64. Lee, P.H.; Macfarlane, D.J.; Lam, T.H.; Stewart, S.M. Validity of the International Physical Activity Questionnaire Short Form (IPAQ-SF): A systematic review. Int. J. Behav. Nutr. Phys. Act. 2011, 8, 115. [Google Scholar] [CrossRef] [Green Version]
  65. Sebastião, E.; Gobbi, S.; Chodzko-Zajko, W.; Schwingel, A.; Papini, C.B.; Nakamura, P.M.; Netto, A.V.; Kokubun, E. The International Physical Activity Questionnaire-long form overestimates self-reported physical activity of Brazilian adults. Public Health 2012, 126, 967–975. [Google Scholar] [CrossRef] [PubMed]
  66. Keats, M.R.; Cui, Y.; DeClercq, V.; Grandy, S.A.; Sweeney, E.; Dummer, T.J.B. Associations between Neighborhood Walkability, Physical Activity, and Chronic Disease in Nova Scotian Adults: An Atlantic PATH Cohort Study. Int. J. Environ. Res. Public Health 2020, 17, 8643. [Google Scholar] [CrossRef]
  67. Moayedi, F.; Zakaria, R.; Bigah, Y.; Mustafar, M.; Che Puan, O.; Zin, I.S.; Klufallah, M.M.A. Conceptualising the Indicators of Walkability for Sustainable Transportation. J. Teknol. 2013, 65, 2180–3722. [Google Scholar] [CrossRef] [Green Version]
  68. Kerr, J.; Sallis, J.F.; Owen, N.; De Bourdeaudhuij, I.; Cerin, E.; Sugiyama, T.; Reis, R.; Sarmiento, O.; Frömel, K.; Mitás, J.; et al. Advancing science and policy through a coordinated international study of physical activity and built environments: IPEN adult methods. J. Phys. Act. Health 2013, 10, 581–601. [Google Scholar] [CrossRef]
  69. Sallis, J.F.; Cerin, E.; Kerr, J.; Adams, M.A.; Sugiyama, T.; Christiansen, L.B.; Schipperijn, J.; Davey, R.; Salvo, D.; Frank, L.D.; et al. Built Environment, Physical Activity, and Obesity: Findings from the International Physical Activity and Environment Network (IPEN) Adult Study. Annu. Rev. Public Health 2020, 41, 119–139. [Google Scholar] [CrossRef] [PubMed] [Green Version]
  70. Thomas, L.; Kumfer, W.; Lang, K.; Zegeer, C.; Sandt, L.; Lan, B.; Nordback, K.; Bergh, C.; Butsick, A.; Horowitz, Z.; et al. Systemic pedestrian safety analysis: Contractor’s technical report. National Cooperative Highway Research Program. Transp. Res. Board 2018, 118, 17–73. [Google Scholar] [CrossRef]
  71. Landis, B.W.; Vattikuti, V.R.; Ottenberg, R.M.; McLeod, D.S.; Guttenplan, M. Modeling the Roadside Walking Environment: Pedestrian Level of Service. Transp. Res. Rec. 2001, 1773, 82–88. [Google Scholar] [CrossRef]
  72. Christopoulou, P.; Pitsiava-Latinopoulou, M. Development of a Model for the Estimation of Pedestrian Level of Service in Greek Urban Areas. Procedia Soc. Behav. Sci. 2012, 48, 1691–1701. [Google Scholar] [CrossRef] [Green Version]
  73. Gokhale, M.V.; Telang, M.V. Development of Sidewalk Evaluation Model for Existing Pedestrian Environment in Indian Cities: Case Example of Pune City, Maharashtra, India. Int. J. Sci. Res. 2013, 2, 39–44. [Google Scholar] [CrossRef]
  74. Clifton, K.J.; Smith, A.L.; Rodriguez, D.A. The development and testing of an audit for the pedestrian environment. Landsc. Urban Plan. 2007, 80, 95–110. [Google Scholar] [CrossRef]
  75. Sousa, A.; Santos, B.; Goncalves, J. Pedestrian Environment Quality Assessment in Portuguese Medium-Sized Cities. IOP Conf. Ser. Mater. Sci. Eng. 2019, 471, 11. [Google Scholar] [CrossRef]
  76. Troped, P.J.; Cromley, E.K.; Fragala, M.S.; Melly, S.J.; Hasbrouck, H.H.; Gortmaker, S.L.; Brownson, R.C. Development and Reliability and Validity Testing of an Audit Tool for Trail/Path Characteristics: The Path Environment Audit Tool (PEAT). J. Phys. Act. Health 2006, 3, 158–175. [Google Scholar] [CrossRef] [PubMed] [Green Version]
  77. Vale, D.S.; Saraiva, M.; Pereira, M. Active accessibility: A review of operational measures of walking and cycling accessibility. J. Transp. Land Use 2015, 9, 209–235. [Google Scholar] [CrossRef]
  78. Ewing, R.; Handy, S.; Brownson, R.C.; Clemente, O.; Winston, E. Identifying and Measuring Urban Design Qualities Related to Walkability. J. Phys. Act. Health 2006, 3, 223–240. [Google Scholar] [CrossRef]
  79. Lee, R.E.; Booth, K.M.; Reese-Smith, J.Y.; Regan, G.; Howard, H.H. The Physical Activity Resource Assessment (PARA) instrument: Evaluating features, amenities and incivilities of physical activity resources in urban neighborhoods. Int. J. Behav. Nutr. Phys. Act. 2005, 2, 13. [Google Scholar] [CrossRef] [Green Version]
  80. Basile, O.; Persia, L.; Usami, D.S. A methodology to assess pedestrian crossing safety. Eur. Transp. Res. Rev. 2010, 2, 129–137. [Google Scholar] [CrossRef] [Green Version]
  81. Wei, Y.D.; Xiao, W.; Wen, M.; Wei, R. Walkability, Land Use and Physical Activity. Sustainability 2016, 8, 65. [Google Scholar] [CrossRef] [Green Version]
  82. Amoroso, S.; Castelluccio, F.; Maritano, L. Indicators for sustainable pedestrian mobility. Urban Transp. 2012, 18, 173–185. [Google Scholar] [CrossRef] [Green Version]
  83. Allen, D.; Clark, S. New Directions in Street Auditing: Lessons from the PERS Audits. In Proceedings of the 8th International Conference on Walking and Liveable Communities, Toronto, ON, Canada, 1–14 October 2007; Available online: http://library.walk21.com/ (accessed on 21 March 2023).
  84. Bird, M.E.; Datta, G.D.; van Hulst, A.; Kestens, Y.; Barnett, T.A. A reliability assessment of a direct-observation park evaluation tool: The Parks, activity and recreation among kids (PARK) tool. BMC Public Health 2015, 15, 906. [Google Scholar] [CrossRef] [PubMed] [Green Version]
  85. Su, M.; Du, Y.; Liu, Q.; Ren, Y.; Kawachi, I.; Lv, J.; Li, L. Objective assessment of urban built environment related to physical activity—Development, reliability and validity of the China Urban Built Environment Scan Tool (CUBEST). BMC Public Health 2014, 14, 109. [Google Scholar] [CrossRef] [PubMed]
  86. Griew, P.; Hillsdon, M.; Foster, C.; Coombes, E.; Jones, A.; Wilkinson, P. Developing and testing a street audit tool using Google Street View to measure environmental supportiveness for physical activity. Int. J. Behav. Nutr. Phys. Act. 2013, 10, 103. [Google Scholar] [CrossRef] [Green Version]
  87. Steinmetz-Wood, M.; Velauthapillai, K.; O’Brien, G.; Ross, N.A. Assessing the micro-scale environment using Google Street View: The Virtual Systematic Tool for Evaluating Pedestrian Streetscapes (Virtual-STEPS). BMC Public Health 2019, 19, 1246. [Google Scholar] [CrossRef] [PubMed] [Green Version]
  88. Kerr, J.; Carlson, J.A.; Sallis, J.F.; Rosenberg, D.; Leak, C.R.; Saelens, B.E.; Chapman, J.E.; Frank, L.D.; King, A.C. Assessing health-related resources in senior living residences. J. Aging Stud. 2011, 25, 206–214. [Google Scholar] [CrossRef] [Green Version]
  89. Sallis, J.F.; Kerr, J.; Carlson, J.; Norman, G.; Saelens, B.; Durant, N.; Ainsworth, B. Evaluating a Brief Self-Report Measure of Neighborhood Environments for Physical Activity Research and Surveillance: Physical Activity Neighborhood Environment Scale (PANES). J. Phys. Act. Health 2010, 7, 533–540. [Google Scholar] [CrossRef]
  90. Bergman, P.; Grjibovski, A.M.; Hagströmer, M.; Sallis, J.F.; Sjöström, M. The association between health enhancing physical activity and neighbourhood environment among Swedish adults—A population-based cross-sectional study. Int. J. Behav. Nutr. Phys. Act. 2009, 6, 8. [Google Scholar] [CrossRef] [Green Version]
  91. Sallis, J.F.; Bowles, H.R.; Bauman, A.; Ainsworth, B.E.; Bull, F.C.; Craig, C.L.; Sjöström, M.; De Bourdeaudhuij, I.; Lefevre, J.; Matsudo, V.; et al. Neighborhood Environments and Physical Activity Among Adults in 11 Countries. Am. J. Prev. Med. 2009, 36, 484–490. [Google Scholar] [CrossRef] [Green Version]
  92. Oyeyemi, A.L.; Sallis, J.F.; Oyeyemi, A.Y.; Amin, M.M.; De Bourdeaudhuij, I.; Deforche, B. Adaptation, Test-Retest Reliability, and Construct Validity of the Physical Activity Neighborhood Environment Scale in Nigeria (PANES-N). J. Phys. Act. Health 2013, 10, 1079–1090. [Google Scholar] [CrossRef]
  93. Adams, M.A.; Frank, L.D.; Schipperijn, J.; Smith, G.; Chapman, J.; Christiansen, L.B.; Coffee, N.; Salvo, D.; du Toit, L.; Dygrýn, J.; et al. International variation in neighborhood walkability, transit, and recreation environments using geographic information systems: The IPEN adult study. Int. J. Health Geogr. 2014, 13, 43. [Google Scholar] [CrossRef] [Green Version]
  94. Ding, D.; Adams, M.A.; Sallis, J.F.; Norman, G.J.; Hovell, M.F.; Chambers, C.D.; Hofstetter, C.R.; Bowles, H.R.; Hagströmer, M.; Craig, C.L.; et al. Perceived neighborhood environment and physical activity in 11 countries: Do associations differ by country? Int. J. Behav. Nutr. Phys. Act. 2013, 10, 57. [Google Scholar] [CrossRef] [PubMed] [Green Version]
  95. Sallis, J.F.; Johnson, M.F.; Calfas, K.J.; Caparosa, S.; Nichols, J.F. Assessing Perceived Physical Environmental Variables that May Influence Physical Activity. Res. Q. Exerc. Sport 1997, 68, 345–351. [Google Scholar] [CrossRef]
  96. Sallis, J.F.; Calfas, K.J.; Alcaraz, J.; Gehrman, E.C.; Johnson, M.F. Potential mediators of change in a physical activity promotion course for university students: Project grad. Ann. Behav. Med. 1999, 21, 149–158. [Google Scholar] [CrossRef] [PubMed]
  97. Calfas, K.J.; Sallis, J.F.; Nichols, J.F.; Sarkin, J.A.; Johnson, M.F.; Caparosa, S.; Thompson, S.; Gehrman, C.A.; Alcaraz, J.E. Project GRAD: Two-year outcomes of a randomized controlled physical activity intervention among young adults11Tables of correlation coefficients and regression results are available from the first author upon request. Am. J. Prev. Med. 2000, 18, 28–37. [Google Scholar] [CrossRef] [PubMed]
  98. Saelens, B.E.; Frank, L.D.; Auffrey, C.R.; Whitaker, C.; Burdette, H.L.; Colabianchi, N. Measuring Physical Environments of Parks and Playgrounds: EAPRS Instrument Development and Inter-Rater Reliability. J. Phys. Act. Health 2006, 3, S190–S207. [Google Scholar] [CrossRef] [PubMed] [Green Version]
  99. Geremia, C.M.; Cain, K.L.; Conway, T.L.; Sallis, J.F.; Saelens, B.E. Validating and Shortening the Environmental Assessment of Public Recreation Spaces Observational Measure. J. Phys. Act. Health 2019, 16, 68–75. [Google Scholar] [CrossRef]
  100. Frank, L.D.; Sallis, J.F.; Saelens, B.E.; Leary, L.; Cain, K.; Conway, T.L.; Hess, P.M. The development of a walkability index: Application to the Neighborhood Quality of Life Study. Br. J. Sports Med. 2010, 44, 924–933. [Google Scholar] [CrossRef]
  101. Lam, T.M.; Wang, Z.; Vaartjes, I.; Karssenberg, D.; Ettema, D.; Helbich, M.; Timmermans, E.J.; Frank, L.D.; Braver, N.R.D.; Wagtendonk, A.J.; et al. Development of an objectively measured walkability index for the Netherlands. Int. J. Behav. Nutr. Phys. Act. 2022, 19, 50. [Google Scholar] [CrossRef]
  102. Habibian, M.; Hosseinzadeh, A. Walkability index across trip purposes. Sustain. Cities Soc. 2018, 42, 216–225. [Google Scholar] [CrossRef]
  103. Alves, F.; Cruz, S.; Ribeiro, A.; Bastos Silva, A.; Martins, J.; Cunha, I. Walkability Index for Elderly Health: A Proposal. Sustainability 2020, 12, 7360. [Google Scholar] [CrossRef]
  104. Roosevelt, M. How Walkable Is Your Neighborhood. The New York Times. Available online: https://www.nytimes.com/2008/08/10/realestate/10post.html (accessed on 7 March 2023).
  105. Shaaban, K.; Abdur-Rouf, K. Development, Validation, and Application of School Audit Tool (SAT): An Effective Instrument for Assessing Traffic Safety and Operation Around Schools. Sustainability 2019, 11, 6438. [Google Scholar] [CrossRef] [Green Version]
  106. Manzolli, J.A.; Oliveira, A.; Neto, M.D.C. Evaluating Walkability through a Multi-Criteria Decision Analysis Approach: A Lisbon Case Study. Sustainability 2021, 13, 1450. [Google Scholar] [CrossRef]
  107. He, P.; Herthogs, P.; Cinelli, M.; Tomarchio, L.; Tunçer, B. A Multi-Criteria Decision Analysis Based Framework to Evaluate Public Space Quality. In Smart and Sustainable Cities and Buildings; Roggema, R., Roggema, A., Eds.; Springer: Cham, Switzerland, 2020. [Google Scholar] [CrossRef]
  108. Seema, P.; Pushplata, G. Public space quality evaluation: Prerequisite for public space management. J. Public Space 2019, 4, 93–126. [Google Scholar] [CrossRef]
  109. D’Alessandro, D.; Valeri, D.; Appolloni, L. Reliability of T-WSI to Evaluate Neighborhoods Walkability and Its Changes over Time. Int. J. Environ. Res. Public Health 2020, 17, 7709. [Google Scholar] [CrossRef] [PubMed]
  110. D’Alessandro, D.; Assenso, M.; Appolloni, L.; Cappucciti, A. The Walking Suitability Index of the Territory (T-WSI): A new tool to evaluate urban neighborhood walkability. Ann. Ig. Med. Prev. Comunita. 2015, 27, 678–687. [Google Scholar] [CrossRef]
  111. D’Alessandro, D.; Appolloni, L.; Capasso, L. How walkable is the city? Application of the Walking Suitability Index of the Territory (T-WSI) to the city of Rieti (Lazio Region, Central Italy). Epidemiol. Prev. 2016, 40, 237–242. [Google Scholar] [CrossRef]
  112. Hanibuchi, T.; Nakaya, T.; Yonejima, M.; Honjo, K. Perceived and Objective Measures of Neighborhood Walkability and Physical Activity among Adults in Japan: A Multilevel Analysis of a Nationally Representative Sample. Int. J. Environ. Res. Public Health 2015, 12, 13350–13364. [Google Scholar] [CrossRef] [PubMed] [Green Version]
  113. Kikuchi, H.; Nakaya, T.; Hanibuchi, T.; Fukushima, N.; Amagasa, S.; Oka, K.; Sallis, J.F.; Inoue, S. Objectively Measured Neighborhood Walkability and Change in Physical Activity in Older Japanese Adults: A Five-Year Cohort Study. Int. J. Environ. Res. Public Health 2018, 15, 1814. [Google Scholar] [CrossRef] [Green Version]
  114. Al Shammas, T.; Escobar, F. Comfort and Time-Based Walkability Index Design: A GIS-Based Proposal. Int. J. Environ. Res. Public Health 2019, 16, 2850. [Google Scholar] [CrossRef] [Green Version]
  115. Amaya, V.; Moulaert, T.; Gwiazdzinski, L.; Vuillerme, N. Assessing and Qualifying Neighborhood Walkability for Older Adults: Construction and Initial Testing of a Multivariate Spatial Accessibility Model. Int. J. Environ. Res. Public Health 2022, 19, 1808. [Google Scholar] [CrossRef]
  116. Iamtrakul, P.; Chayphong, S.; Kantavat, P.; Hayashi, Y.; Kijsirikul, B.; Iwahori, Y. Exploring the Spatial Effects of Built Environment on Quality of Life Related Transportation by Integrating GIS and Deep Learning Approaches. Sustainability 2023, 15, 2785. [Google Scholar] [CrossRef]
  117. D’Orso, G.; Migliore, M. A GIS-based method for evaluating the walkability of a pedestrian environment and prioritised investments. J. Transp. Geogr. 2020, 82, 102555. [Google Scholar] [CrossRef]
  118. Ignaccolo, M.; Inturri, G.; Giuffrida, N.; Le Pira, M.; Torrisi, V.; Calabrò, G. A step towards walkable environments: Spatial analysis of pedestrian compatibility in an urban context. Eur. Transp. Trasp. Eur. 2020, 76, 1–12. [Google Scholar] [CrossRef]
Figure 1. Flowchart of this paper’s methodology.
Applsci 13 04408 g001
Figure 2. Chart of the search strategies for WoS, Scopus, and MEDLINE. The * symbol is added as a expanded search symbol. It search sufixses, prefixes, or spelling variations etc.
Applsci 13 04408 g002
Figure 3. Flowchart of the literature review process.
Applsci 13 04408 g003
Figure 4. Elements for the inclusion or exclusion of the available studies.
Applsci 13 04408 g004
Figure 5. The dimension of observed audit tools survey forms, questionnaires or instruments.
Applsci 13 04408 g005
Table 1. List of the relevant methodologies/instruments selected for the analysis—in general.
AbbreviationFull Name of the Methodology/InstrumentOriginal ResearchCountryYearNo. Indices
PHOAPedestrian Health-Oriented Audit[27]USA2003116
SEIDStudy of Env. & Individual Det. of Physical Activity[28]AUS200659
NEWSNeighborhood Environment Walkability Scale[31]USA200471
MAPSMicroscale Audit of Pedestrian Streetscapes[36]USA201384
NBOTNeighborhood Brief Observation Tool[39]USA200942
IMIIrvine–Minnesota Inventory[44]USA200788
S-VATSpotlight Virtual Audit Tool[45]HOL201418
COURAGECollaborative Research of AGEing i EU[46]EU201177
ANCActive Neighborhood Checklist[47]USA201372
SPACESSystematic Pedestrian and Cycling Environment Scan[51]AUS200255
EPOCHEnvironmental Profile of a Community Health[54]WW201477
PWAPath Walkability Assessment[25]MAL201866
WACWalkability Assessment Checklist[55]USA201078
SWEATSenior Walking Environment Audit Tool[56]CAN201151
IPAQInternational Physical activity Questionnaire[63]AUS20073
PWIPath Walkability Indicators[67]MAL201392
IPENInternational Physical Activity & Env. Network[69]WW201385
RSARoad Safety Audit[70]USA201856
PLOSPedestrian Level of Service[71]USA200138
GSWIGross Sidewalk Walkability Index[73]IND201356
PEDSPedestrian Environment Data Scan[74]USA200757
PEATPath Environment Audit Tool[76]USA200685
AAActive Accessibility[77]POR201672
FSIField Survey Instrument[78]USA200660
PARAPhysical Activity Resource Assessment[79]USA200518
AHPAnalytic Hierarchy Process[80]EU201073
UHTSUtah Household Travel Survey[81]USA201616
PEQIPedestrian Environment Quality Index[82]ITA2012105
PARKParks, Activity and Recreations among Kids[84]CAN201535
CUBESTChina Urban Built Environment Data Scan Tool[85]CHN201428
PERSPedestrian Environment Review System[86]UK201340
V-STEPSVirtual Systematic Tool for Evaluating Ped. Street.[87]CAN201943
APARSAudit of Physical Activity Resources for Seniors[88]USA201121
PANESPhysical Activity Neighborhood Environment Scale[89]USA201017
GRADGraduate Ready for Activity Daily[96]USA199910
EAPRSEnvironmental Assessment of Public Recreation Spaces[98]USA200619
WSIWalk Score Index[104]USA20076
SATSchool Audit Tool[105]UAE201930
PSQIPublic Space Quality Index[107]SG202026
T-WSIWalking Suitability Index for Territory[110]ITA202012
Abbreviations of the methodology names are derived from the initial letters of the full name of the methodology itself. Abbreviations of country names are given according to the international codes for the names of countries.
Table 2. List of relevant methodologies/instruments selected for the analysis—in general.
Abbrev.Collect. Meth.Level of Appl.UnitUsers Adjusted:AspectSubj./Obj.Qual./QuantReliability
PHOAThrMicA, SP, BW, BOQt***
SEIDThrMicSPWOQt, Ql**
NEWSFDC, QMicS, AP, BWSQt***
MAPSFDC, QMicS, A, PPPAOQl***
NBOTFDCMicSPW, BOQt**
IMIFDC, CKMicSPPOQt, Ql***
S-VATDDCMicSP, BPAOQt**
COURAGEThrMicSPPA, KOQl**
ANCFDCMicSPPOQl***
SPACESFDCMicSP, BPAS, OQl***
EPOCHFDCMicSPH, WS, O.Ql**
PWAThrMicSPTOQl**
WACFDC, CKMicSPBOQl**
SWEATFDCMicSPPOQl***
IPAQFDCMicSPHS, OQt, Ql**
PWIThrMacS, APW, TOQt**
IPENThrMacSPPA, W, TS, OQt***
RSAFDC, CKMicS, A, PP, BW, TOQt***
PLOSFDCMicSP, BWOQt***
GSWIThrMicSPWOQt**
PEDSFDC, CKMicSPW, BS, OQl***
PEATFDCMicSP, BWOQl*
AAThrMacSP, BW, TOQl*
FSIThrMacSPWOQl***
PARACKMacS, APPAOQt**
AHPThrMicS, P, APT, WOQl*
UHTSThrMicS, AP, BT, PA, WS/OQl*
PEQIFDC, CKMicS, APB, W, TOQt***
PARKFDCMicS, APPA, HOQl**
CUBESTFDCMicS, AP, BPA, WOQt***
PERSFDC, DDC, CKMicS, A, PPW, TOQt, Ql***
V-STEPSFDCMicSP, BW, TOQl***
APARSSMicSPPAOQt***
PANESQMicSP, BPA, WSQl**
GRADQMicSPPA, HOQt*
EAPRSFDCMicAPPASQl**
WSIDDCMIcSP, B OQl, Qt**
SATCKMicSPTOQl***
PSQIThrMicS, APPAOQl, Qt**
T-WSIFDCMicSPPASQl***
Collection method legend: Thr—Theoretical work; FDC—Field data collection; DDC—Digital data collection; CK—Checklist; Q—Questionnaire; S—Survey Level of application legend: Mic—Micro level; Mac—Macro level; Unit of analysis legend: Area/Segment/Point; Users Adjusted legend: P—Pedestrian; B—Bicyclist; Aspect: PA—Physical activity; W—Walking; B—Behavior; T—Transport walking; H—Health-oriented walking; Subjective/objective approach legend: S—Subjective; O—Objective; Type of assessment: Qt—Quantitative; Ql—Qualitative; Reliability level legend based on the ICC coefficient/IRR test/Kappa: *—Low; **—Moderate; ***—High.
Disclaimer/Publisher’s Note: The statements, opinions and data contained in all publications are solely those of the individual author(s) and contributor(s) and not of MDPI and/or the editor(s). MDPI and/or the editor(s) disclaim responsibility for any injury to people or property resulting from any ideas, methods, instructions or products referred to in the content.

