1. Introduction
Dust pollution has long been a significant environmental and occupational hazard problem in industrial and mining enterprises, and the associated health risks have become a critical concern [
1,
2,
3]. As a result, the development and application of dust suppression technologies have attracted much attention in recent years, and spray dust suppression technology, as one of the most commonly used methods for controlling dust, has received extensive research attention [
4,
5,
6]. The effectiveness of spray dust suppression technology is closely related to the atomization effect of the spray, which can be affected by various factors, such as nozzle parameters, including atomization angle and jet length [
7], spray angle [
8], and pressure [
9]. However, the influence of the physicochemical properties of the spray solution, such as surface tension and viscosity, on the atomization effect has received less attention.
Related studies have shown that surface tension and viscosity can significantly affect the collision and agglomeration behavior of droplets [
10,
11], which can alter the particle size and velocity distribution of droplets in the spray field and consequently affect the atomization effect. Compared to atomization, factors such as pressure, surface tension, and viscosity have a more significant impact on the atomization effect [
12,
13]. This is particularly significant in the context of spray dust suppression solutions, as many chemical surfactants have been applied to tackle the pollution problems caused by respirable and hydrophobic dust in recent years. These surfactants can change the surface tension and viscosity of the spray solution [
14,
15,
16], making it essential to investigate the influence of these properties on the atomization effect to improve dust suppression efficiency.
While some scholars have investigated the atomization effect of circular hydraulic nozzles for agricultural use [
17] and fan-shaped nozzles for scenic areas [
18], current research on the commonly used solid cone nozzles in industrial and mining enterprises is insufficient. Furthermore, few studies have examined the relationship between surface tension, viscosity, and the atomization effect of these nozzles, which is critical for understanding the mechanism of spray dust suppression and optimizing its effectiveness. Therefore, this study aims to investigate the influence of surface tension and viscosity on the atomization effect of solid cone nozzles to improve dust suppression efficiency.
In addition, various instruments and devices can be used to study the relationship between surface tension, viscosity, and atomization effect, including the Malvern laser particle size analyzer [
19], holographic particle velocity [
20], and image comparison methods [
21]. However, the Doppler particle size analyzer has become a highly recognized instrument that can improve testing accuracy and stability with the development of science and technology. Previous studies by Arnab [
22], Wang [
23], and Nuyttens [
24] using the PDPA have provided a theoretical basis for testing the size, velocity, and volume concentration of droplets in the spray field and have accurately processed the data using the PDPA system. This technique can be used to investigate the influence of surface tension and viscosity on the atomization effect of solid cone nozzles.
In response to the limitations identified in the aforementioned study, this study investigated the influence of surface tension and viscosity on the atomization effect of solid cone nozzles using a self-designed PDPA dust-mist coupling experimental system. The atomization principles were applied to adjust the fog field characteristics of solid cone nozzles to improve their dust reduction rate, providing guidance for effective dust reduction in industrial and mining enterprises.
2. Experimental Test Scheme
For this study, dust suppression solutions were prepared with varying surface tensions and viscosities, and an independent dust-mist coupling experimental system was constructed to observe atomization parameters. The experimental system mainly consists of the dust suppression solution, spray nozzle, and a PDPA test system [
25,
26].
2.1. Dust Suppression Solution Preparation
To better understand the relationship between changes in surface tension and viscosity and the atomization characteristics, as well as to achieve uniformity in the fog field and improve dust removal efficiency, we chose dodecyl alcohol as the preferred experimental test solution based on its wide application, dust suppression effect, and physical and chemical properties. Water was used as the test solution for the control experiment. The mass concentration of the dodecyl solution was set at 2.0% and 5.0%, respectively. The surface tension and viscosity of the dust suppression liquid were measured by the experimental equipment, as shown in
Figure 1, with the test environment temperature set at 25 °C and the humidity at 53% RH.
Based on the pre-test results, when the mass concentration of the dodecyl alcohol solution exceeds 5%, its surface tension is similar to that of water, making it unsuitable for comparative experiments with water. Additionally, its viscosity becomes too high, leading to suboptimal dust reduction through the spray and rendering the optimization of atomization effects meaningless. Therefore, the test solutions were selected within a viscosity range of 0.89 × 10⁻³ Pa·s to 1.46 × 10⁻³ Pa·s and a surface tension range of 33.6 mN·m−1 to 71.97 mN·m−1. The viscosity gradient is approximately 0.25 × 10⁻³ Pa·s, and the surface tension gradient is about 20 mN·m−1. Within this range, the surface tension and viscosity of the dust suppression solution can ensure stable spraying without causing nozzle clogging or damage. Moreover, it can be compared with water to systematically explore the relationship between the changes in surface tension and viscosity and the atomization effect.
2.2. Spray Nozzle Preparation
According to the atomization effect of the pre-test and the stability of the nozzle, a solid cone nozzle [
27,
28] (Taiwan Shaxun TW2010A, Keliying Company, Guangzhou, China) was selected. Its internal structure and injection characteristics are shown in
Figure 2.
The sprayer model used in this study is JDT-12A (Redaiyulin Company, Shantou, China), and the experimental pressure is 6 MPa. The study focuses on investigating the axial and radial sizes and velocities of droplets, as well as the development process of the fog field after the solution is sprayed. As depicted in
Figure 2, the nozzle atomizes twice to generate a fog field, where the droplets move and collide, fusing and breaking under the influence of surface tension and viscosity.
2.3. PDPA Test Experimental System
The PDPA test system mainly comprises a PDPA tester (TSI corporation, 500 Cardigan Road, Shoreview, MN 55126, USA), a high-pressure spray system, and a closed spray field system, which is shown in
Figure 3.
The PDPA tester is composed of two solid-state lasers that generate three groups of lasers with different frequencies [
29]. These lasers are dark green (532 nm), yellow (561 nm), and light green (553 nm). The tester employs a laser beam to irradiate the droplets in the droplet flow and captures parameter information such as the droplet size and velocity of the droplets by detecting the reflection of the droplets on the laser beam and the scattered light signals. After receiving the feedback signal, the transmitting device feeds back the signal source to the receiving sensor of the device and uploads the signal to the data system. This process measures the three-dimensional droplet velocity and size of the dust suppression solution in the spray field in a non-contact manner [
30,
31,
32,
33]. The basic parameters of the PDPA tester are illustrated in
Figure 3.
To reduce the influence of gravity and wind flow on the atomization effect, the nozzles were arranged vertically on the ground. The fog field measurement coordinate system was established with the nozzle as the origin, as shown in
Figure 4. In the coordinate system, the Z-axis was perpendicular to the ground, and the X-axis was parallel to the ground. The Z-axis measurement point was calculated from the origin, and the step distance was 20 mm. The X-axis measurement point was centered on the Z-axis origin, and the step distance was 20 mm. To obtain a stable amount of data and ensure the reliability of later data processing, the amount of data collected at each measuring point was not less than 10,000 [
34]. The location of the fog field measuring point was represented by the black point in
Figure 4.
Diameter Count, Diameter, Time, and
Vx,
Vy, and
Vz can be obtained by the data acquisition system of the PDPA tester, as shown in
Figure 5.
Diameter Count is the drop count; Diameter is the droplet size; Time is the instantaneous time when the system collects the droplets; Vx is the velocity value in the X-axis direction.
During the experimental process, the prepared solution was sprayed into the PDPA experimental chamber through a spray system to form a stable fog field. The PDPA sampling points were adjusted to the origin according to the above-mentioned arrangement of the fog field for measurement, and the atomization parameters of each measuring point in the fog field were tested sequentially according to the step size.
3. Experimental Data Processing Method
In this experiment, we measured the droplet size and velocity of a spray field under different surface tensions and viscosities. The supporting data software system was used to collect the original experimental data, such as real-time droplet size and three-dimensional velocity of droplets. To conduct a scientific analysis and comparison of the large volume of data collected, the Sauter Mean Diameter (SMD) method was selected to analyze the original data. The SMD calculation formula is expressed as follows [
35,
36]:
where SMD is the Sauter Mean Diameter,
V is the volume frequency of droplets,
D is the droplet diameter, and Σ represents the summation of data. This method provides an accurate and reliable way to analyze the data obtained from the experiment and helps to explore the relationship between surface tension and viscosity and the atomization efficiency of solid cone nozzles.
The original velocity
,
, and
are analyzed and processed by the transformation matrix method to obtain
,
, and
test data, and the transformation matrix is as follows:
With the data collection method described above, we experimentally measured the droplet size and velocity at 9 measuring points in the axial section of the spray field (X = 0 cm), 9 measuring points in the radial section of the spray field (Z = 15 cm), and 56 other measuring points in the spray field space. These measurements were taken to obtain a comprehensive understanding of the atomization efficiency and the distribution of droplets in the spray field under different surface tensions and viscosities.
When analyzing the impact of surface tension and viscosity on the atomization process, the primary approach involves the application of fluid mechanics and behavior theories. Research findings indicate that during the atomization process, spray droplets are primarily influenced by surface tension, viscous forces, inertial forces, gravity, and gas resistance [
37]. The balance equation for the comprehensive force acting on the droplet is expressed in Equation (3):
where
is surface tension force,
is viscous force,
is inertial force,
is gravity,
is gas resistance,
m is the mass of the droplet, and
is the acceleration of the droplet.
In the case of surfactant solution, the droplets formed by atomization have small droplet size and high dispersion, leading to the negligible effects of gravity and gas resistance during the spraying process. The relationship between viscous force and inertial force follows the Reynolds dimensionless constant, which can be expressed as Equation (2):
where
is the Reynolds number,
is the density of the liquid,
is the velocity of the droplet,
is the diameter of the droplet, and
is the viscosity coefficient of the liquid.
According to the molecular dynamics theory, the dynamic viscosity coefficient is as follows:
where
is the average velocity of molecules, and
is the average free path of molecules.
Substituting Equation (3) into Equation (2), Equation (4) is obtained.
During the atomization process, the droplet size is much smaller than the characteristic length, resulting in a low Reynolds number (Re). In the process of surfactant atomization, the effect of viscous force is much greater than that of inertial force due to the low Re value. Therefore, the surface tension and viscous force have a significant impact on the velocity and particle size of the droplets, playing a dominant role in the formation of the fog field.
4. Experimental Results and Discussion
4.1. Droplet Size and Velocity Distribution on Axis Direction
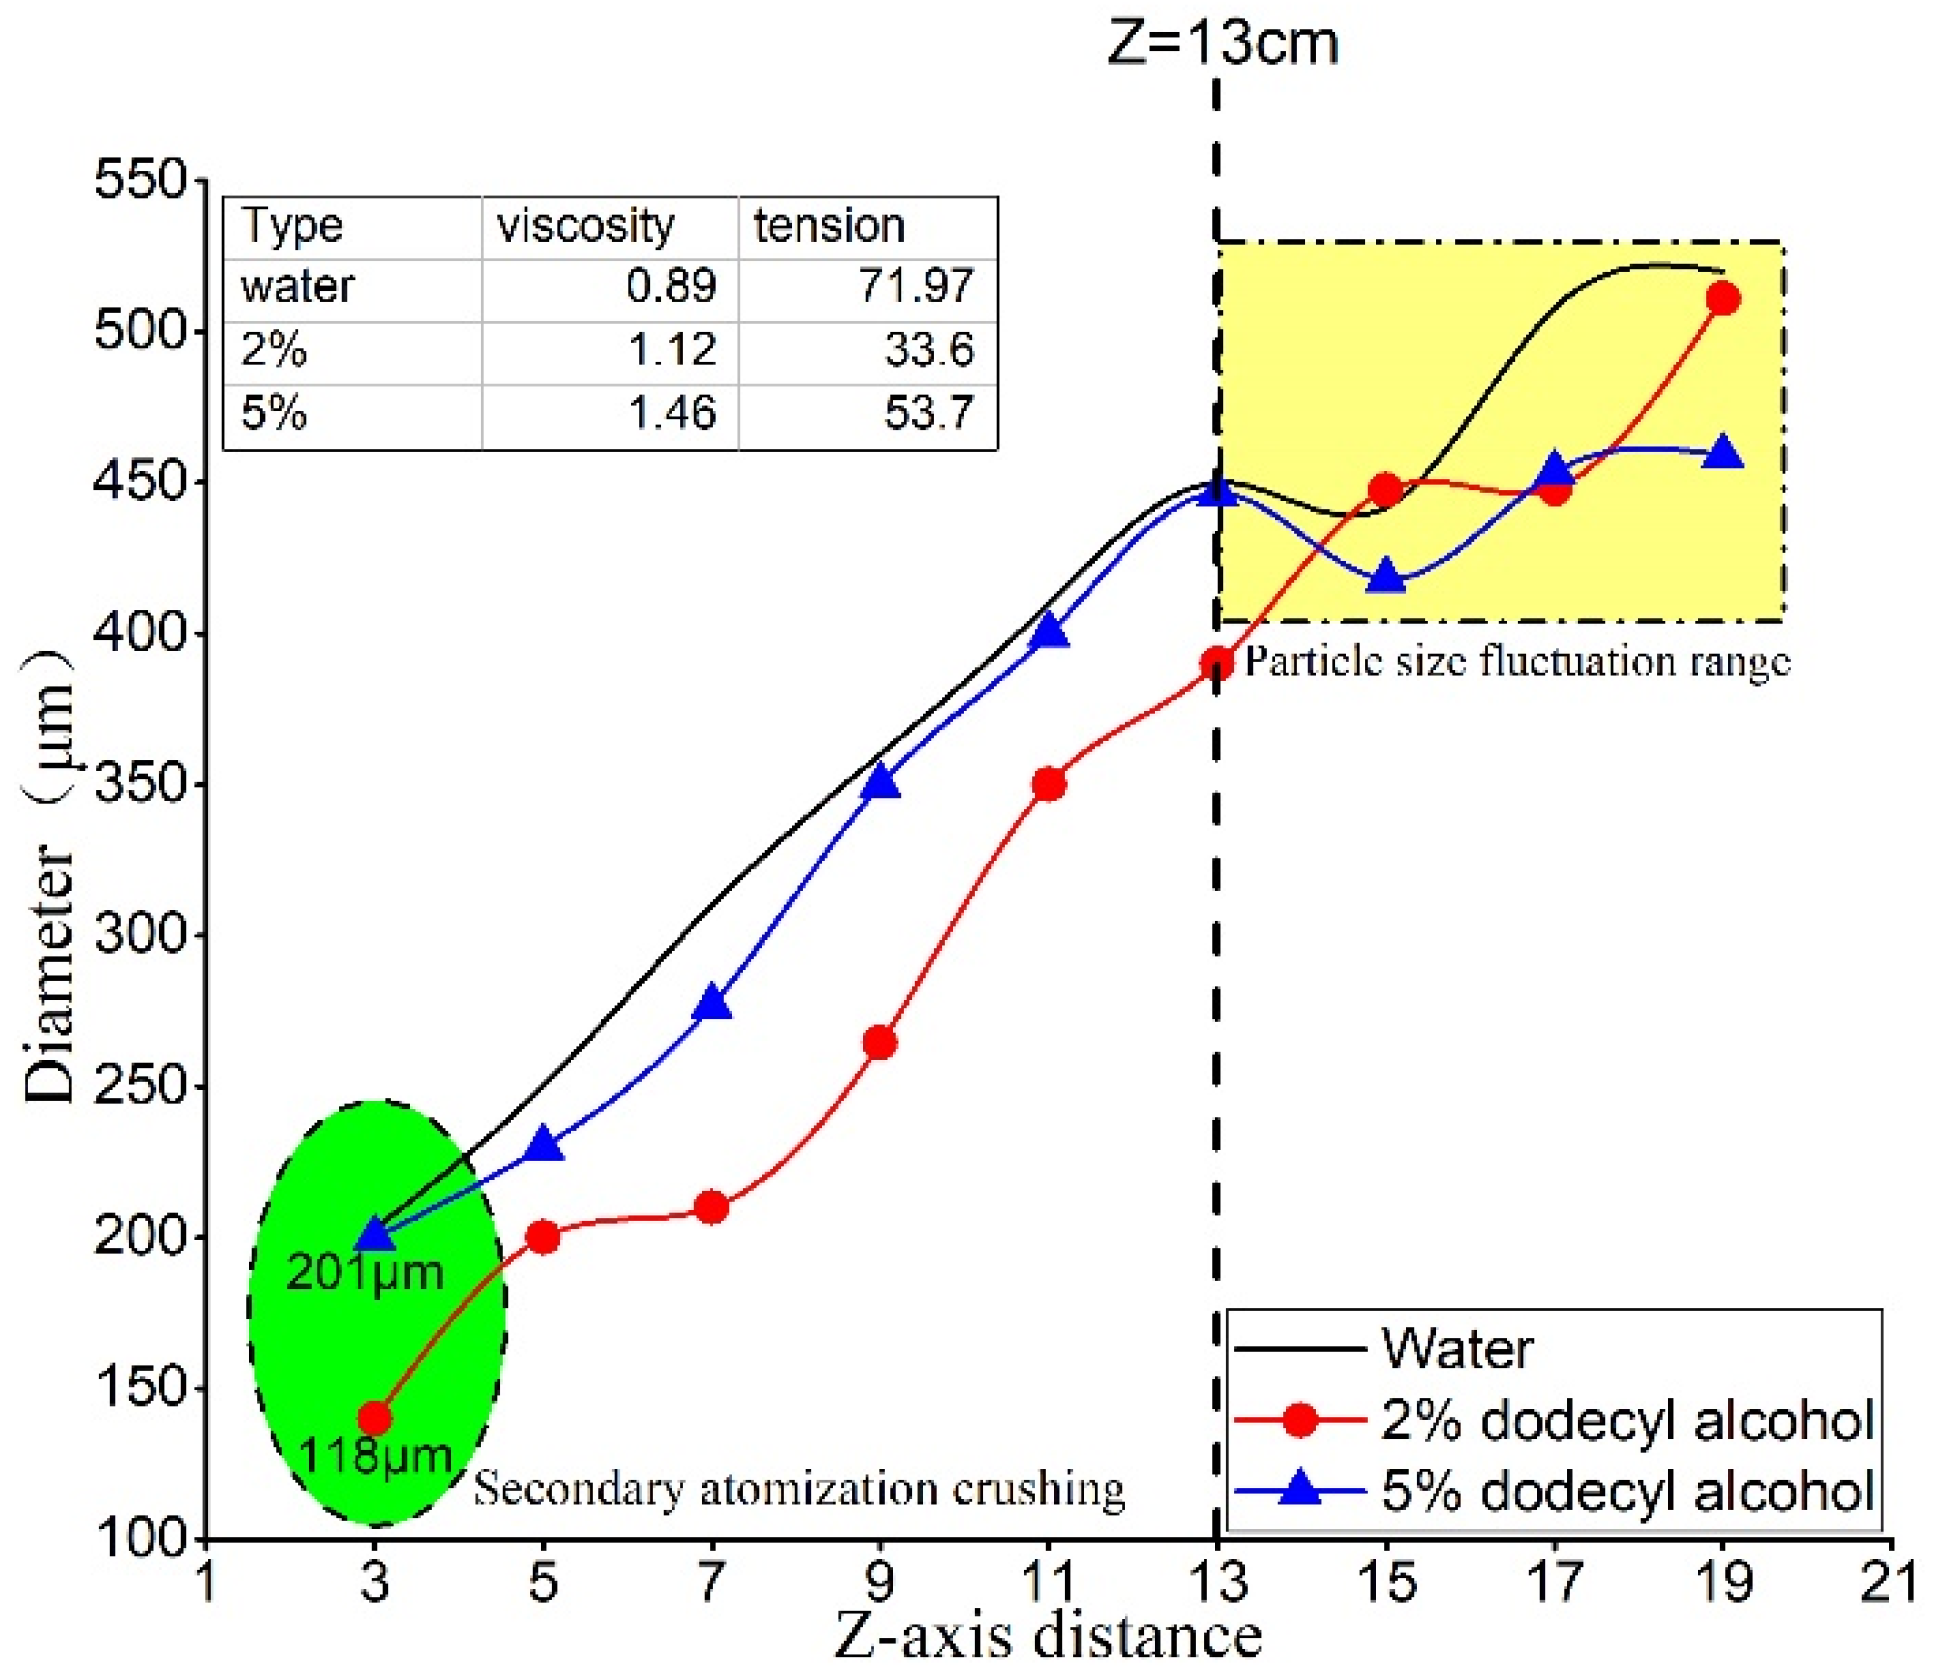
The impact of surface tension and viscosity on axis droplets can be assessed by analyzing the droplet velocity and size at nine different points along the axis of the fog field, ranging from Z = 3 cm to Z = 19 cm. The relationship between surface tension, viscosity, and droplet size is presented in
Figure 6.
The results shown in
Figure 6 reveal that the droplet size of the tested dust suppression solution increases steadily and continuously from Z = 3 cm to Z = 13 cm, and the increasing rates of droplet size for all three types of droplets exceed 100%. Specifically, the 2% dodecyl alcohol solution has the smallest droplet size, while the droplet size difference between 5% dodecyl alcohol and pure water solution is not significant. Decreasing the surface tension (approximately every decrease of 20 mN·m
−1) tends to make the droplet size smaller while increasing the viscosity (approximately every increase of 0.25 × 10
−3 Pa·s) tends to make the droplet size larger. In the axial direction, although the surface tension of the 5% dodecyl solution relative to water decreased by 25.4% and the viscosity increased by 64%, the droplet size did not change significantly. Therefore, to optimize the atomization effect, a small reduction in surface tension can effectively decrease the droplet size, while a large adjustment in viscosity is required to increase the droplet size. Moreover, in the axial direction, adjusting surface tension appears to be more effective than adjusting viscosity.
The droplet sizes of the three solutions fluctuated between Z = 13 cm and Z = 19 cm, where the surface tension increased from 33.6 mN·m−1 to 71.97 mN·m−1 and the viscosity increased from 0.89 × 10⁻³ Pa·s to 1.46 × 10⁻³ Pa·s. However, no significant difference in droplet size was observed within this range. This interval is located at the edge of the fog zone, and the changes in droplet size are less affected by surface tension and viscosity.
The velocity changes of droplets with different dust suppression solutions are presented in
Figure 7. It is observed that the droplet velocity gradually decreases from Z = 3 cm to Z = 13 cm along the axial direction. At Z = 3 cm, the droplet velocity of the 2% dodecyl alcohol solution with the smallest surface tension reaches 12.8 m/s, which is twice that of water. As compared to the 2% dodecyl alcohol solution, the droplet velocity of the 5% dodecyl alcohol solution decreases by 34.0%, with an increase of 30.4% in viscosity. This is due to the fact that the kinetic energy generated by the atomized droplets at the nozzle outlet is higher than the surface tension energy, which causes the droplets to continue breaking up and forming droplets with higher velocity. However, with the increase of viscosity, the viscous interaction between the broken droplets increases, resulting in velocity attenuation and increased particle size, which is consistent with the trend observed in
Figure 6.
Between Z = 13 cm and Z = 19 cm, the droplet velocity of dodecyl alcohol solution and pure water did not show a significant difference; instead, it remained in a fluctuating state. This is mainly due to the location of this interval, which is at the edge of the fog field, where droplets are more susceptible to environmental factors, resulting in the weakening of the influence of surface tension and viscosity on the atomized droplets.
Based on the above discussion, it can be concluded that in the range of Z = 3 cm to Z = 13 cm, the droplet size is the smallest, and the velocity is the largest when the surface tension is 33.6 mN·m−1 and the viscosity is 1.12 × 10⁻³ Pa·s. In the interval from Z = 13 cm to Z = 19 cm, there is no significant difference in droplet velocity and size among the three solutions, and they are in a fluctuating state. Changes in surface tension and viscosity within the core atomization region (Z = 3 cm to Z = 13 cm) can significantly affect droplet velocity and size. Near the nozzle (Z = 3 cm), viscosity has a more significant effect on droplet size and velocity than surface tension. In the edge region of atomization, neither viscosity nor surface tension have significant effects.
4.2. Droplet Size and Velocity Distribution on Radial Direction
Based on the analysis of the surface tension and viscosity change in the axial direction, this study further investigates the effect of these factors on droplet size in the radial direction. The Z = 15 cm section was selected for analysis and discussion due to its section position, data amount, and quality.
Figure 8 shows the variation of droplet size in the radial direction under different surface tension and viscosity conditions.
As shown in
Figure 8, the droplet size exhibits two stages of change as the radial distance increases. The first stage occurs between X = |0| cm and X = |4| cm, during which the droplet size increases rapidly. This phenomenon can be attributed to two reasons. First, droplets with lower surface tension at the center of the radial section are more prone to breaking, forming high-speed small droplets due to the impact of internal energy. However, due to increased viscosity, these droplets are more likely to collide with surrounding droplets during radial movement, forming larger droplets. Second, during the radial expansion of droplets, heat exchange occurs between high-viscosity droplets, resulting in inelastic collisions and rapid droplet size increase. During the diffusion process, the surface tension of 2% dodecyl alcohol solution was 38.37 mN·m
−1 lower than that of pure water, the viscosity increased by 0.23 × 10
−3 Pa·s, and the droplet size increased by 70 μm. Thus, the interplay between surface tension and viscosity causes a rapid droplet size increase during radial movement.
The second stage of droplet size change occurs between X = |4| cm and X = |8| cm, during which the droplet size increases slowly. The droplet size of the dodecyl solution at X = |4| cm was not significantly different from that of pure water. In this stage, changes in surface tension and viscosity had no significant effect on droplet velocity. It can be seen that in the process of optimizing the fog field, the surface tension should be properly reduced to keep the droplet at the radial center with a smaller droplet size. At the same time, it is necessary to reduce the viscosity of the dust suppression solution so that the droplets increase steadily in the first radial expansion process and smoothly transition to the second stage so that the fog field maintains a large coverage area and uniform droplet size distribution.
The variation of radial droplet velocity is depicted in
Figure 9, which shows a two-stage change, with the first rapid decline followed by a slow decline. The velocity of the dust suppression solution reaches 0 m/s at X= |8| cm, which is due to the balance of surface tension, viscous force, inertial force, and air resistance of the droplet at the edge of the fog field, leading to slow droplet movement only under the influence of gravity. Between X = 0 cm and X = |2| cm, the droplet velocity of 2% dodecyl solution reduces by 53%, and that of 5% dodecyl solution reduces by 51%, with a much higher droplet velocity reduction rate of dust suppression solution compared to pure water. This indicates that the velocity of high-viscosity droplets drops faster during the change of radial expansion. Combining the analysis of
Figure 8, it can be inferred that, in the process of optimizing the fog field, reducing surface tension can ensure small droplet size and large velocity at the radial center while reducing viscosity can prevent sudden changes in droplet size and velocity during radial expansion.
4.3. Joint Distribution Law of Droplet Size and Velocity
The atomization process of the spray mist field is divided into five stages [
13,
38,
39], as shown in
Figure 10a. After conducting measurements and processing data from measuring points in the fog field, the influence of surface tension and viscosity of the dust suppression liquid on the overall distribution of the fog field was analyzed, and the results are presented in
Figure 10.
Figure 10a is a legend diagram, while
Figure 10b–d are the development diagrams of pure water, 2% dodecyl alcohol, and 5% dodecyl alcohol fog fields, respectively. The color variation in the figure indicates the speed of the droplet, and the size of the colored sphere in the figure indicates the diameter of the droplet.
Figure 10b shows that the droplet size of pure water increases from 336 μm to 450 μm at Z = 11 cm, indicating an increase of 33.9%. The droplet velocity also decreased from 5.02 m/s to 3.22 m/s, a drop of 35.8%. The droplet size and velocity expansion phase occurred at Z = 11 cm. The particle size and velocity of pure water droplets were stable between Z = 15 cm and Z = 17 cm. The droplet size and velocity expansion phase of the 2% dodecyl solution was between Z = 9 cm and Z = 11 cm, and the droplet size and velocity stabilization phase lasted between Z = 11 cm and Z = 15 cm. Compared with pure water, the 2% lauryl alcohol solution had an earlier expansion period and a more continuous stable period. The droplet size and velocity expansion phase of the 5% dodecyl solution were the same as that of the 2% dodecyl solution, but the droplet size and velocity stabilization phase were more continuous, ranging from Z = 11 cm to Z = 17 cm. The comparative analysis shows that the droplet size and velocity expansion period are closer to the nozzle when the surface tension is 33.6 mN·m
−1 (the smallest among the three solutions), and the stable region is more continuous when the viscosity is 1.12 × 10
−3 Pa·s (the largest among the three solutions).
5. Dust Suppression Experiment
By varying the surface tension and viscosity of the spray solution, the atomization effect of the solid cone nozzle can be observed under different conditions. However, we need to explore how to reduce the dust by optimizing the spray parameters. Therefore, measuring the dust removal rate in the experiment can provide a practical reference for application, further demonstrating the significant impact of surface tension and viscosity changes on spray dust removal. This can provide practical guidance for industrial and mining industries. The corresponding dust-fall rates are displayed in
Table 1.
The above table shows that the dust reduction rate of dodecyl alcohol solution is higher than that of pure water. As the surface tension decreases from 71.97 mN·m−1 to 33.60 mN·m−1 and the viscosity increases from 0.89 × 10⁻³ Pa·s to 1.12 × 10⁻³ Pa·s, the rate of dust suppression increases. The distribution characteristics of the fog field indicate that the reduction of surface tension causes the expansion region of the droplet to be closer to the nozzle, while the increase of viscosity makes the stable region of the droplet more continuous. This leads to more uniform droplet size and velocity distribution in the fog field, resulting in an improvement in the dust suppression rate. In comparison with the dust fall rate of full dust and respirable dust, the dust reduction rate of total dust using 2% dodecyl alcohol solution is 13.58% higher than that of pure water, while the dust reduction rate of respirable dust is 17.67% higher than that of pure water. Under the same working conditions, changing the surface tension and viscosity can more significantly affect the dust fall rate of respirable dust.


