Article

A New Model to Calculate Contributions of the Distributed Power

1
School of Mechanical and Electrical Engineering, Tan Kah Kee College, Xiamen University, Zhangzhou 361005, China
2
Department of Electrical Engineering, National Kaohsiung University of Sciences and Technology, Kaohsiung City 807618, Taiwan
*
Author to whom correspondence should be addressed.
Appl. Sci. 2023, 13(7), 4524; https://doi.org/10.3390/app13074524
Submission received: 7 March 2023 / Revised: 27 March 2023 / Accepted: 30 March 2023 / Published: 3 April 2023

Abstract

:
Besides metering, a more transparent load with known power distribution is valuable to draft energy strategies, especially in a deregulated power market. Thus, the usage-of-transmission can be considered properly. There are many studies published on related subjects and every research tried to solve a particular part of the problem. There are three basic categories for discussing power distributions: (i) the real power distribution, (ii) the reactive power distribution, and (iii) the loss allocation. These categories were very often treated separately, with the mutual coupling terms, counter flows, and line charging largely neglected. However, we know that these entities are non-separable. These are inter-related entities; the change of one entity will cause the change to every other entity. A good method should consider these entities altogether, while satisfying all electrical theories. This study developed a method to solve the above problem, with all electrical entities solved, satisfying all electrical circuit theories. With several matrix formulations, this method is capable of solving and tracing all electrical entities, including the current flow, the real and reactive power, the counter flow, and the couplings between the active and reactive power. The algorithm can also allocate power distributions and loss among participants effectively. Besides, a line usage idea is formed to allocate the loss to each generator, where counter flows are not necessarily penalized. It can be awarded sometimes. The idea can integrate with the existent tariffs in a deregulated market.

1. Introduction

Transparency is one of the most important measures of the open access network in the deregulated environment. Besides metering, a more transparent load with known power distribution is valuable to draft energy strategies. The network company or ISO needs to allocate the total cost of transmission among all electrical users in an equitable and non-discriminatory manner, which also provides a correct, market-based economical signal to all participants timely, especially when the volatile green power is gaining its position in the climate changing environment.
There are many studies dealing with related subjects [1,2,3,4,5,6,7,8,9,10,11,12,13,14,15,16,17,18,19,20,21,22,23,24,25,26,27,28,29,30,31,32,33,34,35,36,37,38,39,40,41]. Three basic categories can be used to classify the power distributions: (i) the real power distribution, (ii) the reactive power distribution, and (iii) the loss allocation. Refs. [3,4,5,6,7,8,9,10,11,12,14] traced the contributions of generators and line flows based on a solved power flow and proportional sharing assumption. As pointed out in [42], the proportional assumption with contribution factors lacks the theoretical proof for correctness and physical justification. In [18,19,20,21,22], the authors used the state graph concept to represent the network structure according to line flow directions, based on the topological analysis with the sink/source concept, where the power was presumed to flow in one direction only. In [20,23], currents were used to determine the active and reactive power contributions and the loss was also allocated. Many studies focused on the loss issue [1,24,25,26], with simplifications used such as the Taylor series, quadratic loss formula, postage stamps, and B-coefficients. Simplifying by omitting other factors usually leads to errors. Optimization methods, game theory, and artificial intelligence, such as neural networks, were also used in loss allocation [27,28,29,30,31,32], where we can see that the inherited problems of combinatorial optimization, increasing of problem size, overfitting, and the complicated training data preparations will be involved.
Reactive power also plays an important role. With the reactive power being usually highly restrained than the active power, the contributions were approximated on the basis of active flows or very often neglected [2,15,18,19]. Refs. [1,16,17] discussed the reactive flow tracing by using the same concept as the active power. Contribution factors with proportional sharing were used in [3,4,5,6,7,8,9,10,11,12,14], with inherited problems as indicated in [43]. OPF based methods with marginal cost were also adopted in [33,34,35,36,37,38,39]. Regardless of the number of the many studies published, studying only the reactive power itself means lacking of active power considerations, further accompanied by omission of mutual couplings.
Counter flow is another issue where the flow component goes in the opposite direction of the net flow. Some theorems discussed this issue from a cost viewpoint, which insisted that counter flows pay for the cost and the toll even if the network congestion is involved. In tracing methods using the direct current (DC) flow model, the counter flows were not even considered. However, examining the contributions in relieving the congestion and postponing the system reinforcement, counter flows should be properly rewarded [40,41].
As discussed above, every method tried to cover the problem from a particular angle, while a good method should cover the whole story. The real power, reactive power, mutual coupling terms, the loss, and the counter flows are all interrelated electrical components, and are mutually bundled and non-separable. Any separation by focusing on one issue will create error. A good method should consider these components altogether, and satisfy all electrical theories. That is, a good method should be able to solve the real power, the reactive power, mutual coupling terms, the loss, and the counter flows altogether, so the inter-relationship can remain intact without variations. The basic circuit theory and power balance theory could be satisfied over the whole network. In this study, a method is developed to solve the above problem. The method is based on a converged AC load flow with several matrix formulations, where all electrical components can be solved and decomposed, including the flow, the loss, the mutual couplings, and the counter flows, and the flow can be traced from any direction of this network. Furthermore, to make the derivation more complete, the transmission line charging was also considered in this study. Mathematical models were derived without using any optimization, any graphic reasoning, or heuristics. Test systems were presented to verify the proposed approach, and the results show satisfaction of all theories and inter-relationships. All power sources can be analyzed including distributed small generators or green power. Besides, a line usage concept is proposed to allocate the loss where counter flow may be sometimes encouraged or rewarded in reducing the transmission loss, i.e., to avoid overload. The method can be integrated with the existent tariffs in a deregulated market.

2. Forward and Backward Contribution Matrix

The proposed method is based on a converged AC load flow solution with all network parameters. Matrix formulations are used to describe the relationships among various variables.

2.1. Bus Current and Bus Power

For a power network, the bus voltage and bus injection-current can be written in the rectangular form as V ¯ i = e i + j f i and I ¯ i = I i , R + j I i , I . Let S i ¯ = p i + j q i be the complex-power injection of bus i. The equivalent-current-injection for real and imaginary current on bus k can be calculated by:
I ¯ k = I k , R + j I k , I = ( S ¯ k V ¯ k ) = ( p k + j q k e k + j f k )
where p k and q k are the active and reactive power injections on bus k. Equation (1) can be also calculated by:
I k , R = e k e k 2 + f k 2 p i + f k e k 2 + f k 2 q k I k , I = f k e k 2 + f k 2 p k + e k e k 2 + f k 2 q k
For a network, all above elements can be found from the converged AC load flow solution. For a N-bus system, Equation (2) can be written in the matrix form as:
[ I R I I ] 2 N × 1 = [ T ] 2 N × 2 N [ P Q ] 2 N × 1 = [ T 1 | T 2 T 3 | T 4 ] 2 N × 2 N [ P Q ] 2 N × 1
where
T 1 , i j = { e i e i 2 + f i 2 , f o r   d i a g o n a l   t e r m s 0 , o t h e r s
T 2 , i j = { f i e i 2 + f i 2 , f o r   d i a g o n a l   t e r m s 0 , o t h e r s
T 3 , i j = { f i e i 2 + f i 2 , f o r   d i a g o n a l   t e r m s 0 , o t h e r s
T 4 , i j = { e i e i 2 + f i 2 , f o r   d i a g o n a l   t e r m s 0 , o t h e r s

2.2. Line Current and Line Power

Let a transmission line with line charging be represented by a π-model, as shown in Figure 1.
With Iij,R, Iij,I being the real and imaginary parts of current Iij, the “forward” line current Iij can be defined for the flow from i to j as:
I ¯ i j = I i j , R + j I i j , I = ( Y ¯ i j + j b c ) V ¯ i Y ¯ i j V ¯ j = [ g i j e i g i j e j ( b i j + b c ) f i + b i j f j ] + j [ ( b i j + b c ) e i b i j e j + g i j f i g i j f j ]
where Yij is the line admittance with parameters gij and bij, and bc is the shunt line charging susceptance. The rectangular axis current form was used by the authors in developing a Jacobian framework with very effective power flow solutions [43,44]. Using vector I l i n e f for the forward line current Iij, and E and F for the real and imaginary vectors of bus voltages, we have the matrix form for an M-line section and N-Bus network:
[ I l i n e , R f I l i n e , I f ] 2 M × 1 = [ Y c f ] 2 M × 2 N [ V ] 2 N × 1 = [ Y c , G f | Y c , B f Y c , B f | Y c , G f ] 2 M × 2 N [ E F ] 2 N × 1
where Yc is the original admittance matrix.
Similarly, the current from bus j to i, Iji, is defined as the “backward” current. Note that it is not equal to Iij when the shunt element is considered. A similar matrix can be written for the backward current by:
[ I l i n e , R b I l i n e , I b ] 2 M × 1 = [ Y c b ] 2 M × 2 N [ V ] 2 N × 1 = [ Y c , G b | Y c , B b Y c , B b | Y c , G b ] 2 M × 2 N [ E F ] 2 N × 1
For the m t h line, the forward and backward power flow can be found by:
S i j ¯ = P i j + j Q i j = V ¯ i I ¯ i j * = ( e i + j f i ) ( I i j , R + j I i j , I ) = ( e i I i j , R + f i I i j , I ) + j ( f i I i j , R e i I i j , I )
S j i ¯ = P j i + j Q j i = V ¯ j I ¯ j i * = ( e j + j f j ) ( I j i , R + j I j i , I ) = ( e j I j i , R + f j I j i , I ) + j ( f j I j i , R e j I j i , I )
where Pij and Qij are called the “forward” active and reactive power flow, while Pji and Qji are the “backward” active and reactive line power flow, and the “forward” or “backward” direction can be chosen arbitrarily. The matrix form of Equations (7) and (8), i.e., the line power for the M-line section network, can now be formulated by:
[ P l i n e f Q l i n e f ] 2 M × 1 = [ H f ] 2 M × 2 M [ I l i n e , R f I l i n e , I f ] 2 M × 1 = [ E f | F f F f | E f ] 2 M × 2 M [ I l i n e , R f I l i n e , I f ] 2 M × 1
[ P l i n e b Q l i n e b ] 2 M × 1 = [ H b ] 2 M × 2 M [ I l i n e , R b I l i n e , I b ] 2 M × 1 = [ E b | F b F b | E b ] 2 M × 2 M [ I l i n e , R b I l i n e , I b ] 2 M × 1
where [ H f ] [ H b ] , [ E f ] [ E b ] and [ F f ] [ F b ] .

2.3. Line Power and Bus Voltage

Substituting Equation (5) into (9), we can see the relationships of bus voltage to the “forward” line flows by:
[ P l i n e f Q l i n e f ] 2 M × 1 = [ H f ] 2 M × 2 M [ Y c f ] 2 M × 2 N [ E F ] 2 N × 1
Similarly, using Equations (6) and (10) to find the relationships of bus voltage to the “backward” line flow:
[ P l i n e b Q l i n e b ] 2 M × 1 = [ H b ] 2 M × 2 M [ Y c b ] 2 M × 2 N [ E F ] 2 N × 1

2.4. Load Admittance Conversion

Now, we will use current injection instead of power injection for the N-bus converged AC load flow. With the equivalent current injection [ I ¯ o r i ] , the solved AC network can be represented by:
[ I ¯ o r i ] N × 1 = [ Y ¯ o r i ] N × N [ V ¯ s o l ] N × 1
where [ Y ¯ o r i ] is the original admittance matrix of the system and [ V ¯ s o l ] is the solution of bus voltage vector. Note that [ I ¯ o r i ] is the equivalent current injections of both the generator buses and load buses. The “equivalent load-admittance” for load bus i, y i i l , will be extracted from the original current injection by:
I ¯ i o r i = ( S ¯ i V ¯ i s o l ) * = p i j q i ( V ¯ i s o l ) = p i j q i V ¯ i s o l ( V ¯ i s o l ) × V ¯ i s o l = y i i l V ¯ i s o l ,   i L o a d
where Load is the set of load buses, and the “equivalent load-admittance” of bus i can be found as shown in Figure 2 from:
y i i l = p i j q i | V ¯ i s o l | 2
With the conversion of load into admittance y i i l , an N × N matrix can be created for the load currents as:
[ I ¯ o r i , l ] N × 1 = [ Y ¯ l ] N × N [ V ¯ s o l ] N × 1
where [ Y ¯ l ] is a diagonal matrix with:
y i j l = { y i i l , j = i   a n d   i L o a d 0 , j = i   a n d   i L o a d
Thus, new matrix representation for [ I ¯ o r i , l ] can be found.
By separating the load current vector from the original current injection vector, [ I ¯ o r i ] , we have:
[ I ¯ o r i ] = [ I ¯ mod ] + [ I ¯ o r i , l ]
That is:
[ I ¯ mod ] = [ I ¯ o r i ] [ I ¯ o r i , l ] = [ Y ¯ o r i ] [ V ¯ s o l ] [ Y ¯ l ] [ V ¯ s o l ] = [ Y ¯ mod ] [ V ¯ s o l ]
with
y i j mod = { y i i o r i y i i l , j = i   a n d   i L o a d y i i o r i , j = i   a n d   i L o a d y i j o r i , i j
where the diagonal elements of [ Y ¯ mod ] corresponding to the load buses are modified by subtracting the equivalent load admittances from the original admittance, i.e., the current injection becomes zero for the load bus. Only the current injections of generators are left in [ I ¯ mod ] of Equation (16). Power flow solution (13) written with equivalent-injection-current is now:
[ I R mod I I mod ] 2 N × 1 = [ Y G | Y B Y B | Y G ] 2 N × 2 N [ E s o l F s o l ] 2 N × 1
where [ Y G ] is the real part of [ Y ¯ mod ] and [ Y B ] is the imaginary part of [ Y ¯ mod ] .
By inverting Equation (17), we have:
[ E s o l - - - F s o l ] 2 N × 1 = [ J ] 2 N × 2 N [ I mod ] 2 N × 1 = [ J 1 | J 2 J 3 | J 4 ] 2 N × 2 N [ I R mod I I mod ] 2 N × 1
where
[ J 1 | J 2 J 3 | J 4 ] 2 N × 2 N = [ Y G | Y B Y B | Y G ] 2 N × 2 N 1
According to Equation (3), the current injection of generators [ I ¯ mod ] originated from power injection can also be written as:
[ I R mod I I mod ] 2 N × 1 = [ T ] 2 N × 2 N [ P mod Q mod ] 2 N × 1
where
P g mod = { p g , g G 0 , o t h e r w i s e
Q g mod = { q g , g G 0 , o t h e r w i s e
and G is the set of all generators.
From Equations (18) and (19), we can see that, for the base case power flow solution, we have the relationship between the bus voltage solutions and the generator power injections as:
[ E s o l F s o l ] 2 N × 1 = [ J ] 2 N × 2 N [ T ] 2 N × 2 N [ P mod Q mod ] 2 N × 1

2.5. Line Power and Bus Power Contribution Matrix

Substituting Equation (20) into (11), we have the “forward” line power flow contribution from the generator power as in Equation (21), and using Equations (20) and (12), we can find “backward” line power flow contribution from generator power in Equation (22). We have:
[ P l i n e f Q l i n e f ] 2 M × 1 = [ D f ] 2 M × 2 N [ P mod Q mod ] 2 N × 1 = [ D 1 f | D 2 f D 3 f | D 4 f ] 2 M × 2 N [ P mod Q mod ] 2 N × 1
[ P l i n e b Q l i n e b ] 2 M × 1 = [ D b ] 2 M × 2 N [ P mod Q mod ] 2 N × 1 = [ D 1 b | D 2 b D 3 b | D 4 b ] 2 M × 2 N [ P mod Q mod ] 2 N × 1
where
[ D f ] = [ H f ] [ Y c f ] [ J ] [ T ]
[ D b ] = [ H b ] [ Y c b ] [ J ] [ T ]
are called the “forward contribution matrix” (FCM) and “backward contribution matrix” (BCM), respectively.

3. Tracing the Real and Reactive Power Flow

3.1. Line Power Flow Tracing

With FCM and BCM determined, we can now find the “forward” active and reactive power flows traced back to the gth generator on a particular kth line section by:
p k f , g = d 1 , k g f p g + d 2 , k g f q g
q k f , g = d 3 , k g f p g + d 4 , k g f q g
k = 1 , , M ,   g G
where d i , k g f is the element of the kth row and gth column of the submatrix D i f of FCM, d 1 , k g f and d 3 , k g f are contribution factors of the gth active power generation to the active and reactive flows on a particular kth line section, d 2 , k g f and d 4 , k g f are contribution factors of the gth reactive power generation to the active and reactive line flows on the kth line section, and d 2 , k g f and d 3 , k g f show the coupling-contribution among the active/reactive power generations and reactive/active line flows. The converged line flows of the load flow program can be shown as the summation of individual generator contributions by:
p k f + j q k f = g G p k f , g + j ( g G q k f , g )
p k b + j q k b = g G p k b , g + j ( g G q k b , g )

3.2. Load Contribution Tracing

Now, we have a mathematical formulation for not only the generator’s active power tracing but also the reactive power. Besides, with load converted into a branch equivalent circuit, the contribution of the gth generator to the designated jth load can be found by:
P l o a d , j g = m Ω P m g = m Ω f ( d 1 , m g f p g + d 2 , m g f q g ) + m Ω b ( d 1 , m g b p g + d 2 , m g b q g )
Q l o a d , j g = m Ω Q m g = m Ω f ( d 3 , m g f p g + d 4 , m g f q g ) + m Ω b ( d 3 , m g b p g + d 4 , m g b q g )
where Ω is the set of all line sections connected to the jth load bus. It can be divided into Ωf and Ωb for the forward and backward line contributions, respectively.

4. Loss Allocation

The line loss attribution from each generator can be calculated by using FCM and BCM of Equations (21) and (22). For instance, line power flow on section i~j attributed to the gth generator is:
P l i n e , i j g = D 1 f P g + D 2 f Q g Q l i n e , i j g = D 3 f P g + D 4 f Q g
P l i n e , j i g = D 1 b P g + D 2 b Q g Q l i n e , j i g = D 3 b P g + D 4 b Q g
the active and reactive power loss contribution of the gth generator can be calculated by adding Equation (24) to Equation (23) as:
P l o s s , i j g = P l i n e , i j g + P l i n e , j i g = ( D 1 f + D 1 b ) P g + ( D 2 f + D 2 b ) Q g
Q l o s s , i j g = Q l i n e , i j g + Q l i n e , j i g = ( D 3 f + D 3 b ) P g + ( D 4 f + D 4 b ) Q g

5. Line Usage Allocation

With the line flow traced, the line usage of a particular gth generator can be decomposed into two elements, the line usage factor (LUF) and the line remnant factor (LRF). LUF can be evaluated by:
P L U F k g = P l i n e , k P ¯ l i n e , k × P l i n e , k g w N G P l i n e , k w
Q L U F k g = Q l i n e , k Q ¯ l i n e , k × Q l i n e , k g w N G Q l i n e , k w
where P ¯ l i n e , k and Q ¯ l i n e , k are the power flow capacities of line k and P l i n e , k and Q l i n e , k are net flows obtained from the converged load flow result and are always considered positive. Note that P l i n e , k g becomes negative when the gth generator is providing the “counter flow” on line k. That is, LUF is not necessarily positive in this study. LRF can be calculated by:
P L R F k g = P ¯ l i n e , k . P l i n e , k P ¯ l i n e , k × | P l i n e , k g | w N G | P l i n e , k w |
Q L R F k g = Q ¯ l i n e , k . Q l i n e , k Q ¯ l i n e , k × | Q l i n e , k g | w N G | Q l i n e , k w |
This is the capacity charge of the gth generator directly proportional to line usage quantity regardless of the flow direction. The allocated costs of transmission for the gth generator of active and reactive power are:
P A C g = t N L c P t ( P L U F t g + P L R F t g ) Q A C g = t N L c Q t ( Q L U F t g + Q L R F t g )
where NL is the set of all line sections and cPt and cQt are the corresponding cost rates.

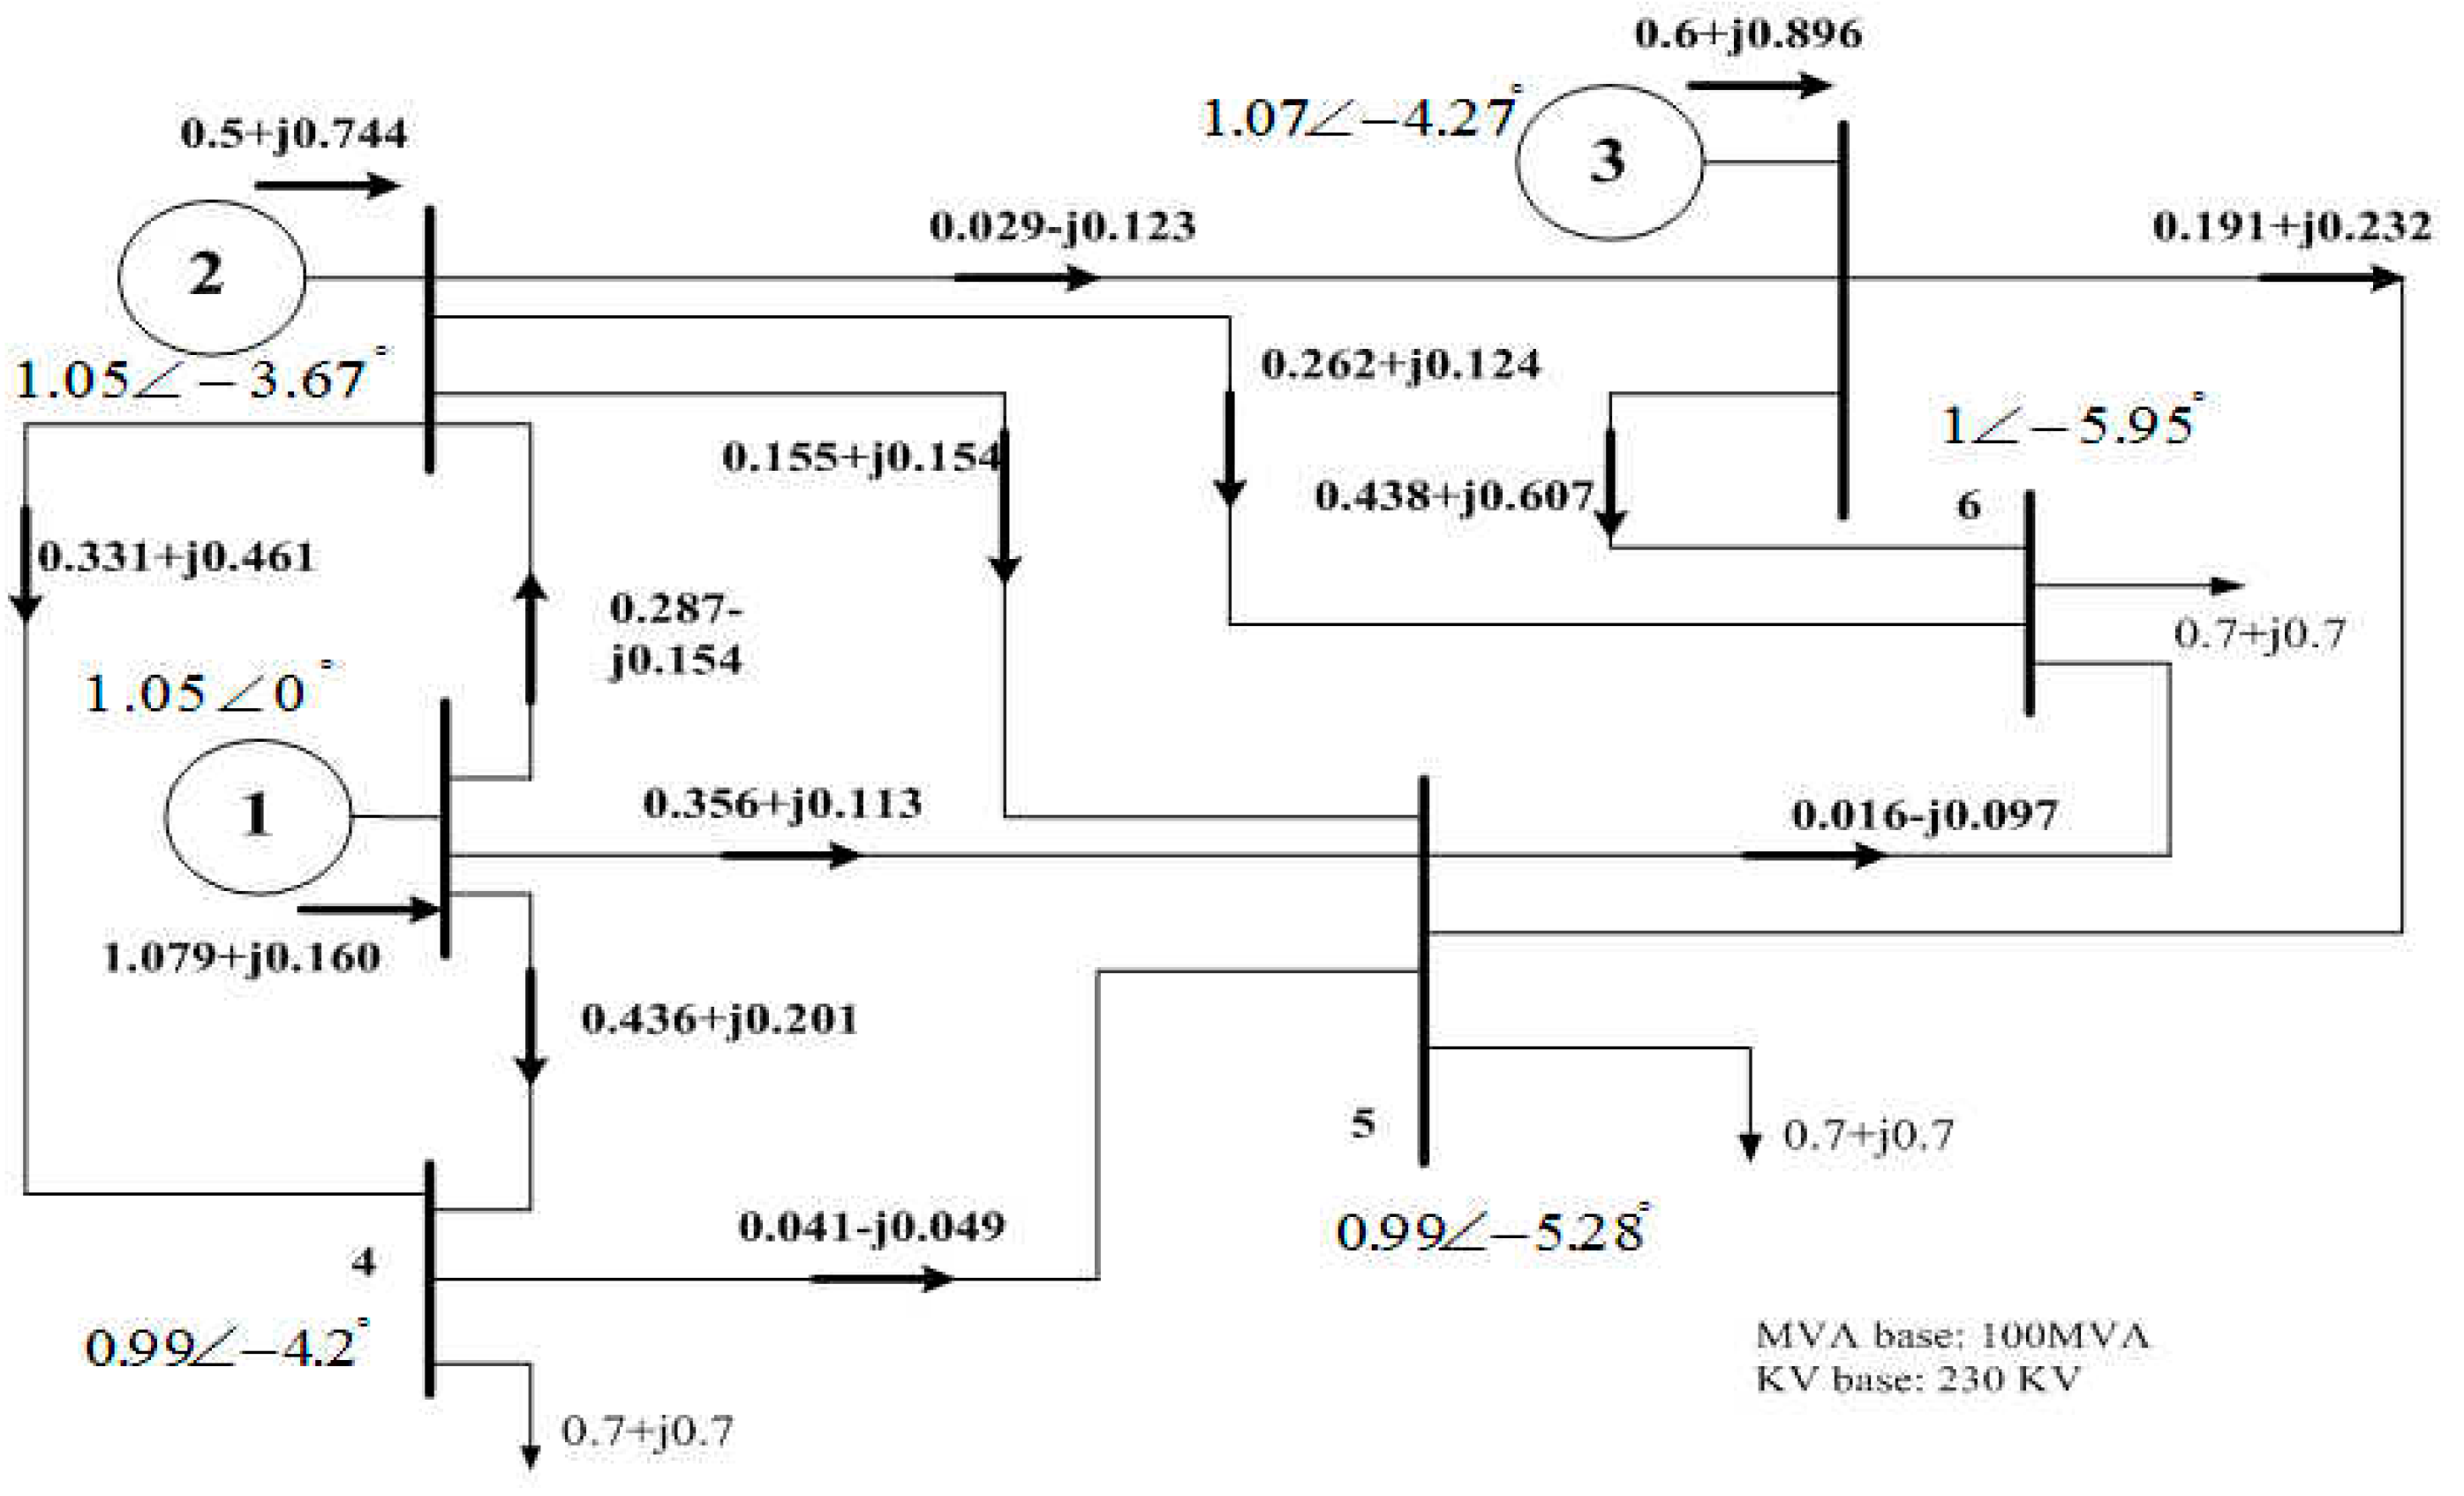
6. Numeric Simulation Result

With our model shown in Figure 3, extensive tests were conducted for the six-bus system [45]. There are three generator buses and three load buses in this system. For illustration, let Coal_1 be a coal-base plant, Gas_2 be gas-fired energy, and Wind_3 be green wind power. Figure 3 shows the active and reactive flows of the six-bus system obtained from a load flow program. The line charging susceptance of each transmission line is also modeled in detail. For comparison purposes, early but still typical methods developed by Bialek [2,3,4] and Kirschen [6,7,8] were also used for comparison. The converged AC load flow will be used first to check the accuracy.

6.1. Accuracy Test

An accuracy test for the proposed model is compared with the converged load flow solution, as shown in Table 1, where we can see from the last column that all numbers are compatible when added up. It shows that the power flow and power balance equations can be satisfied for the whole network.

6.2. Line Flow Tracing Test

Table 2(a,b) show the line flow tracing of the three methods. Topographical analysis using proportionality by Bialek and Kirschen yields very similar results. In Table 2(a), all contributions of Bialek’s and Kirschen’s methods are either positive or 0, with no negative terms. That is, we can see that most negative contributions found out by the proposed method were denoted “zeros” by the other two methods, except the contributions of Coal_1 on line 3–5 and Wind_3 on line 5–6, where the contributions are still “positive”. Note that on line 2–3, Wind_3 plays a significant role in alleviating more than 80% of the burden of the line, as found by the proposed method, and the contributions of Coal_1 and Gas_2 are 8.5 times (0.0925 vs. 0.0107) and 3.3 times (0.0647 vs. 0.0193), respectively, of what was calculated with Bialek’s method, similarly to Kirschen’s. Similar results can be observed on Table 2(b).

6.3. Load Tracing Test

Table 3 shows the active and reactive load contribution of the proposed method. In the proposed method, the real power of load bus 4 provided by Wind_3 is over 21%, while 0% wind power was found with the other two methods. That is, the green power from Wind_3 will not reach bus 4 using the other two methods. Similarly, zero reactive contribution can reach bus 6 from Coal_1. The proposed method also indicates that power will flow in every network conductor once it is connected, which is in line with Ohm’s law. This is a very different observation from other published methods.

6.4. Loss Allocation

Table 4 shows line loss tracing result of each generator. Coal_1 acts as a major loss reducer as the numeric result shown in the table and the proposed method do not show zero loss distribution.

6.5. LUF and LRF Analysis

To show the property of the line usage allocation, two generation companies (GENCOs) and a single line section k is shown in Figure 4.
For convenience, loss is not considered. Both the line capacity and the corresponding cost rate are 1 p.u. The net flow of section k is assumed 0.6 p.u. from load flow tracing. Let GENCO A have a contribution of X p.u., and let X vary from −1 p.u. to 1.0 p.u., then the corresponding contribution of GENCO B can be calculated by Y = 0.6 − X.
When X is negative, GENCO B is the dominant flow provider and GENCO A becomes a counter flow provider. For a positive X smaller or than 0.6, GENCO A and B share the line usage. If X is greater than 0.6 p.u., the situation changed that GENCO B became a counter flow provider. Figure 5 shows the variations of LUF and LRF according to flow variations of GENCO A in regard to B.
Figure 6 illustrates line usage factor (allocated cost) variation of each GENCO on line section k. It can be seen that the sum of all allocated cost is equal to one and two allocated cost curves intersect when two GENCOS share the line net flow equally.

7. Discussion and Conclusions

A novel formulation to trace the power flow was developed in this study. The formulation was based on basic circuit theory and power balance equations. The active and reactive power consumed by any load or distributed by any generator can be traced in every line and every direction. The real power, reactive power, loss, counter flows, and mutual coupling terms are all considered and are balanced. The proposed method has the following advantages:
-
A converged power flow solution is the only requirement with network parameters;
-
It traces all electrical components for the line, generation, and load in a power network;
-
It considers real, reactive power and mutual coupling terms together;
-
It traces the power for either direction, i.e., from generators to load or vice versa;
-
The proposed method can calculate contributions of each generator at any location for both the active and reactive power flow;
-
Likewise, the proposed method can calculate contributions of each generator for counter flows and mutual coupling systems at any location, which has never been discussed before;
-
All calculated electrical components can satisfy the circuit theory and the power balance equations in an interrelated, non-separable manner;
-
It shows that power will flow in every network conductor instead of a single direction, in accordance with the basic physics and basic circuit theory;
-
The customer could verify for each GENCO the quantity of power they are buying from;
-
Contributions of renewable sources can be calculated in a more justifiable way—it can help making energy strategies to see the impact of a particular green power at a chosen location;
-
Counter flow might be awarded with positive contributions in alleviating network congestions and reduce the loss;
-
Losses can be traced and allocated with rigorous calculation;
-
LUF and LRF were derived rigorously to provide a justifiable base for tariffs, so the usage-of-transmission can be considered more effectively;
-
As positive flow and counter flow co-exist in the same line, there are new opportunities to further improve the system security;
-
The proposed algorithm provides a lot of potential for new applications in many aspects, and it also provides a new and powerful tool for the energy market.

Author Contributions

W.-M.L. provided the project idea, conceptualization, related experiences, writing, and editing. T.-S.Z. performed the data curation, system model, and analysis and conducted simulations. All authors have read and agreed to the published version of the manuscript.

Funding

This research was funded by Tan Kah Kee College, Xiamen University, grant number JG2021SRF01.

Institutional Review Board Statement

Not applicable.

Informed Consent Statement

Not applicable.

Data Availability Statement

Not applicable.

Conflicts of Interest

The authors declare no conflict of interest.

References

  1. Bialek, J. Tracing the flow of electricity. IEE Proc.-Gener. Transm. Distrib. 1996, 143, 313–320. [Google Scholar] [CrossRef] [Green Version]
  2. Bialek, J. Identification of source-sink connections in transmission networks. In Proceedings of the Fourth International Conference on Power System Control and Management, London, UK, 16–18 April 1996; pp. 200–204. [Google Scholar]
  3. Pantos, M.; Gubina, F. Ex-ante transmission-service pricing via powerflow tracing. Int. J. Elect. Power Energy Syst. 2004, 26, 509–518. [Google Scholar] [CrossRef]
  4. Abdelkader, S.M. Allocating transmission loss to loads and generators through complex power flow tracing. IET Gener. Transm. Distrib. 2007, 1, 584–595. [Google Scholar] [CrossRef]
  5. Abdelkader, S.M. Transmission loss allocation through complex power flow tracing. IEEE Trans. Power Syst. 2007, 22, 2240–2248. [Google Scholar] [CrossRef]
  6. Augugliaro, A.; Dusonchet, L.; Favuzza, S.; Ippolito, M.G.; Sanseverino, E.R. A model for reactive power tracing by addition of fictitious nodal injections. Elect. Power Syst. Res. 2012, 83, 196–202. [Google Scholar] [CrossRef]
  7. Gang, D.; Dong, Z.Y.; Bai, W.; Wang, X.F. Power flow based monetary flow method for electricity transmission and wheeling pricing. Elect. Power Syst. Res. 2005, 74, 293–305. [Google Scholar]
  8. Su, C.T.; Liaw, J.H.; Li, C.M. Power-flow tracing and wheeling costing considering complex power and convection lines. Proc. Inst. Elect. Eng.-Gener. Transm. Distrib. 2006, 153, 1–10. [Google Scholar] [CrossRef]
  9. Pantos, M.; Verbic, G.; Gubina, F. Modified topological generation and load distribution factors. IEEE Trans. Power Syst. 2005, 20, 1998–2005. [Google Scholar] [CrossRef]
  10. De, M.; Goswami, S.K. Reactive power cost allocation by power tracing based method. Energy Convers. Manag. 2012, 64, 43–51. [Google Scholar] [CrossRef]
  11. Gross, G.; Tao, S. A Physical-flow-based approach to allocating transmission losses in a transaction framework. IEEE Trans. Power Syst. 2000, 15, 631–637. [Google Scholar] [CrossRef]
  12. De, M.; Goswami, S.K. A direct and simplified approach to powerflow tracing and loss allocation using graph theory. Elect. Power Compon. Syst. 2010, 38, 241–259. [Google Scholar] [CrossRef]
  13. Wu, Z.Q.; Chen, G.Z. MVA power flow and loss analysis for electricity market. IEE Proc.-Gener. Transm. Distrib. 2001, 148, 153–158. [Google Scholar] [CrossRef]
  14. Su, C.T.; Liaw, J.H. Complex power flow tracing considering convection lines using nominal-T model. Int. J. Elect. Power Energy Syst. 2007, 29, 28–35. [Google Scholar] [CrossRef]
  15. Bialek, J. Topological generation and load distribution factors for supplement charge allocation in transmission open access. IEEE Trans. Power Syst. 1997, 12, 1185–1193. [Google Scholar] [CrossRef]
  16. Bialek, J.; Tam, D.B. Tracing the generators’ output. In Proceedings of the International Conference on Opportunities and Advances in International Electric Power Generation, Durham, UK, 18–20 March 1996; pp. 133–136. [Google Scholar]
  17. Bialek, J. Allocation of transmission supplementary charge to real and reactive loads. IEEE Trans. Power Syst. 1998, 13, 749–754. [Google Scholar] [CrossRef]
  18. Kirschen, D.; Allan, R.; Strbac, G. Contributions of individual generators to loads and flows. IEEE Trans. Power Syst. 1997, 12, 52–60. [Google Scholar] [CrossRef] [PubMed] [Green Version]
  19. Strbac, G.; Kirschen, D.; Ahmed, S. Allocating transmission system usage on the basis of traceable contributions of generators and loads to flows. IEEE Trans. Power Syst. 1998, 13, 527–534. [Google Scholar] [CrossRef]
  20. Kirschen, D.; Strbac, G. Tracing active and reactive power between generators and loads using real and imaginary currents. IEEE Trans. Power Syst. 1999, 14, 1312–1319. [Google Scholar] [CrossRef] [Green Version]
  21. Macqueen, C.N.; Irving, M.R. An algorithm for the allocation of distribution system demand and energy losses. IEEE Trans. Power Syst. 1996, 11, 338–343. [Google Scholar] [CrossRef]
  22. Wu, F.F.; Ni, Y.; Wei, P. Power transfer allocation for open access using graph theory-fundamentals and applications in systems without loopflow. IEEE Trans. Power Syst. 2014, 29, 2706–2714. [Google Scholar] [CrossRef]
  23. Al-Digs, A.; Chen, Y.C. Power System Loss Divider. IEEE Trans. Power Syst. 2020, 35, 3286–3289. [Google Scholar] [CrossRef]
  24. Conejo, A.J.; Galiana, F.D.; Kockar, I. Z-bus loss allocation. IEEE Trans. Power Syst. 2001, 16, 105–110. [Google Scholar] [CrossRef]
  25. Conejo, A.J.; Arroyo, J.M.; Alguacil, N.; Guijarro, A.L. Transmission loss allocation: A comparison of different practical algorithms. IEEE Trans. Power Syst. 2002, 17, 571–576. [Google Scholar] [CrossRef]
  26. Galiana, F.D.; Conejo, A.J.; Gill, H.A. Transmission network cost allocation Based on Equivalent Bilateral Exchanges. IEEE Trans. Power Syst. 2003, 18, 1425–1431. [Google Scholar] [CrossRef]
  27. Abdelkader, S. Transmission loss allocation in a deregulated electrical energy market. Elect. Power Syst. Res. 2006, 76, 962–967. [Google Scholar] [CrossRef]
  28. Bao, X.-Z.; Cui, W. Allocation of transmission losses in electricity system based on cooperative game theory. In Proceedings of the 2010 Asia-Pacific Power and Energy Engineering Conference (APPEEC), Chengdu, China, 28–31 March 2010; pp. 1–4. [Google Scholar]
  29. Gomez, A.; Santos, J.M.R.; Garcia, T.G.; Velasco, E.A.R. Fair Loss Allocation of Transmission Power Losses. IEEE Trans. Power Syst. 2000, 15, 184–188. [Google Scholar] [CrossRef]
  30. Molina, Y.P.; Prada, R.B.; Saavedra, O.R. Complex losses allocation to generators and loads based on circuit theory and Aumann Shaprouley method. IEEE Trans. Power Syst. 2010, 25, 1928–1936. [Google Scholar] [CrossRef]
  31. Shih-Chieh, H.; Hsin-Min, W. Allocation of transmission losses based on cooperative game theory and current injection models. In Proceedings of the IEEE International Conference on Industrial Technology (IEEE ICIT ’02), Bankok, Thailand, 11–14 December 2002; Volume 2, pp. 850–853. [Google Scholar]
  32. Shih-Chieh, H. Fair transmission loss allocation based on equivalent current injection and Shapley value. In Proceedings of the IEEE Power Engineering Society General Meeting, Montreal, QC, Canada, 18–22 June 2006; p. 6. [Google Scholar]
  33. Wu, T.; Rothleder, M.; Alaywan, Z.; Papalexopoulos, A.D. Pricing energy and ancillary services in integrated market systems by an optimal power flow. IEEE Trans. Power Syst. 2004, 19, 339–347. [Google Scholar] [CrossRef]
  34. Rider, M.J.; Paucar, V.L. Application of a nonlinear reactive power pricing model for competitive electric markets. Proc. Inst. Elect. Eng.-Gener. Transm. Distrib. 2004, 151, 407–414. [Google Scholar] [CrossRef]
  35. Rabiee, A.; Shayanfar, H.A.; Amjady, N. Coupled energy and reactive power market clearing considering power system security. Energy Convers. Manag. 2009, 50, 907–915. [Google Scholar] [CrossRef]
  36. Chung, C.Y.; Chung, T.S.; Yu, C.W.; Lin, X.J. Cost-based reactive power pricing with voltage security consideration in restructured power systems. Elect. Power Syst. Res. 2004, 70, 85–91. [Google Scholar] [CrossRef]
  37. Amjady, N.; Rabiee, A.; Shayanfar, H.A. Pay-as-bid based reactive power market. Energy Convers. Manag. 2010, 51, 376–381. [Google Scholar] [CrossRef]
  38. Zhong, J.; Nobile, E.; Bose, A.; Bhattacharya, K. Localized reactive power markets using the concept of voltage control areas. IEEE Trans. Power Syst. 2004, 19, 1555–1561. [Google Scholar] [CrossRef] [Green Version]
  39. Ketabi, A.; Alibabaee, A.; Feuillet, R. Application of the ant colony search algorithm to reactive power pricing in an open electricity market. Int. J. Elect. Power Energy Syst. 2010, 32, 622–628. [Google Scholar] [CrossRef]
  40. Marangon Lima, J.W. Allocation of transmission fixed charges: An overview. IEEE Trans. Power Syst. 1996, 11, 1409–1418. [Google Scholar] [CrossRef]
  41. Pan, J.; Teklu, Y.; Rahman, S.; Jun, K. Review of usage-based transmission cost allocation methods under open access. IEEE Trans. Power Syst. 2000, 15, 1218–1224. [Google Scholar]
  42. Enshaee, A.; Yousefi, G.R. Tracing Reactive Power Flows and Allocating Transmission Lines Losses: An Analytical Method. IEEE Syst. J. 2019, 13, 783–791. [Google Scholar] [CrossRef]
  43. Lin, W.-M.; Su, Y.-S.; Chin, H.-C.; Teng, J.-H. Three-phase unbalanced distribution power flow solutions with minimum data preparation. IEEE Trans. Power Syst. 1999, 14, 1178–1183. [Google Scholar] [CrossRef]
  44. Lin, W.-M.; Zhan, T.-S.; Tsay, M.-T. Multiple-Frequency Three-Phase Load Flow For Harmonic Analysis. IEEE Trans. Power Deliv. 2004, 19, 897–904. [Google Scholar] [CrossRef]
  45. Wood, A.J.; Wollenberg, B.F. Power Generation Operation & Control; John Wiley &Sons: Hoboken, NJ, USA, 1984. [Google Scholar]
Figure 1. Transmission line π model and the forward/backward current.
Applsci 13 04524 g001
Figure 2. Load equivalent current modifications.
Applsci 13 04524 g002
Figure 3. AC load flow result of the six−bus system (energy generation: Coal_1, Gas_2, Wind_3).
Applsci 13 04524 g003
Figure 4. A sample line section.
Applsci 13 04524 g004
Figure 5. LUF and LRF variation of each GENCO.
Applsci 13 04524 g005
Figure 6. LUF or allocated cost variation of each GENCO.
Applsci 13 04524 g006
Table 1. Accuracy check of the proposed method for active/reactive flow (MVA base = 100 MVA).
Branch
from~to
Sending-End
(LoadFlow Solution)
Active/Reactive
Coal _1 ContributionGas_2 ContributionWind_3 ContributionSummation
1 + 2 + 3
1~20.2868/−0.15420.3604/0.0056−0.0539/−0.0997−0.0197/−0.06010.2868/−0.1542
1~40.4358/0.20120.3996/0.09120.0154/0.04210.0209/0.06790.4358/0.2012
1~50.3560/0.11260.3186/0.06280.0385/0.0576−0.0012/−0.00780.3560/0.1126
2~30.0293/−0.12270.0925/0.00860.0647/0.1112−0.1279/−0.24250.0293/−0.1227
2~40.3309/0.46060.0339/−0.01670.1733/0.25450.1237/0.22270.3309/0.4606
2~50.1551/0.15350.0658/−0.00400.0788/0.12300.0105/0.03460.1551/0.1535
2~60.2625/0.12400.1790/0.00950.1188/0.1728−0.0353/−0.05840.2625/0.1240
3~50.1912/0.2318−0.0182/−0.00990.0251/0.03280.1843/0.20880.1912/0.2318
3~60.4377/0.60730.1267/0.03900.0356/0.10090.2754/0.46730.4377/0.6073
4~50.0408/−0.04940.0293/−0.01520.0264/0.0053−0.0149/−0.03950.0408/−0.0494
5~60.0161/−0.09660.0437/−0.00070.0021/−0.0156−0.0296/−0.08030.0161/−0.0966
Table 2. Comparison of active line flow tracing result (MVA base = 100 MVA). Comparison of the reactive line flow tracing result.
Branch
from~to
Sending-End
Load Flow
Coal_1 ContributionGas_2 ContributionWind_3 Contribution
Proposed[Bialek][Kirschen]Proposed[Bialek][Kirschen]Proposed[Bialek][Kirschen]
(a)
1~20.28680.36040.2870.287−0.053900−0.019700
1~40.43580.39960.4360.4360.0154000.020900
1~50.35600.31860.3560.3560.038500−0.001200
2~30.02930.09250.01070.0180.06470.01930.011−0.127900
2~40.33090.03390.118300.17330.21270.3310.123700
2~50.15510.06580.05540.0960.07880.09960.0590.010500
2~60.26250.17900.09360.1620.11880.16840.101−0.035300
3~50.1912−0.01820.003200.02510.005700.18430.18220.191
3~60.43770.12670.007200.03560.013000.27540.41780.438
4~50.04080.02930.02980.0250.02640.01120.016−0.014900
5~60.01610.04370.010900.00210.00280−0.02960.00430.016
(b)
1~2−0.15420.005600−0.09970.1100.078−0.06010.0180.076
1~40.20120.09120.1020.2010.04210.08500.06790.5150
1~50.11260.06280.0570.1130.05760.0480−0.00780.2890
2~3−0.12270.0086000.111200−0.24250.0570.123
2~40.4606−0.0167000.25450.3960.2340.22270.0650.226
2~50.1535−0.0040000.12300.1320.0780.03460.0220.075
2~60.12400.0095000.17280.1060.124−0.05840.0180
3~50.2318−0.0099000.0328000.20880.2320.232
3~60.60730.0390000.1009000.46730.6070.607
4~5−0.0494−0.01520.0080.0490.00530.0350−0.03950.0070
5~6−0.0966−0.000700−0.01560.0010.049−0.08030.0310.076
Table 3. Active load tracing and reactive load tracing results.
Gen. BusCoal_1Gas_2Wind_3Total
P (%)
1 + 2 + 3
AC Flow Solution
* 1
Load Bus Contribution
P (p.u.)
%Contribution
P (p.u.)
%Contribution
P (p.u.)
%
(a)
4Proposed0.399257.030.150621.520.150121.450.69990.6999
Bialek0.508272.60.191827.4000.7
Kirschen0.413759.10.286340.9000.7
5Proposed0.386155.160.144420.630.169524.210.70.7
Bialek0.422760.390.109915.70.167423.910.7
Kirschen0.314844.970.101214.460.198840.570.7
6Proposed0.364352.040.146120.880.189627.080.70.7
Bialek0.107915.420.180225.740.411958.840.7
Kirschen0.314844.970.101214.460.198840.570.7
(b)
4Proposed0.078011.140.290641.510.331447.340.70.6999
Bialek0.106515.210.489069.860.104514.930.7
Kirschen0.080011.430.254036.290.366052.280.7
5Proposed0.077311.040.284740.670.338048.290.70.7
Bialek0.072710.380.248835.540.378654.080.7
Kirschen0.080011.430.254036.290.366052.280.7
6Proposed0.076210.880.279439.910.344549.210.70010.7
Bialek000.130218.600.569881.400.7
Kirschen000.352850.40.347249.600.7
* 1: Load flow program solution in Figure 3.
Table 4. Comparison of active power loss distribution.
Branch
from to
Solution Loss (MW) * 1Coal_1’s Contribution (MW)Gas_2’s Contribution (MW)Wind_3’s Contribution (MW)
Proposed[Bialek]Proposed[Bialek]Proposed[Bialek]
1~20.91−1.070.91.0500.930
1~41.090.741.10.1900.160
1~51.07−0.020.80.3200.770
2~30.04−1.600.03570.390.0641.250
2~41.51−0.240.5360.970.9640.780
2~50.50−0.480.1790.540.3210.440
2~60.58−0.370.1790.320.3210.640
3~51.09−1.190.0180.630.0331.661.049
3~61.000.250.0160.130.0300.620.954
4~50.04−1.740.0130.760.0271.020
5~60.05−1.370.0230.590.0110.830.016
* 1: Load flow program solution.
Disclaimer/Publisher’s Note: The statements, opinions and data contained in all publications are solely those of the individual author(s) and contributor(s) and not of MDPI and/or the editor(s). MDPI and/or the editor(s) disclaim responsibility for any injury to people or property resulting from any ideas, methods, instructions or products referred to in the content.

