Article

Study on Space–Time Evolution Law and Mechanism of Instability Failure of Deep High-Stress Overburden Rock

1
School of Environment and Resources, Xiangtan University, Xiangtan 411105, China
2
Emergency Management Research Center, Xiangtan University, Xiangtan 411105, China
*
Author to whom correspondence should be addressed.
Appl. Sci. 2023, 13(7), 4573; https://doi.org/10.3390/app13074573
Submission received: 4 March 2023 / Revised: 30 March 2023 / Accepted: 31 March 2023 / Published: 4 April 2023
(This article belongs to the Special Issue Advanced Research on Tunnel Slope Stability and Land Subsidence)

Abstract

:
In order to explore the fracture law and structural evolution characteristics of overlying strata in deep high-stress mining, according to the geometric characteristics and mechanical causes of overlying strata in different mining stages of the stope, four stages of overlying strata structure model are established and analyzed in turn. According to the characteristics of the overburden load transfer path in the deep high-stress stope, the fracture law and macroscopic mechanical response of overburden are analyzed by MATLAB and PFC2D numerical simulation method. The evolution model of overburden structure and load transfer in ‘four stages and three modes’ of the deep high-stress stope is constructed, and the stage fracture effect of ‘beam, plate and arch’ is put forward. The results show that the overburden rock is a fixed beam structure before the initial weighting. After the initial weighting, it evolves into a plate structure with three sides fixed and one side simply supported. After the periodic weighting, the overburden rock structure further evolves into a plate structure with one side fixed and three sides simply supported. After full mining, the overburden rock forms an arch structure, and the load is transmitted by the beam–plate–arch path. The findings of the study provide an important basis for exploring the nature of overburden transport and load transfer in deep high-stress quarries and strengthening overburden prevention and control.

1. Introduction

Coal resources are in a dominant position in China’s energy structure, and with the rapid development of China’s economy, the trend of continuous mining of coal resources will not change for a long time. With the rapid development of the industrial economy, the increasingly dry shallow coal resources will inevitably make the mine extend to the deep. With the increase of mining depth, the deterioration of geological conditions, the increase of broken rock mass, the increase of ground stress, the increase of water head pressure and water inflow, the increase of ground temperature, and the probability of sudden engineering geological disasters and major malignant accidents will also increase. Compared with shallow mining, under the condition of deep mining, the excavation of high-stress rock mass will inevitably lead to stress concentration in the nearby overburden. With the increase of the stress in the overburden, the stress state is close to or exceeds the ultimate strength of the rock mass, and it is easy to be disturbed by external loads to cause instability [1,2,3,4,5]. With the continuous deepening of underground mining, a series of engineering disasters such as large rock pressure, a significant increase in overburden deformation, fast deformation speed, an increased degree of stress appearance during mining, and increased concentration bring a series of environmental pollution problems and overburden stability. The problem of instability will cause certain dynamic disasters, natural disasters, and damage to the existing ecological, geological environment. Revealing the instability failure law of load transfer evolution of overlying strata is the basis for solving the problem of deep mining engineering disasters [6,7,8].
In view of the evolution mechanism of the stress field and the deformation and failure characteristics of overburden rock in the deep stope, scholars at home and abroad have carried out extensive and beneficial exploration. It is found that mining height, mining depth, and surface length have a great influence on the mining stress field of overburden rock. After the excavation of the coal seam, the size and direction of the mining stress field changed, and the deformation and failure of overburden rock in the stope occurred. The fundamental reason is that the relationship between the strength of overburden rock and its different stress states has changed [9,10,11]. With the excavation of rock strata, the roof above the working face and the mined-out area can be regarded as a beam with one end fixed in the rock mass and the other end in the overhanging state. When the roof consists of several rock strata, a composite cantilever beam is formed. After the cantilever beam bends and sinks, it is supported by the collapsed rock. When the overhang length is large, regular periodic breaks occur, causing periodic weighting [12,13]. When the multi-layer rock beam, whose working face is basically a flat roof, begins to break continuously, with the continuous advancement of mining, the rock beam will no longer be in a relatively balanced state and will gradually break. Because there is still a large horizontal friction force and lateral friction between the overburden soil and the rock layer, the multi-layer overburden rock block, which is constantly broken, is squeezed by the rock beam when the rock beam rotates. At this time, it can form a structure that looks like a beam is actually a semi-arch [14,15]. When the working face is a long-wall coal mining face, a pressure arch is formed from the open-off cut, which expands with the continuous advancement of the working face until the vault reaches the surface. Thereafter, the pressure arch continues to expand, forming the front arch foot in the coal mass in front of the working face and the rear arch foot on the collapsed rock. The arch foot is the stress-increasing area, and the working face is in the stress-decreasing area. The pressure of the support is only a few percent of the weight of the overlying strata [16,17,18,19]. In the mining of large dip angle coal seam, as the working face advances, the stress arch shell continues to expand to the rear of the open-off cut, the coal wall in front of the working face, the coal wall of the return air roadway and the transportation roadway and the upper rock layer, and the degree of asymmetry increases. Along the direction of the coal seam, the flat zero of the stress supply gradually increases; along the tendency of the coal seam, the flat zero of the stress supply decreases, and the position of the maximum height of the stress supply continues to shift to the side of the return air roadway [20,21].
With the transfer of coal mining from shallow to deep, the deformation and failure characteristics of overlying strata in stope have also changed significantly. After the mining of deep rock strata, a large amount of energy produced by stress release is coupled with the splitting reaction caused by high-ground stress and overburden unloading, and the zonal disintegration phenomenon occurs in the deep overburden. The overburden fracture zone mainly occurs in the low-stress zone of the stress shell, and the zonal disintegration characteristics are closely related to the time–space effect [22,23]. In the process of stope advancing, the coal and rock mass in front of the working face is divided into an elastic zone, plastic zone, and elastic–plastic zone, which correspond to the original stress zone, peak stress zone, and stress reduction zone of mining abutment pressure respectively. When the overlying strata are regarded as the statically indeterminate beam with two fixed ends under uniform load, the deformation can be divided into the elastic stage, plastic deformation stage, elastic limit stage, and plastic flow mechanism stage. The bending moment in the elastic stage increases proportionally with the increase of load q, and the position of the zero bending moment section does not change. The position of the zero bending moment section in the latter three stages changes continuously with the increase of load q. The bending moment no longer increases proportionally with the increase of load q [24]. When the bending moment exceeds the limit value, the direct roof strata with low bearing capacity in the shallow part of the roof have plastic damage such as deflection, fracture, and collapse in a short time. The caving rock mass accumulates in the goaf, and the roof-bearing area of the stope moves up to the high-strength strata. At this time, the main roof can be regarded as an elastic plate. As the working face advances, the load of the overlying strata gradually increases. The roof fracture first begins near the center of the long side, then turns to the center of the short side, and finally turns to the center of the plate surface. The failure of the long and short sides of the roof forms a plane ‘O’ type fracture form crack. When the roof fracture failure is completely over, the space ‘O’ type crack formed by the failure of the long and short sides of the upper surface of the roof and the space ‘X’ type crack formed by the bottom surface of the roof together form the space ‘O-X’ type fracture form of the roof fracture [25,26]. With the increase in mining progress, the blocks at different positions of the overlying strata in the goaf continue to rupture, and the number of ruptured blocks continues to increase. The ‘basic roof’ that plays a bearing role moves upward along the vertical direction with the change of the semi-elliptical stress field. In the actual process of coal mining, the movement law of overlying strata is not only related to the mechanical properties of overlying strata but also closely related to the foundation coefficient of its underlying support body. When the foundation coefficient of the underlying support body is small, the initial collapse step of the overburden is smaller, the initial fracture position of the overburden is located in the middle of the rock beam, the position of the periodic fracture of the overburden tends to be deeper than the support boundary, and the failure range of the support body itself is larger [27,28].
At present, the mechanical properties of coal and rock samples under different loading and unloading stress paths and the influence of stope engineering parameters on mine pressure are analyzed by laboratory tests and numerical simulation under the condition of preset stress state and engineering parameters. However, the direction and path of mining load transfer in overburden strata during coal seam excavation are not clear, and it is difficult to reveal the mechanical mechanism and motion law of overburden strata fracture [29,30]. Based on PFC2D simulation software, this paper analyzes the temporal and spatial evolution characteristics of mining stress along the advancing direction of the working face, the length direction of the working face, and the staged fracture mechanism of overburden strata. The purpose is to reveal the temporal and spatial law of instability and failure of overburden strata fracture process in deep stope through the load transfer process and to provide theoretical support for ensuring safe mining and stable geological environment disasters in the stope.

2. Analysis of Overburden Load Transfer Mechanical Model

2.1. Roof Breaking and Load Transfer Process

The breaking characteristics and caving morphology of the stope roof are closely related to the mining progress and advancing time. The coal seam starts from the open-off cut of the working face. With the advancement of the working face, the complete process of the breaking movement of the stope roof has four stages: initial mining, initial pressure, periodic pressure, and full mining. Corresponding to the complete process of roof breaking movement, there are three kinds of structures in the transfer of overburden load: beam structure, plate structure, and arch structure.
The movement of rock strata before the initial mining roof rock mass does not produce cracks is small. With the mining of the working face, the roof of the direct roof and the basic roof strata begins to fall when the goaf reaches a certain distance. However, due to the filling effect of the residual coal in the direct roof and the mining area, the basic roof strata can often form a stable beam plate structure. The so-called beam plate refers to a conversion process from beam to plate structure, not a single structure. Through the research on the characteristics of the roof caving by many scholars at home and abroad, it is found that with the increase of the exposed area of the roof, the failure characteristics are often O-X type, that is, the roof first cracks at the bottom boundary near the coal wall and then cracks appear on the plate surface [31]. The upper rock layer of the main roof transfers the self-weight to the main roof, and the load gathers at the roof boundary and the coal wall and transfers to the deep rock mass. At this time, the load transfer can be regarded as a process of transfer through the beam structure. With the increase of the exposed area of the roof, the beam structure breaks after reaching its ultimate load capacity. After the beam structure of the roof boundary is unstable and broken, the load is difficult to transfer to the deep rock mass through the roof boundary and begins to transfer to the roof center, as shown in Figure 1.
The beam structure often exists before the first weighting of the main roof. After the first weighting, the beam structure is destroyed, and the roof instability begins to bend, separate, and collapse. The collapse area increases with the increase of the hanging area of the roof advancing the working face, that is, the periodic weighting stage of the main roof. At this time, the way of load transfer and transfer in overlying strata has changed. Because the beam is broken and cannot be used as the carrier of load transfer to deep rock mass, the load begins to gather in the center of the roof and then spreads outward from the center. The transformation from beam structure to plate structure can be approximately regarded as the process from ‘line’ to ‘surface’. After the initial weighting, the stress concentration phenomenon begins to appear in the center of the plate and intensifies with the further increase of the exposed area until it breaks and collapses beyond the ultimate load capacity of the plate, and its fracture characteristics are often X-O type. Due to the weak load capacity of the overlying strata, the overlying strata bend and sink as a whole with the sinking and breaking of the basic roof. At this time, the transfer and transfer of load are carried out in the plate structure until the large-scale instability and breaking of the plate structure occurs [32]. Collapse and accumulation form a structural arch supported by the coal body at the open-off cut and the coal wall in front of the stope, as shown in Figure 2 and Figure 3.
In terms of spatial form, the structural arch formed by the combination of overlying rock blocks in the working face or goaf after full mining is the secondary structure formed by the instability and fracture of the overlying rock plate structure. The pressure above the roof is no longer the weight of the entire rock layer but the pressure generated by the self-weight of the rock mass in a limited area. The contour of this area is arched. The load transfer path of overlying strata is transferred upward from the plate surface to the top of the structural arch and downward from the top along the arch curve, as shown in Figure 4.

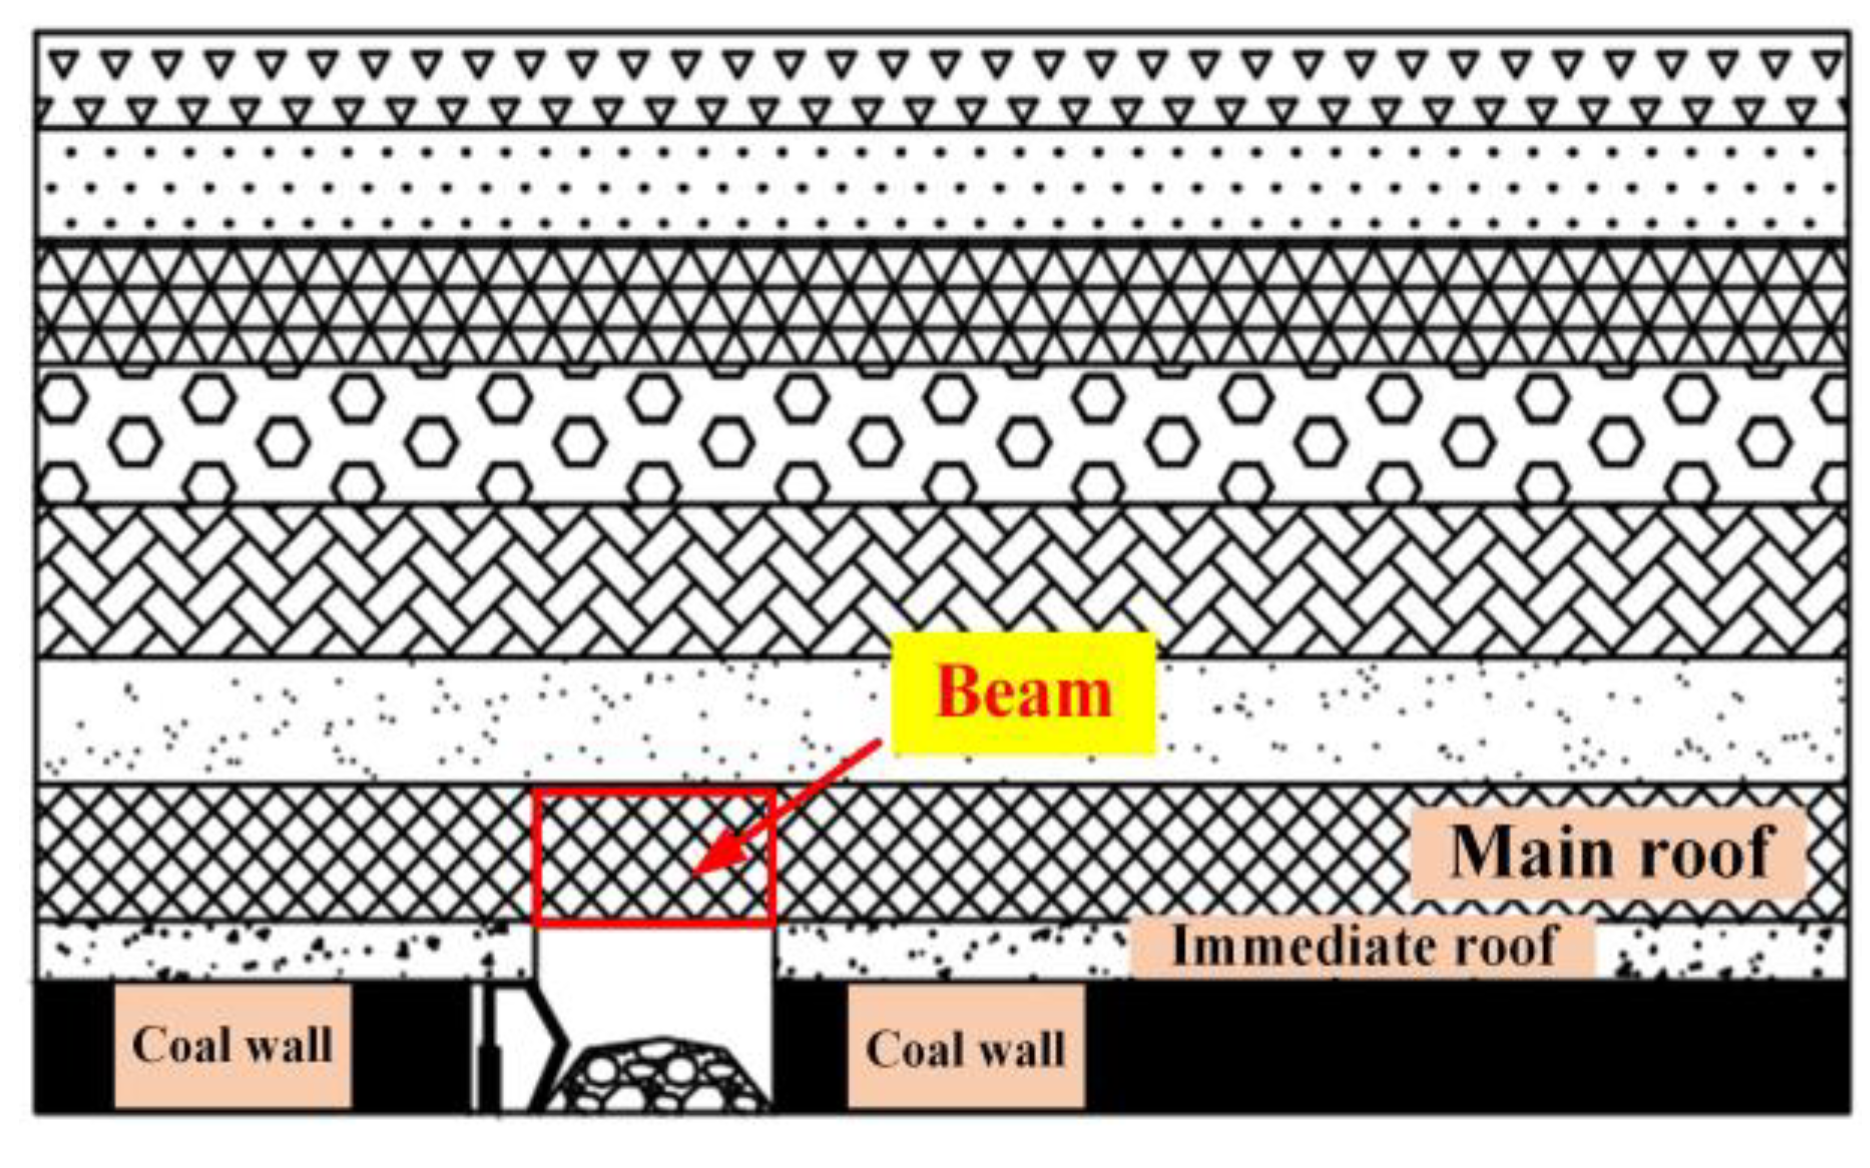
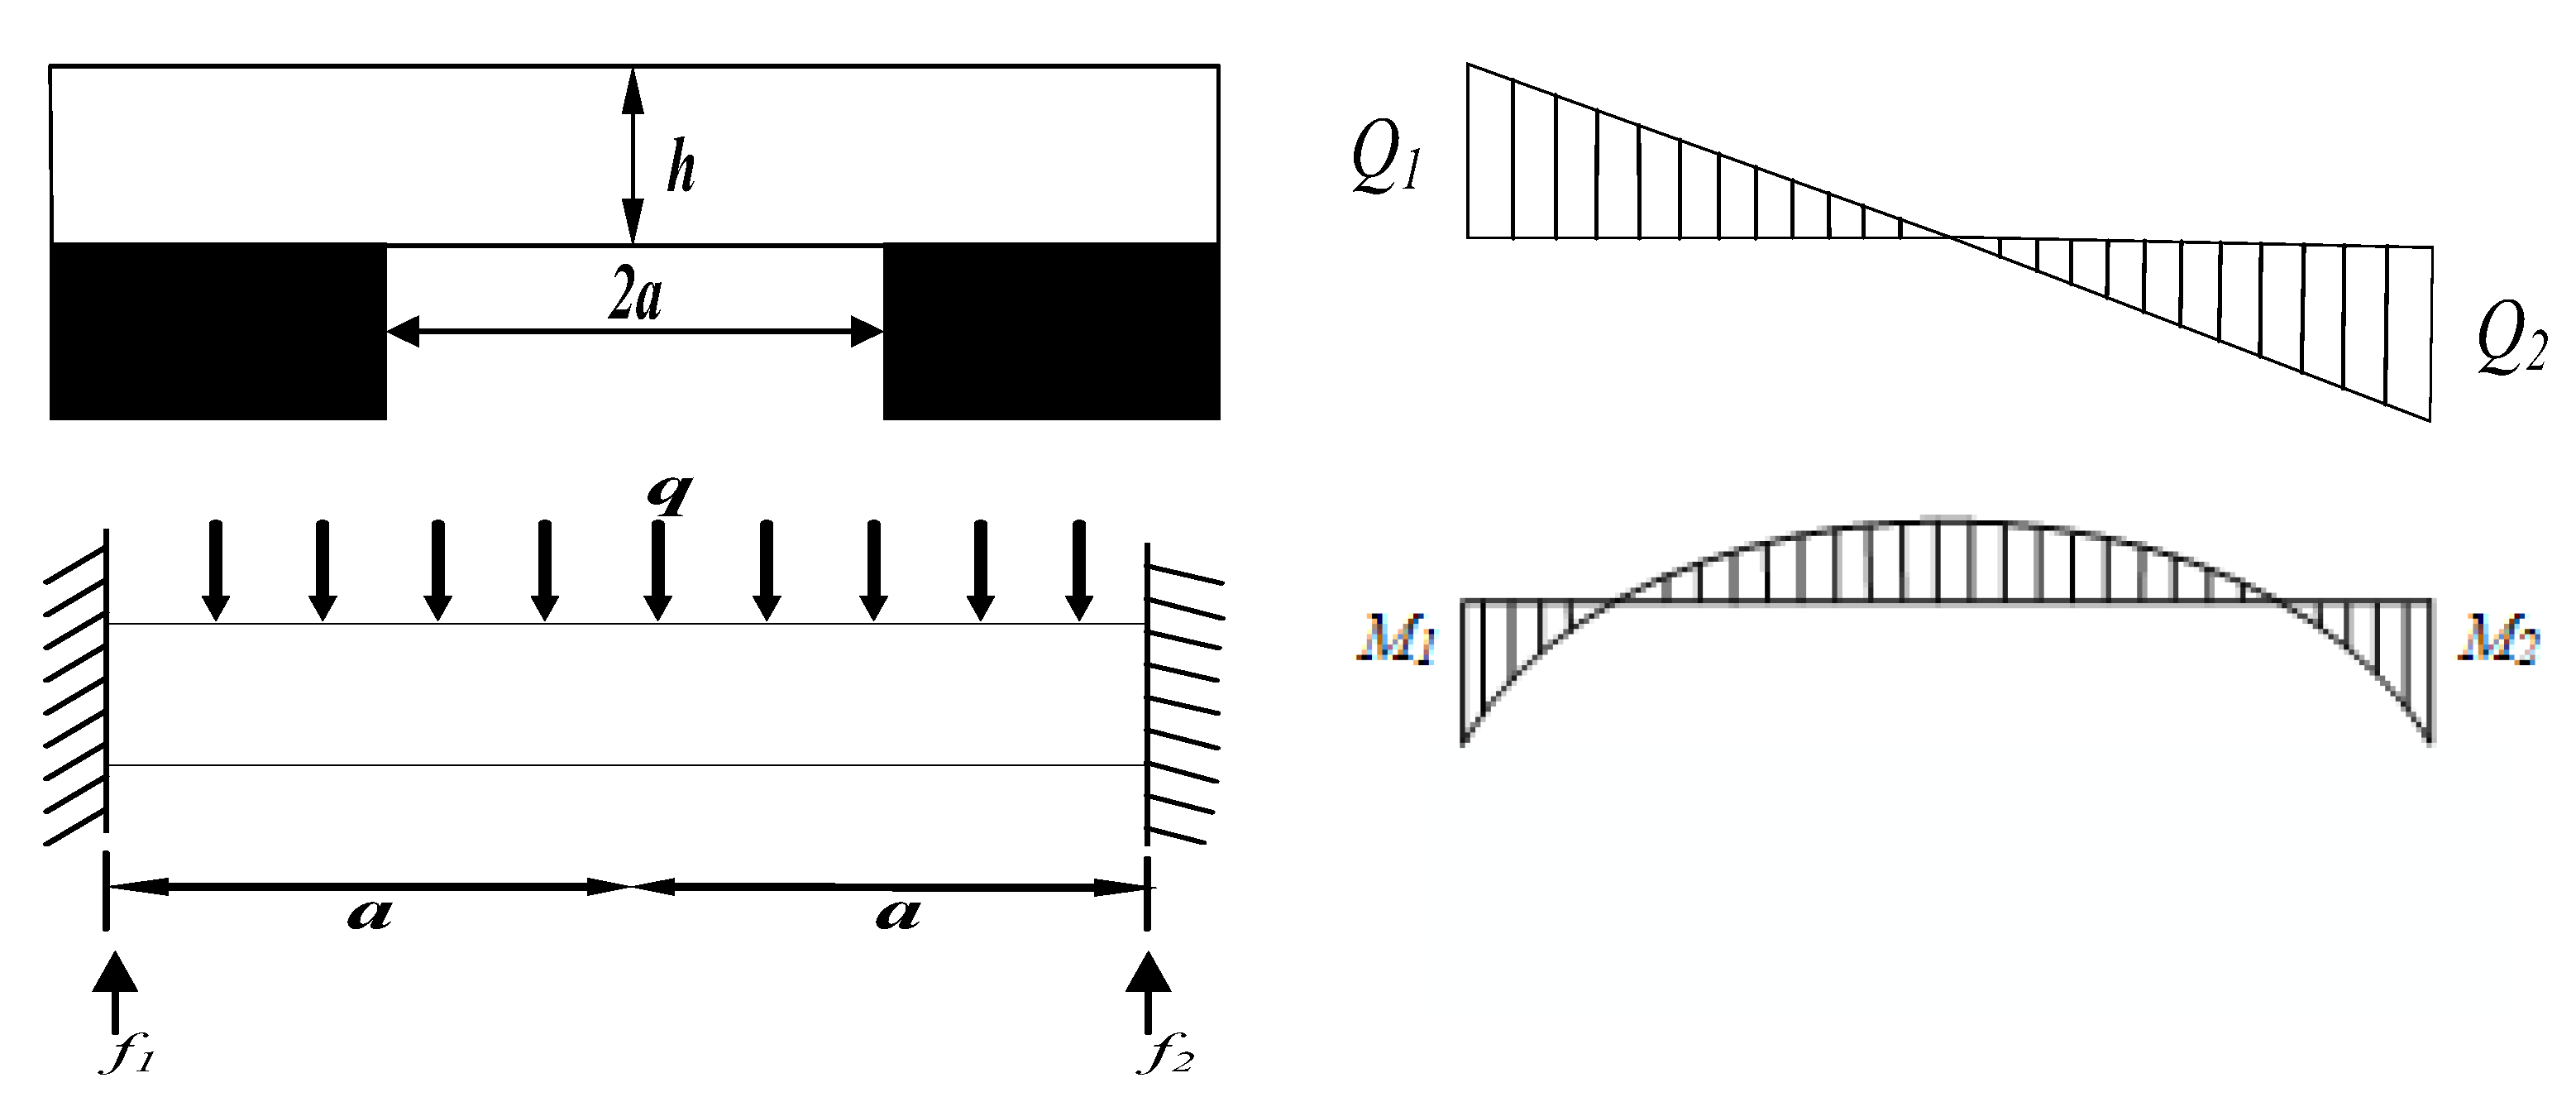
2.1.1. Mechanical Analysis before Roof Breaking

The working face begins to advance from the open-off cut position. In the initial period, the hanging area of the basic roof is small, and the structural stability load capacity is strong. The overlying strata load is mainly concentrated in the bottom boundary position of the basic roof along the coal wall to the deep rock mass. At this time, the load is mainly transferred through the beam structure of the lower rock layer of the basic roof. This stage can be regarded as the bending of the beam on the elastic foundation (Figure 5).
Assuming that the initial stress field acting on the rock mass is the original rock stress field, there is
q = i = 1 n g i h i
In the formula: gi, hi are the bulk density and thickness of the i-th rock mass.
Due to the difference between rock stratification and rock mass properties, the actual force acting on a rock beam can be judged and calculated by the following formula:
q n x = E i h i 3 i = 1 n g i h i i = 1 n E i h i 3
In the formula: Ei, g i , hi are the elastic modulus, bulk density, and thickness of the i-th layer rock mass; n is the number of rock strata acting on the beam.
The shear force and bending moment of any section of the fixed beam are
Q x = f 1 q x ,   M x = f 1 x q x 2 2 + M 1
Since the ‘beam’ is symmetrical under uniform load, therefore, the reaction forces at both ends of the beam: f1 = f2 = qa, bending moment: M1 = M2 = q a 2 3 .
Therefore:
Q x = q ( a x ) ,   M x = q 6 ( 6 a x 3 x 2 2 a 2 )
It can be seen from Equation (4) that the maximum shear force is obtained at both ends of the fixed beam: Q max = q a , ultimate bending moment: M max = 1 3 q a 2 (0 < x < 2a).
Therefore, the maximum tensile force at the ultimate bending moment is
σ max = 2 q a 2 h 2
When σ max = R t , the maximum pulling force at this point reaches the tensile strength of the rock stratum, the rock stratum will break at this point, and the limit span when the fixed beam breaks is
S = h 2 R t q 1
In the formula: h is the single thickness of the main roof; Rt is basic roof tensile strength; q1 is basic top uniform load.
From the above formula, it can be seen that the beam is the main structure of the load before the first weighting of the main roof, and its bending moment and pulling force are closely related to the hanging length of the roof. When the working face advances further, the length of the suspended roof increases, and the beam reaches its ultimate pulling force and breaks. The beam structure is transformed into a plate structure, and the distance between the breaking position and the open-off cut position is the length of the beam.

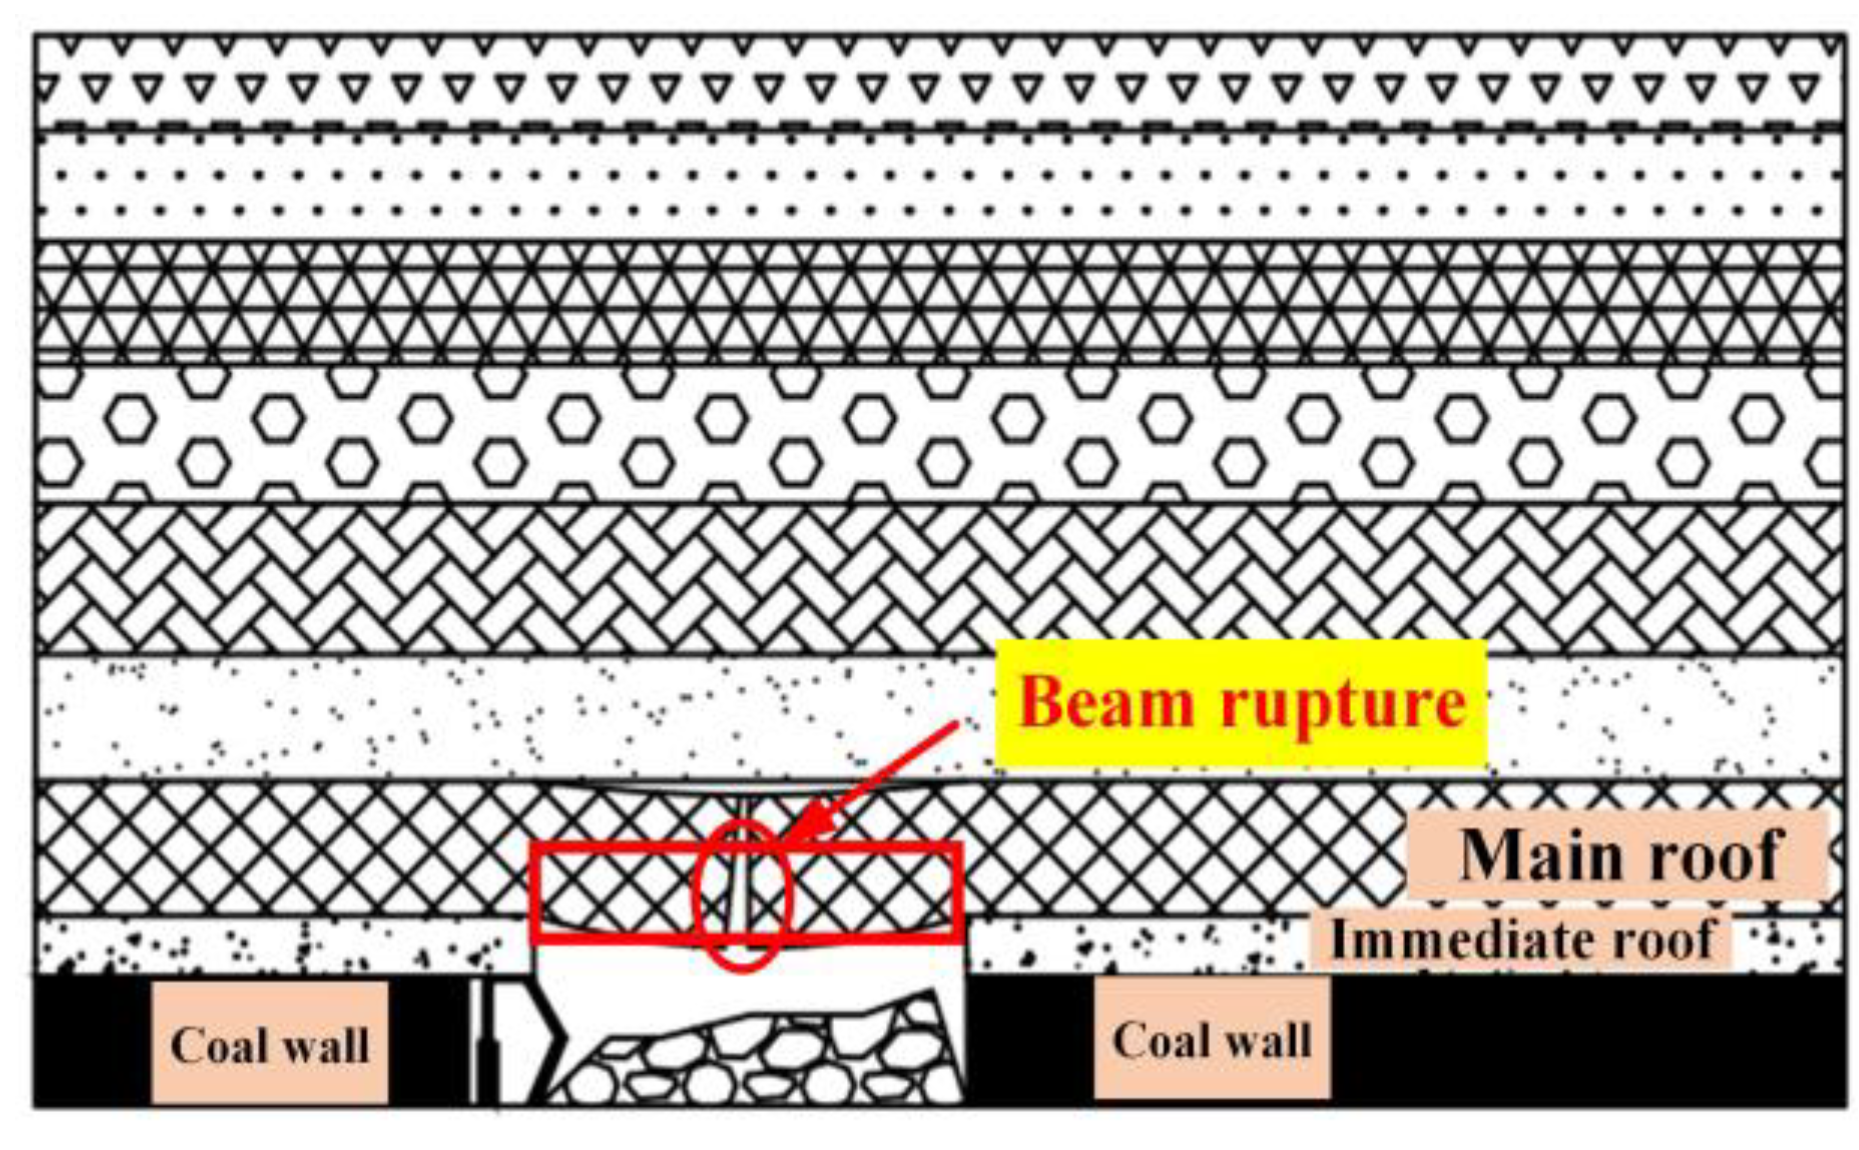
2.1.2. Basic Mechanical Analysis of Initial Fracture

With the expansion of the working face advancing the goaf, the load of the rock layer under the basic roof gradually increases, the cracks in the beam gradually develop and expand, the stable structure of the beam is broken, the load cannot be transmitted to the surrounding rock mass through the beam, and the load of the overlying rock layer begins to transfer from the beam to the plate. Because the lower coal seam of the initial edge of the basic roof of the stope has been mined in order to simplify the mechanical structure, it can be regarded as a simply supported edge, and the plate can be regarded as a thin rectangular plate with one side simply supported, and three sides clamped support. Therefore, the mechanical model of one side simply supported and three sides clamped supported is constructed for the roof of the stope(Figure 6).
The boundary conditions of the thin plate are
( ω ) x = a x = 0 = 0 , ( ω ) y = ± b = 0 ω x x = a = 0 , ω y y = ± b = 0 , 2 ω x 2 x = 0 = 0
Set the deflection expression to
ω = C 1 ω 1 = C 1 x a ( x 2 a 2 ) 2 ( y 2 b 2 ) 2
In the formula: ω is deflection, C1 is constant. So
ω 1 = x a ( x 2 a 2 ) 2 ( y 2 b 2 ) 2
4 ω = 4 ω x 4 + 4 ω y 4 + 2 4 ω x 2 y 2 = C 1 [ 120 x a ( y 2 b 2 ) 2 + 24 x a ( x 2 a 2 ) 2 + ( 20 a x 3 12 x a ) ( 12 y 2 b 2 ) ]
In the formula, 4 is gradient operator.
Bring into
D ( 4 ω ) ω m d x d y = q ω m d x d y
Get the
4 0 a 0 b D C 1 [ 120 x a ( y 2 b 2 ) 2 + 24 x a ( x 2 a 2 ) 2 + ( 20 a x 3 12 x a ) ( 12 y 2 b 2 ) ] × x a ( x 2 a 2 ) 2 ( y 2 b 2 ) 2 d x d y = q a a b b x a ( x 2 a 2 ) 2 ( y 2 b 2 ) 2 d x d y
The calculation:
C 1 = 1617 q 4 ( 168 a 5 55 a 3 b 2 + 1320 a b 4 ) D
Further calculated:
ω = 1617 q x a ( x 2 a 2 ) 2 ( y 2 b 2 ) 2 4 a ( 168 a 4 55 a 2 b 2 + 1320 b 4 ) D
In the formula: D is flexural rigidity of thin plate, GPa·m; ω 1 is the First-order deflection function; q is load, Mpa.
Using the internal force bending moment formula of elasticity, the bending moment of the thin plate is obtained as
M x = D ( 2 ω x 2 + μ 2 ω y 2 ) = D C 1 [ 1 a ( 20 x 3 12 x a 2 ) ( y 2 b 2 ) 2 + μ x a ( x 2 a 2 ) 2 ( 12 y 2 4 b 2 ) ]
M y = D ( μ 2 ω x 2 + 2 ω y 2 ) = D C 1 [ μ 1 a ( 20 x 3 12 x a 2 ) ( y 2 b 2 ) 2 + x a ( x 2 a 2 ) 2 ( 12 y 2 4 b 2 ) ]
In the formula: Mx, My are Moment in x and y directions, MN·m; μ is poisson ratio.
Then the stress of a rectangular roof is
σ x = E z 1 μ 2 ( 2 ω x 2 + μ 2 ω y 2 ) = E z C 1 1 μ 2 [ 1 a ( 20 x 3 12 x a 2 ) ( y 2 b 2 ) + μ x a ( x 2 a 2 ) 2 ( 12 y 2 4 b 2 ) ] σ y = E z 1 μ 2 ( 2 ω y 2 + μ 2 ω x 2 ) = E z C 1 1 μ 2 [ μ 1 a ( 20 x 3 12 x a 2 ) ( y 2 b 2 ) + x a ( x 2 a 2 ) 2 ( 12 y 2 4 b 2 ) ] τ x y = E z 1 + μ 2 ω x y = E z C 1 1 + μ ( 5 a x 4 6 x 2 a + a 3 ) ( 4 y 3 4 y b 2 )
It can be seen from the above that the stress value of the fixed long side at the bottom of the roof is large so that the ‘beam’ at the bottom of the roof is more likely to reach its ultimate strength and fracture. Therefore, the rectangular roof will first break at the long side of the fixed support of the thin plate. After the ‘beam’ is broken, the short side of the fixed support is broken. After all the fixed support edges are broken, the cracks gradually develop, and the broken boundary of the simply supported edge is connected to form an ‘O’-shaped broken ring. After that, cracks are generated in the center of the plate surface and extended to the surrounding areas to develop an ‘X’-shaped fracture, that is an ‘O-X’-shaped fracture.

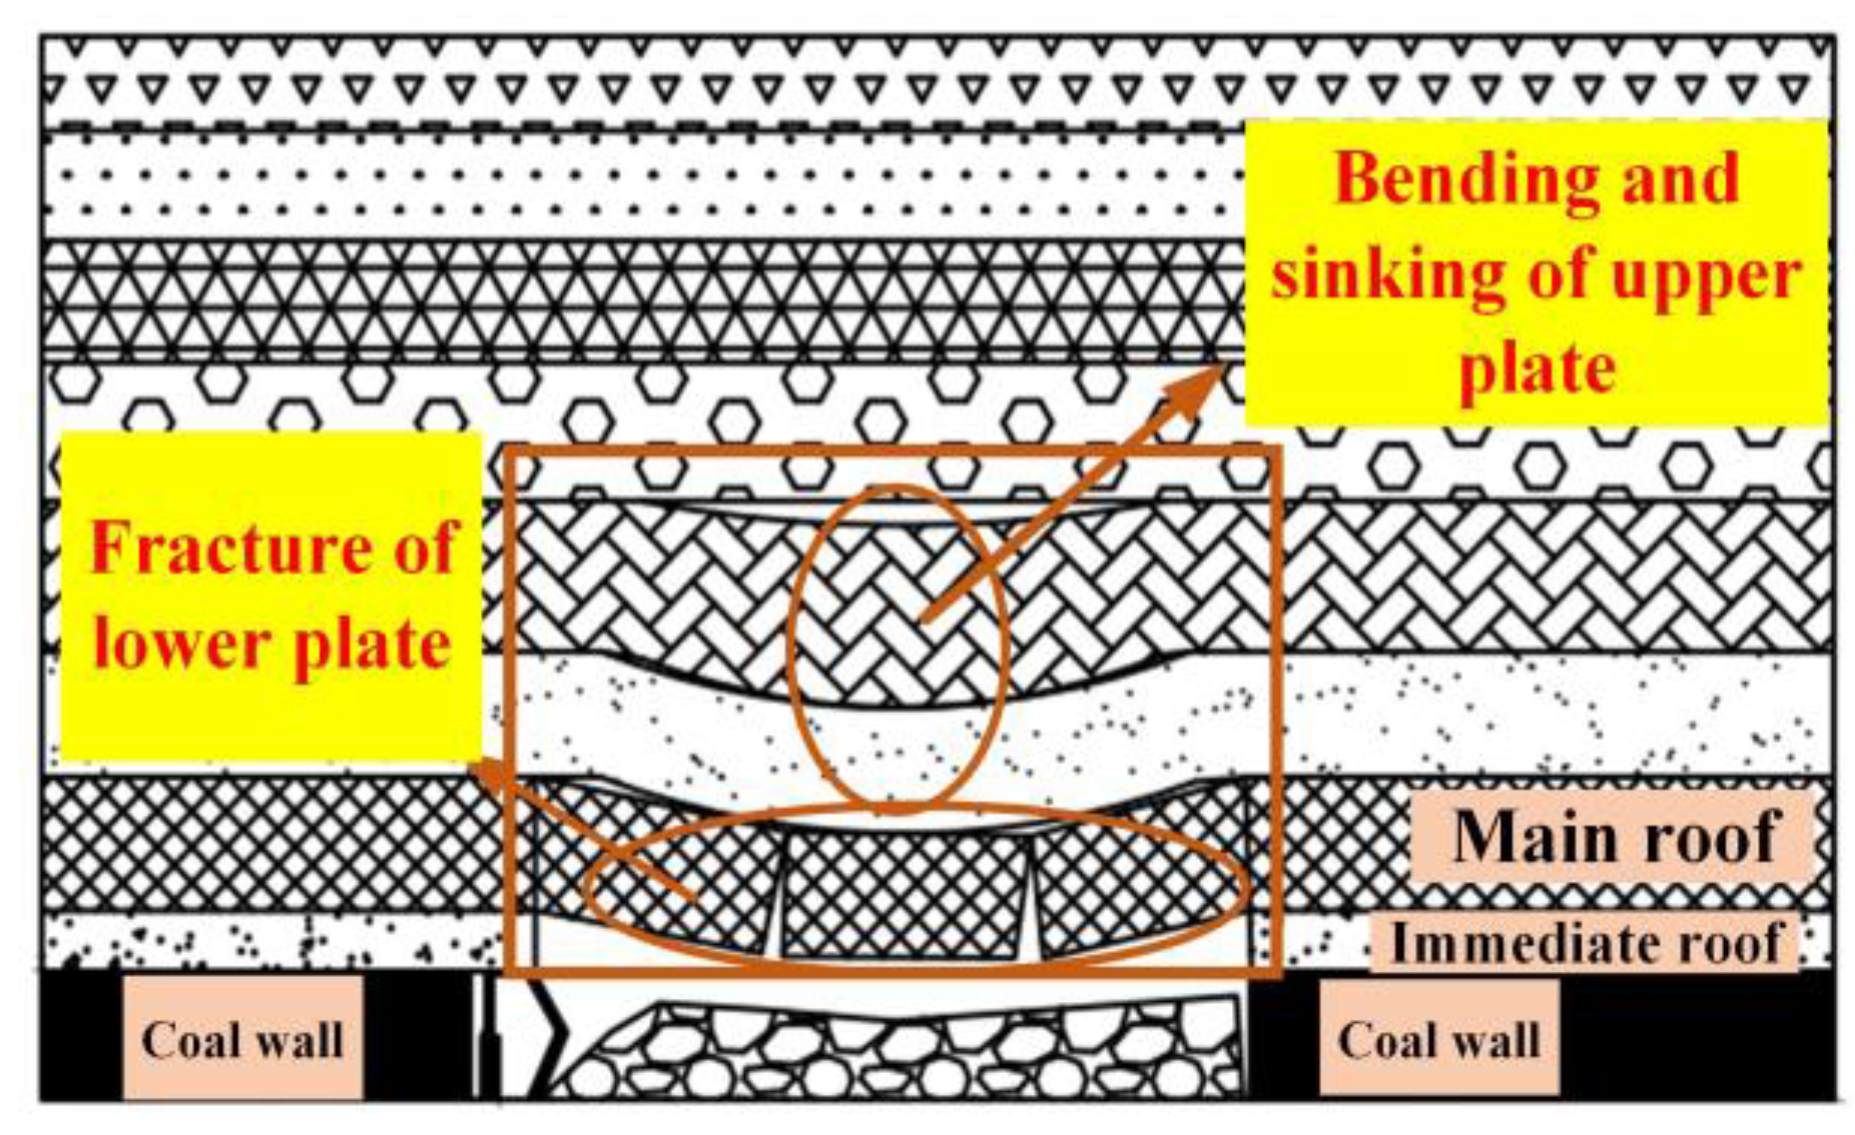
2.1.3. Mechanical Analysis of Periodic Fracture of Main Roof

As the working face continues to advance, the periodic weighting phenomenon causes a large number of cracks inside the ‘plate’ to begin to collapse periodically. When the clamped long side of the rectangular roof is broken, the boundary conditions will change accordingly. Therefore, it is necessary to reconstruct the mechanical model of simply supported on three sides and clamped supported on one side and solve the mechanics according to the new strength failure criterion(Figure 7).
The boundary conditions of the thin plate are
( ω ) x = 0 x = a = 0 , ( ω ) y = ± b = 0 , ω x x = a = 0
Construction of First Order deflection surface equation satisfying boundary conditions by Ritz Method:
ω = C 2 ω 2 = C 2 x 2 ( x a ) sin π y b
The total potential energy of the thin plate is
E p = V ε q ω d x d y = D 2 ( 2 ω ) 2 2 ( 1 μ ) 2 ω x 2 2 ω y 2 ( 2 ω x y ) 2 d x d y q ω d x d y = D a 3 C 2 2 840 b 3 ( 840 b 4 + 2 a 4 π 4 + 168 a 2 b 2 π 2 112 a 2 b 2 π 2 μ ) + q a 4 b 6 π C 2
From E p C 2 = 0 to:
C 2 = 70 q a 4 b 4 π 2 ( 840 b 4 π + 2 a 4 π 4 + 168 a 2 b 2 π 2 112 a 2 b 2 π 2 μ )
Further calculated:
ω = 70 q a b 4 π 2 ( 840 b 4 π + 2 a 4 π 4 + 168 a 2 b 2 π 2 112 a 2 b 2 π 2 μ ) D x 2 ( x a ) sin π y b
Using the internal force bending moment formula of elasticity, the bending moment of the thin plate is obtained as
M x = D ( 2 ω x 2 + μ 2 ω y 2 ) = D C 2 [ ( 6 x 2 a ) sin π y b μ π 2 b 2 x 2 ( x a ) sin π y b ]
M y = D ( μ 2 ω x 2 + 2 ω y 2 ) = D C 2 [ μ ( 6 x 2 a ) sin π y b π 2 b 2 x 2 ( x a ) sin π y b ]
Then the stress of a rectangular roof is
σ x = E z 1 μ 2 ( 2 ω x 2 + μ 2 ω y 2 ) = E z C 2 1 μ 2 [ ( 6 x 2 a ) sin π y b μ π 2 b 2 x 2 ( x a ) sin π y b ] σ y = E z 1 μ 2 ( 2 ω y 2 + μ 2 ω x 2 ) = E z C 2 1 μ 2 [ μ ( 6 x 2 a ) sin π y b π 2 b 2 x 2 ( x a ) sin π y b ] τ x y = E z 1 + μ 2 ω x y = E z C 2 1 + μ π b ( 3 x 2 2 x a ) cos π y b
According to the bending moment Formulas (21) and (22), the maximum bending moment of the roof is located at the center of the plate near the simply supported short side. The bending moment decreases in turn from ‘plate surface-simple supported short side-simple supported long side-fixed supported short side’. At this time, the load on the plate surface is relatively large. Therefore, the rectangular roof will first break at the position near the simply supported short side of the thin plate surface, resulting in transverse cracks along the x direction, and continue to extend to both ends with the mining progress. Finally, the fracture cracks at the proximal end of the short side are bifurcated, forming a horizontal ‘X’ type fracture of the plane, and the overall fracture process is ‘X-O’ type.

2.1.4. Mechanical Analysis of Load Transfer of Fully Mined Overburden

After full mining, the overburden stress is redistributed, and the rock cracks above the goaf gradually form an arch fracture failure zone. The inner rock layer of the arch fracture failure zone forms an arch stress unloading zone under the self-organization effect. Stress analysis of structural arch formed by fully mined goaf(Figure 8):
Let the trajectory equation of structural arch be
( x + a ) 2 b 2 + y 2 c 2 = 1
The structural arch shape equation can be obtained by substituting the coordinates of O, P, and Q:
4 ( x L g 2 ) 2 L g 2 + y 2 H g 2 = 1
The structural arch is subjected to upper uniform load and lateral uniform load. According to the overall stability of the arch structure, there is
q L g L g 2 + γ q H g H g 2 γ q H g H g 2 F Q Y L g = 0 q L g 2 L g 4 + γ q H g H g 2 + F O X H g F O Y L g 2 = 0
Calculated results:
F O X = F Q X = q L g 2 8 H g γ q H g 2 F O Y = F Q Y = q L g 2
For any point S, the bending moment is obtained by equilibrium condition M s :
M s = F Q Y x γ q y 2 2 q x 2 2 F Q X y = q L g x 2 γ q y 2 2 q x 2 2 ( q L g 2 8 H g γ q H g 2 ) y
Bring Equation (25) into Equation (28) to obtain the bending moment of any point of the structural arch. M ( x ) :
M ( x ) = q L g x 2 γ q 2 ( 4 L g H g 2 x 4 x 2 H g 2 L g 2 ) q x 2 2 ( q L g 2 8 H g γ q H g 2 ) 4 L g H g 2 x 4 x 2 H g 2 L g
From the above derivation process, it can be seen that after the coal seam is fully mined, the arched bearing structure formed by the combination of overburden rock blocks in the working face or goaf plays the role of bearing the weight of rock strata and resisting the deformation of overburden rock. The arch body is located in the stope, and the arch foot is located at the edge of the flank coal seam. The horizontal thrust at the arch foot is composed of the horizontal shear resistance of the overlying strata on both sides. The bending moment increases first, then decreases, then increases, and then decreases along the x direction. The structure at the arch foot of the vault is stable, and the bending moment at the haunch is the largest and easy to destabilize.

2.2. Example Analysis of Overburden Load Transfer

In order to more intuitively reflect the evolution process of load transfer in the deep high-stress stope, this simulation takes the three stages of beam, plate, and arch as an example, in which the load transfer of beam structure can be analyzed through the load transfer process of the plate structure. The expressions of the internal force bending moment of beam–slab structure and arch structure of the main roof under the condition of three-side fixed support and one-side simple support, and three-side simple support and one-side fixed support are established, respectively. On the basis of theoretical analysis of overburden load transfer, Matlab’s powerful data processing and numerical fitting software is used to perform linear fitting and numerical analysis on the mechanical expressions established under different mining stages of the working face by using typical case calculation methods. Through linear data regression and image visualization processing, the three-dimensional deformation surface diagram of load distribution under different mining stages of the deep high-stress stope is obtained.

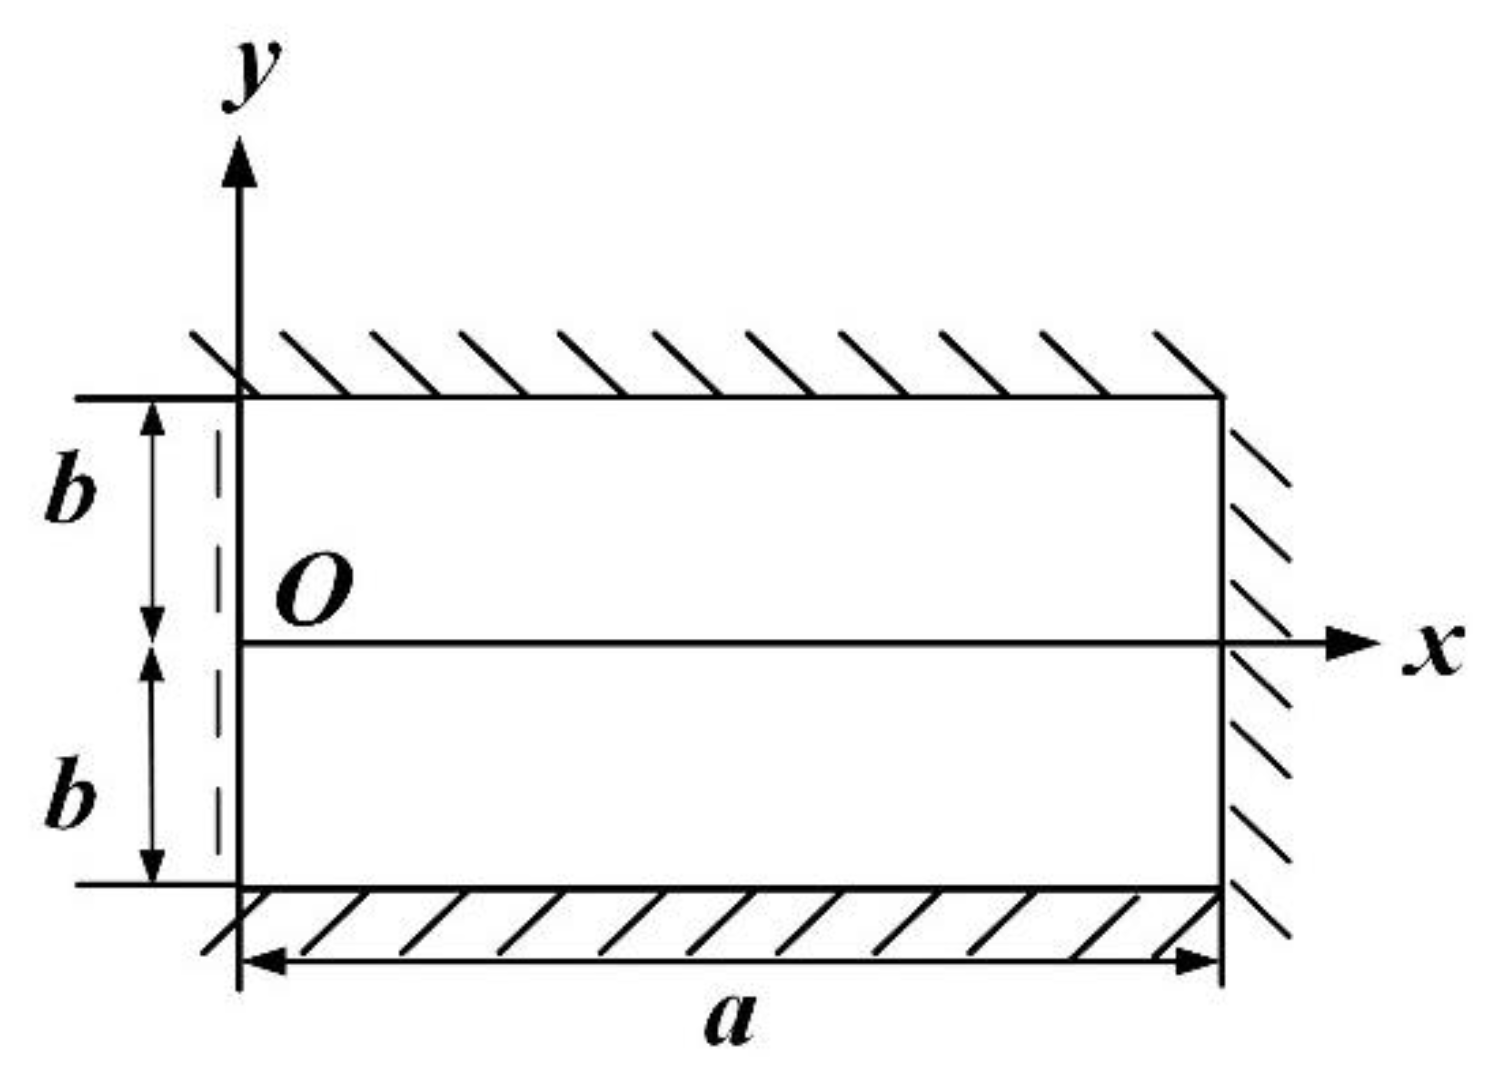
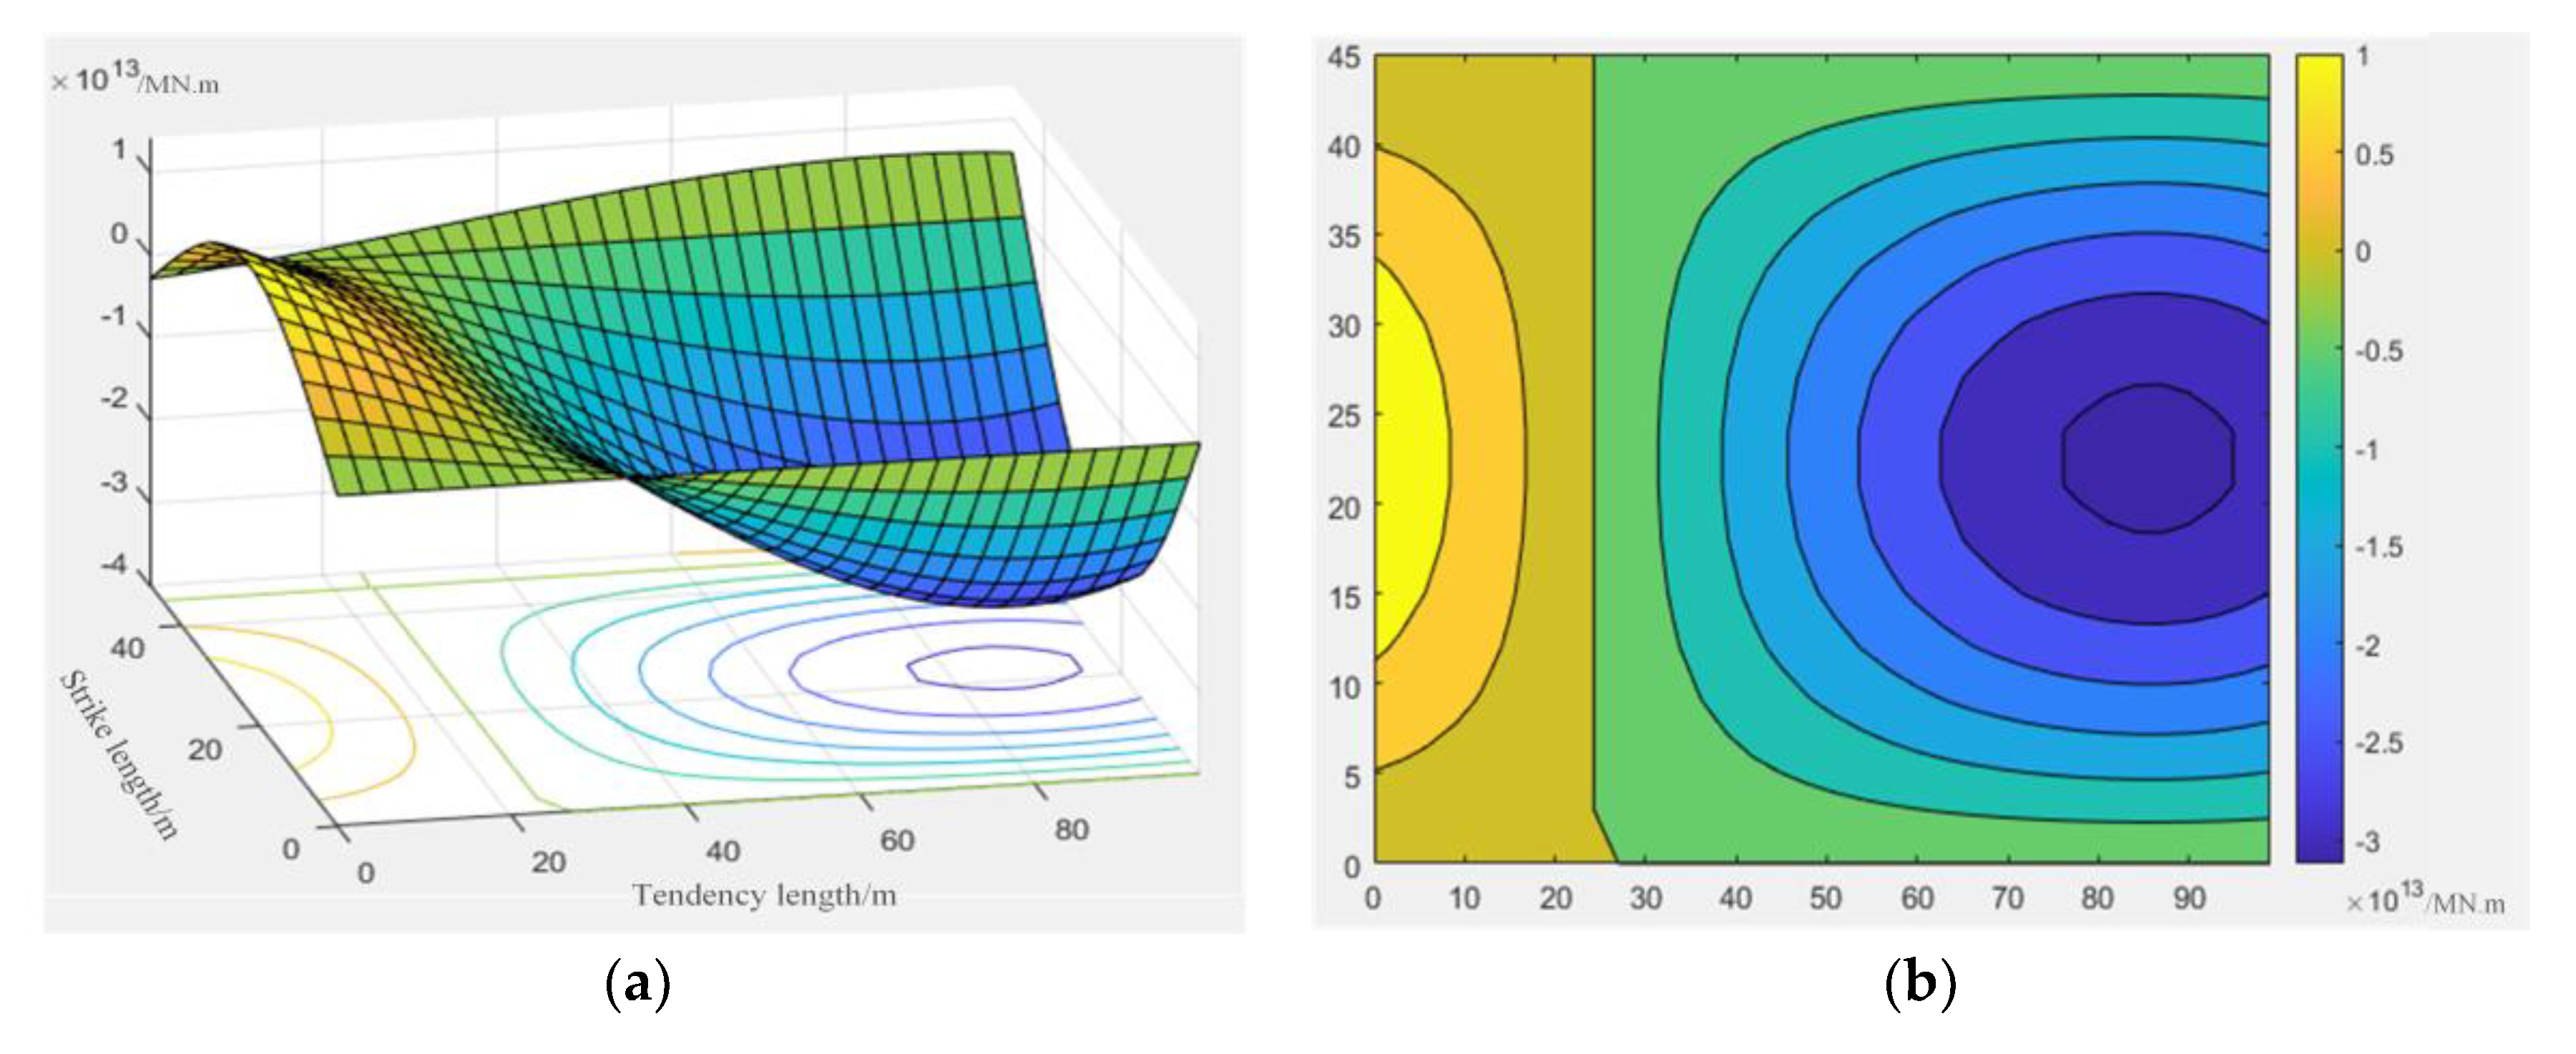
2.2.1. Trilateral Fixed Support and One-Side Simply Supported Beam Plate Structure Internal Force Distribution

Plate length a = 100 m, plate width 2a = 50 m, plate thickness s = 4 m, Poisson’s ratio μ = 0.25, elastic modulus E = 30.3 GPa. By calculating the bending moment values of the beam–slab structure surface in x and y directions under this boundary condition, the contour map of the internal force distribution of the three-dimensional surface is made by using Matlab numerical fitting software, as shown in Figure 9:
Through the analysis of the curved surface image, it can be seen that the roof fracture trend is a process from edge to surface, that is, the conversion process from beam to plate. It is not difficult to see from the size of the bending moment, at the beginning of mining, the load on the roof is transmitted from the center of the plate to the periphery and is transferred to the lower coal body through the beam (fixed long side) until the beam structure breaks and loses its load capacity. By calculating the ultimate span of the beam structure, the ultimate span of the beam is 45.28 m under the stress state. When the bending moment of the lower beam of the roof reaches its maximum, the beam breaks. The bending moment distribution in the x and y directions of the simply supported plate with three edges clamped, and one edge simply supported is ‘wavy’. The maximum point of the bending moment of the thin plate is located near the center of the long edge of the fixed support. The bending moment value decreases in turn from ‘fixed long edge-fixed short edge-plane center-simple short edge’. The long fixed edge is broken first, and then the fixed short edge is broken. After all the fixed edges are broken, the cracks gradually develop and connect with the broken boundary of the simply supported edge to form an ‘O’-shaped broken ring. After that, cracks are generated in the center of the plate and extended to the surrounding areas to develop ‘X’-shaped breaking, that is, ‘O-X’-shaped breaking. Its development model is in good agreement with the theoretical analysis results, and its breaking evolution process is shown in the following Figure 10:

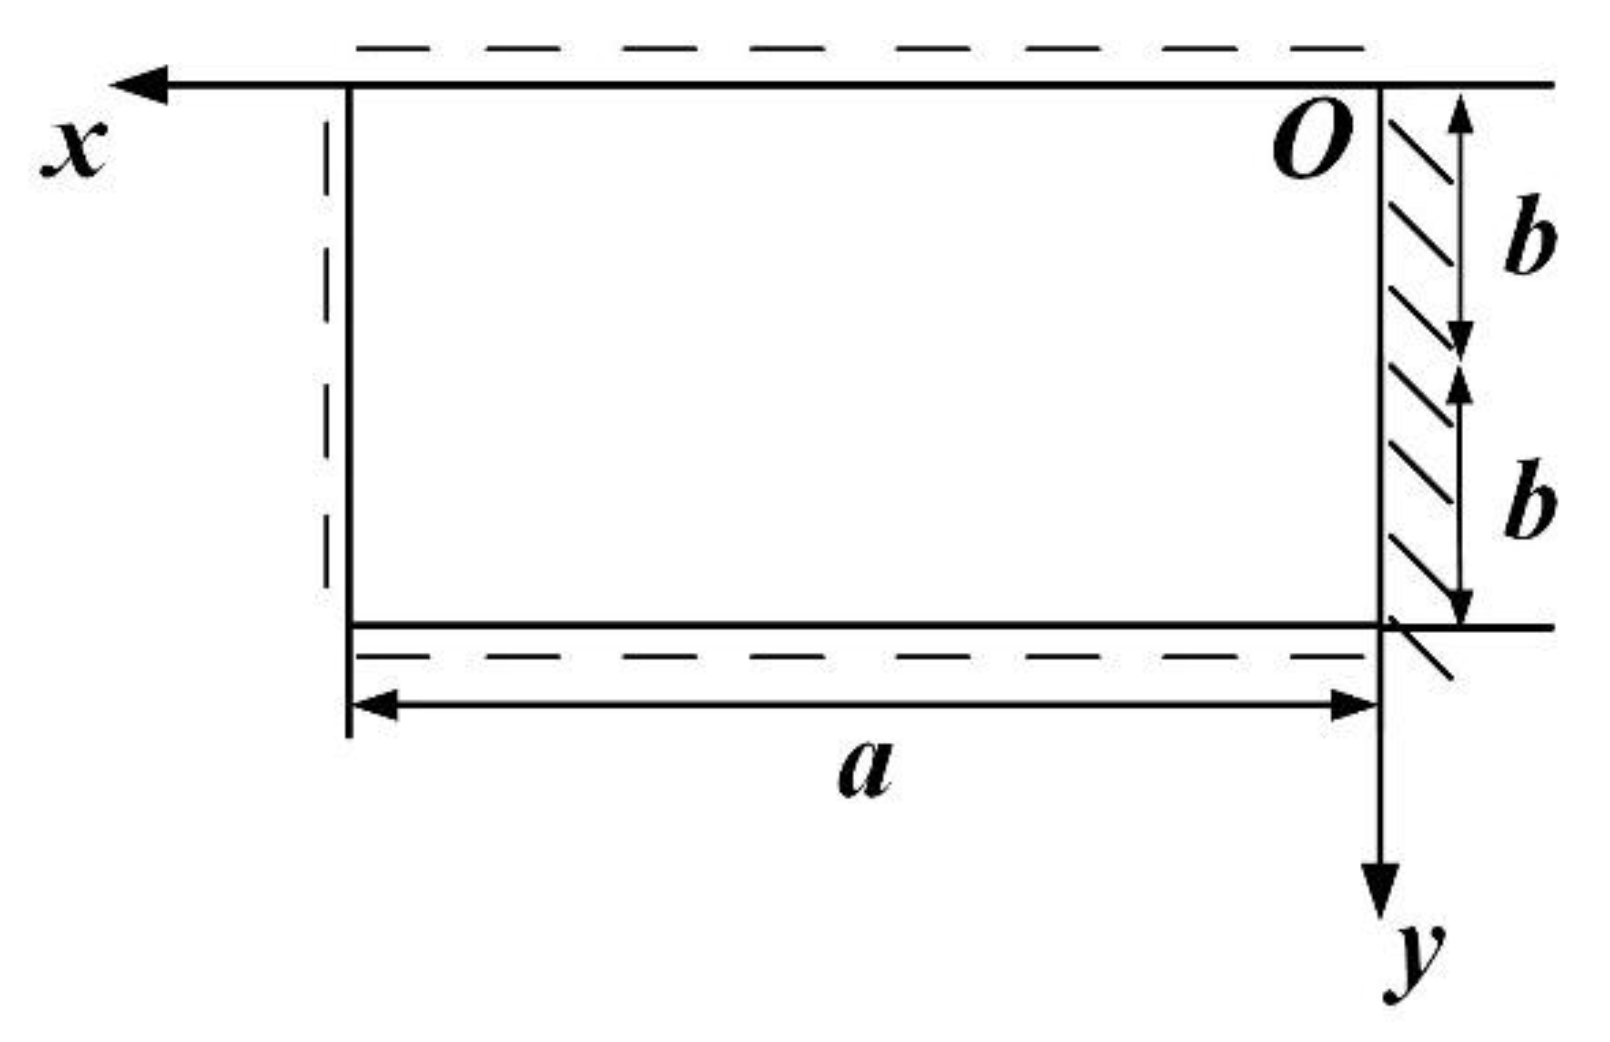
2.2.2. Trilateral Simply Supported and One-Side Fixed Support Thin Plate Internal Force Distribution

By calculating the bending moment values of the rectangular thin plate surface in x and y directions under this boundary condition, the contour map of the internal force distribution of the three-dimensional surface is made by using Matlab numerical fitting software, as shown in the Figure 11:
From the above diagram, it can be seen that the beam structure has been destroyed when the basic top periodic pressure is applied, and the plate structure becomes the main way of load transfer. The bending moment distribution of the three-sided simply supported and one-sided fixed supported slab presents the ‘funnel’ distribution characteristics of high in the middle and low around. The maximum bending moment of the thin plate is located at the center of the plate near the simply supported short side, and the bending moment decreases in the order of ‘plate-simple supported short side-simple supported long side-fixed supported short side’. After the first weighting, the roof has been unstable and broken, and the short side of the simply supported side is broken due to the influence of periodic weighting. The overburden load is difficult to transfer to the goaf. The load is concentrated on the plate surface near the short side of the simply supported side and gradually transferred from the plate surface to the surrounding radiation. The load transferred to the fixed short side is transferred from the coal wall downward. The fracture process of the roof is closely related to its load state. Due to the phenomenon of load concentration, the plate surface near the simply supported short boundary first cracks and expands to both ends along the x-axis direction. First, a bifurcation occurs at the proximal end of the simply supported short edge, forming a semi-‘X’ type fracture, while the simply supported long edge adjacent to the simply supported short edge breaks successively until the tail of the long broken edge is adjacent to the fixed short edge. Subsequently, a bifurcation is generated at the proximal end of the clamped short edge, and the bifurcation formed with the simply supported short edge forms a complete ‘X’ type fracture, and then the clamped short edges are successively broken, and the roof fracture mode is ‘X-O’ type. The breaking evolution process is shown in Figure 12:

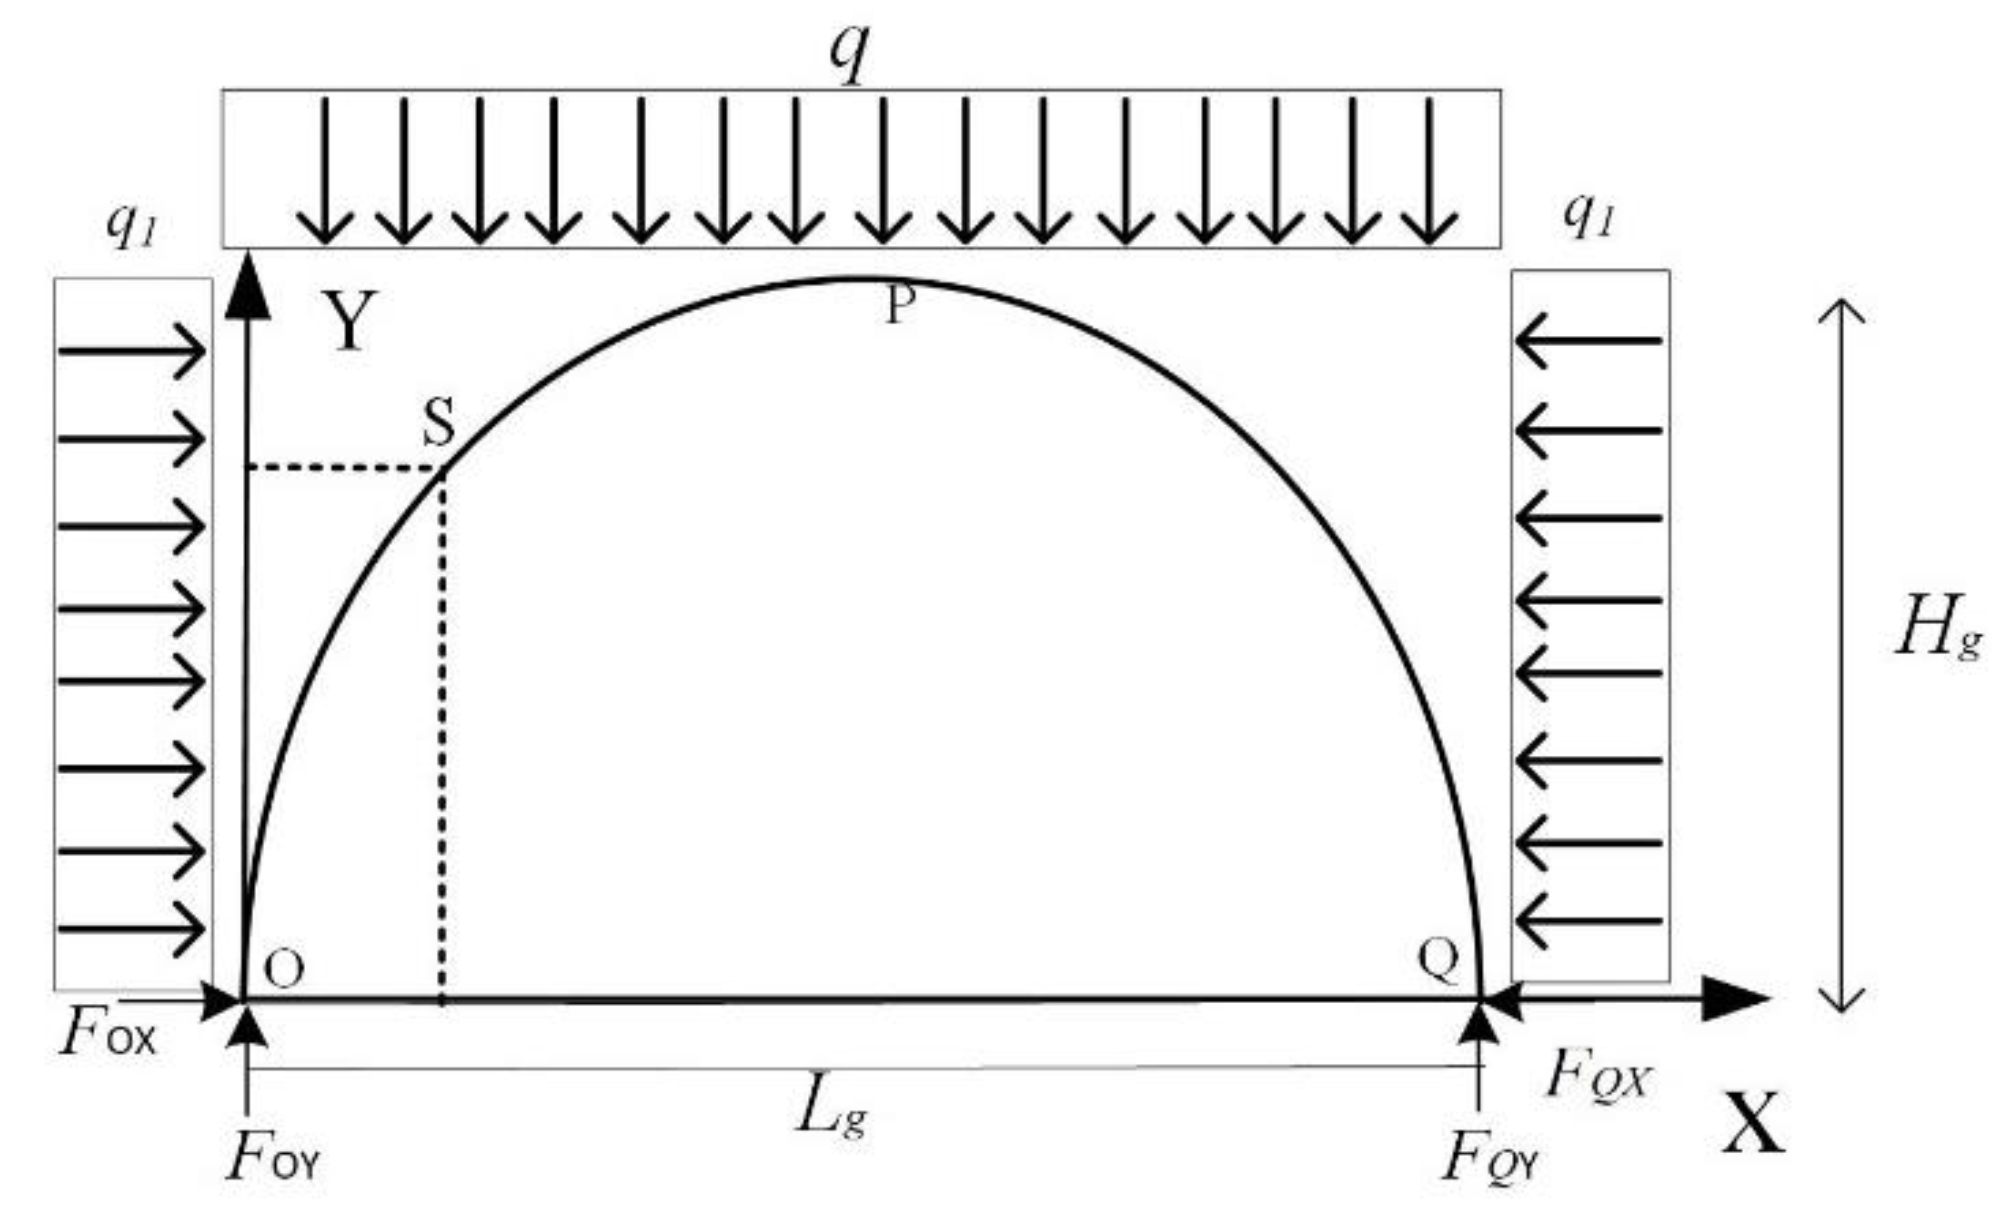
2.2.3. Structural Arch Internal Force Distribution

The arch length Lg = 100 m, the arch height Hg = 40 m, the pressure coefficient γ = 1, and the uniform load q = 10 MPa. By calculating the bending moment value of any point on the structural arch, the contour map of the internal force distribution of the three-dimensional surface is made by using Matlab numerical fitting software, as shown in Figure 13:
According to the analysis of the curved surface image, it can be seen that due to the subsidence and collapse of the overlying rock after full mining, the arch structure has been gradually compacted in the front half of the working face, and the arch structure has become more stable. The internal force distribution of the structural arch is approximately a ‘W’ shape, and the equipotential line of the bending moment projection is gradually increasing from the center to both sides. The maximum value of the bending moment is at the arch waist near the arch foot. It can be seen that due to the small area of the vault in the arch fracture zone formed by the collapse of the overlying strata, the load of the overlying strata is transmitted from the vault along the arch waist to the arch foot, and the size increases first and then decreases, reaching the maximum near the arch foot, then decreases rapidly, and reaches the minimum at the arch foot. Because the caved rock at the arch foot has been compacted in the mined-out area, the load decreases rapidly after transferring to the arch foot and continues to transfer to the deep rock mass along the coal wall. Its evolution process is quite consistent with the above theoretical analysis.

3. Numerical Model and Calculation Scheme

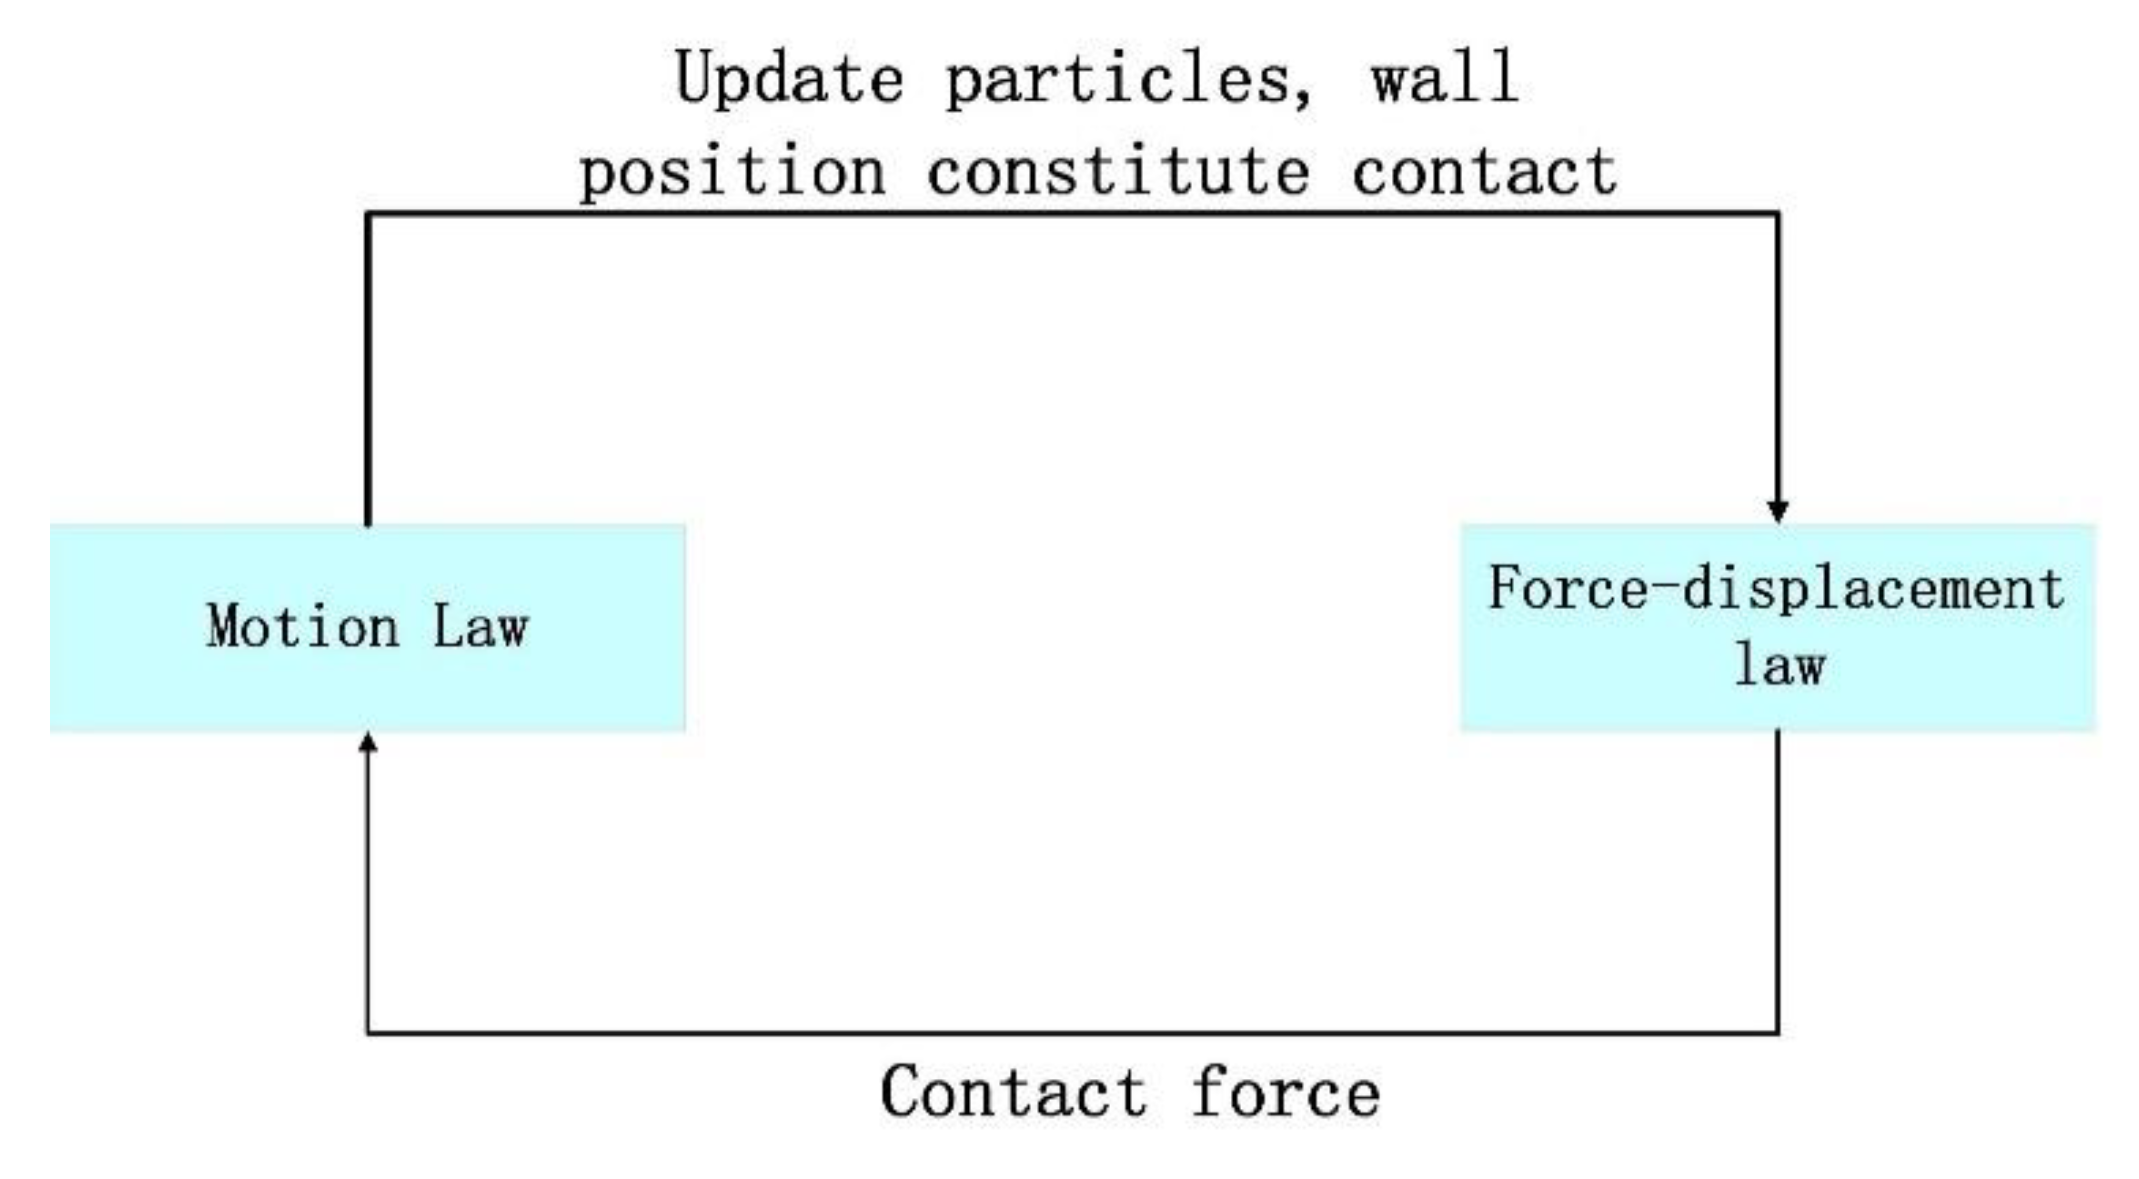
3.1. Overview of PFC Simulation Methods

The PFC particle flow code is a discrete element method. Its basic unit is granular particles, which generate displacement and force through the extrusion contact between particles and the movement of particles. Particle flow was first mainly used in the analysis of granular materials; with the deepening of people’s research, granular materials can not meet people’s research on solid materials, where the introduction of bonding properties between the particles (including parallel bonding and contact bonding) to achieve similar mechanical properties of solid materials. At the same time, particles can generate a variety of shapes to reach the basic unit of rock mass, similar to the actual engineering geology through bonding. Because the characteristics of particles can be bonded and formed at will and can move freely without being limited by displacement, they have obvious advantages in simulating large deformation problems, especially failure and fracture problems. At the same time, they can simulate and analyze the progressive failure and fracture process of materials, which is very suitable for analyzing the mechanical characteristics of rock failure, the PFC calculation flow is shown in Figure 14.
The PFC particle flow numerical method is based on Newton’s second law and force-displacement law to calculate the particles of the model. The motion of the particles follows Newton’s second law, and the interaction between the particles obeys the force-displacement law. Newton’s second law microscopically reflects the movement of granular matter, and the macroscopic performance is the displacement of the object. The law of force and displacement reflects the change of the internal contact force chain of granular matter, and the macroscopic performance is the change of the stress of the object. Both the force-displacement law and Newton’s second law act simultaneously during the operation until the system reaches equilibrium or the set calculation time step is stopped, as shown in Figure 15.
In the PFC model, in addition to the presence of spherical particles representing the material, a ‘wall’ representing the boundary is also included. The contact force generated by the mutual contact between the particles and the wall acts, and the motion equation is satisfied for each particle, but the motion equation is not satisfied for the wall; that is, the contact force acting on the wall will not affect the movement of the wall. The movement of the wall is artificially given speed and is not affected by the contact force acting on it. Similarly, there is no contact force between the two walls, so PFC only has a particle–particle contact model and particle–wall contact model, as shown in Figure 16.
In this paper, a linear parallel bonding model is established. The bonding component is parallel to the linear element, and the elastic interaction is established between the contacts. Parallel bonding can transfer force and torque between different entities. The contact bond can be regarded as a set of springs. The normal and tangential stiffnesses are kept as constants, which are evenly distributed on the contact surface and the central contact point. These springs are parallel to the linear element springs. After the parallel key is generated, the relative motion occurs at the contact, which causes the force and moment inside the bonding material. This force and moment act on two contact blocks and are related to the maximum normal stress and shear stress of the bond material around the bond. If these stresses exceed their corresponding bond strength and the parallel bond breaks, the bond and its accompanying force, moment, and stiffness are removed, as shown in Figure 17.
Parallel bond normal force F ¯ n , Tangential force F ¯ s and moment M. The expression is:
F ¯ n = F ¯ n + k n ¯ S ¯ Δ δ n
F ¯ s = F ¯ s k s ¯ S ¯ Δ δ s
M ¯ = M t ¯ n ¯ + M b ¯
In the formula, S is parallel bonding area; n ¯ is normal vector; Δ δ n is Normal displacement increment; Δ δ s is Tangential displacement increment; M t ¯ is moment of twisting; M b ¯ is bending moment. The expression is
M t ¯ = 0                                             , 2 D M t ¯ k s ¯ J ¯ Δ θ t , 3 D
In the formula, Δθt is Torsion angle increment; Δθb is Bending angle increment; J is Resistance to torsion Section modulus; I is the Modulus of the resisting bending section. The maximum normal and tangential stresses of the parallel bond are updated iteratively, as shown in Formulas (34) and (35):
σ ¯ = F n ¯ S ¯ + β ¯ M b R ¯ I
τ ¯ = F s ¯ S ¯ + 0                     , 2 D β ¯ M t ¯ R ¯ J ¯ , 3 D
In the formula, β is Torque contribution factor; R is Average radius of contact particles. The parallel bond fracture criterion is
σ ¯ σ c ¯   ( Stretching   damage )
τ ¯ τ c ¯   ( Shear   failure )  
The calculation formula for parallel bond shear strength is
τ c ¯ = c ¯ σ ¯ cot φ ¯
In the formula, c is cohesion; φ is the angle of internal friction.

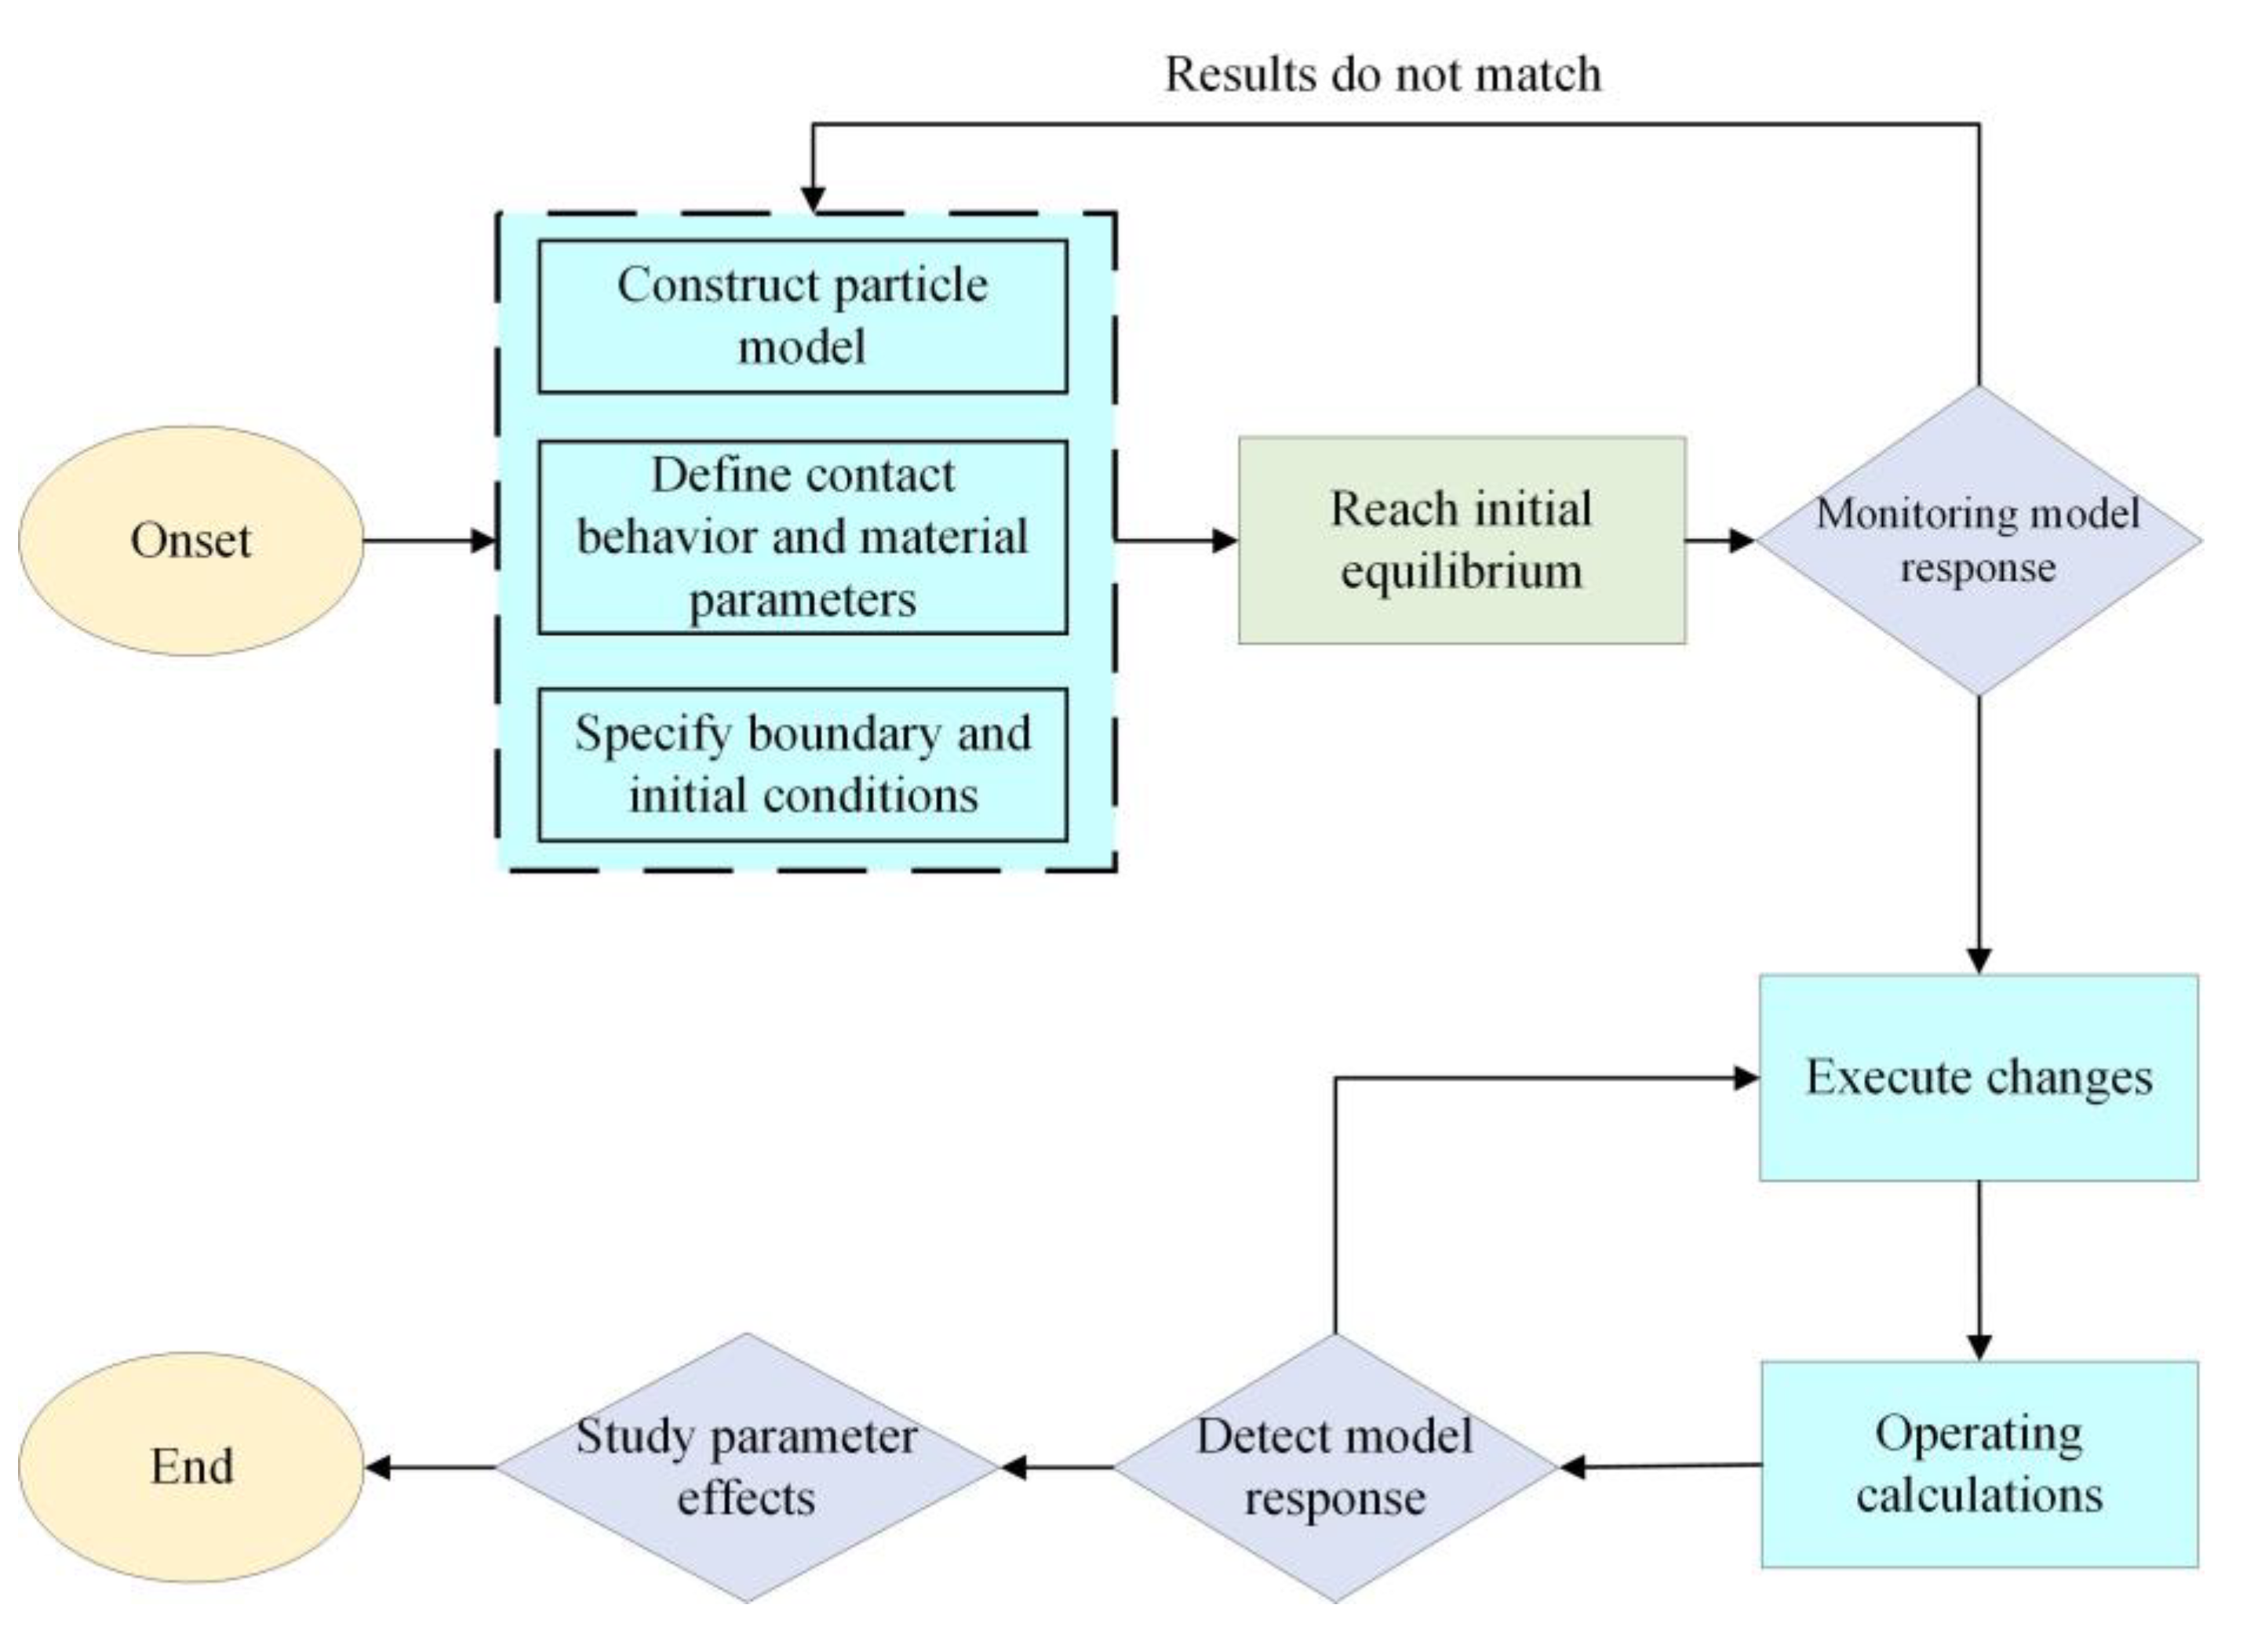
3.2. Establishment of Numerical Calculation Model

3.2.1. Modelling Principles

It is particularly important to establish a reasonable and accurate numerical model in order to correctly reveal the instability and failure law of load transfer evolution of deep high-stress mining overburden. Therefore, the establishment of the model needs to follow the following principles:
(1)
The movement and stress change of deep high-stress overlying strata are affected by geological factors and mining technology; the actual situation is more complex. When establishing the numerical calculation model, it is necessary to simplify the model as much as possible, remove the secondary influencing factors, and establish the model mainly considering the main influencing factors.
(2)
Consider boundary conditions. Compared with the actual situation, the numerical simulation calculation belongs to the finite element structural analysis. In order to avoid the influence of the boundary effect on the simulation results, it is necessary to reserve space at the boundary to set up protective coal pillars.
(3)
The establishment of the model needs to restore the actual situation as much as possible. The parameters used in the model correspond to the actual situation one by one. Considering the lithological characteristics, it conforms to the applied mechanical properties.

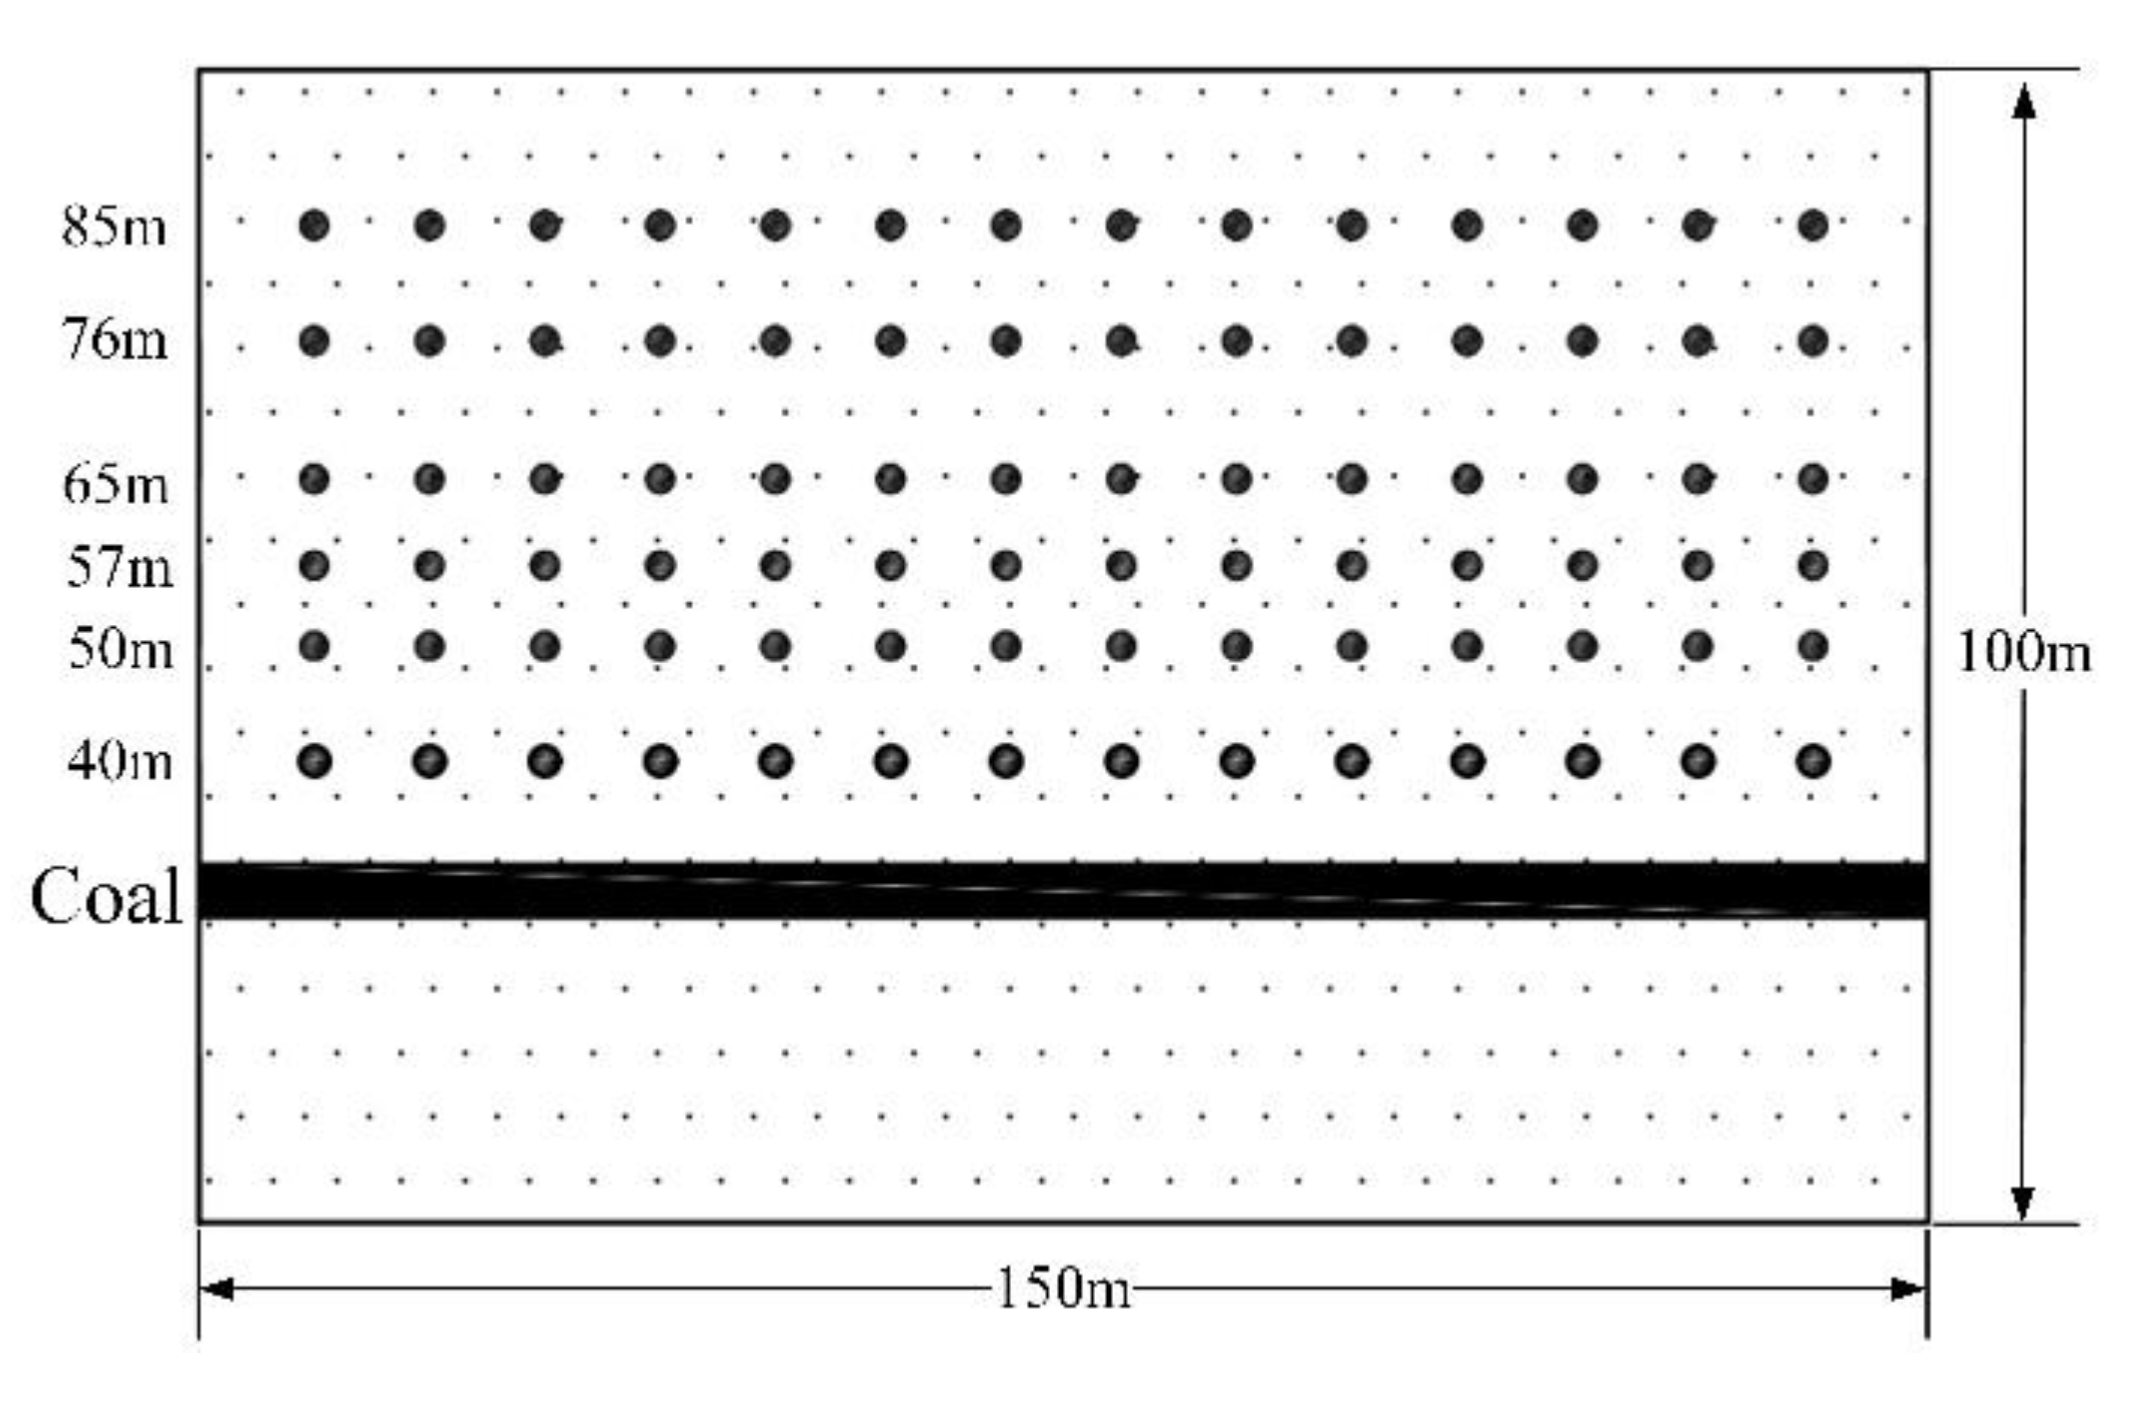
3.2.2. Establishment of the Model

A working face in Wangjialing coal mine is located in the northeast of 123 panel. The elevation of the floor of the working face is +518~+607 m, the burial depth of the coal seam is 415~570 m, the strike of the working face is east–west, the strike length is 784.9 m, the tendency direction is north–south, and the length is 100 m. The working face mining coal seam is 2# coal seam, the thickness of the coal seam is 3.09–8.50 m, the average coal thickness is 6.20 m, and the dip angle of the coal seam is −3~+2°. The roof of the working face is mostly mudstone and sandstone, and its basic roof is a layer of medium–fine grain sandstone, the condition of the top plate is shown in Table 1.
According to the geological information of a working face in the Wangjialing coal mine, the numerical simulation model is established by combining the physical parameters of rock mechanics. Since the actual hydrogeological conditions are complex, considering the purpose of the simulation study, the model is simplified to the following conditions: Model length X = 150 m, high Y = 100 m, particle size in the range of 0.6–1.0 m, according to the different lithology given the corresponding mechanical parameters, the lithology similar rock into a group, the model consists of 13 groups. In the original geological conditions, the average dip angle of 2# coal seam is 2.5°, which can be approximated as a horizontal coal seam, so the coal seam is arranged horizontally in the model. The basic boundary conditions of the model are set as follows: the upper boundary is a free boundary, and the equivalent load of 10 MPa is applied to the top wall of the model by servo function control. When the load on the wall corresponds to the gravity of the overlying rock mass, the wall stops moving. The lower boundary is fixed to restrict the vertical motion. Fixed left and right boundaries limit horizontal movement and allow vertical movement. In order to prevent boundary effects, the excavation roadway is 30 m away from the left and right boundaries of the model as a protective coal pillar. The model plan is divided into nine excavations, and the excavation distance is 10 m, 20 m, 30 m, 40 m, 50 m, 60 m, 70 m, 80 m, and 90 m. Through the actual situation and access to information, coal and rock macro mechanical parameters and particle micromechanical parameters are shown in Table 2 and Table 3

3.3. PFC Simulation Results Analysis

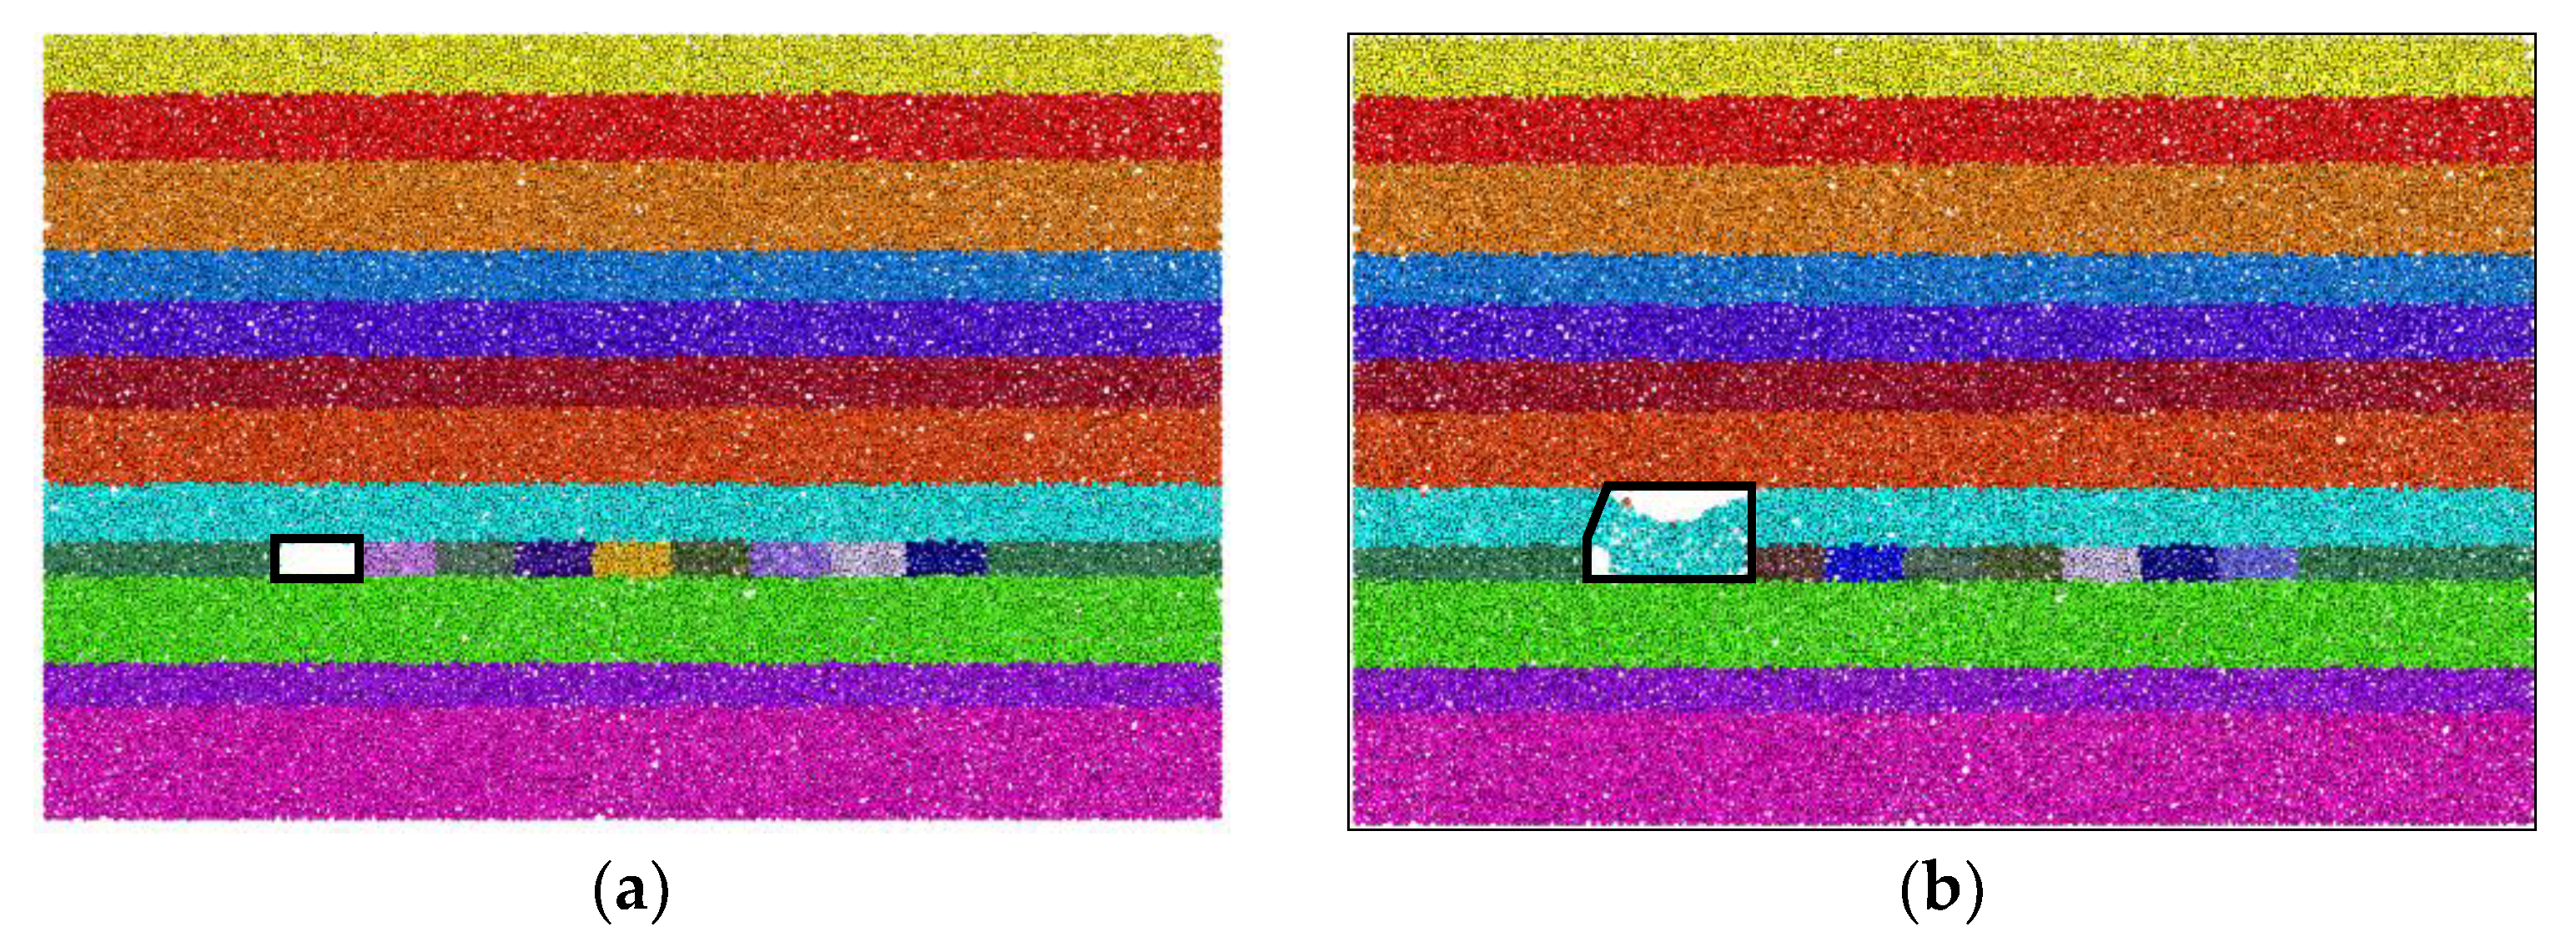
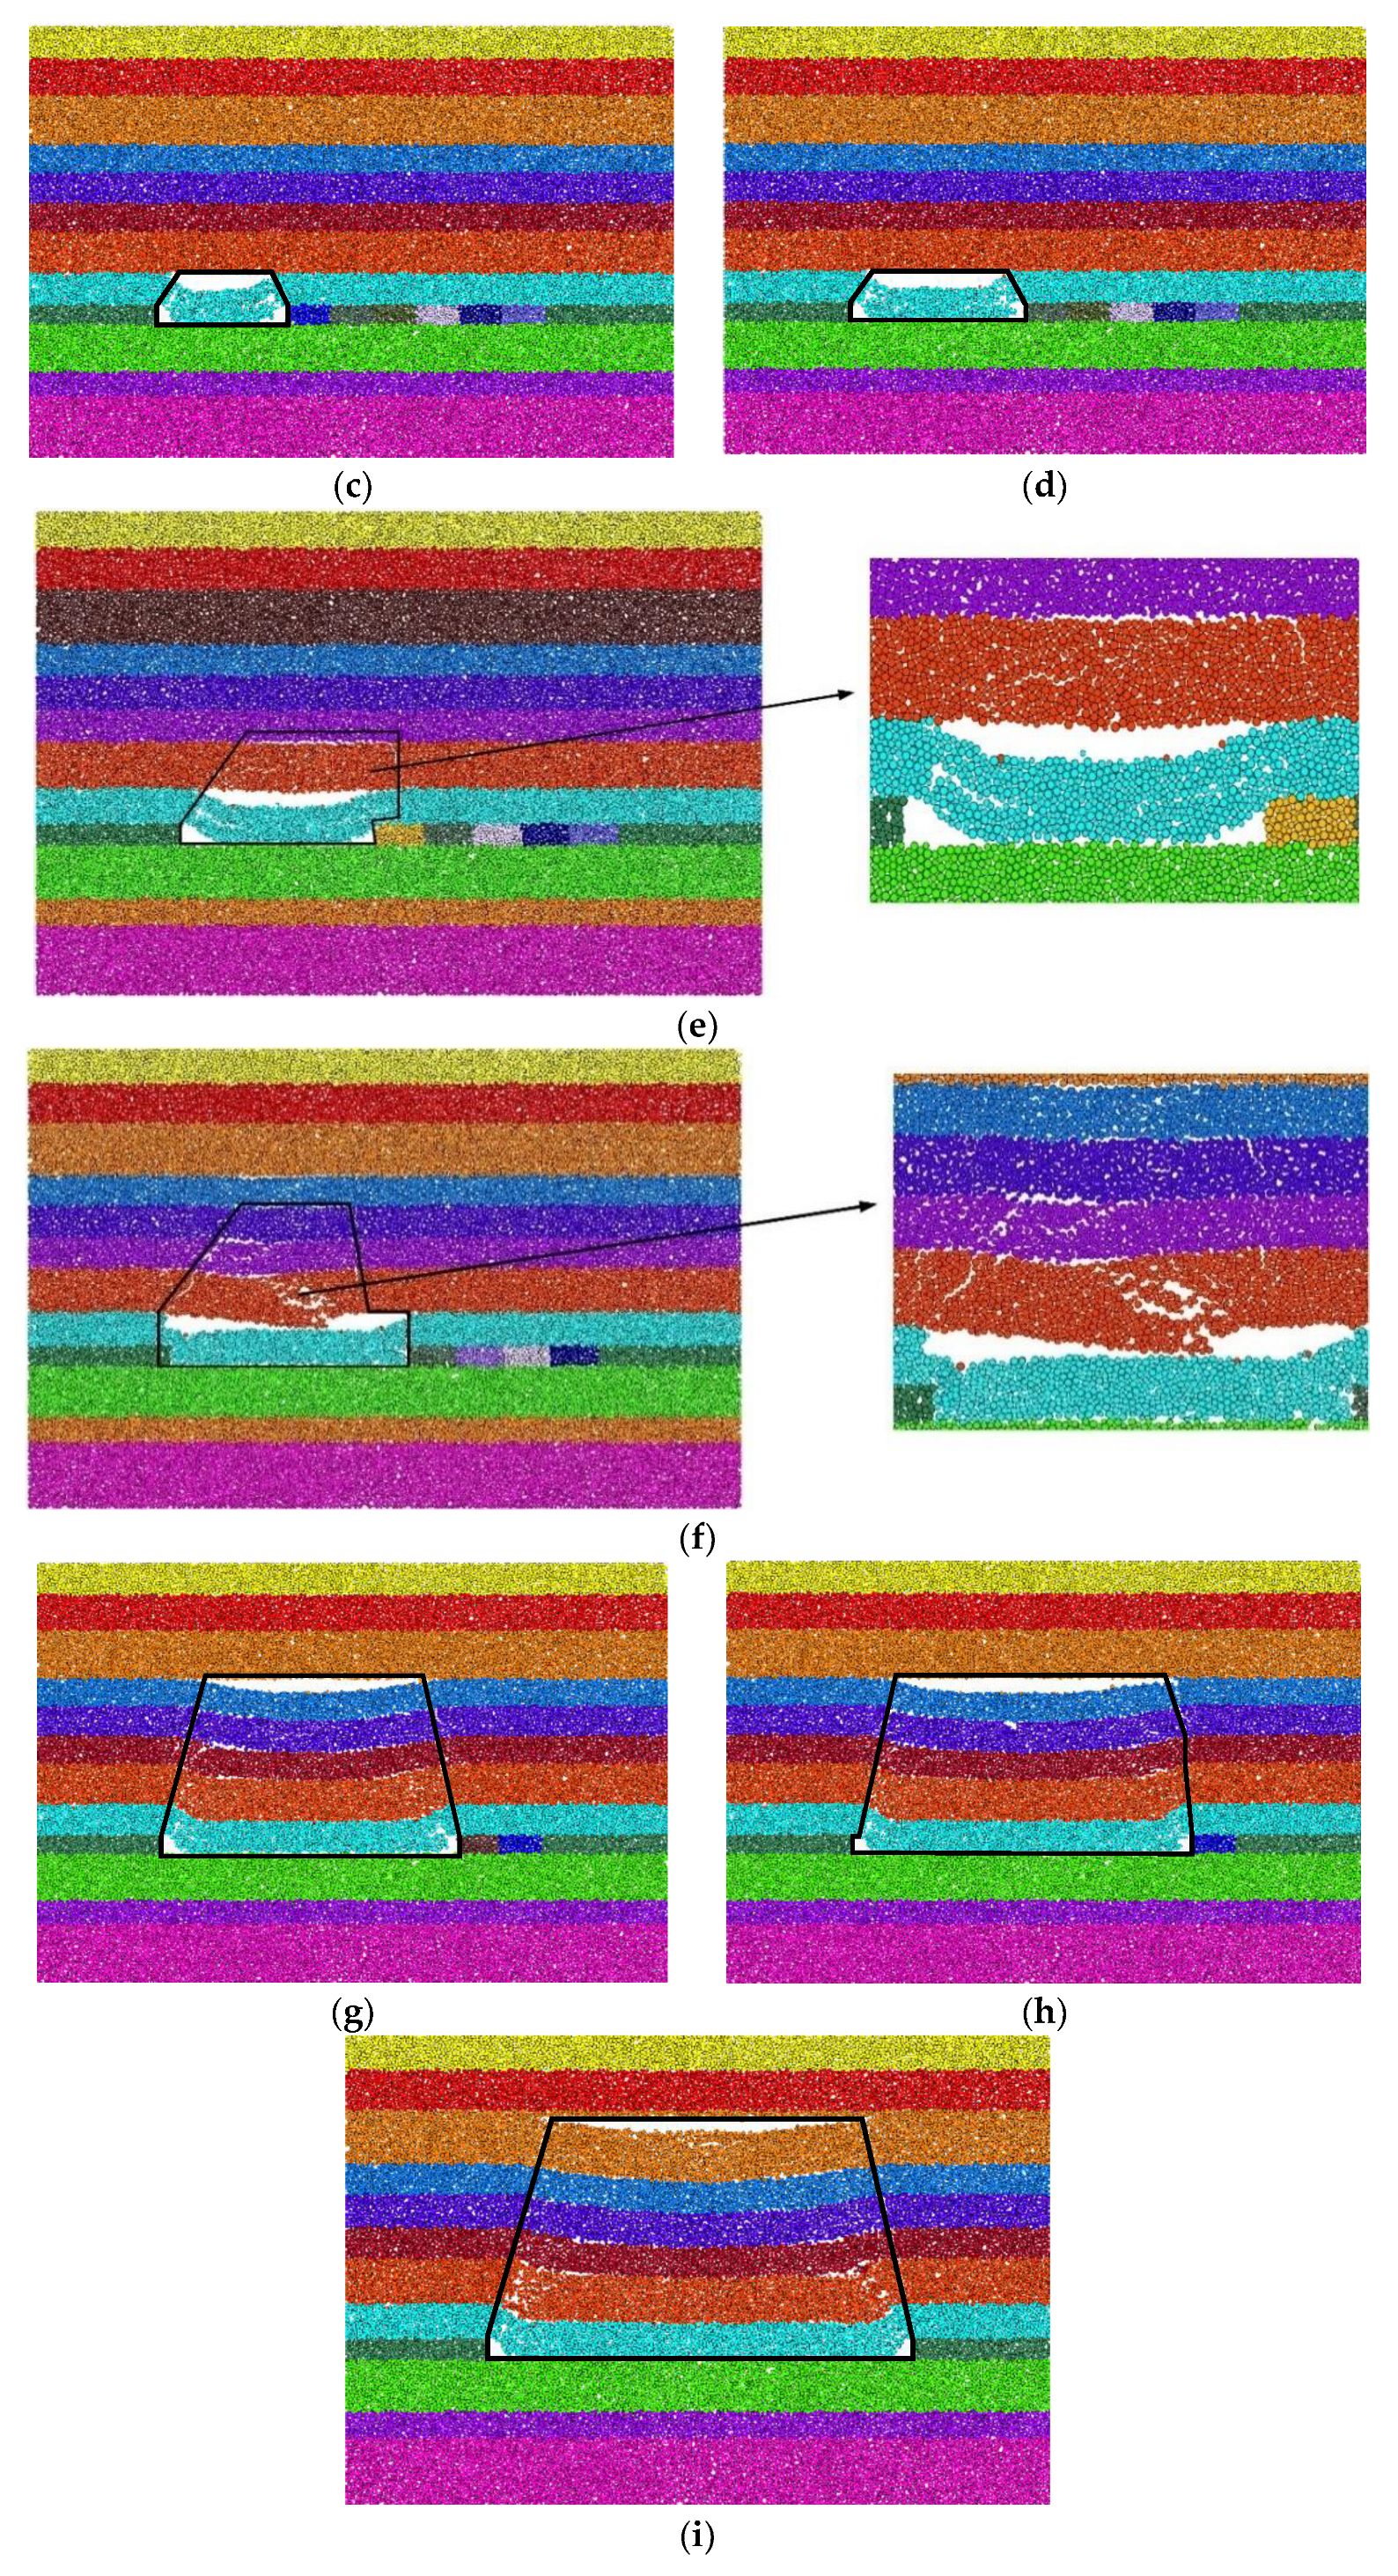
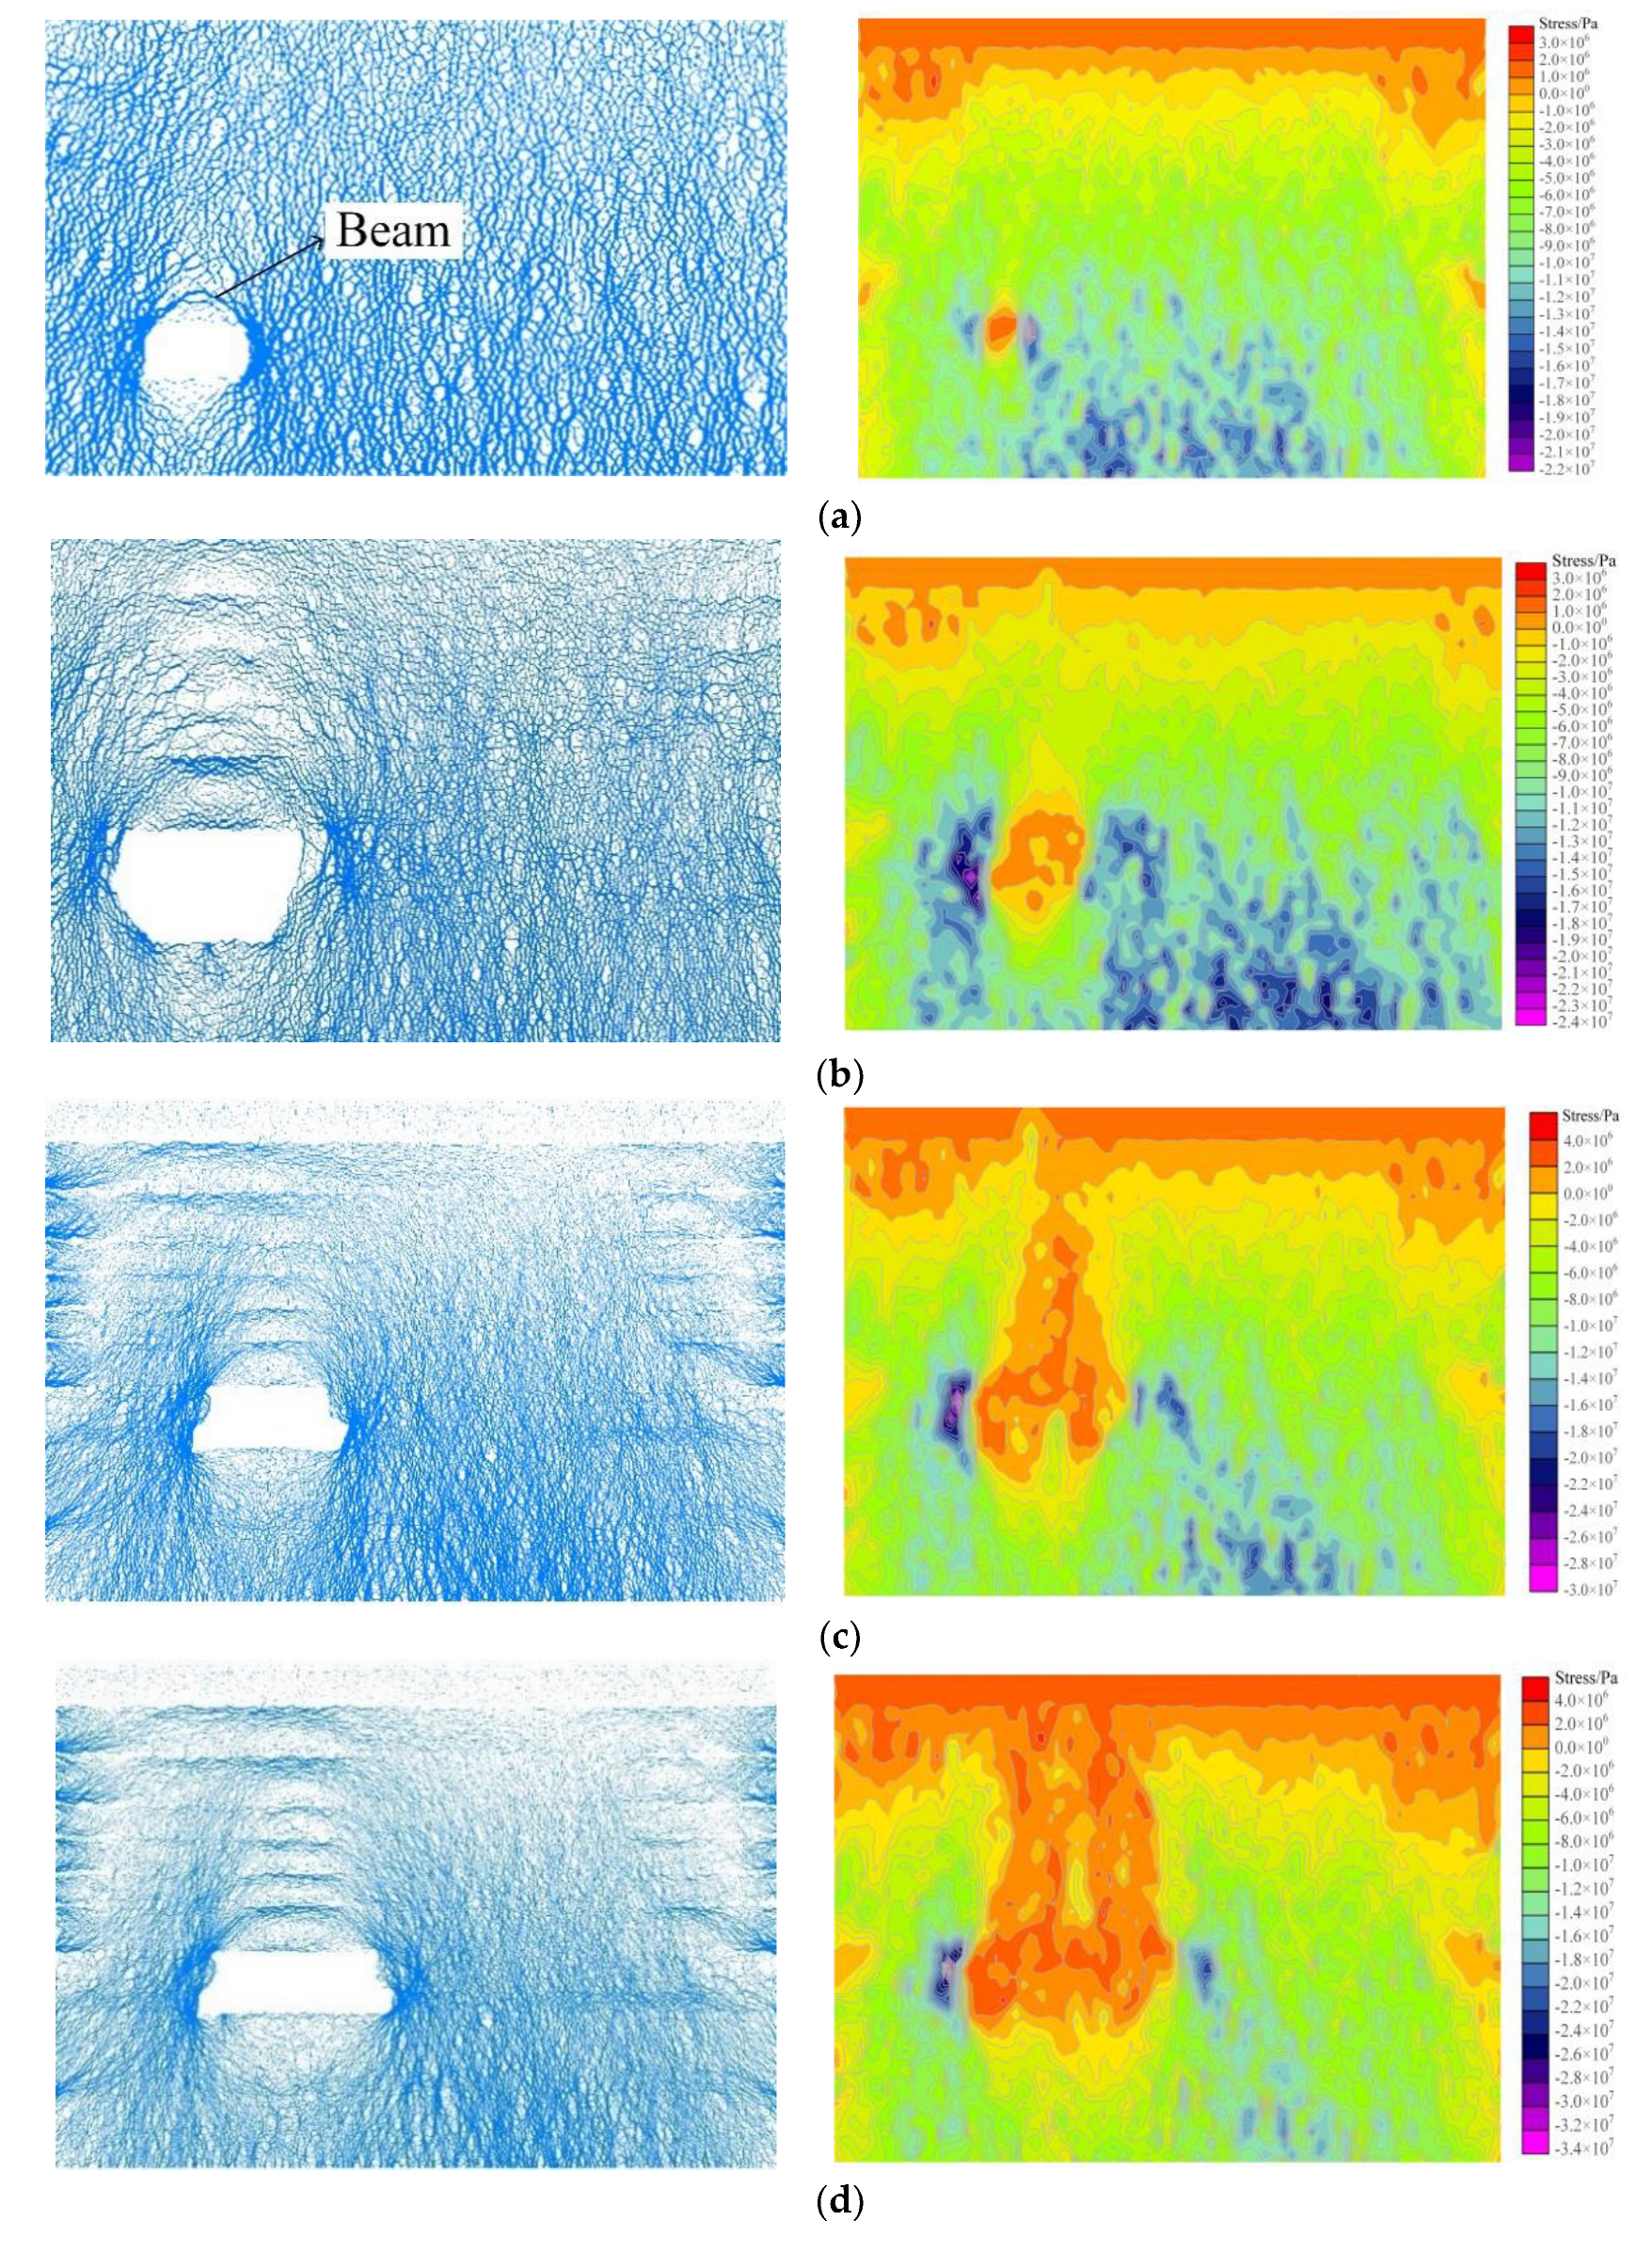
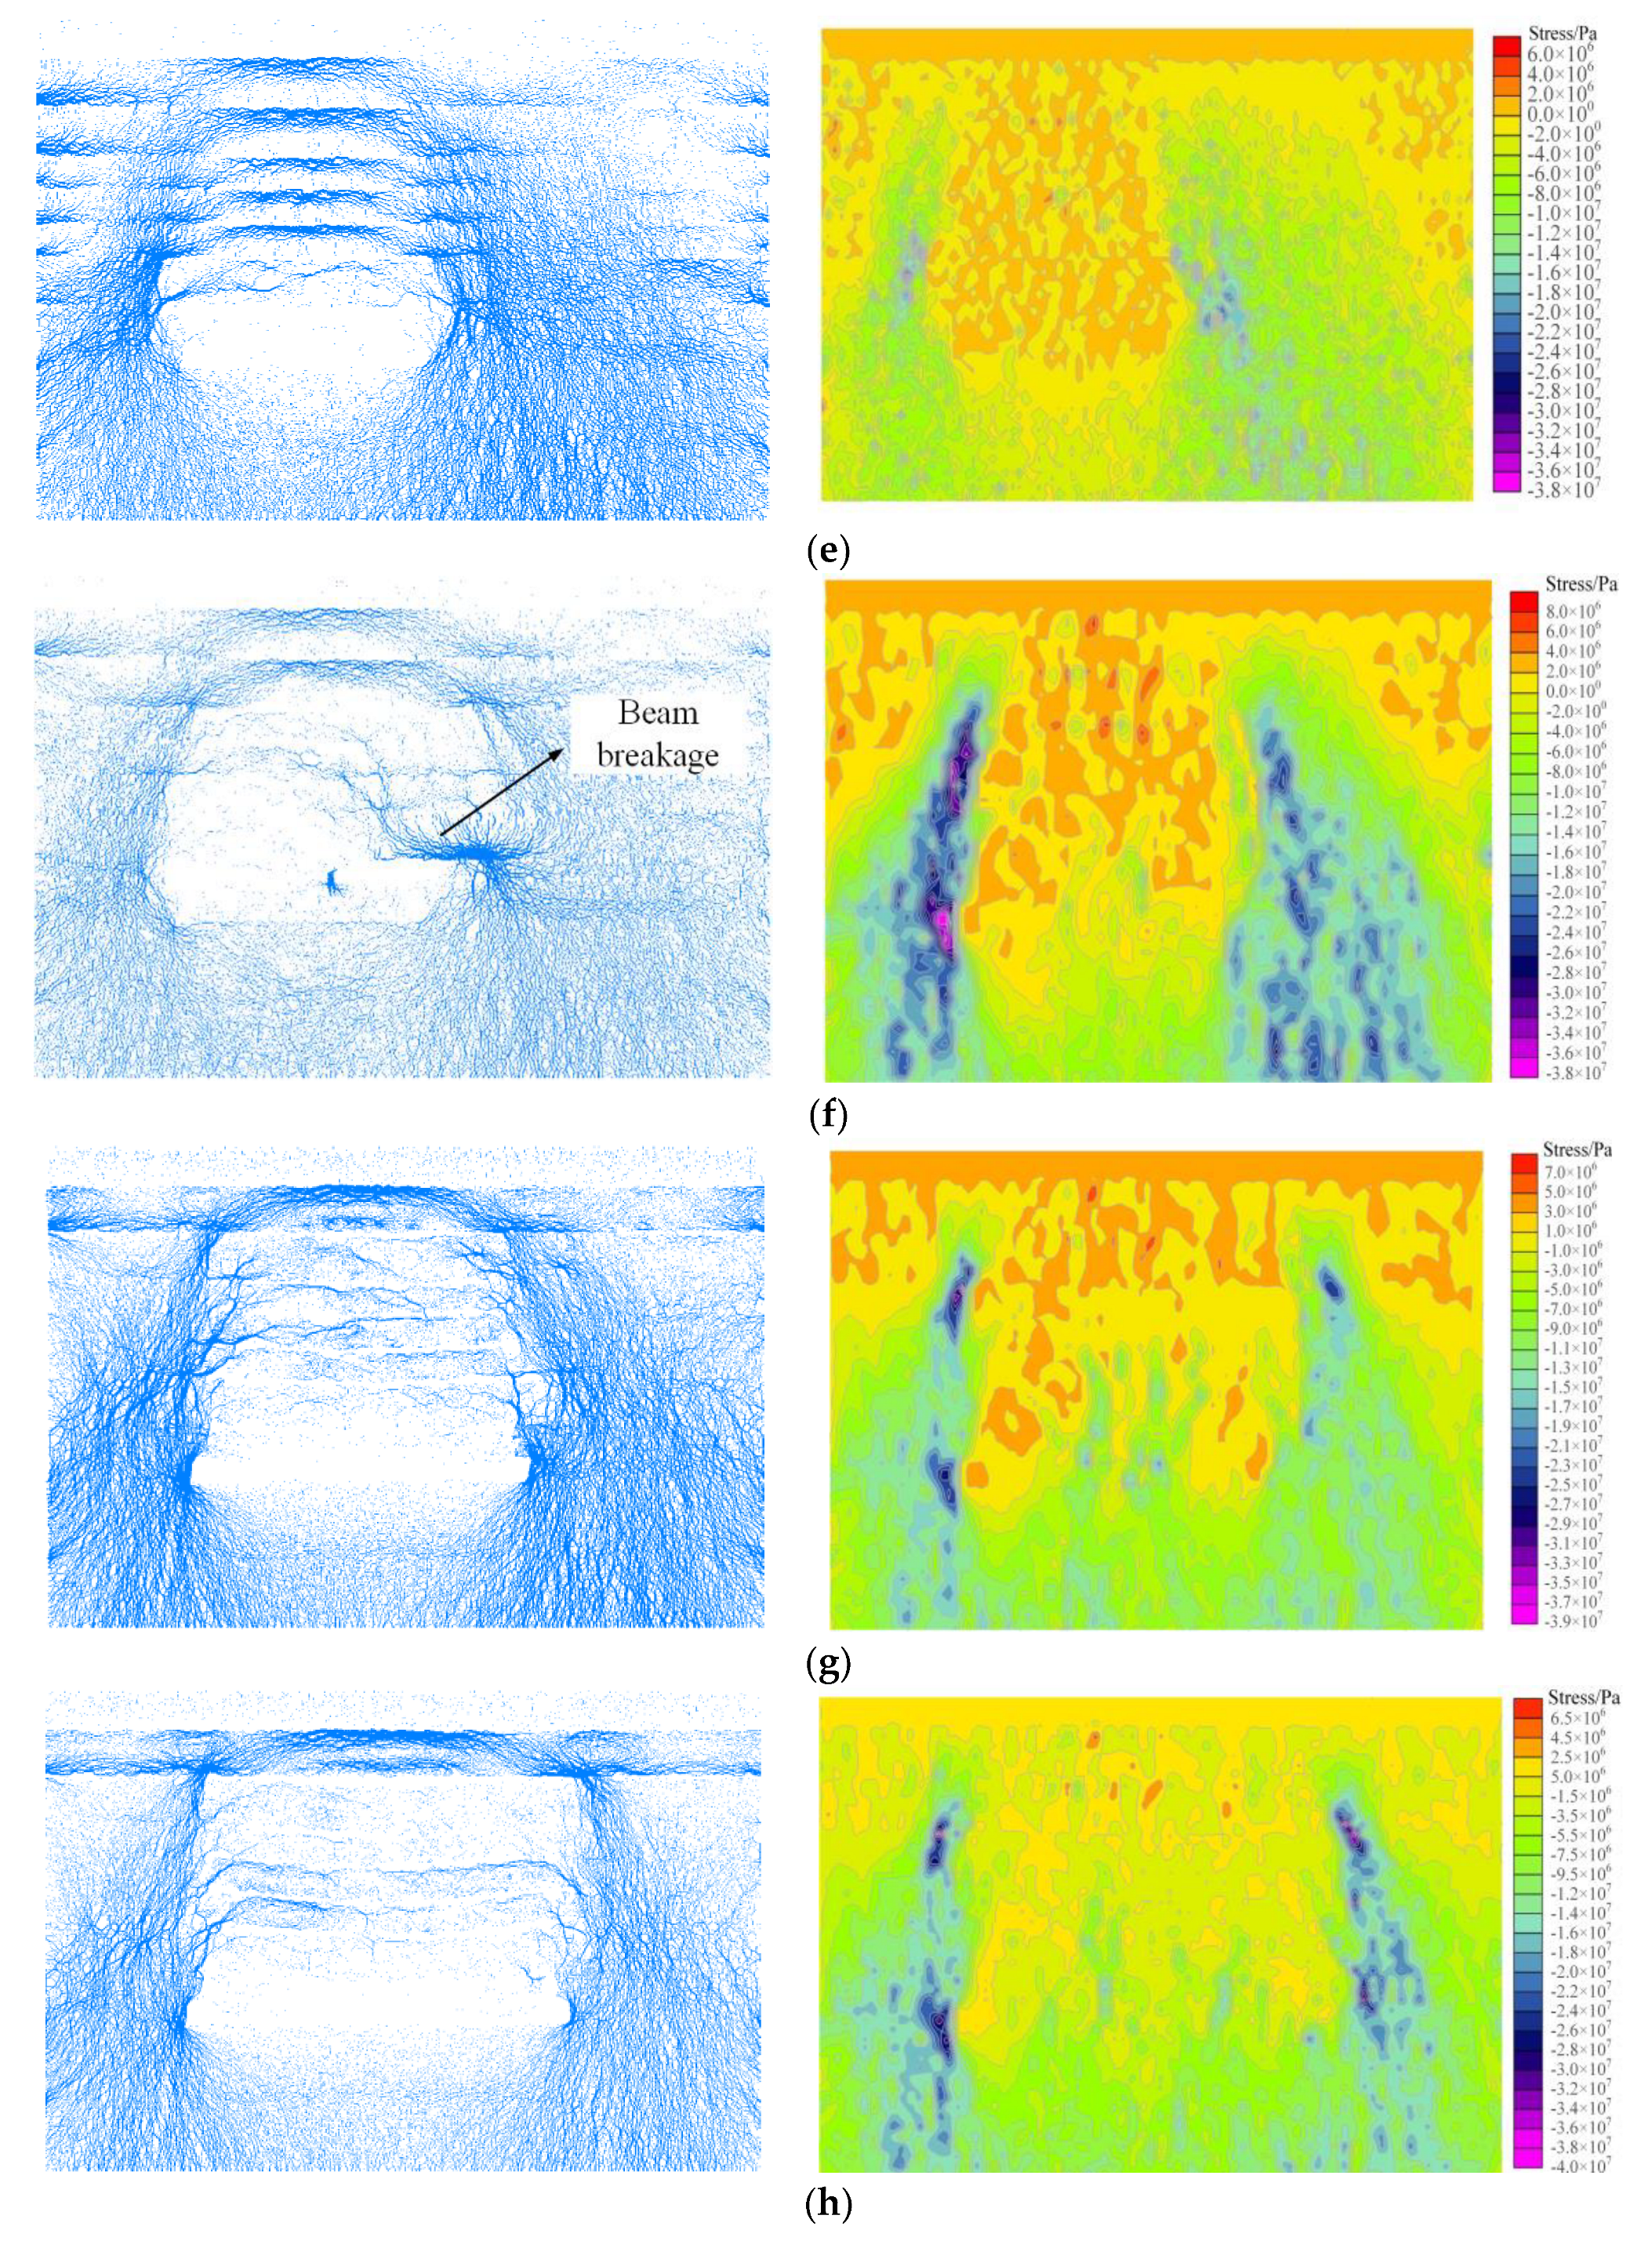
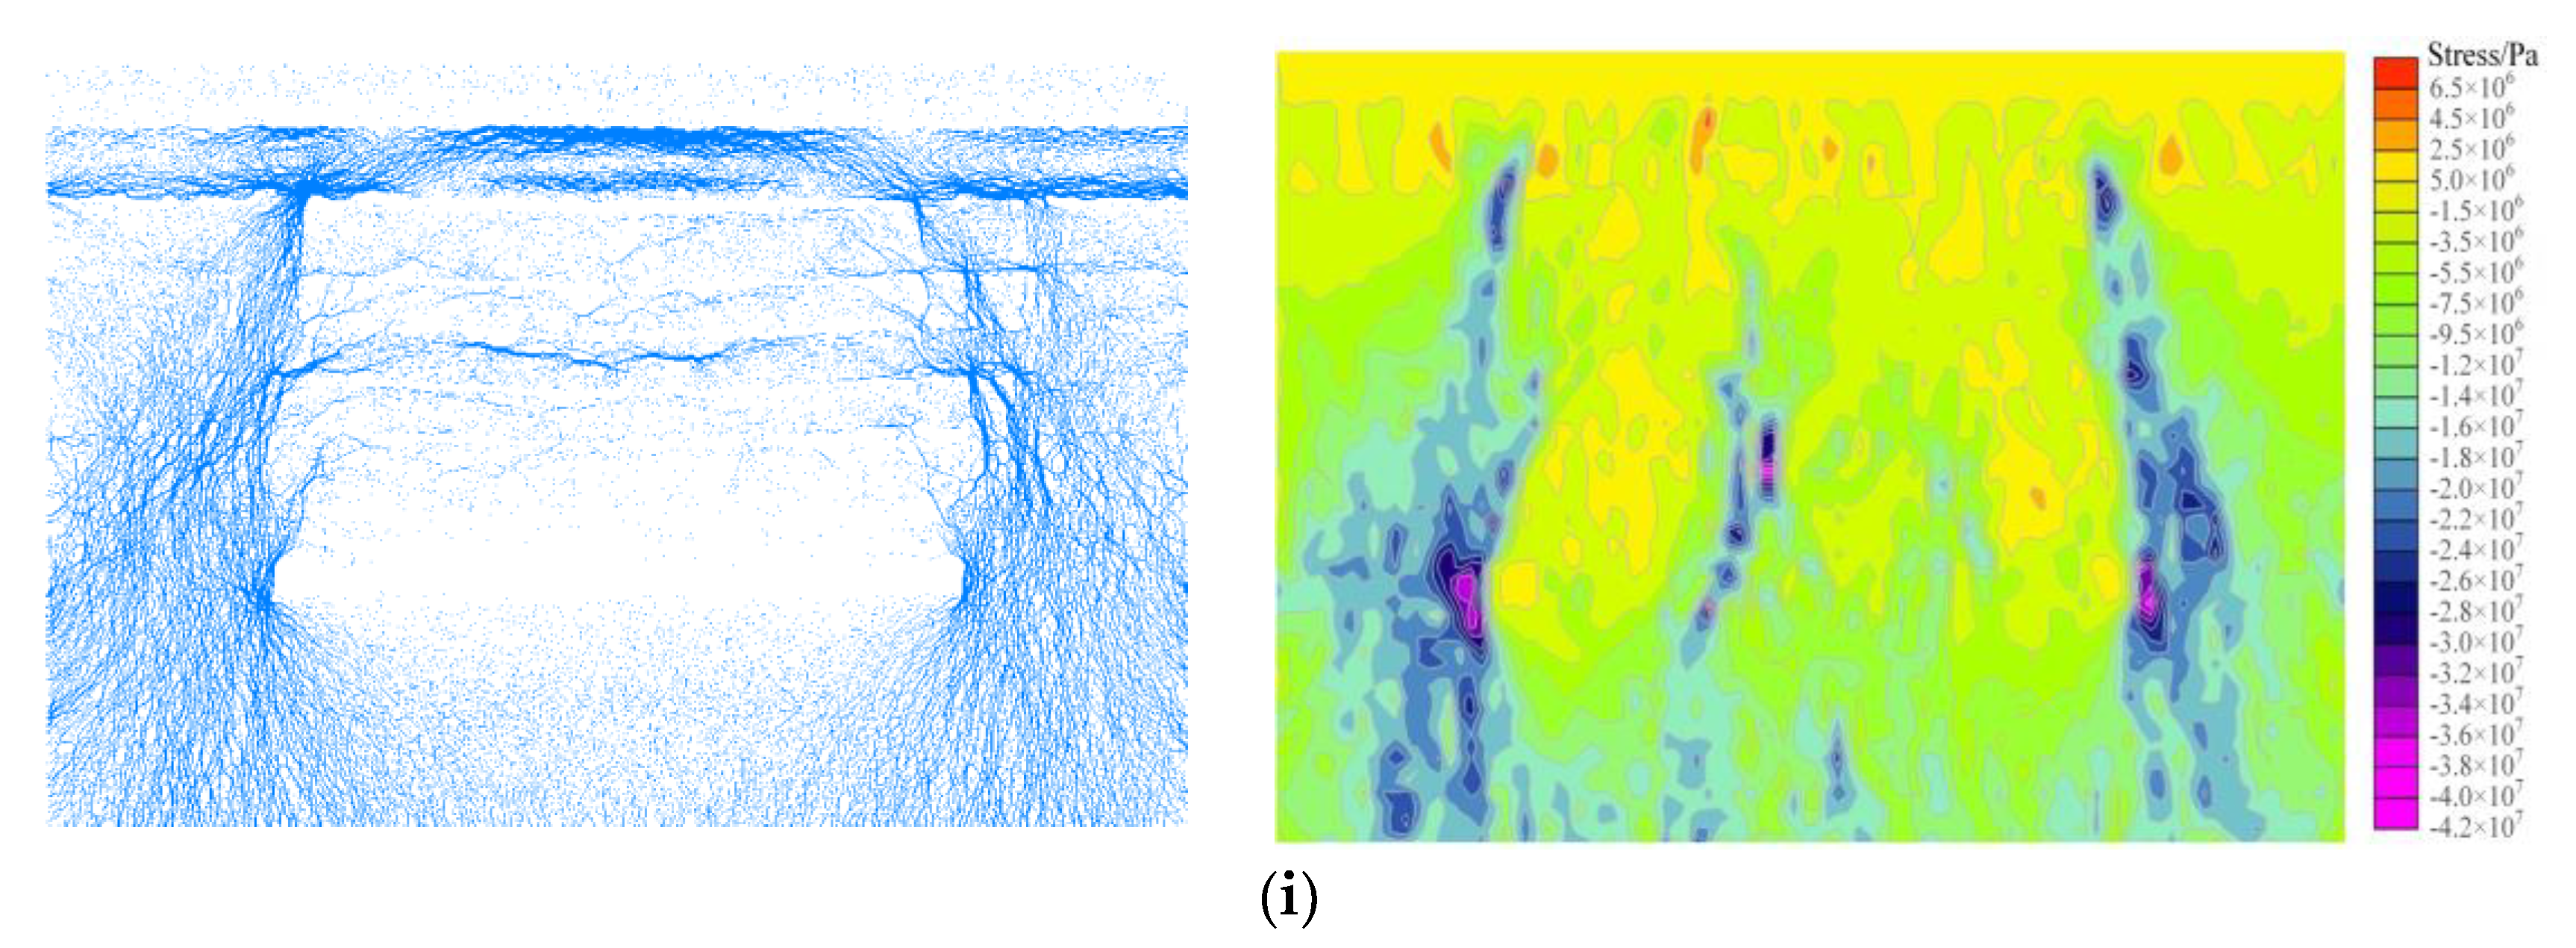
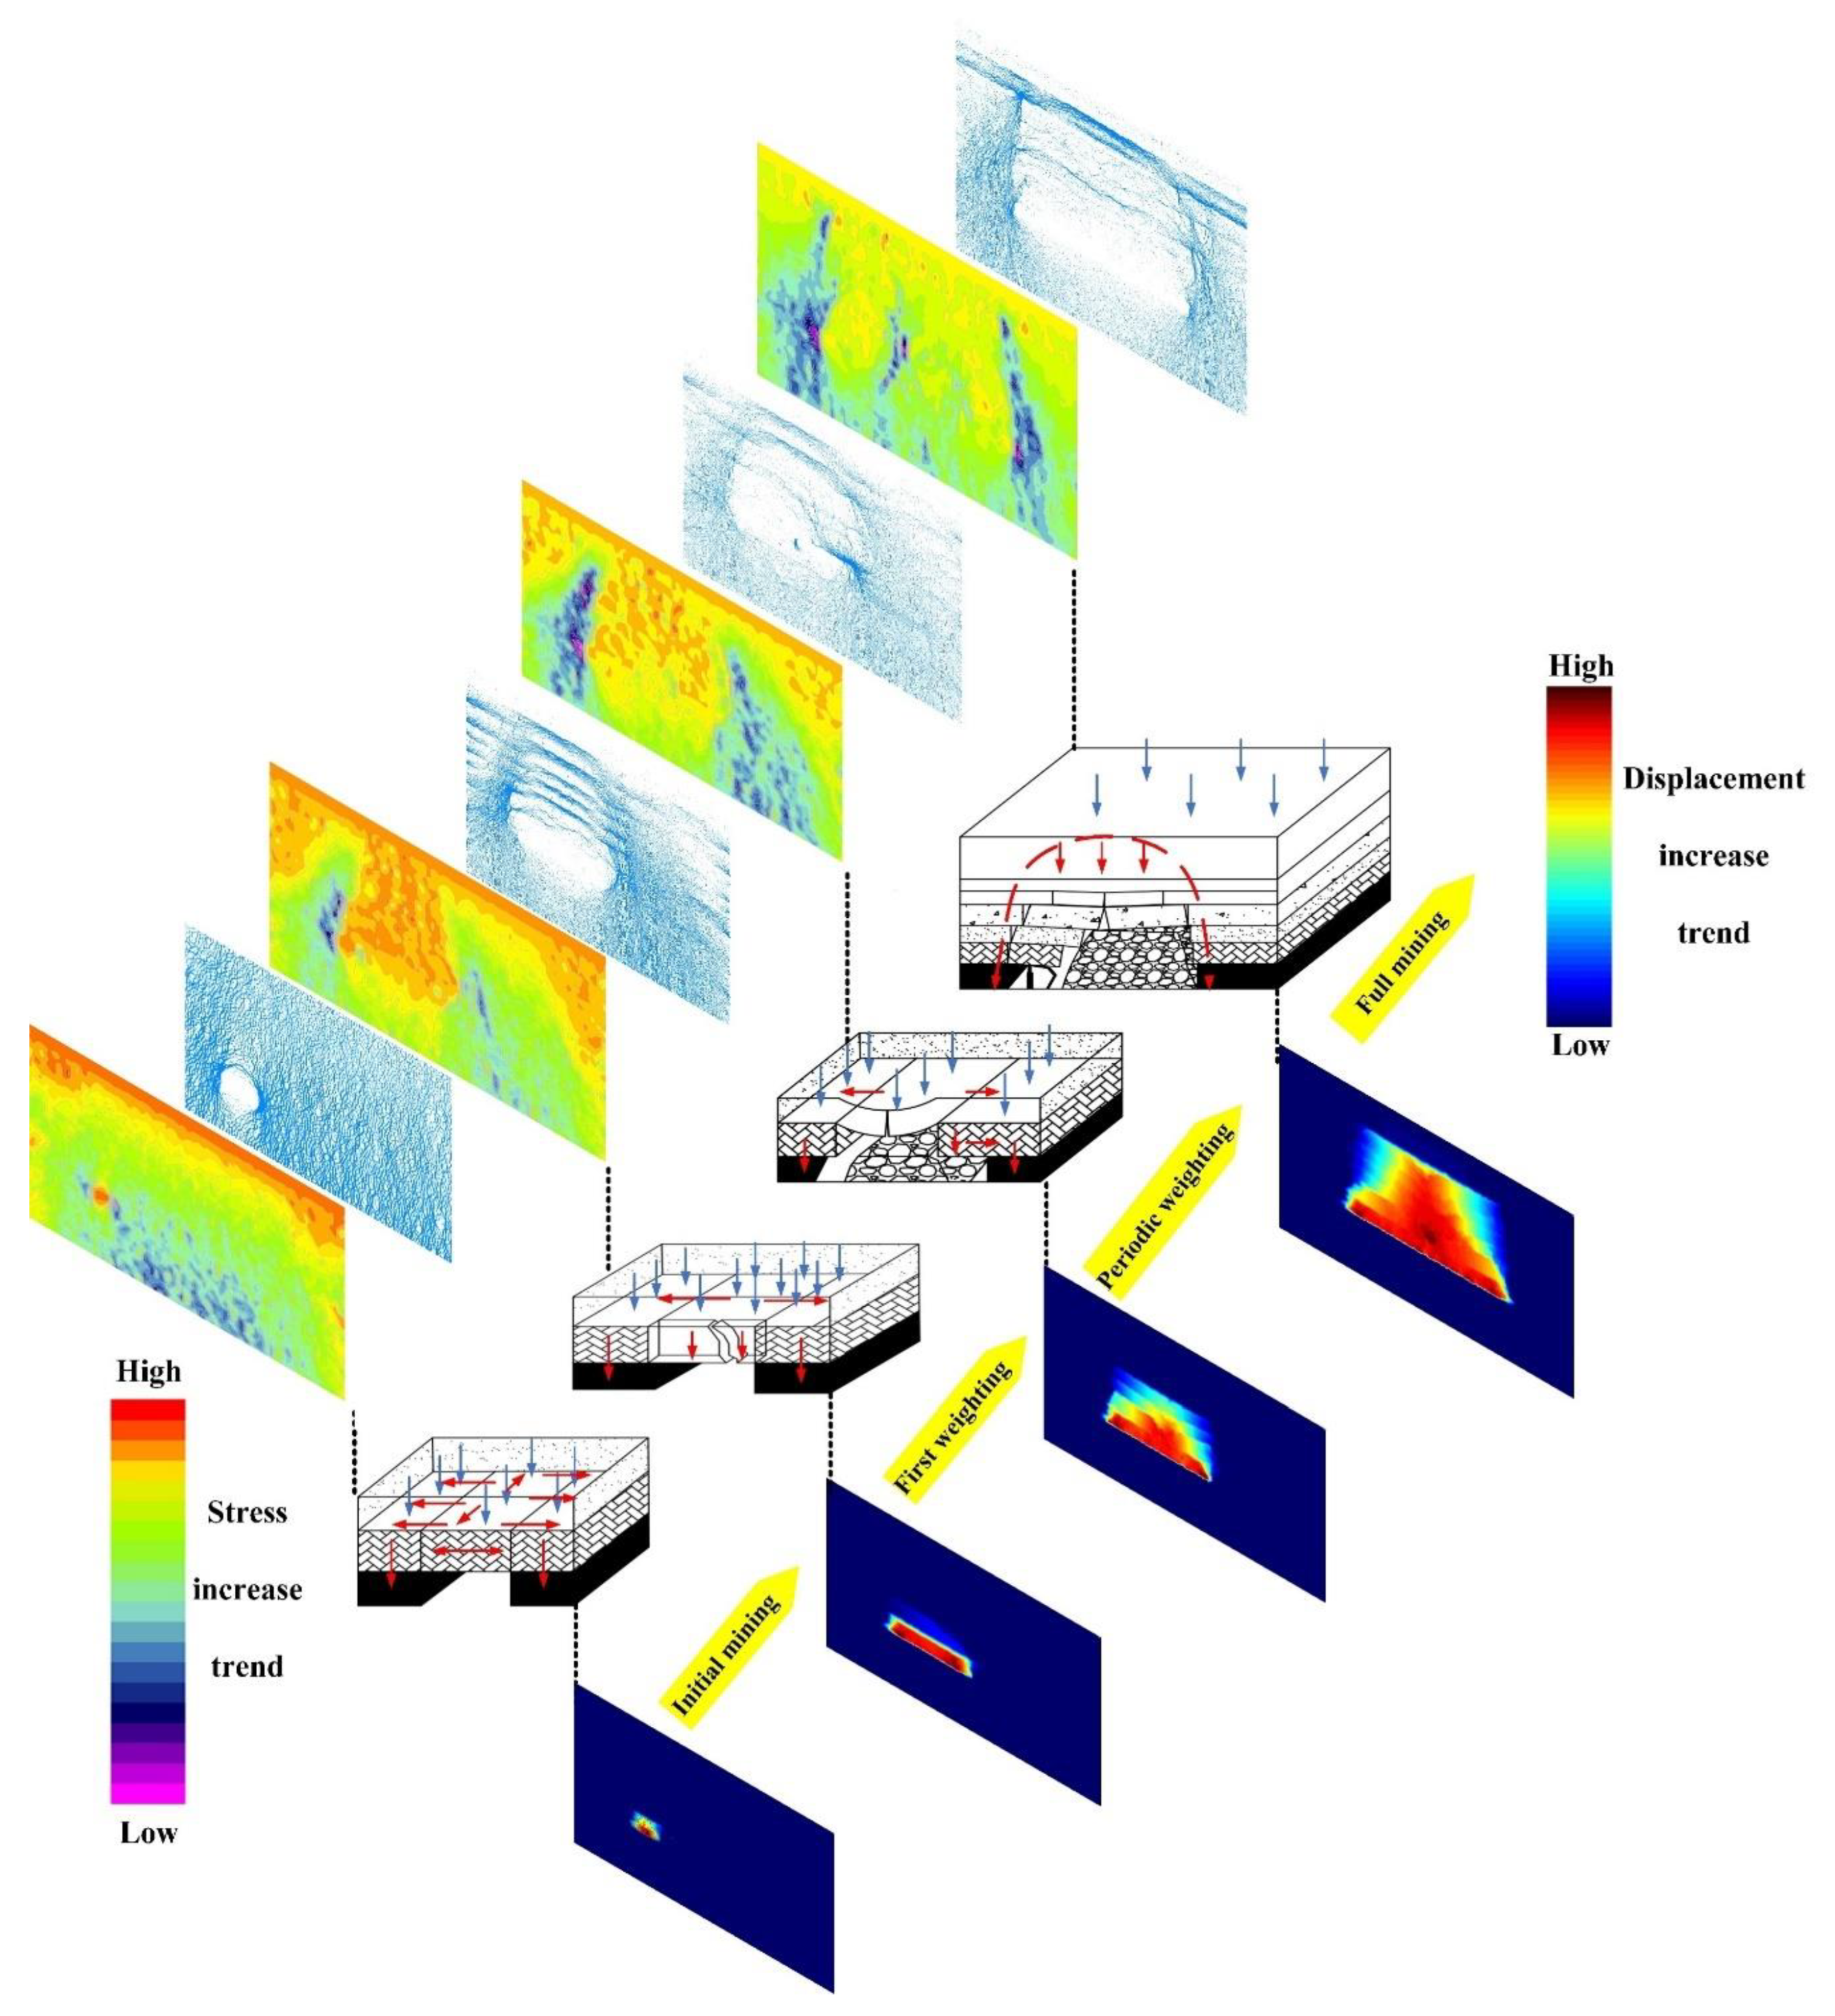
3.3.1. Overburden Rock Failure Characteristics

Simulate mining of the working face. The different color areas in the figure below represent different rock layers with different properties and record the deformation and failure process of the roof overburden. Now, the fracture morphology of the roof overburden with different advancing distances is studied.
When the coal mining face began to advance 10 m, there were small cracks in the immediate roof, and the roof of the coal seam appeared slightly bending and sinking, but the cracks were small and did not penetrate the immediate roof, and the immediate roof did not collapse significantly. When the working face advances to 20 m, the small cracks inside the immediate roof of the coal seam gradually develop and penetrate, and the immediate roof collapses. The height of the caving zone is 4.45 m.
When the working face continues to advance to 30 m, with the increase of the advancing distance, the roof hanging area above the goaf gradually increases. Affected by the pressure of the overlying strata and its own gravity, the roof cracks increase, and the roof further collapses. At this time, the height of the caving zone is 4.45 m. When the working face advances to 40 m, the roof further ruptures and collapses with the advancement of the working face. However, due to the large structural strength of the upper basic roof, it can withstand the greater load capacity of the overlying strata. There is no obvious crack in the rock stratum, and the bending subsidence phenomenon is not obvious. At this time, the height of the caving zone is still 4.45 m.
When the working face is advanced to 50 m, the initial pressure load capacity of the basic roof gradually decreases, and a large number of cracks appear at the roof boundary; that is, the ‘beam’ breaks, and the basic roof has a separation phenomenon, with the obvious sinking phenomenon. After the ‘beam’ is broken, the load on the center of the plate surface increases, and the center of the plate gradually produces unpenetrated small cracks. The plate does not break and does not collapse. At this time, the height of the collapse zone is 5.25 m. When the working face advances to 60 m, the main roof appears periodic weighting, and the cracks inside the plate gradually increase. The development of cracks leads to the fracture of the rock strata. After the main roof is broken by periodic weighting, many small cracks begin to appear in the rock strata with weak load capacity above it, and the separation phenomenon occurs. At this time, the caving height is 7.24 m.
When the working face advances to 70 m, 80 m, and 90 m, due to the periodic weighting of the main roof, the load on the overlying strata becomes larger, and a large number of cracks are generated in the layer and bend and sink with the collapse of the main roof. When advancing to 90 m, the part of the goaf has been gradually compacted in the front half of the working face due to the caving and sinking of the rock strata; the structure of the goaf is more stable, the bending and sinking of the upper rock strata are obviously reduced, and the separation between the upper rock strata is no longer produced. At this time, the overlying strata in the goaf are arched as a whole, and the load capacity of each rock stratum in the arch is greatly reduced. The load of the overlying strata is transferred from the side of the arch to the deep rock mass, and there is no separation between the upper strata of the vault.
In summary, when the advancing distance of the working face is small (advancing 40 m), the immediate roof directly fills the goaf due to its low strength. As the working face continues to advance, the exposed span of the overlying main roof strata continues to increase after the direct roof collapses, forming a fixed beam structure at both ends of the coal wall at the open-off cut. When the fixed beam reaches the limit span, the fixed beam is destroyed, and the first pressure occurs at the working face (as shown in Figure 18e). As the working face continues to advance, a new load structure, namely the plate structure, is formed after the main roof beam breaks (as shown in Figure 18f). With the increase of the exposed area of the plate, the plate is prone to break and form periodic weighting. At the same time, the repeated breaking of the plate is the periodic weighting process of the working face. Most of the collapsed rock masses are arranged regularly, and the rock masses are stacked at the coal wall position; one end of the rock mass is at the coal wall, and the other end is on the coal gangue in the goaf. Moreover, in the process of continuous advancement of the work, the roof spans develop upward and forward, the height of the span zone increases, the deformation and failure of the rock mass increases, and the rock mass of the goaf span is slowly compacted. At the same time, the fracture position of the rock stratum at the coal wall is shown in the figure. The rock stratum is close to the direction of the goaf from the position of the coal wall, and the rock stratum presents a step-like fracture. The whole structure gradually evolves from the plate structure to the arch structure (as shown in Figure 18i).

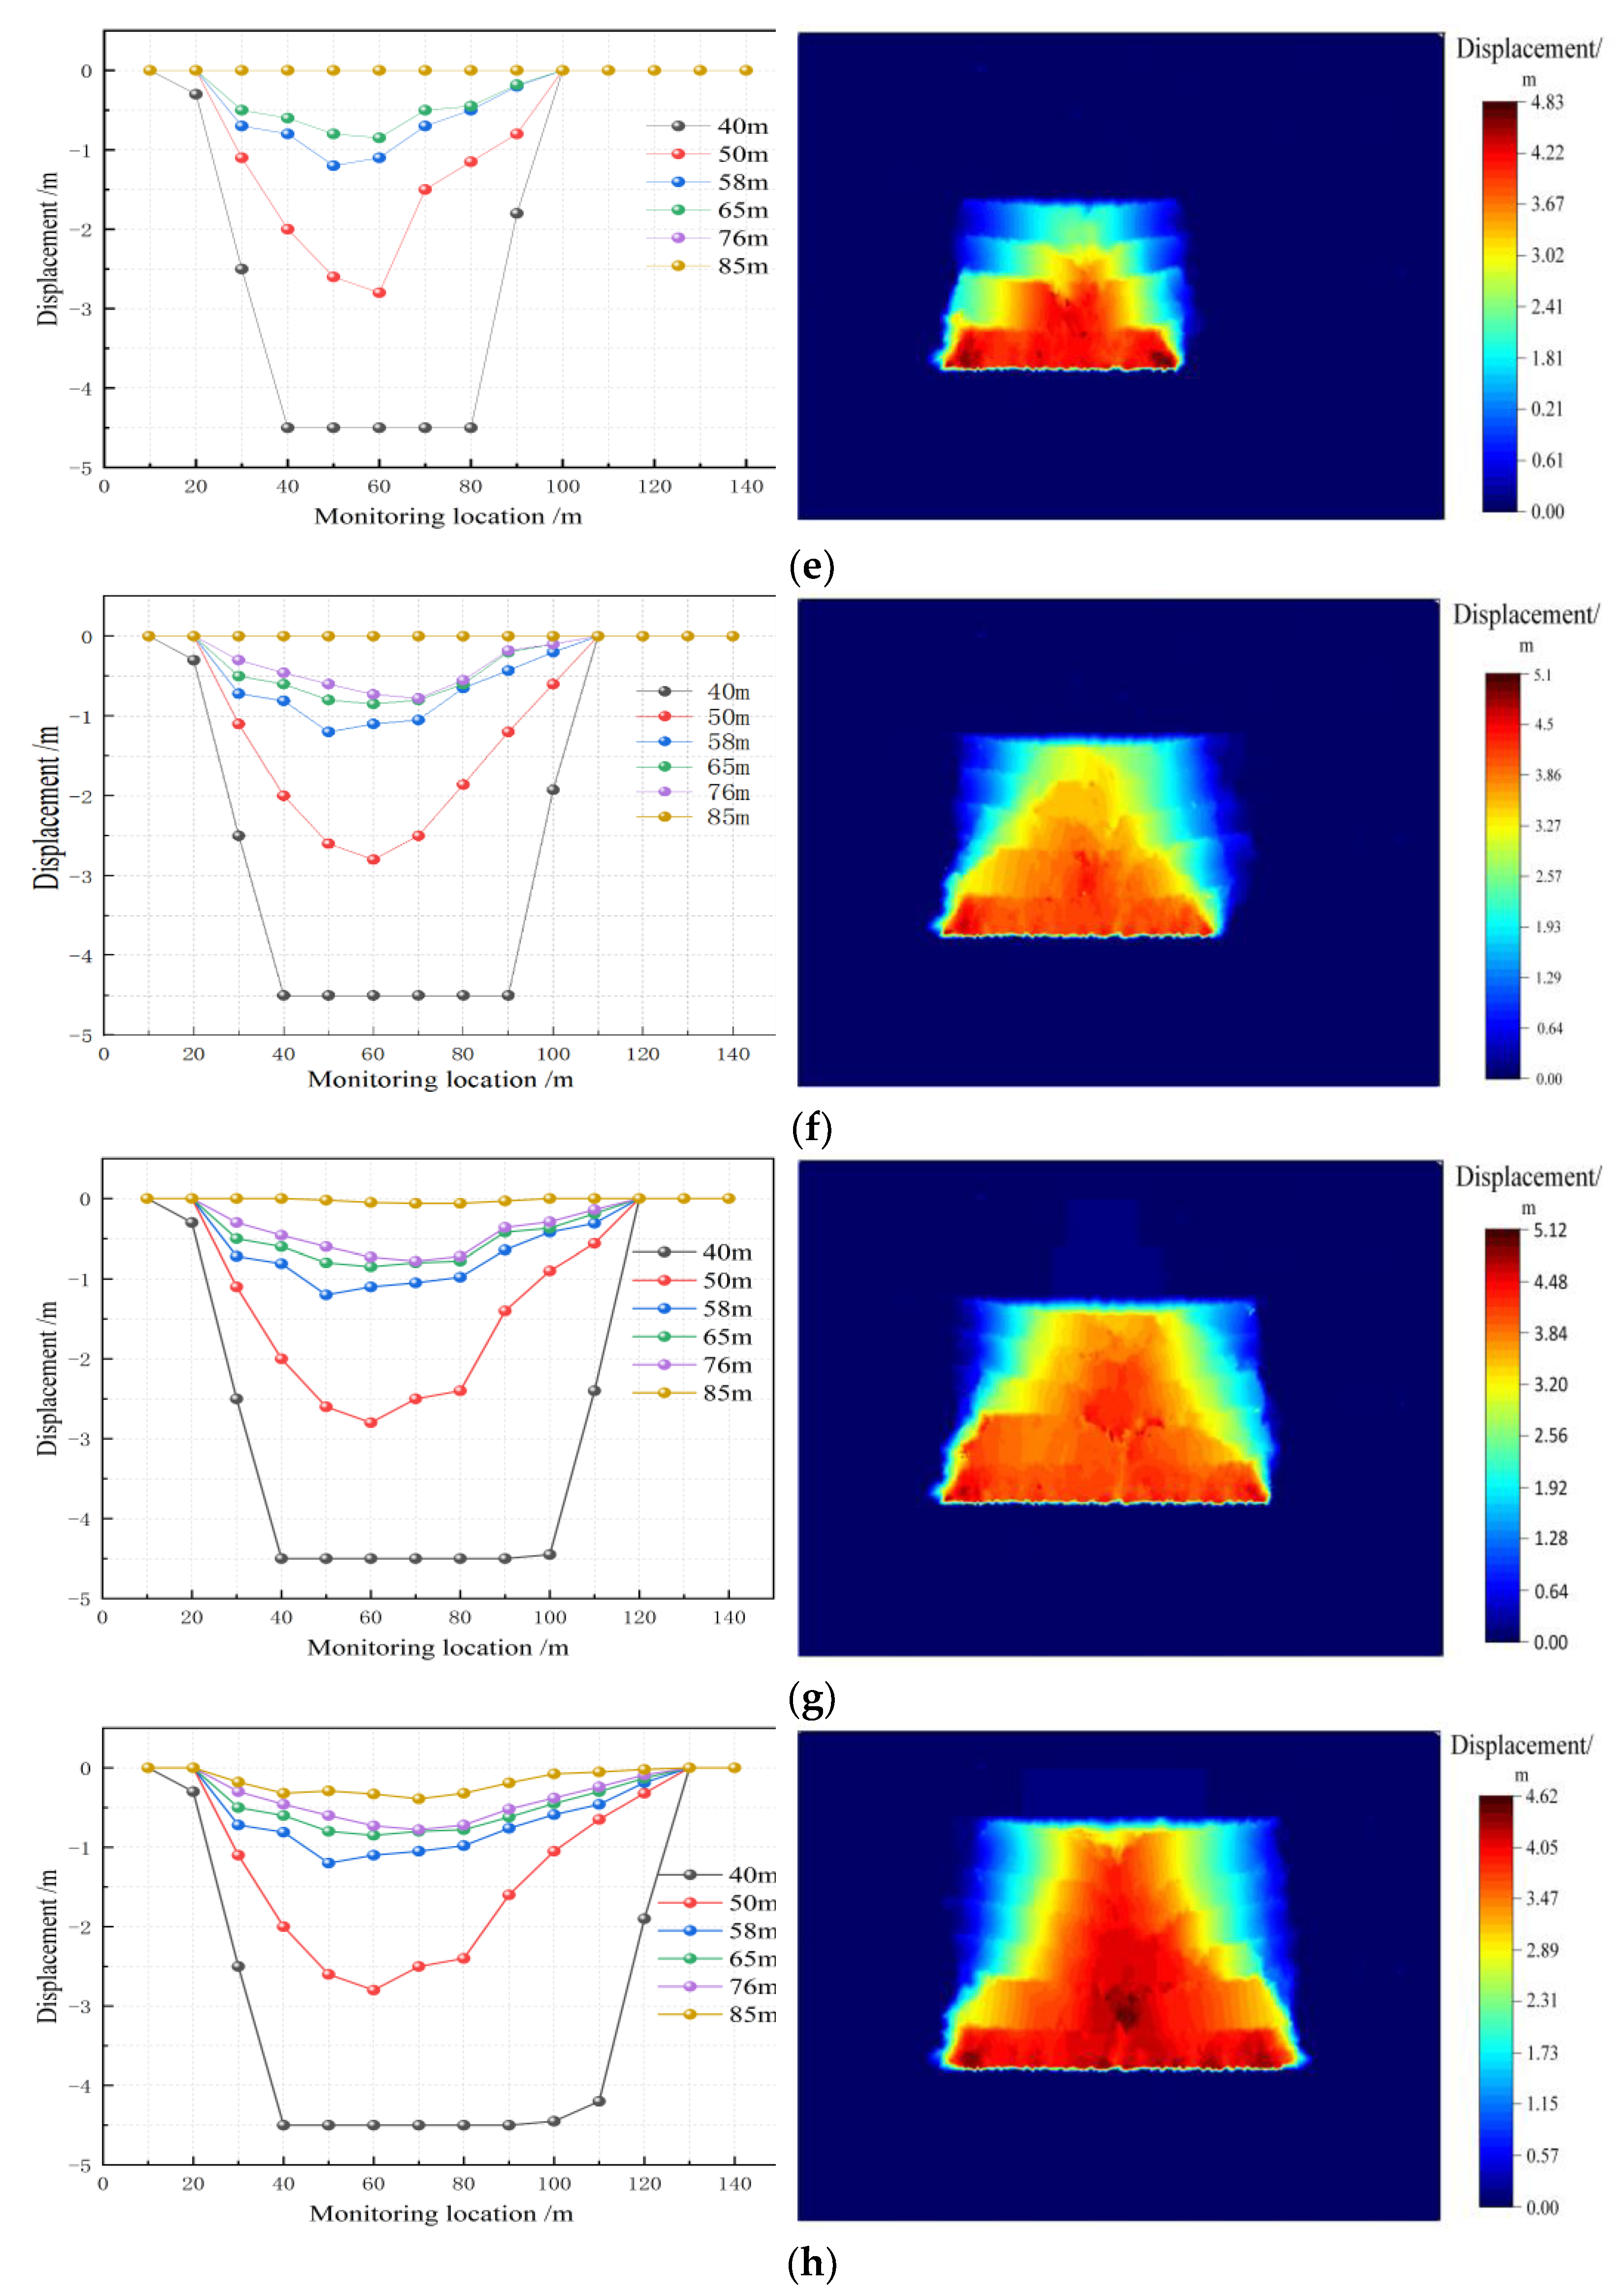
3.3.2. Analysis of Overlying Strata Displacement Field Evolution

In order to quantitatively analyze the subsidence law of roof strata, the subsidence data of rock strata are recorded. At the height of 40 m, 50 m, 57 m, 65 m, 76 m, and 85 m, respectively, set up six layers of monitoring points; each layer set up 14 measuring balls, namely from 0 to 150 m, every 10 m to establish a measuring ball, in order to analyze the movement of different heights of rock subsidence law. The Figure 19 is a schematic diagram of the measurement ball monitoring points set up inside the model.
The following figures are the vertical movement displacement curve and subsidence cloud diagram of the roof strata when the working face advances at different distances. When the advancing distance of the working face is small, the height of the roof breaking and caving is relatively slow, so the following diagram begins to analyze when the basic roof of the working face advances 20 m.
Figure 20a–c show the movement displacement curve and sinking displacement nephogram of overlying strata when the working face advances 20 m, 30 m, and 40 m. It can be seen from the diagram that with the advancement of the working face, the original rock stress is gradually destroyed, and the stress field is redistributed, which is manifested by the regular movement and collapse of the roof strata. Due to the low strength of the immediate roof, it collapses with mining and fills the goaf, forming a ‘U’ shape. The subsidence of the main roof and its overlying strata is gradually small and basically unaffected by mining.
Figure 20d show the movement deformation curve and subsidence displacement cloud diagram of overlying strata when the working face advances 50 m. It can be seen from the figure with the advance of the working face the amount of roof subsidence increased significantly. At 50 m above the goaf from the roof of the coal seam, the maximum vertical deformation reached about 0.9 m. It can be seen that the main roof above the working face broke and sank, and the shape of the ‘U’ curve formed was more obvious. The maximum subsidence occurred in the middle of the goaf, and the subsidence gradually decreased at a distance of 58 m from the roof of the coal seam.
Figure 20e–h is the movement deformation curve and subsidence displacement diagram of overlying strata when the working face advances 50 m to 90 m. It can be found from the figure that as the working face continues to advance, the roof subsidence increases slowly, and the maximum vertical deformation is 4.45 m. The subsidence at 85 m from the roof of the coal seam is small which is basically not affected by mining. As the goaf is slowly compacted, the subsidence of the rock stratum is not increasing. Moreover, when the coal seam is mined, the overlying roof breaks and falls. With the gradual increase of the mining distance, the fracture of the rock stratum develops step by step. The movement and deformation of the overlying rock stratum are similar. The fractured rock mass fills the goaf, and the more it goes to the upper part of the coal seam, the smaller the subsidence is. The subsidence curve of each rock stratum shows an asymmetric shape. At the same time, the subsidence of each rock stratum is always smaller than the thickness of the coal seam mined from the working face due to the existence of bulking characteristics of rock mass failure. In the process of fracture and subsidence of overlying strata, there are great differences in the mechanical characteristics of each rock stratum, such as the degree of joint development, the strength, and thickness of the rock stratum, which makes the movement and cross-fall of each rock stratum different. It is characterized by several groups of overlying strata and the coordinated movement of each group of rock strata.
In summary, the mining distance of the working face increases, and the settlement of the roof strata is gradually increasing. The settlement curves of rock strata at different heights show a ‘U’ type distribution with small ends and large middle. The closer to the middle of the goaf, the greater the settlement of the rock strata and the ‘U’ type bottom gradually advances along the direction of the working face. The closer to the two ends of the goaf, the smaller the difference in the settlement of rock strata at different heights. With the increase of the advancing distance of the working face, after the first weighting of the basic roof, the overlying strata began to move actively, and the fracture zone gradually developed upward, and the failure characteristics were obvious. Part of the mined-out area due to the collapse of the rock stratum in front of the working half has been gradually compacted, the structure of the mined-out area is more stable, the upper rock bending subsidence phenomenon is obviously reduced, the higher the rock height, the smaller the maximum settlement, the smaller the rock height, the greater the maximum settlement. In the process of working face advancing, the overlying strata of the stope are in a state of dynamic continuous subsidence, and the overall variation characteristics of vertical displacement are the time–space effect of overlying strata migration. Affected by mining, the vertical displacement of the immediate roof changes most strongly, the continuity of the movement process is poor, and the amount of subsidence increases in a cliff-like manner. The farther the overlying strata are from the coal seam, the less affected by mining, the stronger the continuity of the movement process, and the smaller the amount of subsidence.

3.3.3. Overburden Stress Field Evolution Analysis

In the particle dynamics simulation, the force chain is the force frame of the whole overburden, bearing the external force load in the vertical and horizontal directions. The failure of the force chain indicates that the internal balance of the particles is broken, and the external force promotes the redistribution of the force chain until the new force chain is formed stably. A strong and quasi-linear shape, passing a larger share of the force, is called a strong chain. Deformation is weak and bear force is small, which is called the weak force chain, as shown in Figure 21 and Figure 22.
When the coal seam is not mined, the rock layer is in a stable stress balance state, the force chain is in a crisscross network state, the contact form is closed, and the strong and weak force chains jointly bear the load of the overlying rock layer. After the coal seam mining, the stress balance is broken, and the external force promotes the redistribution of the force chain. The strong chain changes with the advancing direction of the working face. The main direction of the force chain indicates the direction and path of load transfer.
As can be seen from the Figure 23, when the coal seam mining after the original stress balance is broken, the overlying strata stress begins to adjust the distribution. The equilibrium state of the particles in the model was broken and began to move. The direction of the contact force chain between the particles began to change and gradually concentrated from the intricate to a certain direction. When the stope advances 10 m, the immediate roof above the mined-out area loses the support of coal, and the load cannot be transmitted directly downward and begins to be transmitted downward along both ends of the roof. Due to the short advance distance of the stope, only a few small fractured rock strata are generated inside the immediate roof. The displacement is small, and the structure is stable. The load on the beam above the stope is small, and the bending degree is small. At this time, the load is mainly concentrated on both sides of the coal wall. The weak force chain around the strong chain transfers the load to the surrounding area of the stope. The vertical stress peak of the overlying strata in the stope is about 22 MPa.
When the working face advances 20 m, 30 m, and 40 m, the strong chain zone at the coal wall of the immediate roof collapse begins to expand around, and the load is mainly concentrated on the basic roof and the coal walls on both sides. The basic roof is thick, and the structure is stable. The main object of the load is to bear the load. At this time, many small cracks appear in the ‘beam’ of the basic roof, and the cracks gradually develop and expand with the advancing distance of the working face. At this time, the maximum overburden vertical stress peak is about 34 Mpa.
When the working face advances 50 m, with the increase of the advancing distance of the working face, the space of the goaf gradually increases, the exposed area of the roof and the load also increase, the internal cracks of the beam develop maturely and break, the load gradually transfers from the ‘beam’ to the center of the plate surface, the strong chain gradually evolves into the horizontal form between the plates and the separation phenomenon appears in the main roof. At this time, the vertical stress peak of the overburden rock is about 38 Mpa.
When the working face advances to 60 m due to the periodic collapse of the main roof, the strong chain between the plates begins to weaken, and the strong chain gradually transfers to the higher position rock formation to form a new strong chain arch. The arch height increases slightly with the further increase of the span of the force chain arch and the development of the cracks in the main roof through the whole rock formation, resulting in the fracture and collapse of the main roof. At this time, the roof is simply supported on three sides and fixed on one side. After the main roof is broken, the load capacity is greatly reduced, and the overlying strata load gradually acts on the rock strata above the main roof. The strong chain transfers to the rock stratum above the main roof, and the arch height further increases. At this time, the maximum overburden vertical stress peak is about 38.5 MPa.
When the working face advances to 70 m and 80 m, the span of the powerful chain arch further increases with the advance of the working face, and the load borne by the rock strata above the main roof gradually increases. At this time, the maximum overburden vertical stress peak is about 40 Mpa.
When the working face advances to 90 m, the load between the slabs exceeds its strength limit, fracture instability occurs, and the strong chain between the slabs breaks accordingly. At this time, the overlying strata of the goaf are arched as a whole, and the load capacity of each rock stratum in the arch is greatly reduced. The strong chain is transferred to the overlying strata of the arch to form a new strong chain arch, and the load is transferred from the side of the arch to the deep rock mass. At this time, the vertical stress peak of overburden rock is about 42 Mpa.
In summary, it can be seen that the load borne by the overlying strata in the mining process of the deep high-stress stope is the macroscopic embodiment of the contact force chain, and there is a positive correlation between the strength of the force chain and the load. After coal seam mining, the load of overlying strata is transmitted to the lower strata and coal wall through the force chain to form the force chain arch. The force chain arch is mainly composed of a large number of strong chains, forming an obvious load transfer path in the main direction. With the continuous advancement of the working face, the overburden force chain of the stope is constantly changing. The overlying strata have experienced the dynamic process of the generation of the strong chain arch, the stability of the strong chain arch, the increasing span of the strong chain arch, and the breaking of the strong chain arch. The transmission direction of the strong chain reflects the process of the load transfer path of the overlying strata from the affected area to the separation area and then to the compaction area. It can be seen that in the deep high-stress stope, the instability and fracture of the strong chain with the advancement of the working face is the root cause of various dynamic load phenomena.

4. Mechanical Model and Structural Evolution of Overburden Load Transfer
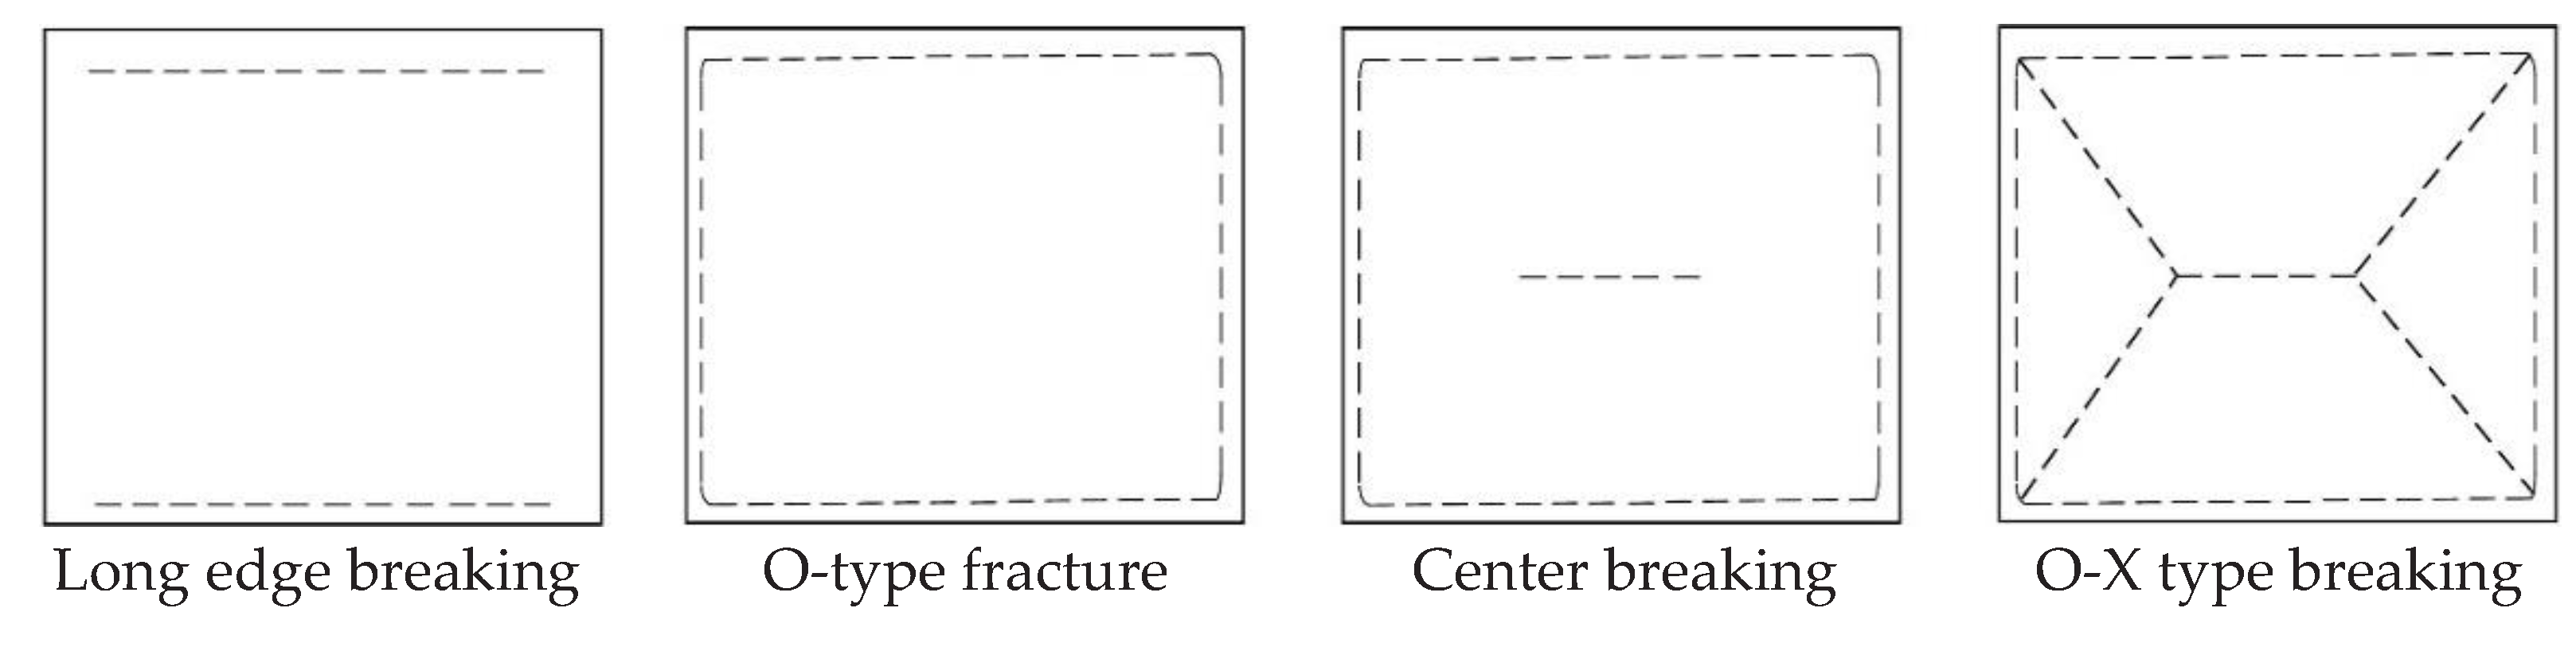
It is of great theoretical significance to carry out the research on the mining load transfer effect and failure instability mechanism of deep high-stress overburden rock, which is of great theoretical significance to reveal the failure mechanism of overburden rock in the deep high-stress stope, the instability state of overburden rock fracture and the space-time law of rock collapse. In deep mining, roof prevention and control schemes can be formulated according to the specific working face conditions, which has important engineering practical value and application prospects.
By summarizing the overburden migration law, load transfer path, and corresponding geometric structure of the stope, the occurrence characteristics and load transfer law of overburden rock in different stages of deep high-stress mining are obtained. From the beginning of working face advancing to full mining, roof movement is four different stages of development and evolution, corresponding to the three conversion processes of the overburden load transfer path. At the beginning of mining, the length of the working face is short, and the hanging area of the roof is small. Due to the filling effect of the direct roof and the residual coal in the mining area, the basic roof strata are often structurally stable, which is called beam–plate structure, and the load is transferred from the beam of the roof boundary to the deep rock mass. With the increase of the advancing distance of the working face, the exposed area of the roof increases, and the load of the overlying strata on the basic roof gradually approaches its ultimate tensile strength. When the working face is pressed for the first time, the boundary of the basic roof breaks, the beam breaks and loses its load capacity, and the roof gradually appears O-X type breaking. The beam–slab structure evolves into a single plate structure, and the load transfer capacity from the boundary to the deep rock mass is weakened and gradually concentrates on the plate surface. After the first weighting, the roof is unstable, and periodic fracture occurs with the increase of the advancing distance of the working face. Due to the change of boundary conditions and roof structure, the load transfer path changes, and the plate is transferred to the front coal wall, and the basic roof and the overlying plate appear X-O type fracture. It is different from the beam plate structure in that the structure of the main roof is stable before the first pressure, and one end is supported by the working face coal wall, the other end is supported by the boundary coal pillar, the load by the plate surface-boundary–coal wall, plate surface-boundary–coal wall both sides to transfer. After the periodic weighting, the beam structure was destroyed, the basic roof above the goaf broke and collapsed, and the supporting role of the coal wall was lost. The load can only be transferred in one direction from the plate surface-boundary–coal wall in front of the working face, and the load mainly acts on the plate surface, and the transfer speed from the plate to the boundary is slow. After full mining, the part of the goaf has been gradually compacted due to the collapse of the rock strata, the structure of the goaf is more stable, the bending and sinking phenomenon of the upper rock strata are obviously reduced, the separation between the rock strata is no longer produced, and the slab structure gradually evolves into an arch structure. The arch structure is essentially a secondary structure formed by the instability and fracture of the plate structure. The large area of the roof collapses and falls behind to form an approximate arch-shaped crushing zone, and the load is transferred from the vault–arch–arch foot–coal wall. Based on this, the overburden structure and load transfer evolution model of ‘four stages and three paths’ is derived, as shown in Figure 24, The blue arrow in Figure 24 indicates the vertical stress transferred from the overlying rock layer to the loaded rock layer, and the red arrow indicates the load transfer path inside the rock layer.

5. Conclusions

(1)
Generally speaking, overburden movement fracture and load transfer can be regarded as four stages and three ways. The four stages are initial mining; the initial collapse of the main roof; the periodic collapse of the main roof; fully exploited. The three ways of load transfer are ‘beam’, ‘plate’, ‘arch’.
(2)
Based on the four states and three ways of overburden movement and load transfer, the mechanical models under different states are established, respectively. The calculation formulas of overburden movement and load under different states are obtained by solving each model. The limit span of the ‘beam’ is 45.23 m. The established mechanical model of overburden movement and fracture and load transfer considers the position and span of the ‘beam’ in the process of rock mass movement, the transformation from ‘beam’ to ‘plate’ after fracture, and the ‘arch’ formed by the complete collapse of ‘plate’ behind the overburden movement. The load changes continuously in three ways, which reflects the dynamic movement process of mining overburden and more truly reflects the spatial and temporal changes of mining overburden movement and failure.
(3)
The PFC particle discrete element method was used to establish the numerical simulation of the stope, and the deformation and failure characteristics of the overburden rock at different advancing distances of the working face were obtained. The ‘beam’ on the fixed side of the main roof is broken and collapsed. With the increase of the advancing distance of the working face, the overlying strata sink as a whole until the final shape of the overlying strata collapse is an ‘arch’. The settlement curves of rock strata at different heights show a concave distribution with small ends and large middle. The closer to the middle of the goaf, the greater the settlement of the rock strata and the maximum settlement of the main roof reaches 2.8 m. Moreover, the concave bottom gradually advances along the direction of the working face; the closer to the two ends of the goaf, the smaller the difference in settlement of rock strata at different heights. It is found that the load borne by overlying strata is the macroscopic reflection of the contact force chain, and the strength of the force chain is positively correlated with the load.
(4)
With the continuous advancement of the working face, the overburden force chain of the stope is constantly changing. The overlying strata have experienced the dynamic process of the generation of the strong chain arch, the stability of the strong chain arch, the increasing span of the strong chain arch, and the breaking of the strong chain arch. After the initial pressure, the vertical stress peak reaches 35 MPa. With the increase of the advancing distance, the stress peak increases, and the vertical stress peak reaches 42 MPa after full mining. The increase of the stress and the transfer direction of the strong chain reflects the process of the load transfer path of the overlying strata from the affected area to the separation area and then to the compaction area, which is in line with the theoretical analysis of the transfer process of the load in the three ways of ‘beam’, ‘plate’, and ‘arch’, revealing the mechanism of load transfer and evolution of deep high-stress mining overburden.

Author Contributions

Conceptualization, X.W.; methodology, X.W. and Q.Z.; software, Q.Z. and W.L.; validation, Y.W., T.J. and F.H.; formal analysis, W.L.; investigation, T.J.; resources, X.W.; data curation, Q.Z. and T.J.; writing—original draft preparation, Q.Z.; writing—review and editing, X.W. and Q.Z.; visualization, X.W.; supervision, Y.W.; project administration, X.W.; funding acquisition, X.W. All authors have read and agreed to the published version of the manuscript.

Funding

This work is supported by the National Natural Science Foundation of China (Grant No. 51904266), the Excellent youth project of the Hunan Provincial Department of Education (Grant No. 21B0144), and the Research project on teaching reform of colleges and universities in Hunan Province in 2020 (Grant No. HNJG-2020-0231), and Hunan Natural Science Foundation Youth Program1650.

Institutional Review Board Statement

Not applicable.

Informed Consent Statement

Not applicable.

Data Availability Statement

The data are available upon request.

Conflicts of Interest

The authors declare no conflict of interest.

References

  1. Xie, H.P.; Gao, F.; Yang, Y. Research and development of rock mechanics in deep ground engineering. Chin. J. Rock Mech. Eng. 2015, 34, 2161–2178. [Google Scholar] [CrossRef]
  2. Jia, C.; Lai, X.P.; Cui, F. Study on Multisize Effect of Mining Influence of Advance Speed in Steeply Inclined Extrathick Coal Seam. Lithosphere 2022, 2022, 9775460. [Google Scholar] [CrossRef]
  3. He, M.C.; Wang, Q.; Wu, Q.Y. Innovation and future of mining rock mechanics. J. Rock Mech. Geotech. Eng. 2021, 13, 1–21. [Google Scholar] [CrossRef]
  4. Wang, X.F.; Liu, W.G.; Jiang, X.J.; Zhang, Q.; Wei, Y.Y. Evolution Characteristics of Overburden Instability and Failure under Deep Complex Mining Conditions. Geofluids 2022, 2022, 6418082. [Google Scholar] [CrossRef]
  5. Xie, H.P. Deep rock mechanics and mining theory. J. China Coal Soc. 2019, 44, 1283–1305. [Google Scholar] [CrossRef]
  6. Ullah, M.F.; Alamri, A.M.; Mehmood, K. Coal mining trends, approaches, and safety hazards: A brief review. Arab. J. Geosci. 2018, 11, 651. [Google Scholar] [CrossRef]
  7. Lan, H.; Chen, D.K.; Mao, D.B. Current status of deep mining and disaster prevention in China. Coal Sci. Technol. 2016, 44, 39–46. [Google Scholar] [CrossRef]
  8. Siwek, S. Earth tides and seismic activity in deep coal mining. Int. J. Rock Mech. Min. Sci. 2021, 148, 104972. [Google Scholar] [CrossRef]
  9. Qian, M.G.; Xu, J.L. Behaviors of strata movement in coal mining. J. China Coal Soc. 2019, 44, 973–984. [Google Scholar] [CrossRef]
  10. Zhou, Z.; Zhu, C.Q.; Li, Q.F.; Shi, Y.E. The Mined Rock Mass Movement Law Considering the Properties of Coal Seam. Chin. J. Undergr. Space Eng. 2017, 13, 1338–1346. [Google Scholar]
  11. Cheng, G.; Xu, W.; Shi, B.; Wu, J.; Sun, B.; Zhu, H. Experimental study on the deformation and failure mechanism of overburden rock during coal mining using a comprehensive intelligent sensing method. J. Rock Mech. Geotech. Eng. 2022, 14, 1626–1641. [Google Scholar] [CrossRef]
  12. Chen, D.D.; He, F.L.; Xie, S.R.; Zeng, J.C. Time-space relationship between periodic fracture of plate structure of main roof and rebound in whole region with elastic foundation boundary. Chin. J. Rock Mech. Eng. 2019, 38, 1172–1187. [Google Scholar] [CrossRef]
  13. Ju, J.F.; Xu, J.L.; Wang, Q.X. Cantilever structure moving type of key strata and its influence on ground pressure in large mining height workface. JOURNAL OF CHINA COAL SOCIETY. 2011, 36, 2115–2120. [Google Scholar]
  14. Lou, J.F. Influence mechanism of beam-arch binary structure and strata characteristics on fracture and stress evolution of overlying strata in stope. J. Min. Saf. Eng. 2021, 38, 678–686. [Google Scholar] [CrossRef]
  15. Wang, X.F.; Wei, Y.Y.; Yuan, H.; Zhang, Y.Y.; Zhang, Q.; Liu, W.G. Model Test Study on Overburden Failure and Fracture Evolution Characteristics of Deep Stope with Variable Length. Adv. Civ. Eng. 2022, 2022, 9818481. [Google Scholar] [CrossRef]
  16. Wang, C.L.; Zhang, C.S.; Zhao, X.D.; Liao, L.; Zhang, S.L. Dynamic structural evolution of overlying strata during shallow coal seam longwall mining. International J. Rock Mech. Min. Sci. 2018, 103, 20–32. [Google Scholar] [CrossRef]
  17. Wang, S.F.; Liu, K.H.; Pi, Z.Z.; Tian, F.C.; Yang, Y.L.; Xu, X.D. Three-Dimensional Stochastic Distribution Characteristics of Void Fraction in Longwall Mining-Disturbed Overburden of Inclined Coal Seam. Lithosphere 2022, 2022, 6367642. [Google Scholar] [CrossRef]
  18. Shavarskyi; Falshtynskyi; Dychkovskyi; Akimov; Sala; Buketov, V. Management of the longwall face advance on the stress-strain state of rock mass. Min. Miner. Depos. 2022, 16, 78–85. [Google Scholar] [CrossRef]
  19. Dychkovskyi, R.; Shavarskyi, I.; Saik, P.; Lozynskyi, V.; Falshtynskyi, V.; Cabana, E. Research into stress-strain state of the rock mass condition in the process of the operation of double-unit longwalls. Min. Miner. Depos. 2020, 14, 85–94. [Google Scholar] [CrossRef]
  20. Wang, H.W.; Wu, Y.P.; Xie, P.S. Formation and evolution characteristics of rock stress field in steeply dipping seam mining. J. Liaoning Tech. Univ. (Nat. Sci.) 2013, 32, 1022–1026. [Google Scholar] [CrossRef]
  21. Wu, Y.P.; Wang, H.W.; Xie, P.S. Analysis of surrounding rock macro stress arch-shell of longwall face in steeply dipping seam mining. J. China Coal Soc. 2012, 37, 559–564. [Google Scholar] [CrossRef]
  22. Xie, G.X.; Yang, K. Study of Macro Stress Shell Evolving Characteristics of Rock Suppounding Face. Chin. J. Rock Mech. Eng. 2010, 29, 2676–2680. [Google Scholar]
  23. Qian, Q.H.; Li, S.C. A Review of Research on Zonal Disintegration Phenoment in Deep Rock Mass Engineering. Chin. J. Rock Mech. Eng. 2008, 27, 1278–1284. [Google Scholar] [CrossRef]
  24. Li, Z.H.; Zhang, X.T.; Li, J.Y. Improved Analysis of Elastic-Plastic Process of Beam with One Degree of Indeterminacy Subjected to Uniformly-Distributed Load. Chin. Q. Mech. 2014, 35, 457–463. [Google Scholar] [CrossRef]
  25. Wang, X.F.; Lu, M.Y. Study on mechanical mechanism of roof fracture evolution in deep stope with variable length. Coal Geol. Explor. 2022, 50, 1–15. [Google Scholar]
  26. He, F.L.; Chen, D.; Xie, S.R. The kDL effect on the first fracture of main roof with elastic foundation boundary. Chin. J. Rock Mech. Eng. 2017, 36, 1384–1399. [Google Scholar] [CrossRef]
  27. Pang, Y.H.; Wang, G.F.; Li, B.B. Stress path effect and instability process analysis of overlying strata in deep stopes. Chin. J. Rock Mech. Eng. 2020, 39, 682–694. [Google Scholar] [CrossRef]
  28. Wu, F.F.; Yu, X.; Zhang, J.; Zhou, Q.C.; Gao, Z.Q.; Liu, S.B. Research on Interaction Relationship between Support and Surrounding Rock in Fault Structural Area and Its Application. Lithosphere 2022, 2022, 6997956. [Google Scholar] [CrossRef]
  29. Xu, Y.X.; Wang, G.F.; Li, M.Z. Numerical simulation of longwall top-coal caving with extra-thick and hard coal seam based on bonded particle model. J. China Coal Soc. 2019, 44, 3317–3328. [Google Scholar] [CrossRef]
  30. Zheng, Y.R. Development and Application of Numerical Limit Analysis for Geological Materials. Chin. J. Rock Mech. Eng. 2012, 31, 1297–1316. [Google Scholar] [CrossRef]
  31. Dou, L.M. Study of Ox-F-T spatial structure evolution of overlying strata in coal mines. J. Rock Mech. Eng. 2012, 31, 453–460. [Google Scholar] [CrossRef]
  32. Xiao, J.P. Study on breaking mechanism of overlying strata in deeply inclined coal seam. J. Saf. Sci. Technol. 2019, 15, 75–80. [Google Scholar]
Figure 1. Initial mining.
Applsci 13 04573 g001
Figure 2. First weighting.
Applsci 13 04573 g002
Figure 3. Periodic weighting.
Applsci 13 04573 g003
Figure 4. Full mining.
Applsci 13 04573 g004
Figure 5. ‘Beam’ bending model before roof collapse.
Applsci 13 04573 g005
Figure 6. ‘Plate’ mechanical model of initial fracture of roof.
Applsci 13 04573 g006
Figure 7. ‘Plate’ mechanical model of periodic fracture of roof.
Applsci 13 04573 g007
Figure 8. Mechanical model of structural arch.
Applsci 13 04573 g008
Figure 9. Three-dimensional surface contour map of internal force distribution of three-sided fixed supported and one-sided simply supported plate. (a) Diagram of bending moment Mx; (b) Mx stress isoline diagram; (c) Diagram of bending moment My; (d) My stress isoline diagram.
Applsci 13 04573 g009
Figure 10. Roof O-X type breaking evolution process.
Applsci 13 04573 g010
Figure 11. Three-dimensional surface contour map of internal force distribution of three-sided simply supported and one-sided fixed supported. (a) Diagram of bending moment Mx; (b) Mx stress isoline diagram; (c) Diagram of bending moment My; (d) My stress isoline diagram.
Applsci 13 04573 g011aApplsci 13 04573 g011b
Figure 12. Roof X-O type breaking evolution process.
Applsci 13 04573 g012
Figure 13. Three-dimensional contour map of internal force distribution of structural arch. (a) Structural arch bending moment diagram; (b) Structural arch stress contour diagram.
Applsci 13 04573 g013
Figure 14. PFC calculation process.
Applsci 13 04573 g014
Figure 15. Cycle calculation process.
Applsci 13 04573 g015
Figure 16. Contact plane position and normal direction of ball–ball and ball–surface basic contact types.
Applsci 13 04573 g016
Figure 17. Parallel bonding model.
Applsci 13 04573 g017
Figure 18. Failure modes of overburden rock with different advancing distances. (a) Working face advance 10 m; (b)Working face advance 20 m; (c) Working face advance 30 m; (d) Working face advance 40 m; (e) Working face advance 50 m; (f) Working face advance 60 m; (g) Working face advance 70 m; (h) Working face advance 80 m; (i) Working face advance 90 m.
Applsci 13 04573 g018aApplsci 13 04573 g018b
Figure 19. Model measurement ball point diagram.
Applsci 13 04573 g019
Figure 20. Movement law of overburden rock. (a) Working face advancing 20 m vertical displacement; (b) Working face advancing 30 m vertical displacement; (c) Working face advancing 40 m vertical displacement; (d) Working face advancing 50 m vertical displacement; (e) Working face advancing 60 m vertical displacement; (f) Working face advancing 70 m vertical displacement; (g) Working face advancing 80 m vertical displacement; (h) Working face advancing 90 m vertical displacement.
Applsci 13 04573 g020aApplsci 13 04573 g020b
Figure 21. Regional force chain.
Applsci 13 04573 g021
Figure 22. Whole force chain.
Applsci 13 04573 g022
Figure 23. Stress evolution law of overburden rock. (a) Working face advancing 10 m; (b) Working face advancing 20 m; (c) Working face advancing 30 m; (d) Working face advancing 40 m; (e) Working face advancing 50 m; (f) Working face advancing 60 m; (g) Working face advancing 70 m; (h) Working face advancing 80 m; (i) Working face advancing 90 m.
Applsci 13 04573 g023aApplsci 13 04573 g023bApplsci 13 04573 g023c
Figure 24. ‘Four-stage three-path’ overburden structure and load transfer evolution model.
Applsci 13 04573 g024
Table 1. Coal seam roof condition table.
Roof NameRock NameThickness (m)Lithological Characteristics
Main roofFine sandstone13.8Clay cementation, thin layer, rich in mica fragments
Immediate roofsandy mudstone8.85Clay-based, brittle containing a small amount of plant fossils
Table 2. Rock macro physical and mechanical parameters.
Lithologic CharactersElastic Modulus
/GPa
Poisson RatioAngle of Internal Friction
Cohesion
/MPa
Density
/kg/m3
Tensile Strength
/Mpa
Medium sandstone30.050.2933.9013.3523503.1
Mudstone15.90.3320.9010.9818602.5
Fine sandstone33.400.2534.514.6225003.2
Mudstone15.900.3320.9010.9818602.4
Siltstone31.200.3133.4011.6124804.6
Mudstone15.900.3320.9010.6818602.1
Fine sandstone33.400.2534.514.6225003.1
Sandy mudstone3.330.3322.014.0019502.6
2#Coal5.00.3538.023.0013601.6
Mudstone15.900.3320.9010.9818601.9
Siltstone31.200.3133.4011.6124803.8
Medium sandstone30.050.2933.9013.3523502.7
Table 3. Particle model microphysical and mechanical parameters.
Lithologic CharactersEmod
/GPa
KartKn
/Gpa
Ks
/Gpa
Knpb
/Gpa
Kspb
/Gpa
Medium sandstone28.602.451.421.449.620.7
Mudstone12.102.930.310.422.47.7
Fine sandstone26.401.856.431.345.625.3
Mudstone10.302.930.310.419.86.8
Siltstone25.602.653.120.443.616.8
Mudstone8.902.930.310.418.26.3
Fine sandstone23.601.856.431.341.623.1
Sandy mudstone2.861.811.56.67.74.3
2#Coal4.23.1144.59.73.1
Mudstone8.22.930.310.416.45.7
Siltstone21.202.653.120.439.715.3
Medium sandstone26.052.451.421.444.918.8
Disclaimer/Publisher’s Note: The statements, opinions and data contained in all publications are solely those of the individual author(s) and contributor(s) and not of MDPI and/or the editor(s). MDPI and/or the editor(s) disclaim responsibility for any injury to people or property resulting from any ideas, methods, instructions or products referred to in the content.

