Article

The Action of Tornadoes on the Structural Elements of a Wooden Low-Rise Building Roof and Surrounding Objects—Review and Case Study

by
Tomasz Lamparski
* and
Maciej Dutkiewicz
Faculty of Civil and Environmental Engineering and Architecture, Bydgoszcz University of Science and Technology, Al. Prof. S. Kaliskiego 7, 85-796 Bydgoszcz, Poland
*
Author to whom correspondence should be addressed.
Appl. Sci. 2023, 13(8), 4661; https://doi.org/10.3390/app13084661
Submission received: 3 March 2023 / Revised: 28 March 2023 / Accepted: 29 March 2023 / Published: 7 April 2023
(This article belongs to the Section Civil Engineering)

Abstract

:

Highlights

What are the main findings?
  • Validation of the numerical model describing the response of the roof structure to the tornado,
  • Estimation of the wind speed based on the degree of damage of the building based on the EF scale,
What is the implication of the main findings?
  • Performance of analysis of ultimate and serviceable limit states of the rafter to the horizontal beam joint,
  • Recommendation for structural connections between the rafter and wall plate.

Abstract

This article presents the phenomena of tornado models with statistical data on the number of tornadoes in various regions of the world. Classifications are presented of the intensity of weather phenomena caused by gusts of wind in terms of the amount of damage to buildings and nearby objects. The main aim of the article is to analyze a damaged single-family house and its surroundings after the tornado in Fairburn (2018, Georgia, USA), to estimate the peak wind speed that caused the damage, based on the ultimate and serviceable limit states, and to compare the obtained results with the tornado scales. The article draws attention to the various possibilities of damage and analyzes several places where potential damage could begin. The low-trength capacity of the joints was the direct cause of the roof structure failure, and this case is analyzed and discussed. FinallyFinally, the calculations performed are summarized and conclusions resulting from the visible trends are proposed. The novelty of this article lies in the following: the validation of the numerical model describing the response of the roof structure to the tornado; the estimation of the wind speed based on the degree of damage to the building based on the EF scale; and the analysis of the ultimate and serviceable limit states of the rafter to the horizontal beam joint.

1. Introduction

Until recently, it was believed that tornadoes occur only in certain areas of the world and that some places will never record the occurrence of these intense winds. Unfortunately, according to meteorological data from global organizations related to extreme weather changes, such as the Storm Prediction Center, we can see an increase in the number of tornadoes in countries where a few years ago there were practically no tornadoes. It is well known that high-speed winds can cause huge damage to both nature and buildings. In this article, the scale of damage depending on the wind speed will be presented, and then the case of an object that survived a tornado will be analyzed. Therefore, after the next few years, it may be justified to update design standards due to the changing parameters of the wind acting on buildings and infrastructure. At the same time, it is necessary to check again whether the existing structures are sufficiently resistant to climate change.

1.1. Tornado Scale

We can categorize and group tornadoes according to the level of intensity of a given weather phenomenon. This was first done by Tetsuya Fujita in 1971, who proposed categories of tornadoes depending on wind speed and description of potential damage. The relative frequency of occurrence was also calculated for each group. Since 2007, the Improved Fujita Scale (EF) has been used, which has increased the variety of constructions, also inspiring new construction technologies and increasing the robustness and quality of constructions [1].
The currently used scale (EF) is presented in Table 1.

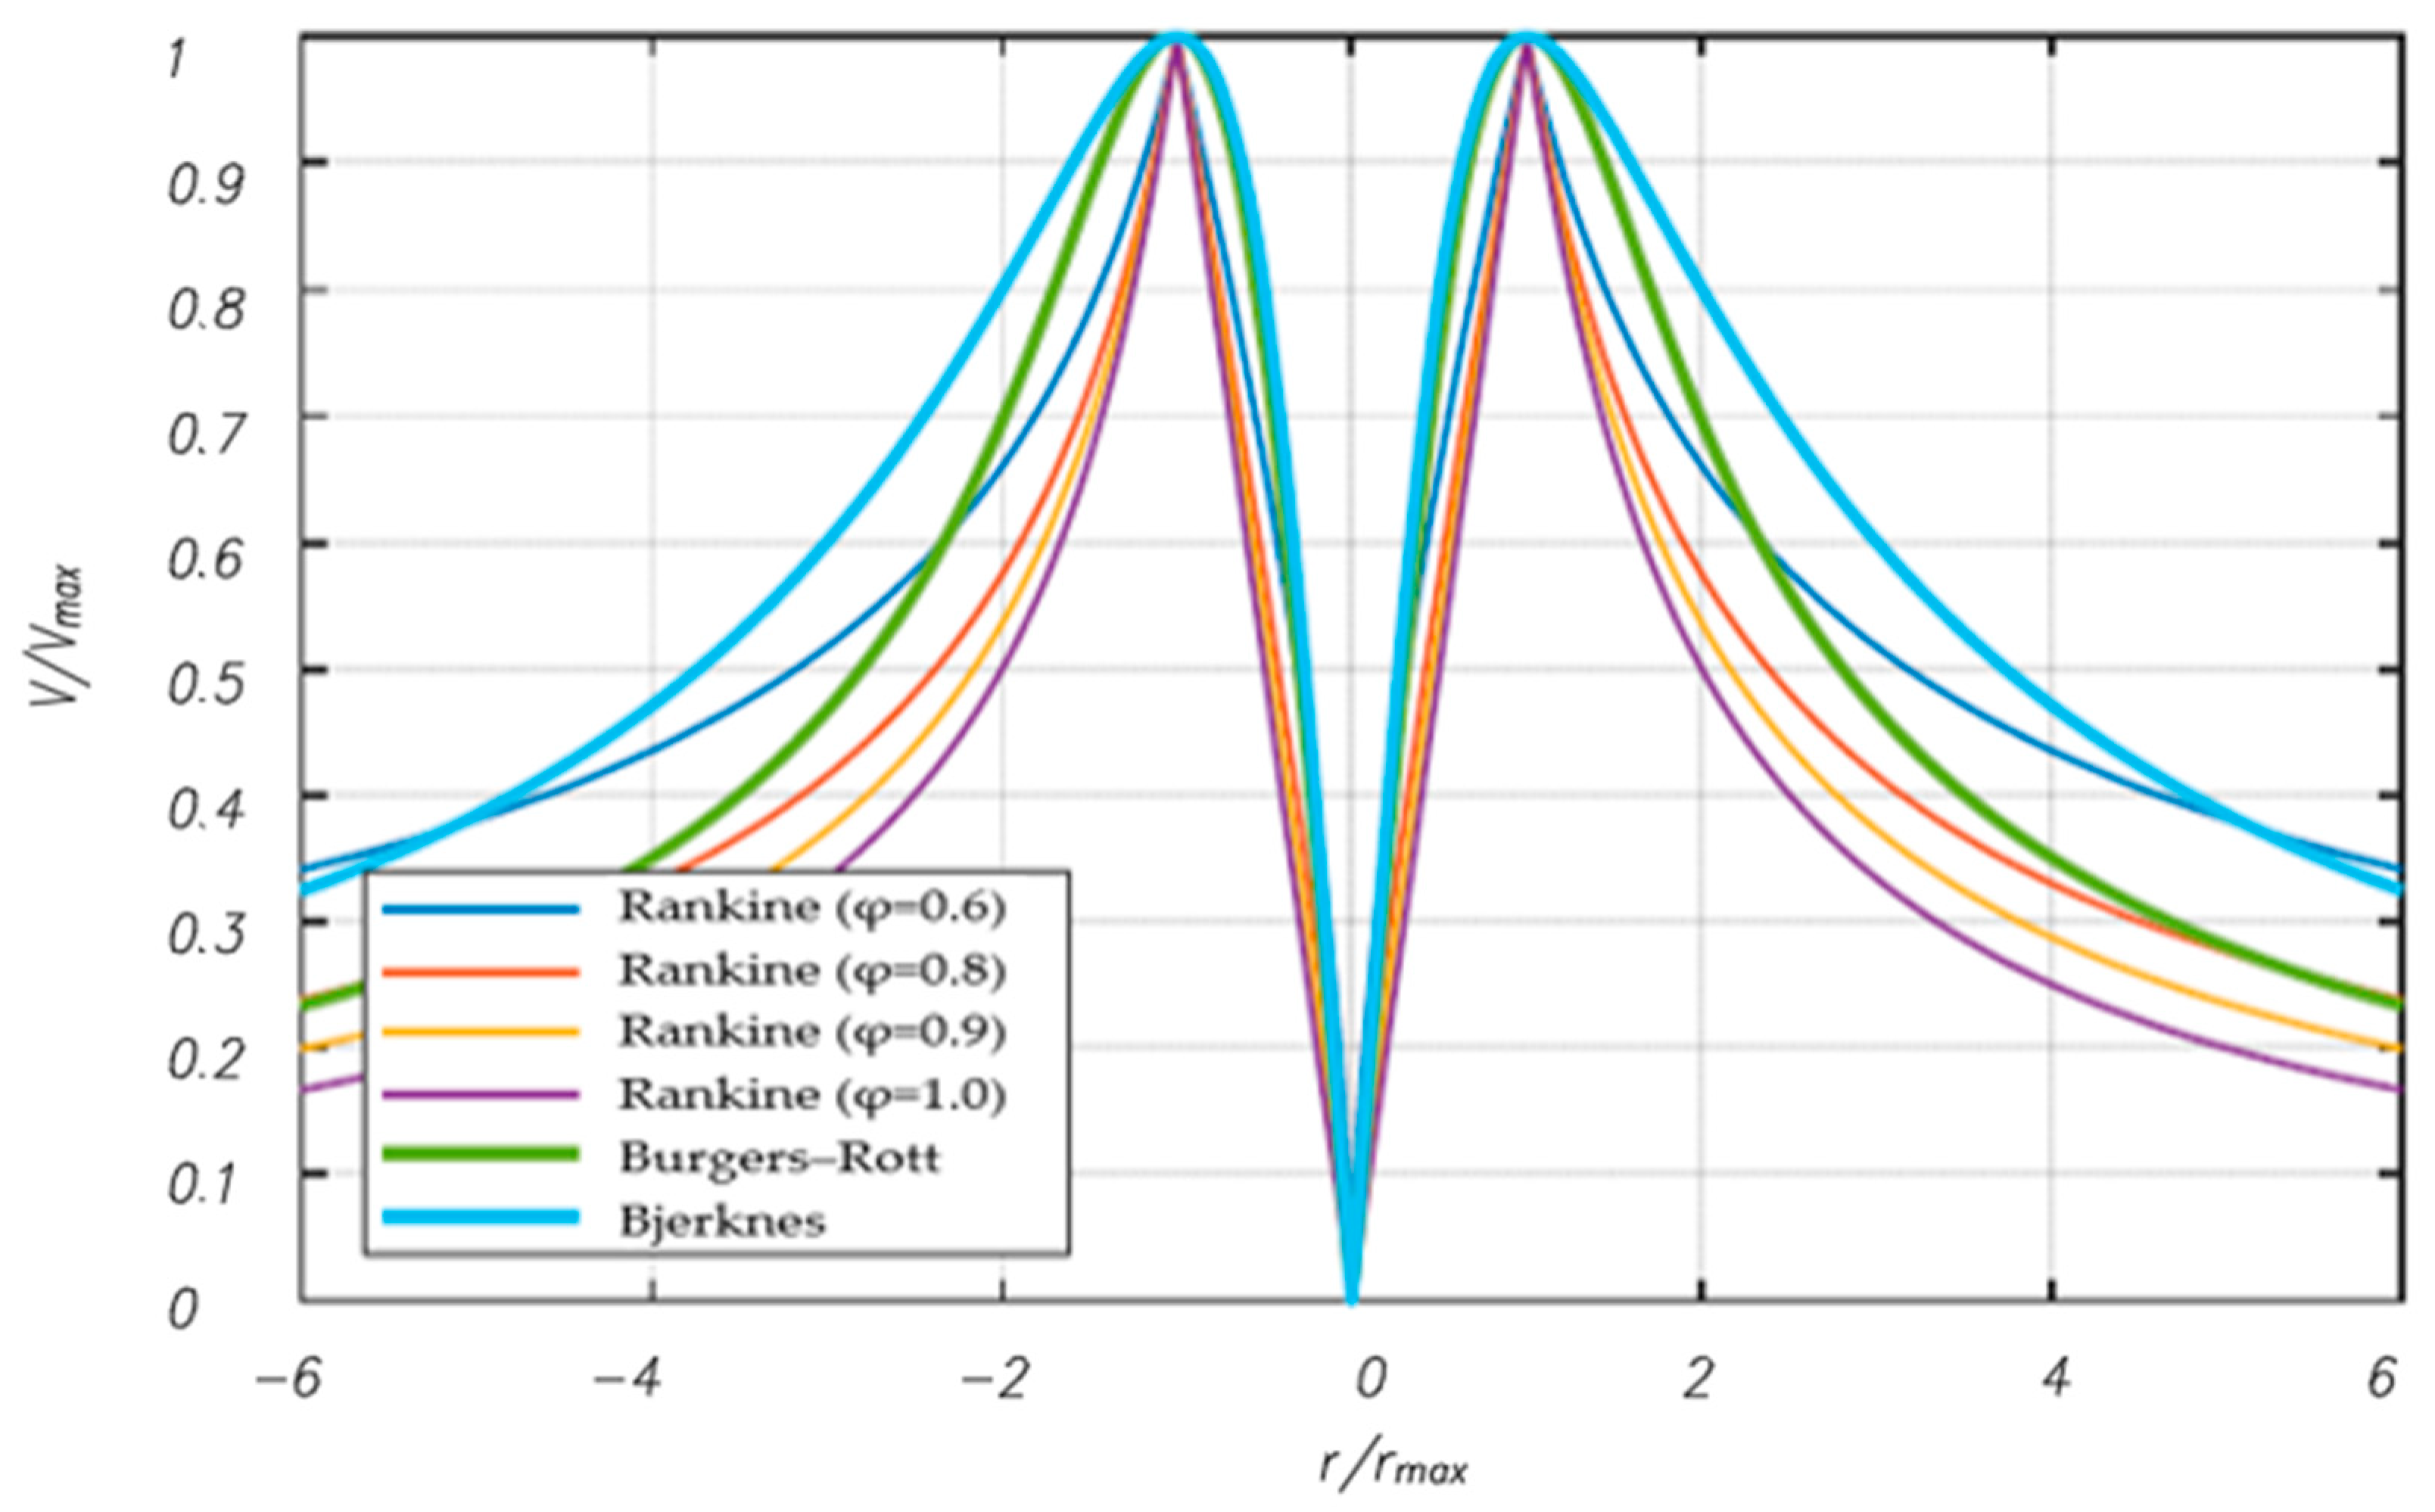
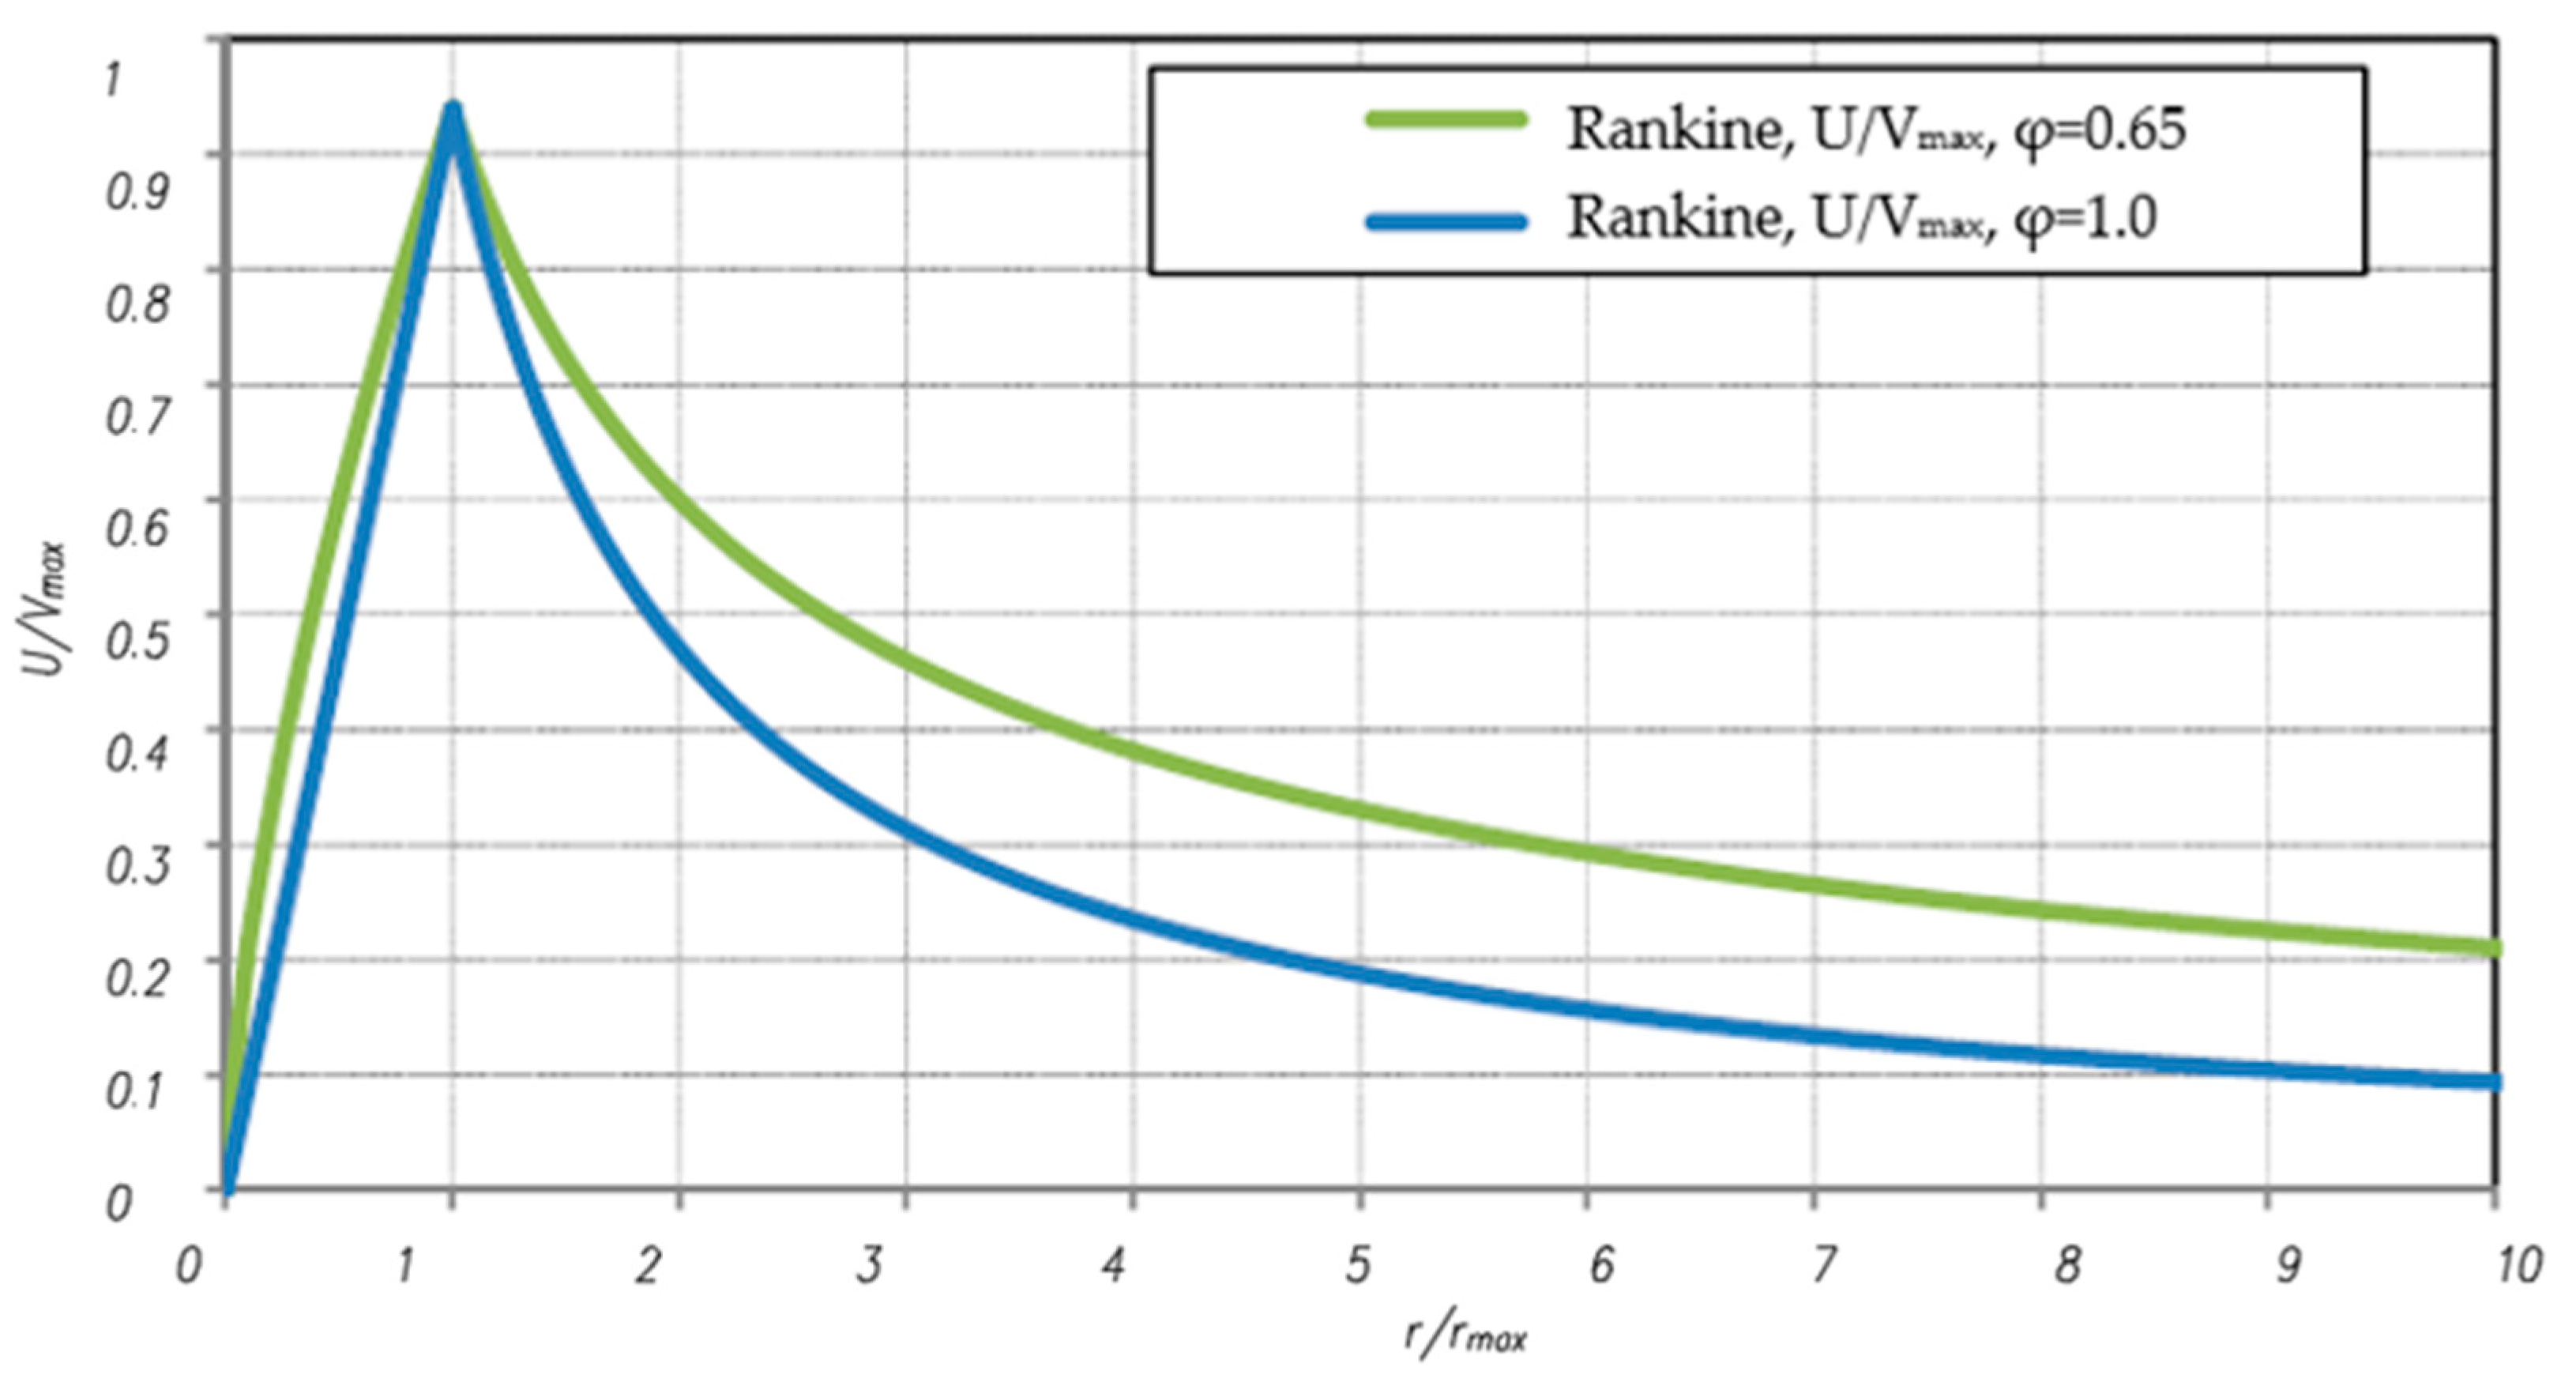
1.2. Strong Wind Models

One of the aims of wind engineering is an attempt to describe a model based on which we can learn about the strong wind phenomenon. Despite clear similarities, each strong wind is different; that is why new proposals for the model and methodology of the phenomenon are being developed all the time [4,5].
The general model of a tornado assumes that the air column is represented as a funnel, which during formation approaches the narrower part of the earth’s surface. The vortices forming the funnel rotate in a circular motion around the created column at a speed of up to 135 m/s. When the phenomenon is observed from a bird’s eye view, rings are formed, whose diameter reaches a maximum of 1.9 km. There are several types of vortices within tornadoes, including secondary vortices, multiple vortices, smaller-scale tornado cores (also called secondary vortices) that orbit around a central axis, as well as satellite vortices. Different features characterize tornadoes; i.e., they exist as single cells or many cells. Regardless of the type of tornado, the basic conditions for its creation are the presence of different temperatures and changes in pressure as well as the density of the air in a specific space.
The use of conventional procedures described primarily in standards [6,7,8,9] to design a structure resistant to air pressure caused by gusts of wind during a tornado is practically impossible due to the intensity of the weather phenomenon, its short duration, and its rapid changes in pressure, direction, speed or amplitude.
By analyzing data from meteorological stations, one can graphically create a map showing the current weather in each area, thus creating a synoptic map., Using such maps, the weather can be forecast over a short period of time. Unfortunately, the specification of tornadoes is different from the nature of the wind presented on synoptic maps, due to the difficulties in making a direct measurement of wind speed. Therefore, many theoretical as well as empirical models of tornadoes have been developed.
Civil engineering has experienced explosive growth in recent years. Increasingly, modern structures are being built, such as lightweight engineering structures. Unfortunately, these objects are often sensitive to strong winds. To ensure the stability of the structure, detailed safety requirements are set during its design. Therefore, as years go by, it is easy to notice an increase in sophistication and progress in the design of engineering structures under the influence of synoptic wind. Innovation is also related to the need to develop design requirements for other types of wind, primarily for non-synoptic winds such as tornadoes.
The effects of a tornado are profoundly serious, but by analyzing the information collected over the years, we learn more and more about their nature. To limit damage, further research on violent weather phenomena is needed..First of all, it is necessary to focus on the analysis of models that accurately describe non-linear effects [10,11,12,13].
To properly study a tornado, it is necessary to create an appropriate analytical model of the phenomenon. Burgers, Rott, and Bjerknes started such activities [14,15,16,17,18]. Currently, many new experimental and analytical models are being developed, based on previously developed ones, describing tornadoes and their effects. The general concept of the tornado model is shown below. Modified models of vortices of the mentioned authors were used. The differences between them were collected and explained.
Engineering structures are designed for many years, during which time the climate changes and the structure begins to be exposed to wind, which significantly exceeds the pressures specified in the standard [7]. In recent years, the frequency of tornadoes has been increasing, so their loads should be considered in the design in many cases. The purpose of the following research is to describe the nature of strong winds, thanks to which it will be possible to predict the impact of a tornado on buildings and structures. In general, the nature of tornadoes is similar over the years, so many researchers use existing data from the past. It is difficult to clearly define all tornado parameters (e.g., speed), which is why other methods are also used for research, such as assessing damage to objects after a tornado has passed.
In order to analyze the vortex motion, we can use the model of an incompressible ideal fluid of uniform density. The Navier-Stokes equations [19] are used to describe viscous liquids:
u t + ( u ) u = g p ρ + ν Δ u
where p is pressure of the fluid, g is Earth’s gravity, u is the body’s velocity, ρ is the density of the air, ν is the kinematic viscosity coefficient, and t is time.
Tornadoes occur all over the world; the observed phenomena occurring in Scandinavia were used to create Bjerknes’s original model. He noticed a large concentration of air flows along lines oriented in front of the tornado’s path. Cold air masses trap warm air in the tornado section. The greatest intensity of a tornado is reached when the closed masses of warm air rise towards the upper parts of the tornado, and the potential energy is changed into the kinetic energy of the wind. Based on these observations, on the model proposed by Bjerknes, and on meteorological records obtained from some observatories along the route of a tornado in one of the Japanese cities, in [20] the formula for the tangential velocity was presented:
V = 2 V m a x ( r r m a x ) 1 + ( r r m a x ) 2
In the analyses of Burgers-Rott [14,15], the vortex model they created adopts single-cell characteristics. With this in mind, the following assumptions can be made employing the Navier-Stokes equations:
V = V ( r ) , W = W ( z ) , U = U ( r ) , p = p ( r , z ) .    
where V , W , and U are the tangential, axial, and radial components of the velocity vector, and p is the pressure.
In his investigations, Rankine [17] made some assumptions: the area of the cross-section is only in one dimension, the state of the body is fixed, and the flow is not viscous. This creates a modified vortex model where body forces are neglected in the analysis.
Adopting the aforementioned Rankine model, two separate areas can be distinguished: external and internal. The first one is characterized by the fact that the tangential velocity decreases as the radius increases. There are no vortices; therefore the flow is called potential. In the second region, the tangential velocity increases linearly from zero to the maximum value at the edges of the region, which is defined by r < r m a x . The air in this area swirls as a solid. Using the above assumptions, we can reduce the Navier-Stokes Equations (6)–(9) to the following form:
p r = ρ V 2 r
2 V r 2 + 1 r V r + V r 2 = 0
The tangential velocity takes the form of equation [17]:
V = V m a x ( r r m a x ) φ , r r m a x
V = V m a x ( r m a x r ) φ , r r m a x
V m a x = Γ 2 π r m a x
Figure 1 presents and compares the tangential velocity distribution in three computational models of Rankine, Bjerknes and Burgers-Rott for different distances from the center of the tornado. There are also studies in which the rotational speed is introduced with the components of the radial and tangential speed:
Comparing the graphs in Figure 1, it can be seen that in the range in which the radius is greater than the maximum value, the smallest values of the quotient of velocity to maximum velocity, depending on the dimensionless distance from the center of the tornado (equal to the quotient of radius to maximum radius), occur in the Rankine model for ϕ = 1.0 , and the largest in the Bjerknes model. The maximum and minimum values for both models are significantly different (coefficient equal to 1.79). In the range r / r m a x , the values of the dimensionless coefficient V /   V m a x in all models are similar. Based on the analysis of the dimensionless radial-velocity coefficient (Figure 2), for ϕ = 0.65 the radial coefficient is 1.65 times greater than for ϕ = 1.0 . Analyzing both Rankine models, it should be stated that the greater the decay coefficient, the smaller the radial and tangential velocity coefficients.

1.3. Theoretical Model

The basis for the analysis of the theoretical and numerical model was the EF scale and the assumptions of the Eurocode [7] for a low-rise building. The maximum value of velocity and pressure was determined as follows:
At the beginning, the assumptions according to the Eurocode [7] were adopted (as a reference example, and the most common wind phenomenon was adopted: the wind arising in the largest impact zone in Poland in terms of area, with an average speed of 22 m/s). In the following, the obtained values and loads were adopted in relation to the values of wind speed and pressure on the existing building, increasing them accordingly on the basis of the EF scale for the EF1 and EF2 ranges.

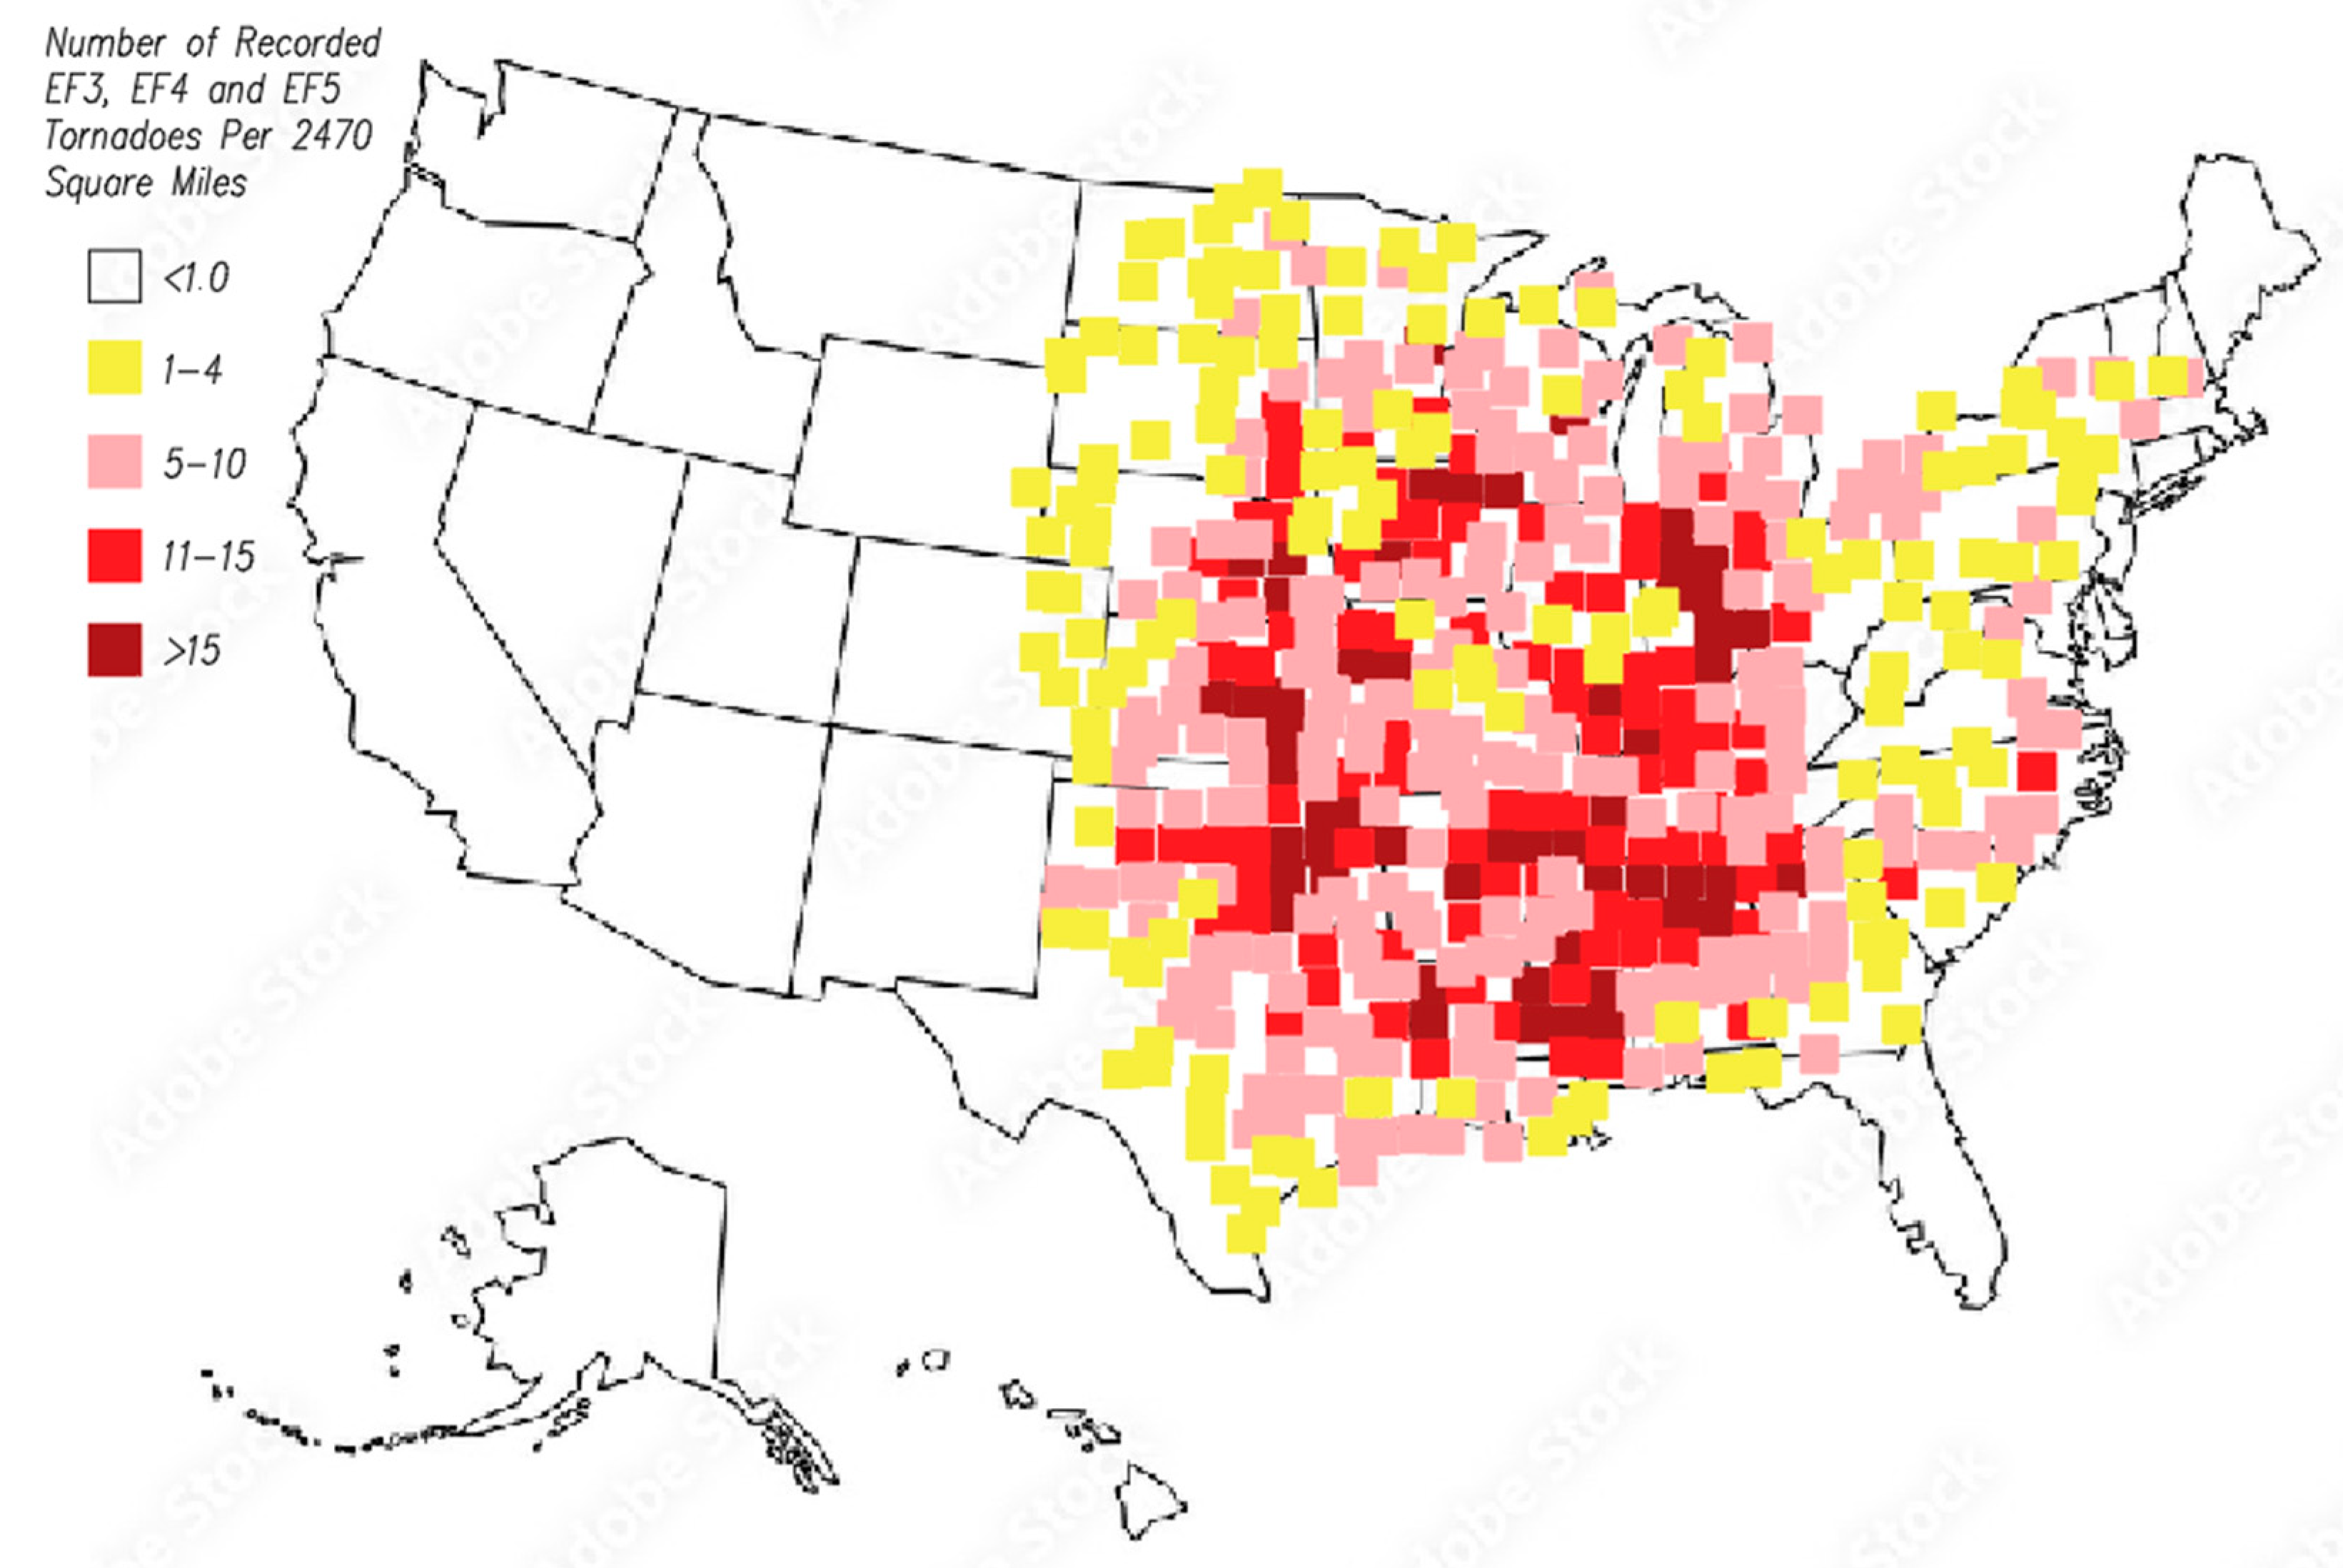
2. Tornadoes in 2015–2021

It is difficult to accurately estimate the number of tornadoes occurring at a given time in a given country. The main problem is that some extreme weather events can occur in sparsely populated areas and go unnoticed; another important aspect is that this phenomenon must be documented and confirmed. There is also the issue of setting a clear limit, e.g., the speed of the blowing wind after exceeding which we can define a given phenomenon as a tornado. This aspect is so troublesome that an inexperienced observer is not able to accurately determine the speed and often does not know the above-mentioned limits, which may make it wrong to note the occurrence of a given phenomenon.
However, there are databases in which experienced enthusiasts document the occurrence of strong atmospheric phenomena, including whirlwinds. On sites such as European Severe Weather Data (ESWD) (Europe) and Storm Prediction Center—Annual Severe Weather Report (USA), we will find reports containing materials in the form of eyewitness accounts, additionally supplemented with photos and videos, which provide us a reliable source of information.
Below is a tabular summary of tornadoes recorded in Poland, other areas of Europe, and the USA in 2015-2021, as well as charts for each region along with a forecast based on the trend line (Table 2, Figure 3).
An increase in the number of tornadoes has occurred in all these areas. For Poland, the trend line is more slanted, which indicates a faster pace of change than in the case of Europe as a whole. We can therefore conclude that there is more than one cause of the changes. The first is obvious, that the total number of recorded tornadoes is increasing year by year. The second aspect concerns the regions of occurrence. Whirlwinds, which several decades ago were almost unheard of at given latitudes or longitudes, are an increasingly common phenomenon. To sum up, tornadoes appear in areas where some time ago no one expected them, and they are doing it more and more often.

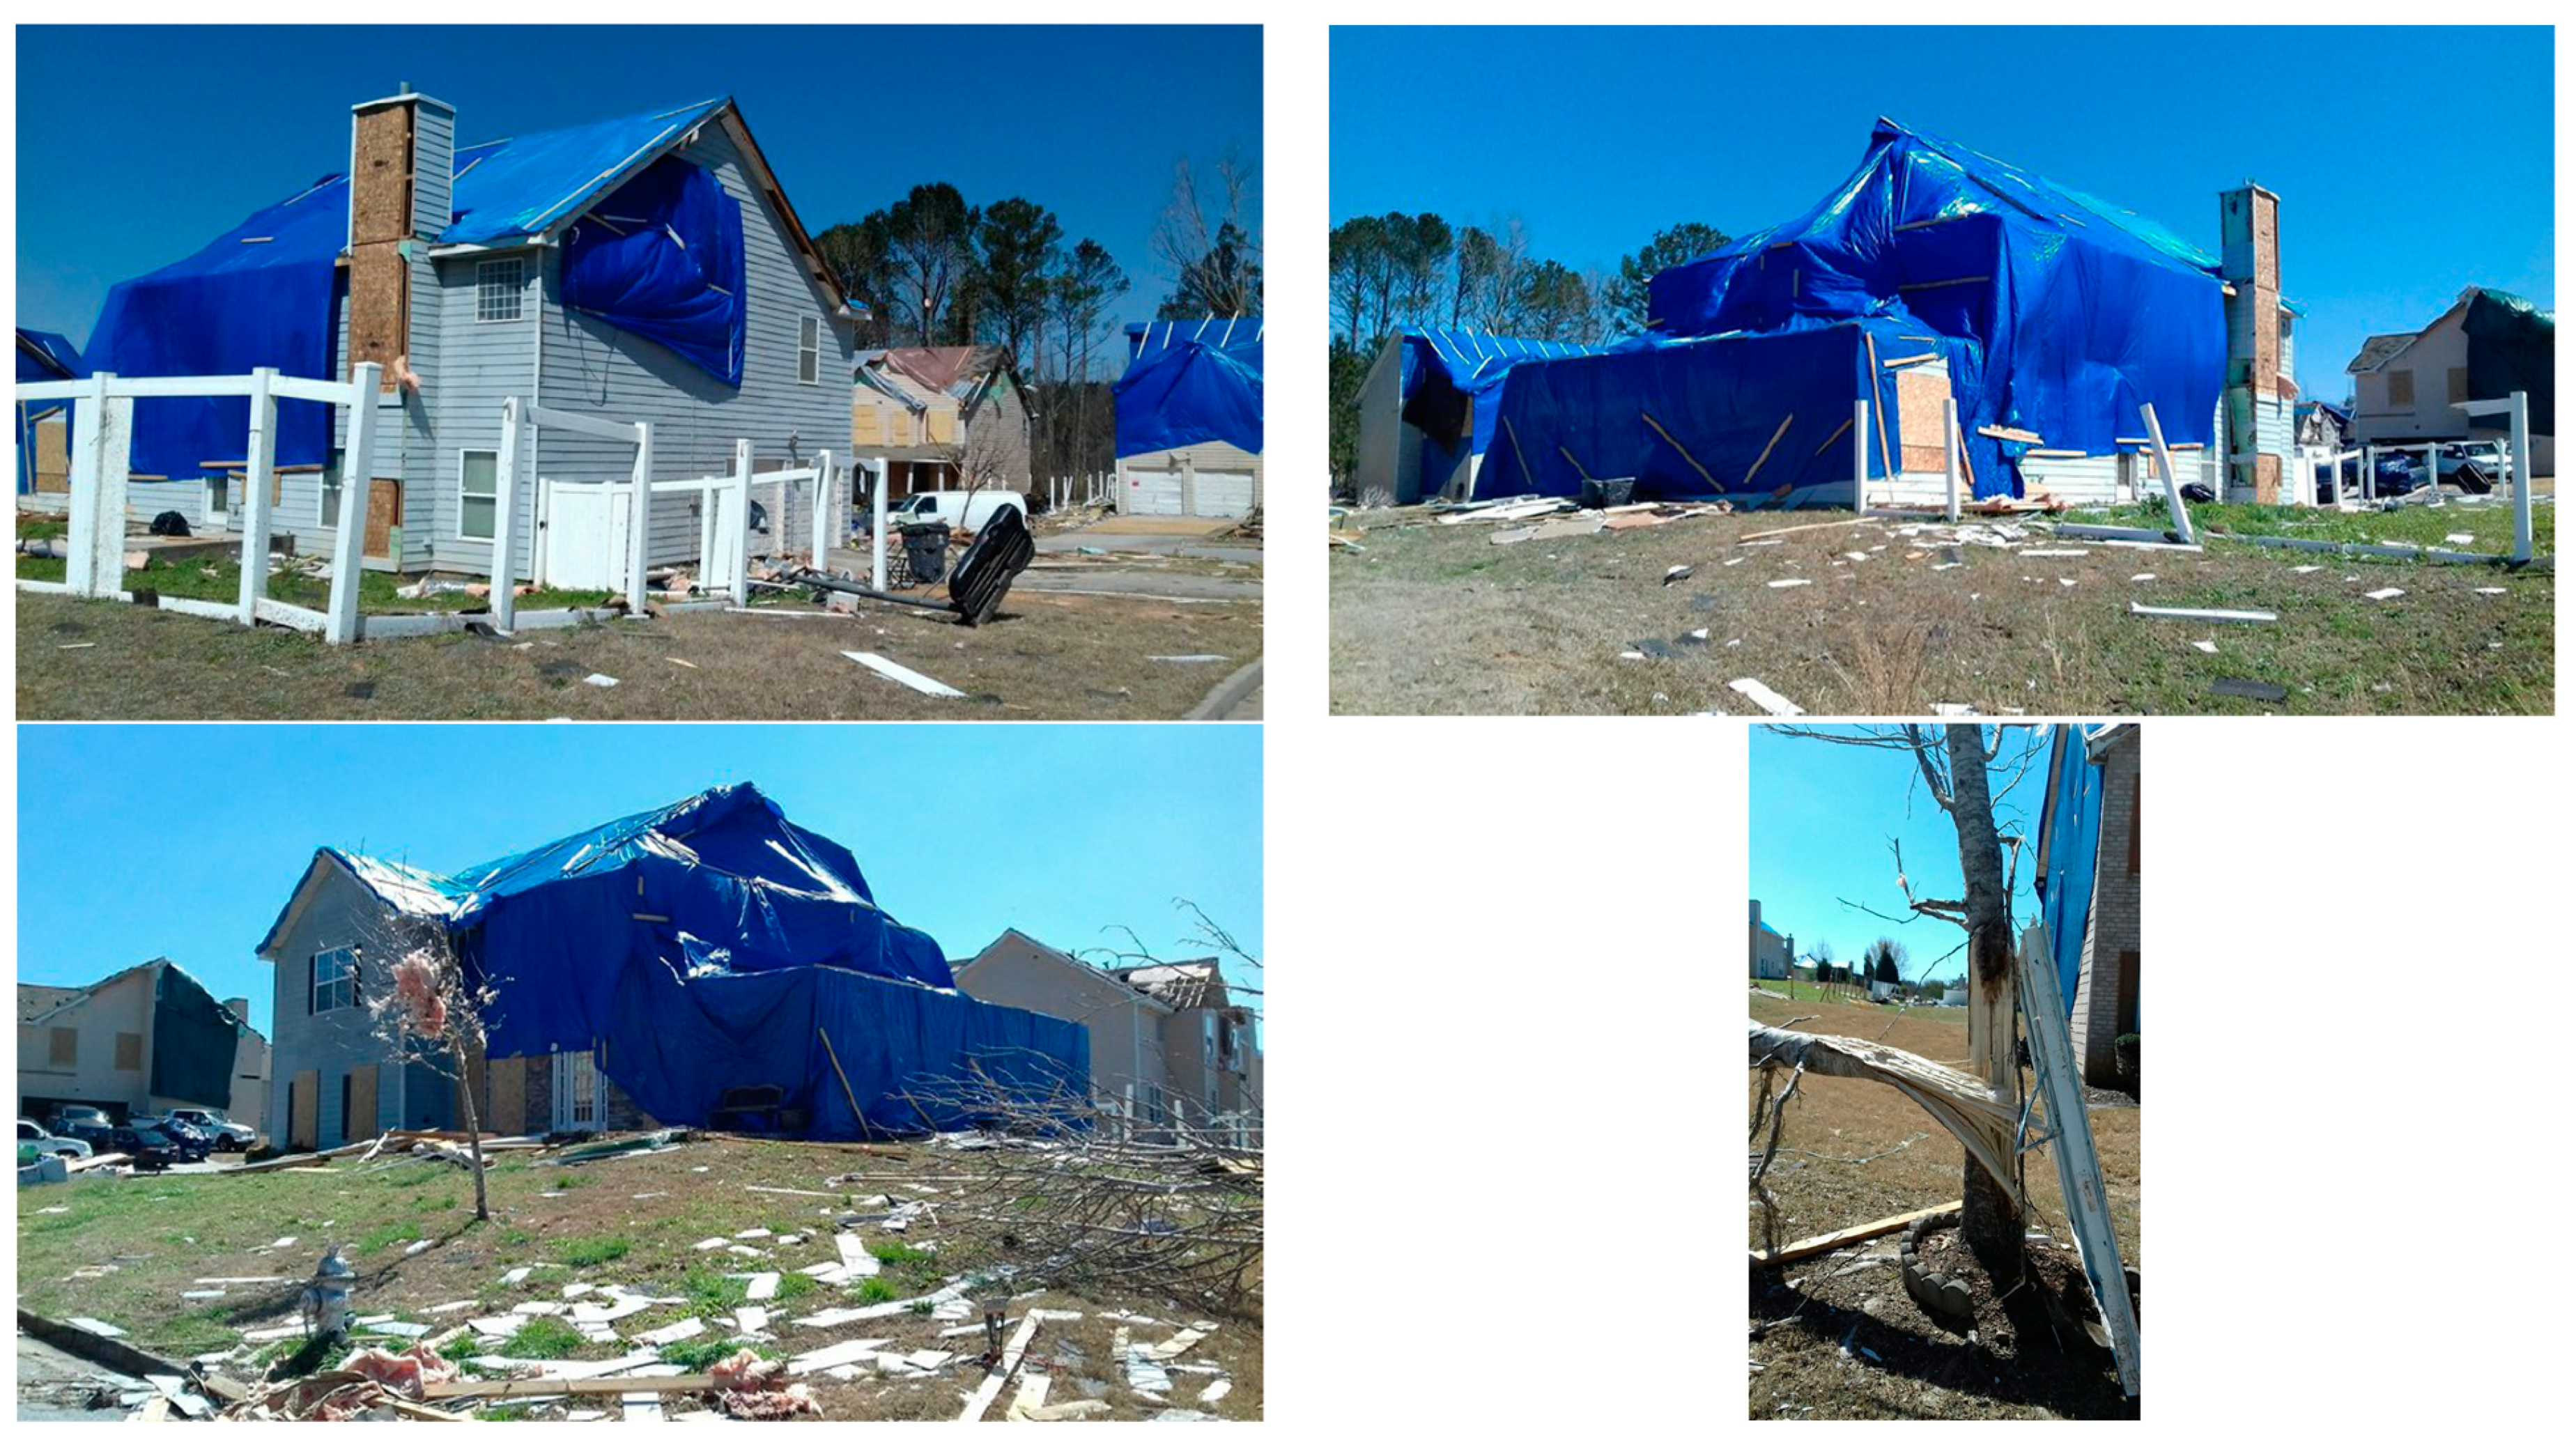
3. Fairburn Tornado Study

3.1. Fairburn Tornado in the Tornado Alley

In March 2018, the authors of this article was a witness of a devastating tornado that passed through Georgia, USA. The Fairburn tornado occurred in a predictable location where masses of a warm air mix with masses of cooled air, triggering a strong swirling air movement as the “swirling chimney” moves. The unofficial name for this area in the mid-eastern-part of North America is Tornado Alley. Its area includes several states: Texas, Oklahoma, Kansas, Nebraska, Iowa, and Georgia (Figure 4). In these areas there is a higher frequency of whirlwinds, most common in late spring and, rarely, in early autumn.
Based on the research on the site conducted by the authors of this paper the day after the tornado in Alabama and Georgia, USA in 2018,one can conclude that the wind that caused this damage must have been traveling at about 179 km/h in the analyzed location, which categorizes a tornado between EF1 and EF2. Much damage was done to the houses in Fairburn. Below is a case of one of the residential buildings, in which the structure of the main roof system was destroyed due to the action of strong wind. The observed effects of a tornado prompted the authors to conduct an in-depth analysis of the ultimate and serviceability limit states of the structural elements of the roof of the damaged building as well as of the nearby road sign.

3.2. Damages in Fairburn Due to Tornado

In the photos from the authors’ research documentation presented in Figure 5, on the basis of in situ investigations, one can see the scale of damage not only to the houses but also to the surrounding area. As one can see in Figure 5, the building has a damaged roof structure, where three pairs of rafters are missing, as well as part of the ridge. Therefore, there had to be a tearing out (rows) and breaking (of the ridge), as well as the movement of a piece of the structure. Furthermore, one can see that around the house there are many smaller elements torn off and moved by the wind. The last photo shows a medium-sized broken tree at its thickest point.
The presented building was modelled by Finite Element Method (FEM) software and analyzed in Part 4 of this article.

4. Building Analysis

The analysis concerns a single-family house with dimensions 14 m × 12 m with a dormer window measuring 5 m × 2 m (Figure 6). The- roof structure collar beams are without a pole, 40 cm apart.

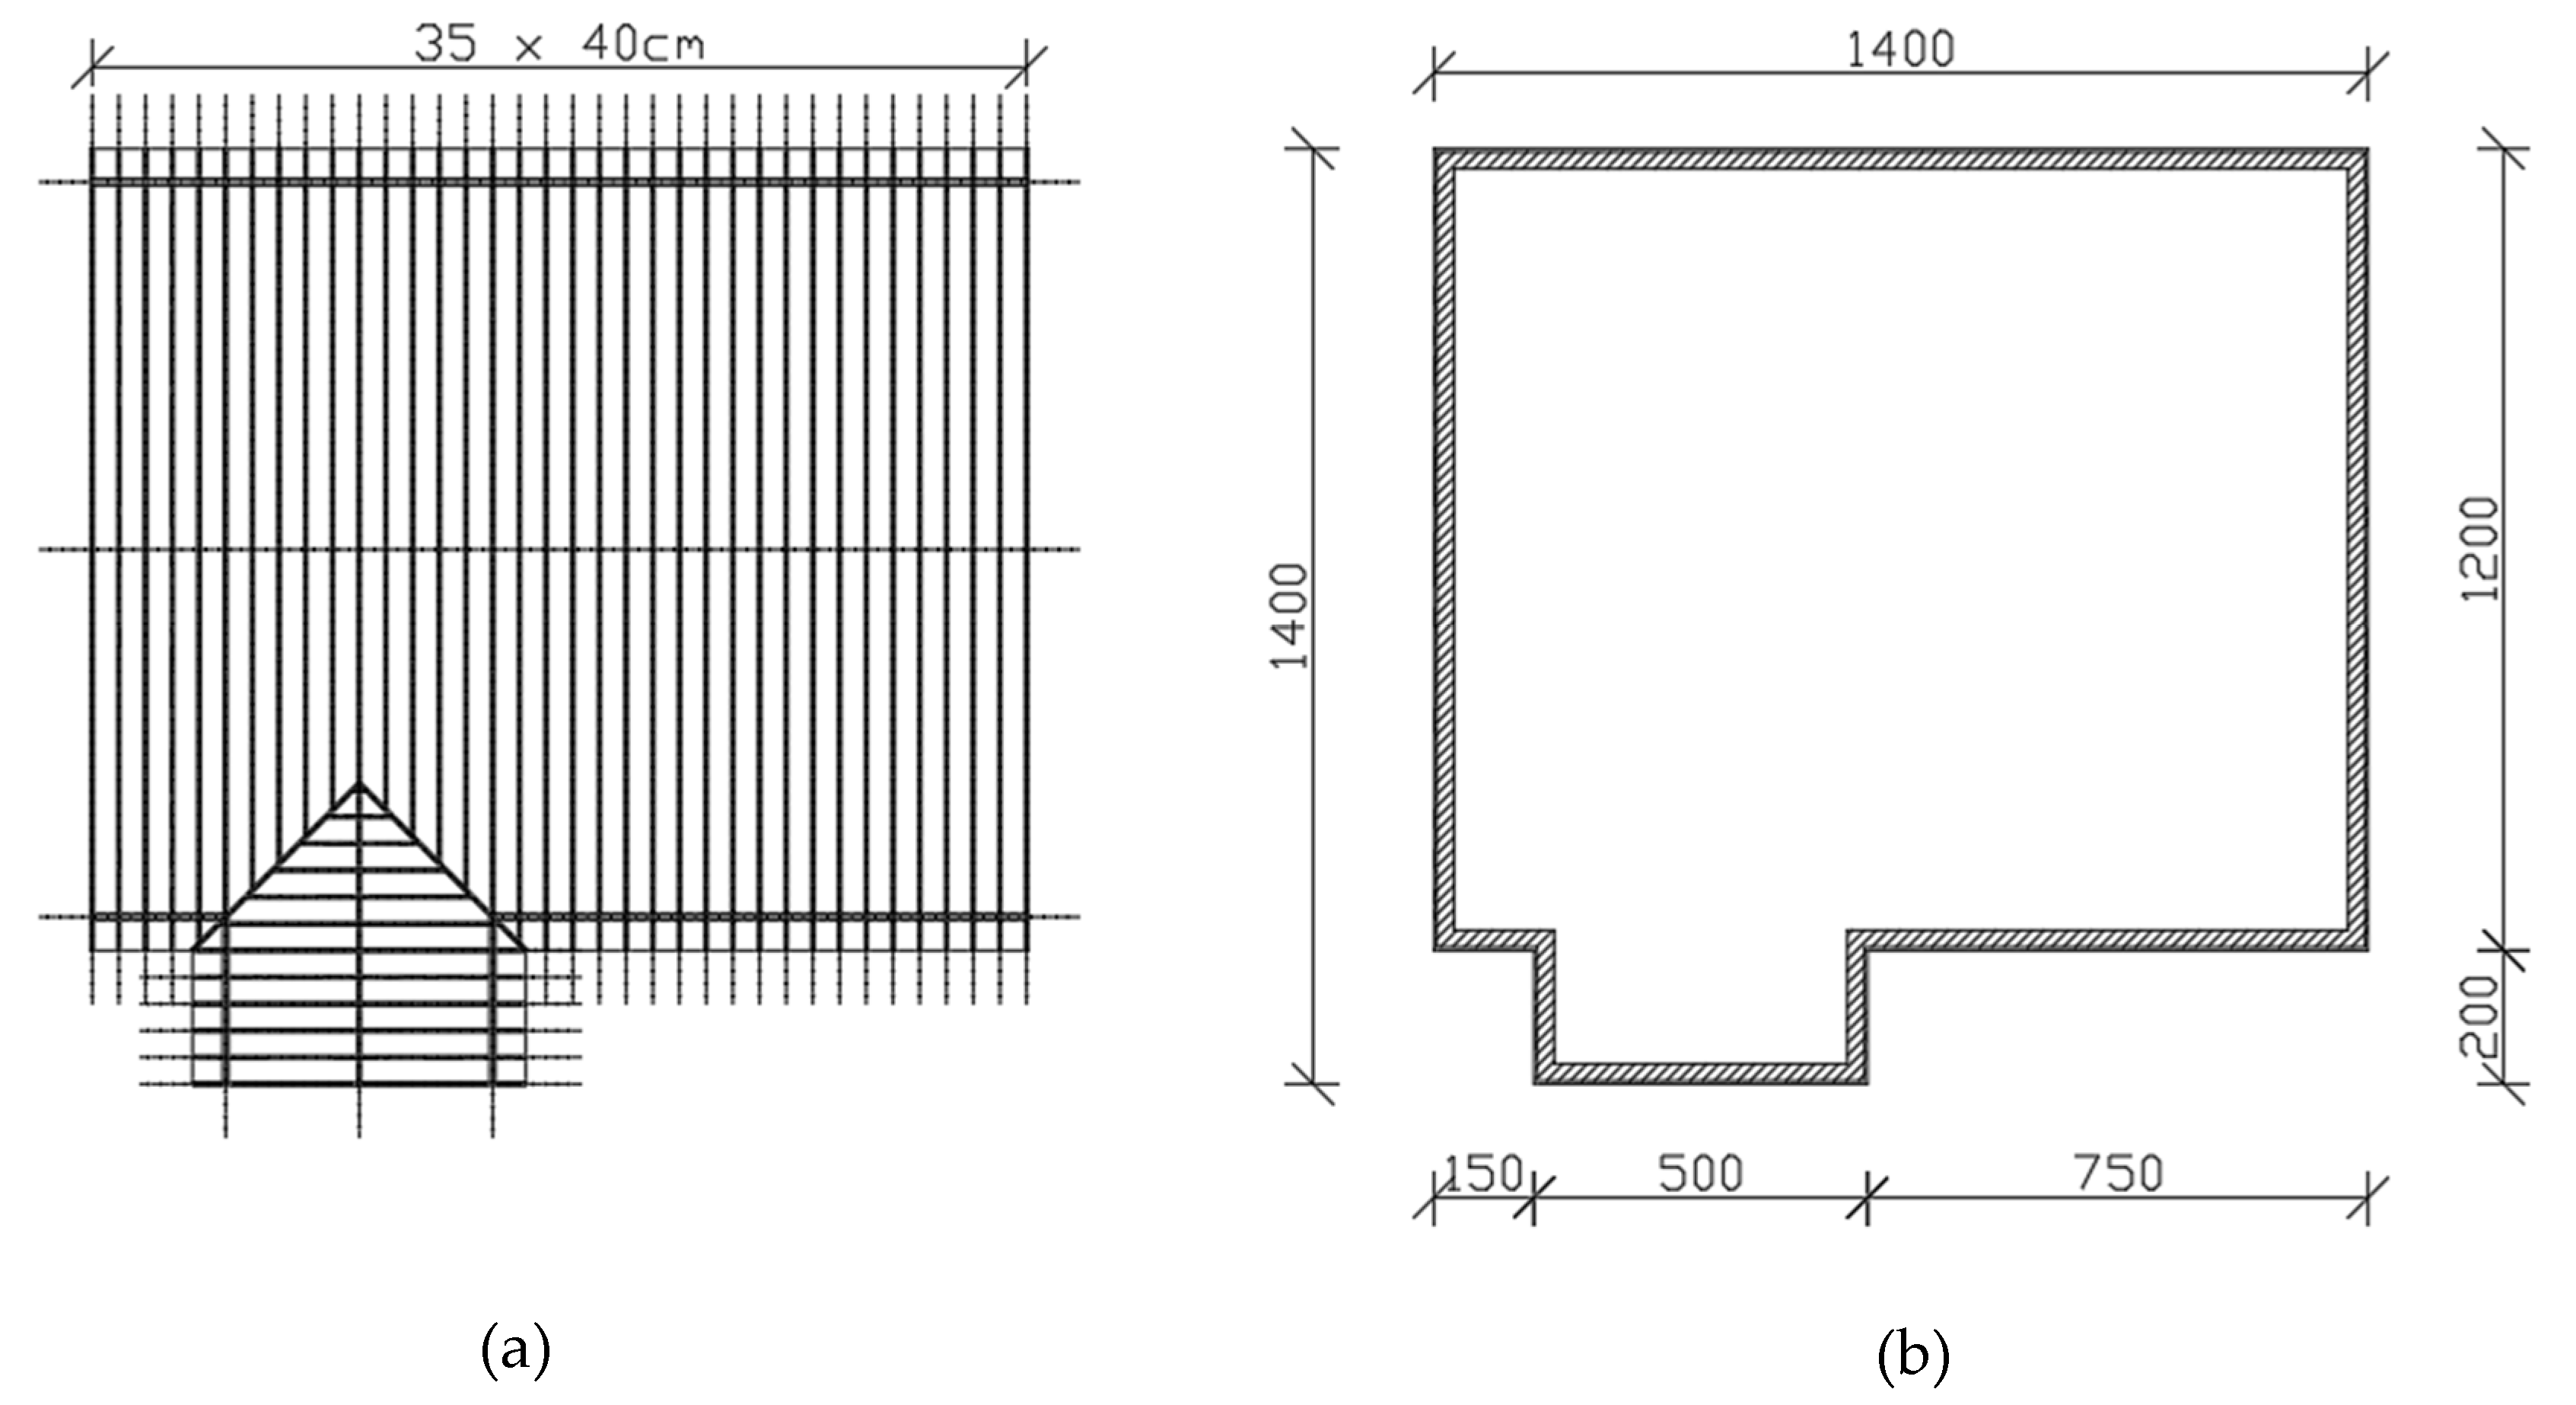
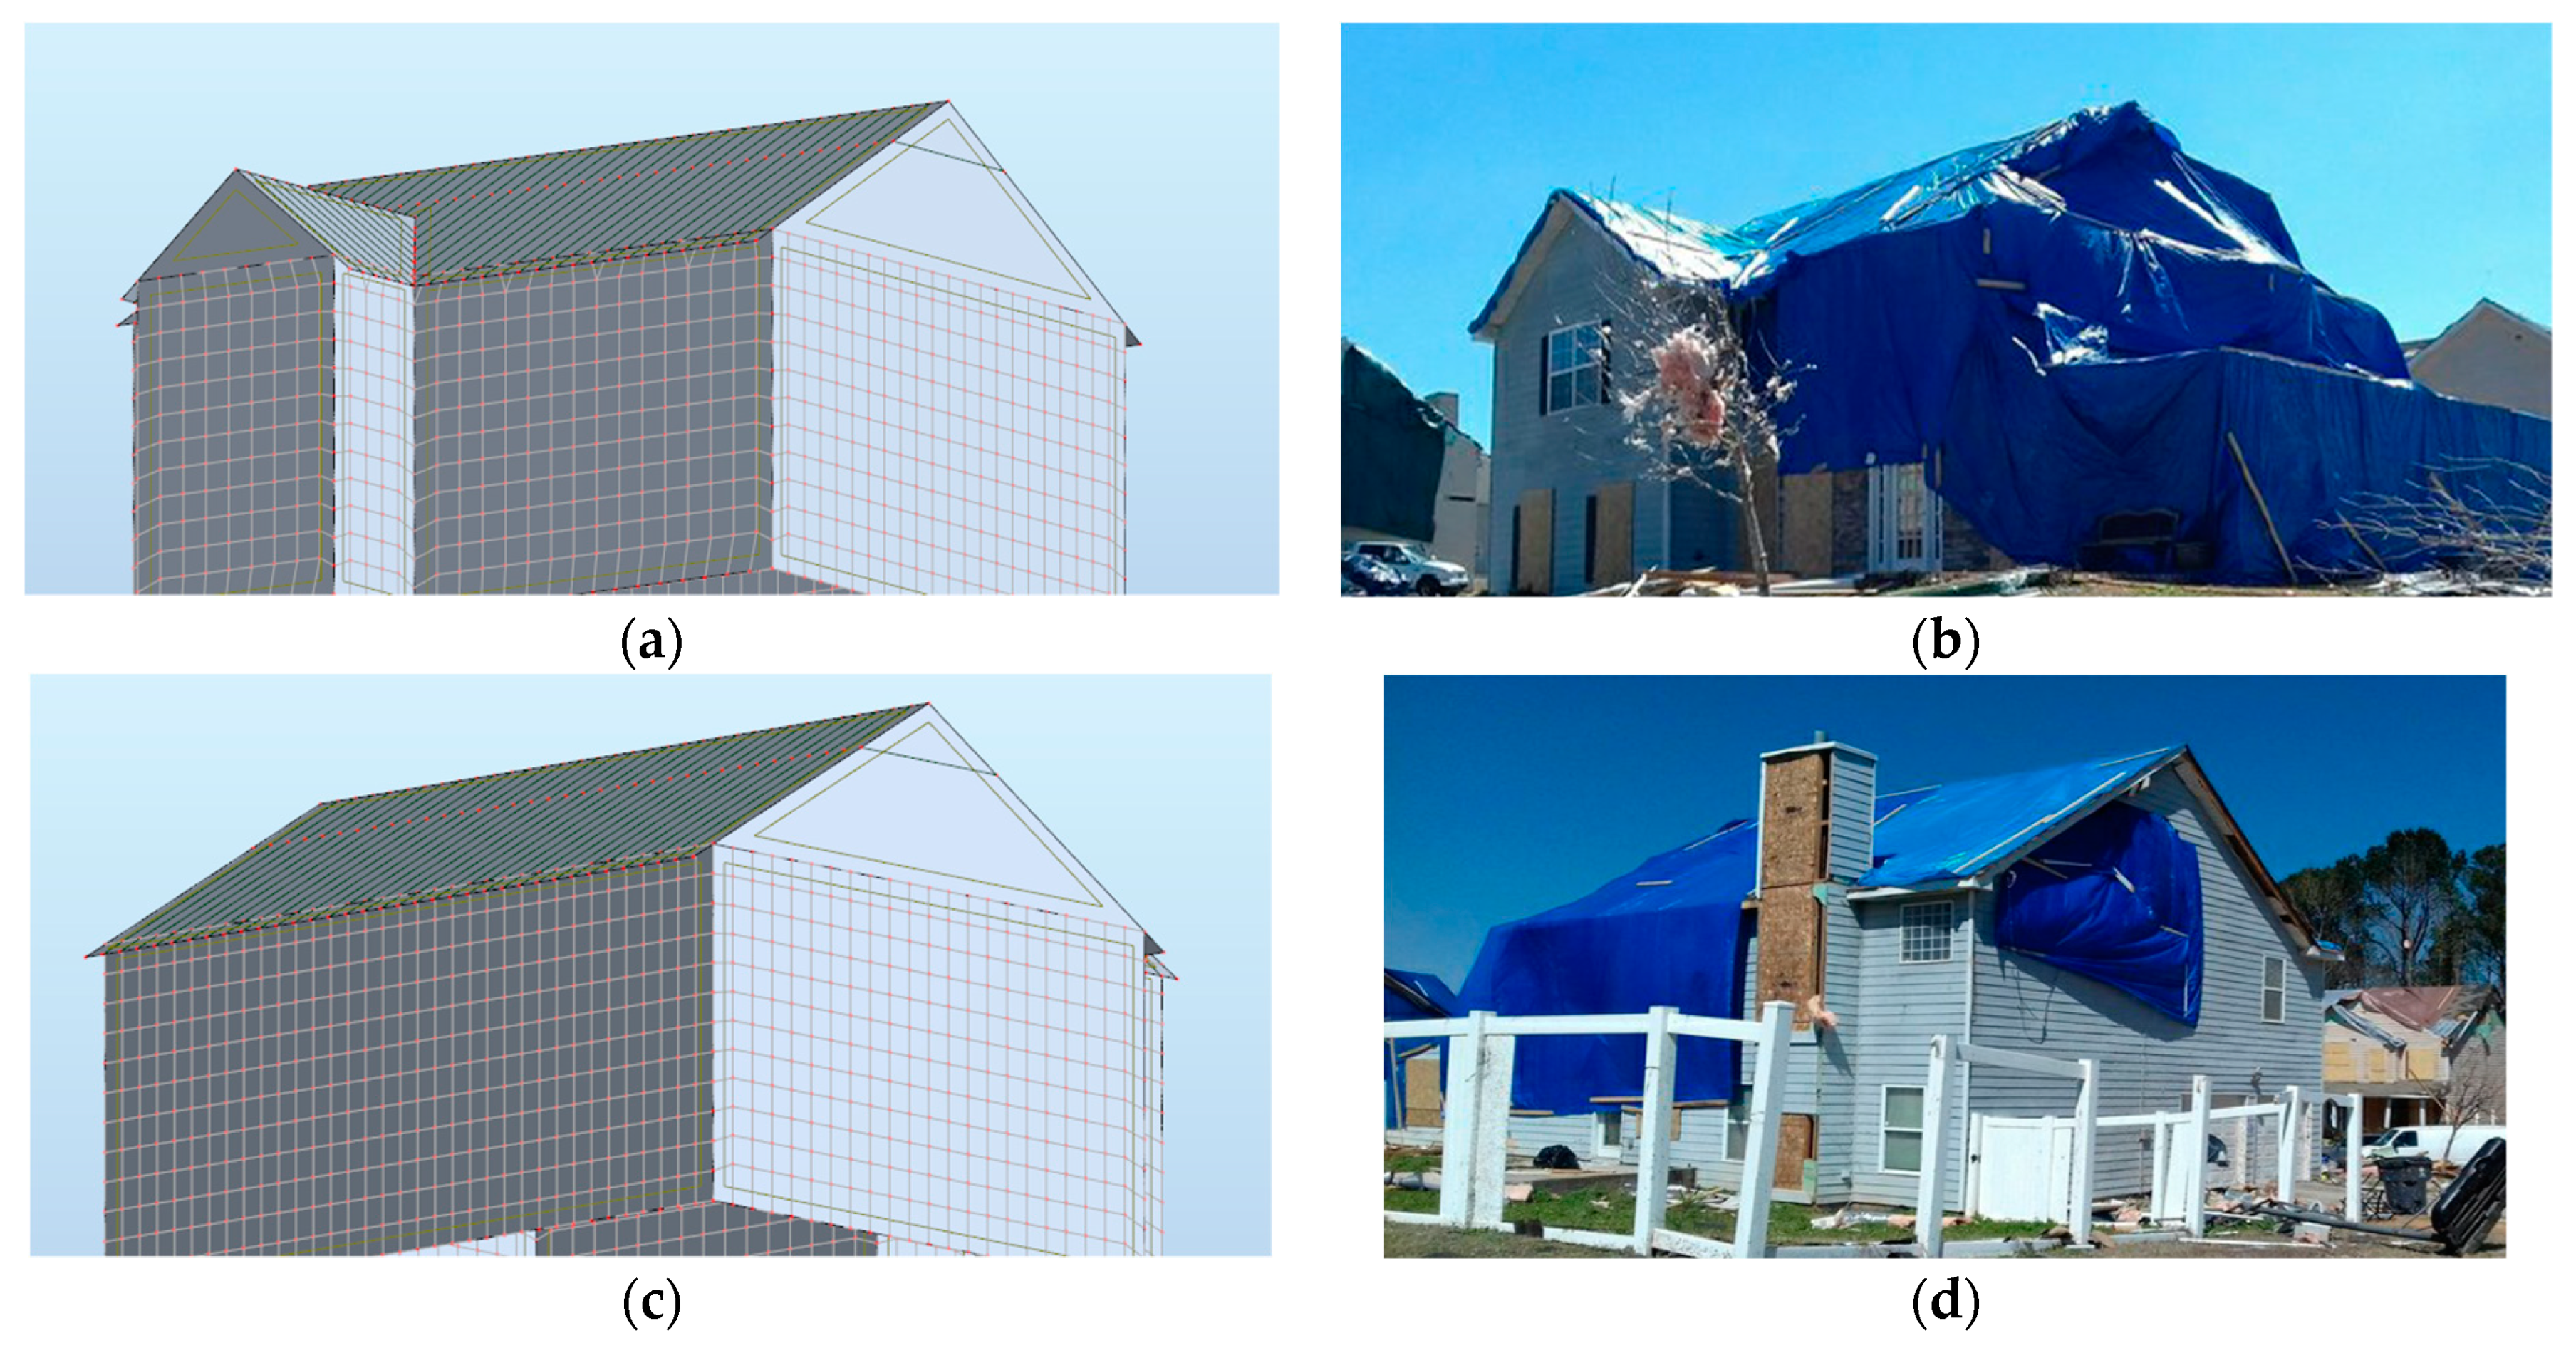
4.1. Model of the Single Family Building

A model of the object was created in the FEM based software. Below is a comparison of the model and real structure after damage (Figure 7). The figure shows a comparison of the computer model and the building damaged during the tornado. The first part compares: computer model, view from the windward side with structure after damage, view from the windward side, then: computer model, view from the leeward side with structure after damage, view from the leeward side.
The roof-structure model consists of 143 bar elements and 227 nodes (Figure 8). In order to better represent the reality, a ceiling was modeled on which the wall battens rest, which, similar to the walls, was discretized using mesh generation with a spacing of 50 cm, which increased the number of nodes to 2370. The roof area in the layout is 178 m2; the actual area of the roof slope, along the longer wall, is 98 m2, and on the gable wall, 21 m2. The wall has an area of 392 m2.

4.2. Calculation of Rafters Based on Eurocodes

The structural analysis was performed based on the Eurocode [9].

Material and Its Strength

Solid coniferous wood of class C24 was used for further analyses. The strength of the material is shown in Table 3.
It is obvious that during the design, it is necessary to reduce the characteristic strength values by the appropriate reduction factors proposed in the design standards, and similarly, to increase the characteristic load values using combination factors and formulas. Using the above, we can be sure that the structure is professionally designed and meets the safety criteria because it has a load capacity margin based on safety factors.
The present study focuses on a structure that has been destroyed, so the safety factors have been exceeded. In order to reproduce this situation, the focus was on the values characteristic for both strength and loads.

4.3. Load Analysis

The model was loaded with three categories: permanent loads, variable loads, and wind action. Wind was assumed to be the main destructive factor, so the remaining loads were assumed as typical for these areas and types of structures.

4.3.1. Non-Standard Calculations--Based on the roof- structure collar beam: In situ Research

The priority of this article is to estimate the wind speed that led to the resulting damage. The first step is to take the value of the pressure resulting from the different wind speeds. Initial estimation of these loads is possible by comparing the real damages of the structure during the Fairburn tornado with the Enhancement Fujita scale. The roof structure was destroyed by breaking, and the tree standing next to it was broken in half.
Using the Rankine model Equations (6)–(8), the maximum value of the tangential velocity V = 49.44 m/s was determined on the basis of meteorological data, assuming forward translation velocity = 12 m/s and the Decay index = 0.6 (Figure 1). In the further part of the article, both cases are checked, assuming three wind values equal to the potential peak horizontal tornado wind speed:
(a)
mid-range EF1 (158 km/h = 44.89 m/s, T1),
(b)
the transition value between the groups (178.5 km/h = 49.44 m/s, T2),
(c)
mid-range EF2 (198.5 km/h = 55.13 m/s, T3).
For the comparison of the results, a typical wind speed compliant with EC [7] was also assumed, equal to 22 m/s, LWS.
Three directions of wind action were assumed in the numerical analysis, as shown in the figure below (Figure 9).

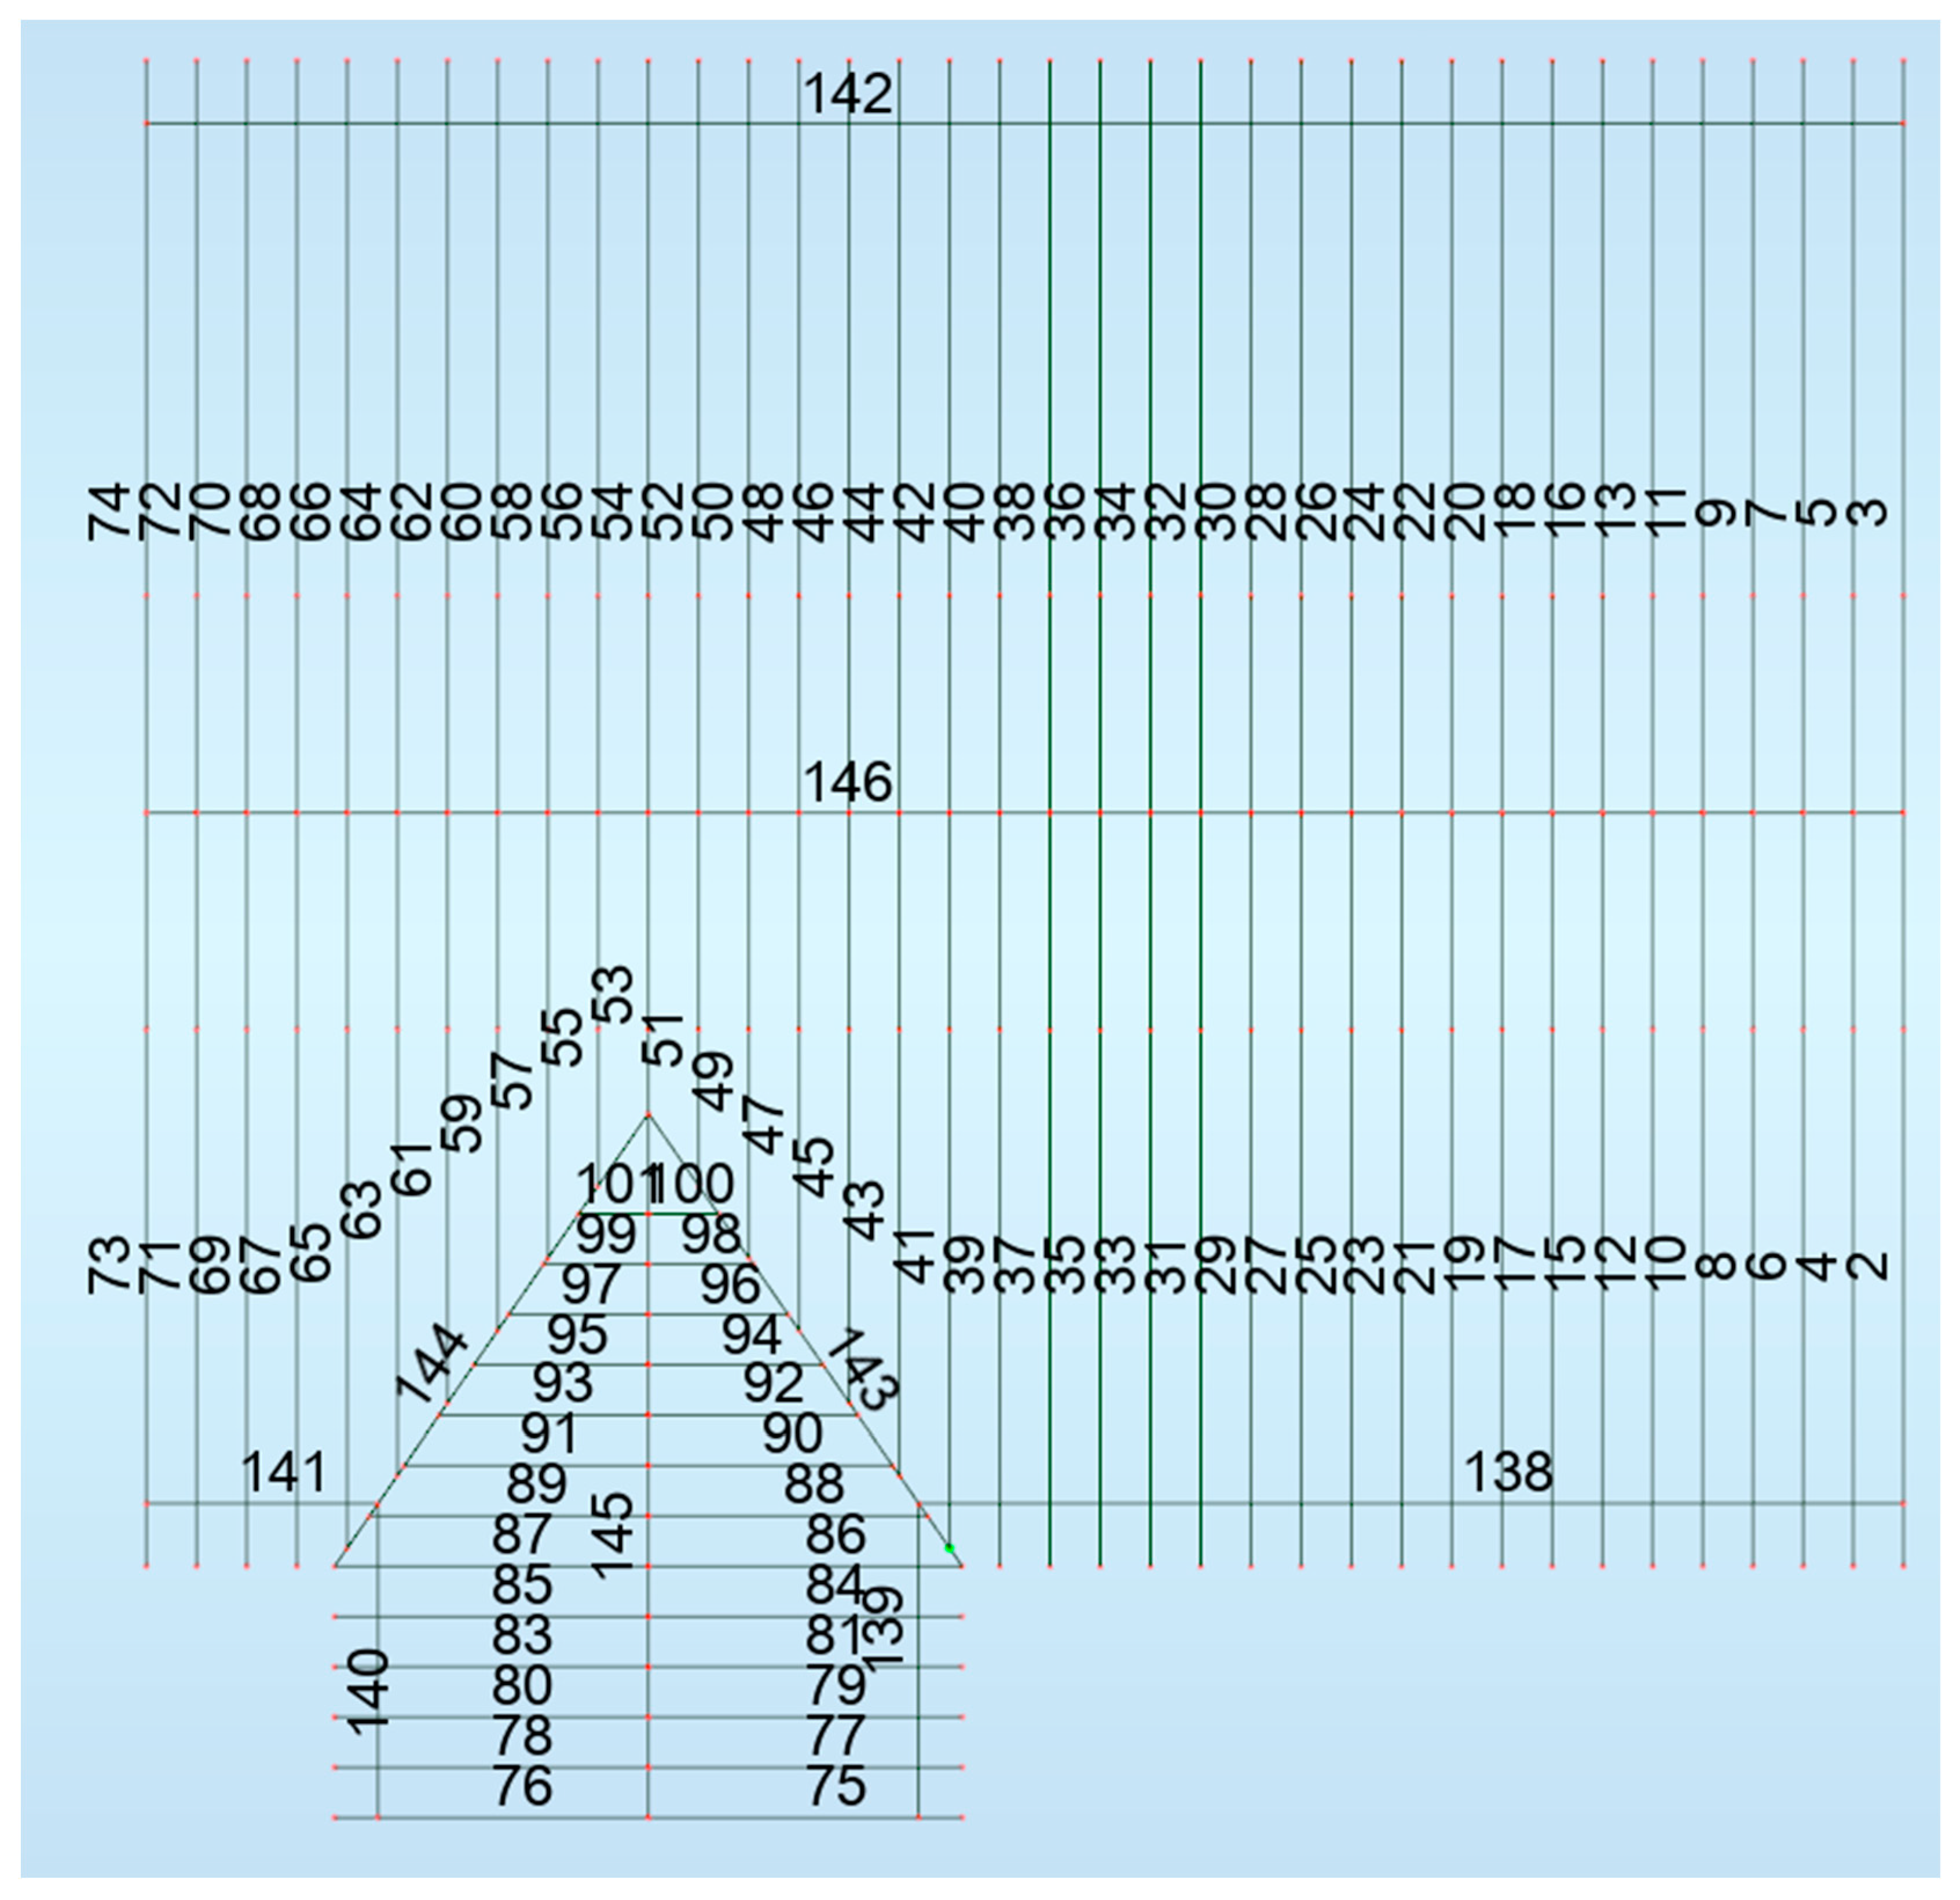
4.3.2. Standard Calculations—FEM Analysis

Using computer-aided modelling, a wind load with different wind speeds and directions was generated in the calculation program.
Below one can see how the pressures are distributed: pressure and suction, and what numerical values they take for the assumed wind directions (Figure 10).
The numerical model was created to represent the moment before the destruction visible in Figure 5; therefore it contains a complete set of roof trusses (In Figure 5, several pairs of rafters are missing—there is a gap). Further calculations focused on reading the forces in the “missing” rafters, so the forces generated in rafters numbered 2, 3, 4 and 5 were checked (see Figure 8).

5. Numerical Analysis Results and Comparison of Strong Wind Analysis with Real Tornado Action

5.1. Low Wind Speed Load (LWS)

In the analysis, the rafters that were damaged were checked. The internal forces that occurred in the element as a result of the action of a permanent load (Figure 11a,c,e) and separately from the action of the wind (Figure 11b,d,f) were checked. The diagrams below show the following: shear forces (Figure 11a,b) that may cause tearing or shearing of the element, and bending moments (Figure 11c,d) that may cause fracture and stresses (Figure 11e,f).

5.2. High Wind Speed Load, T1, T2, T3

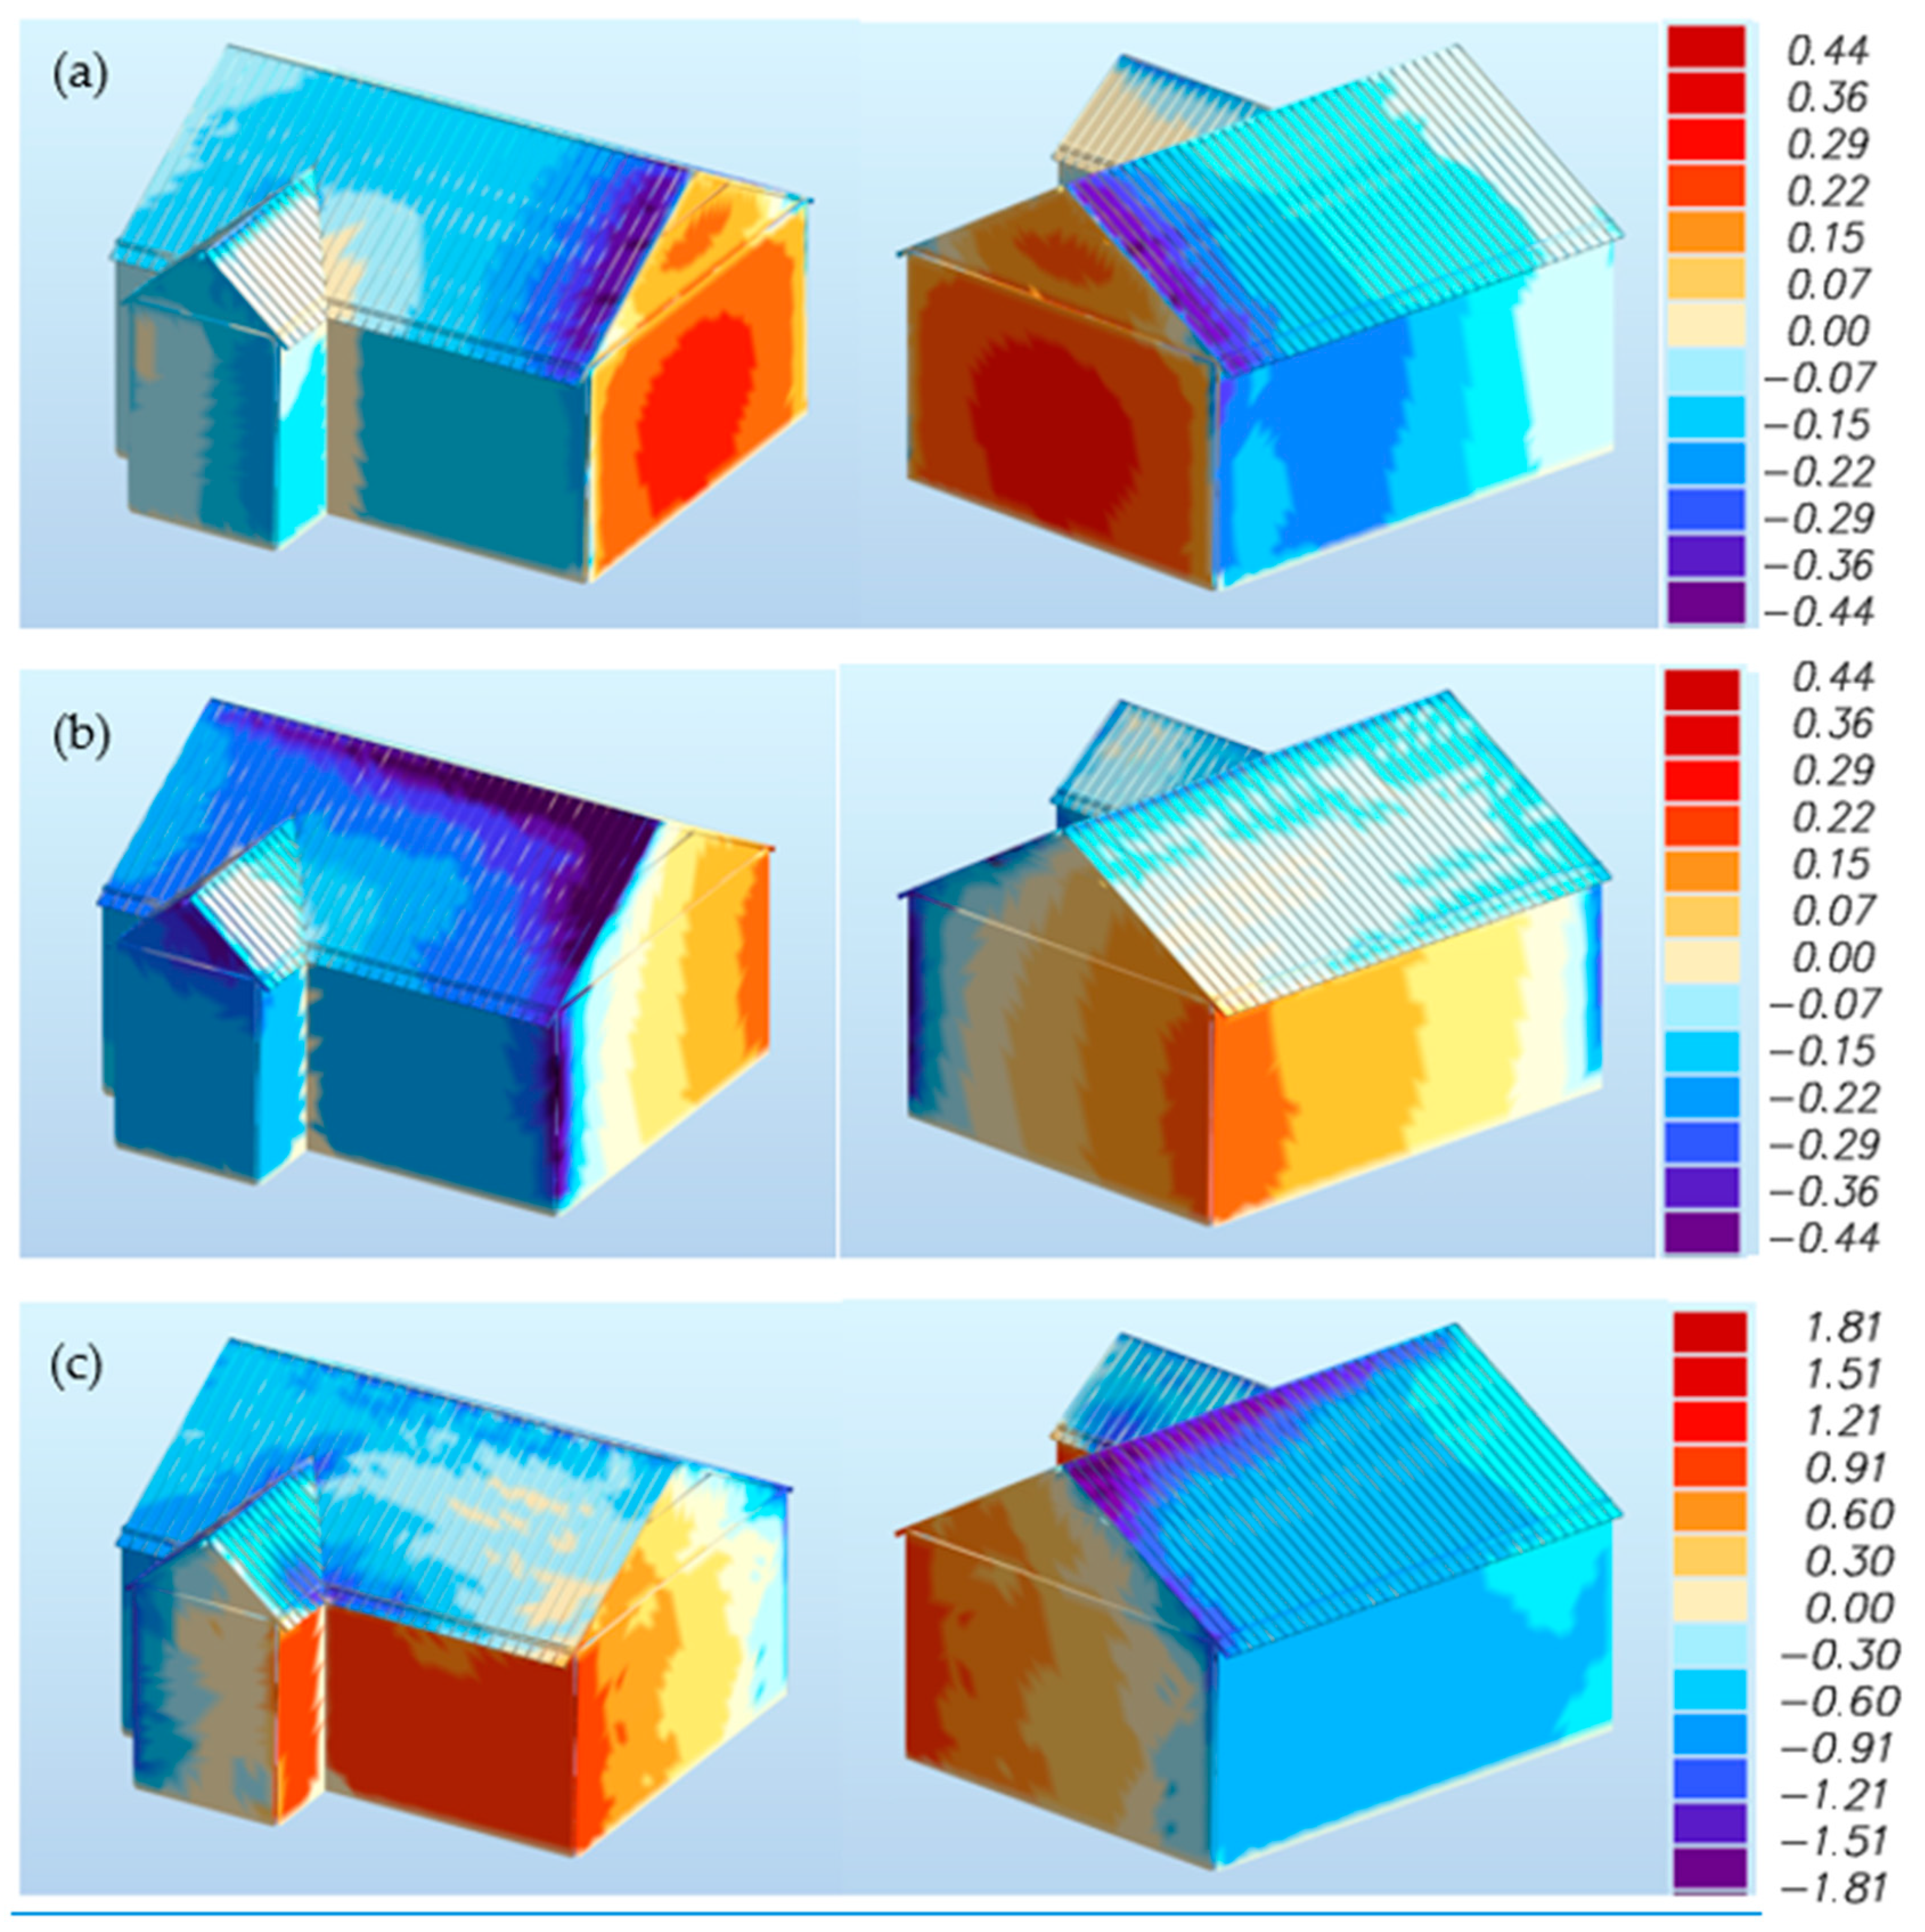
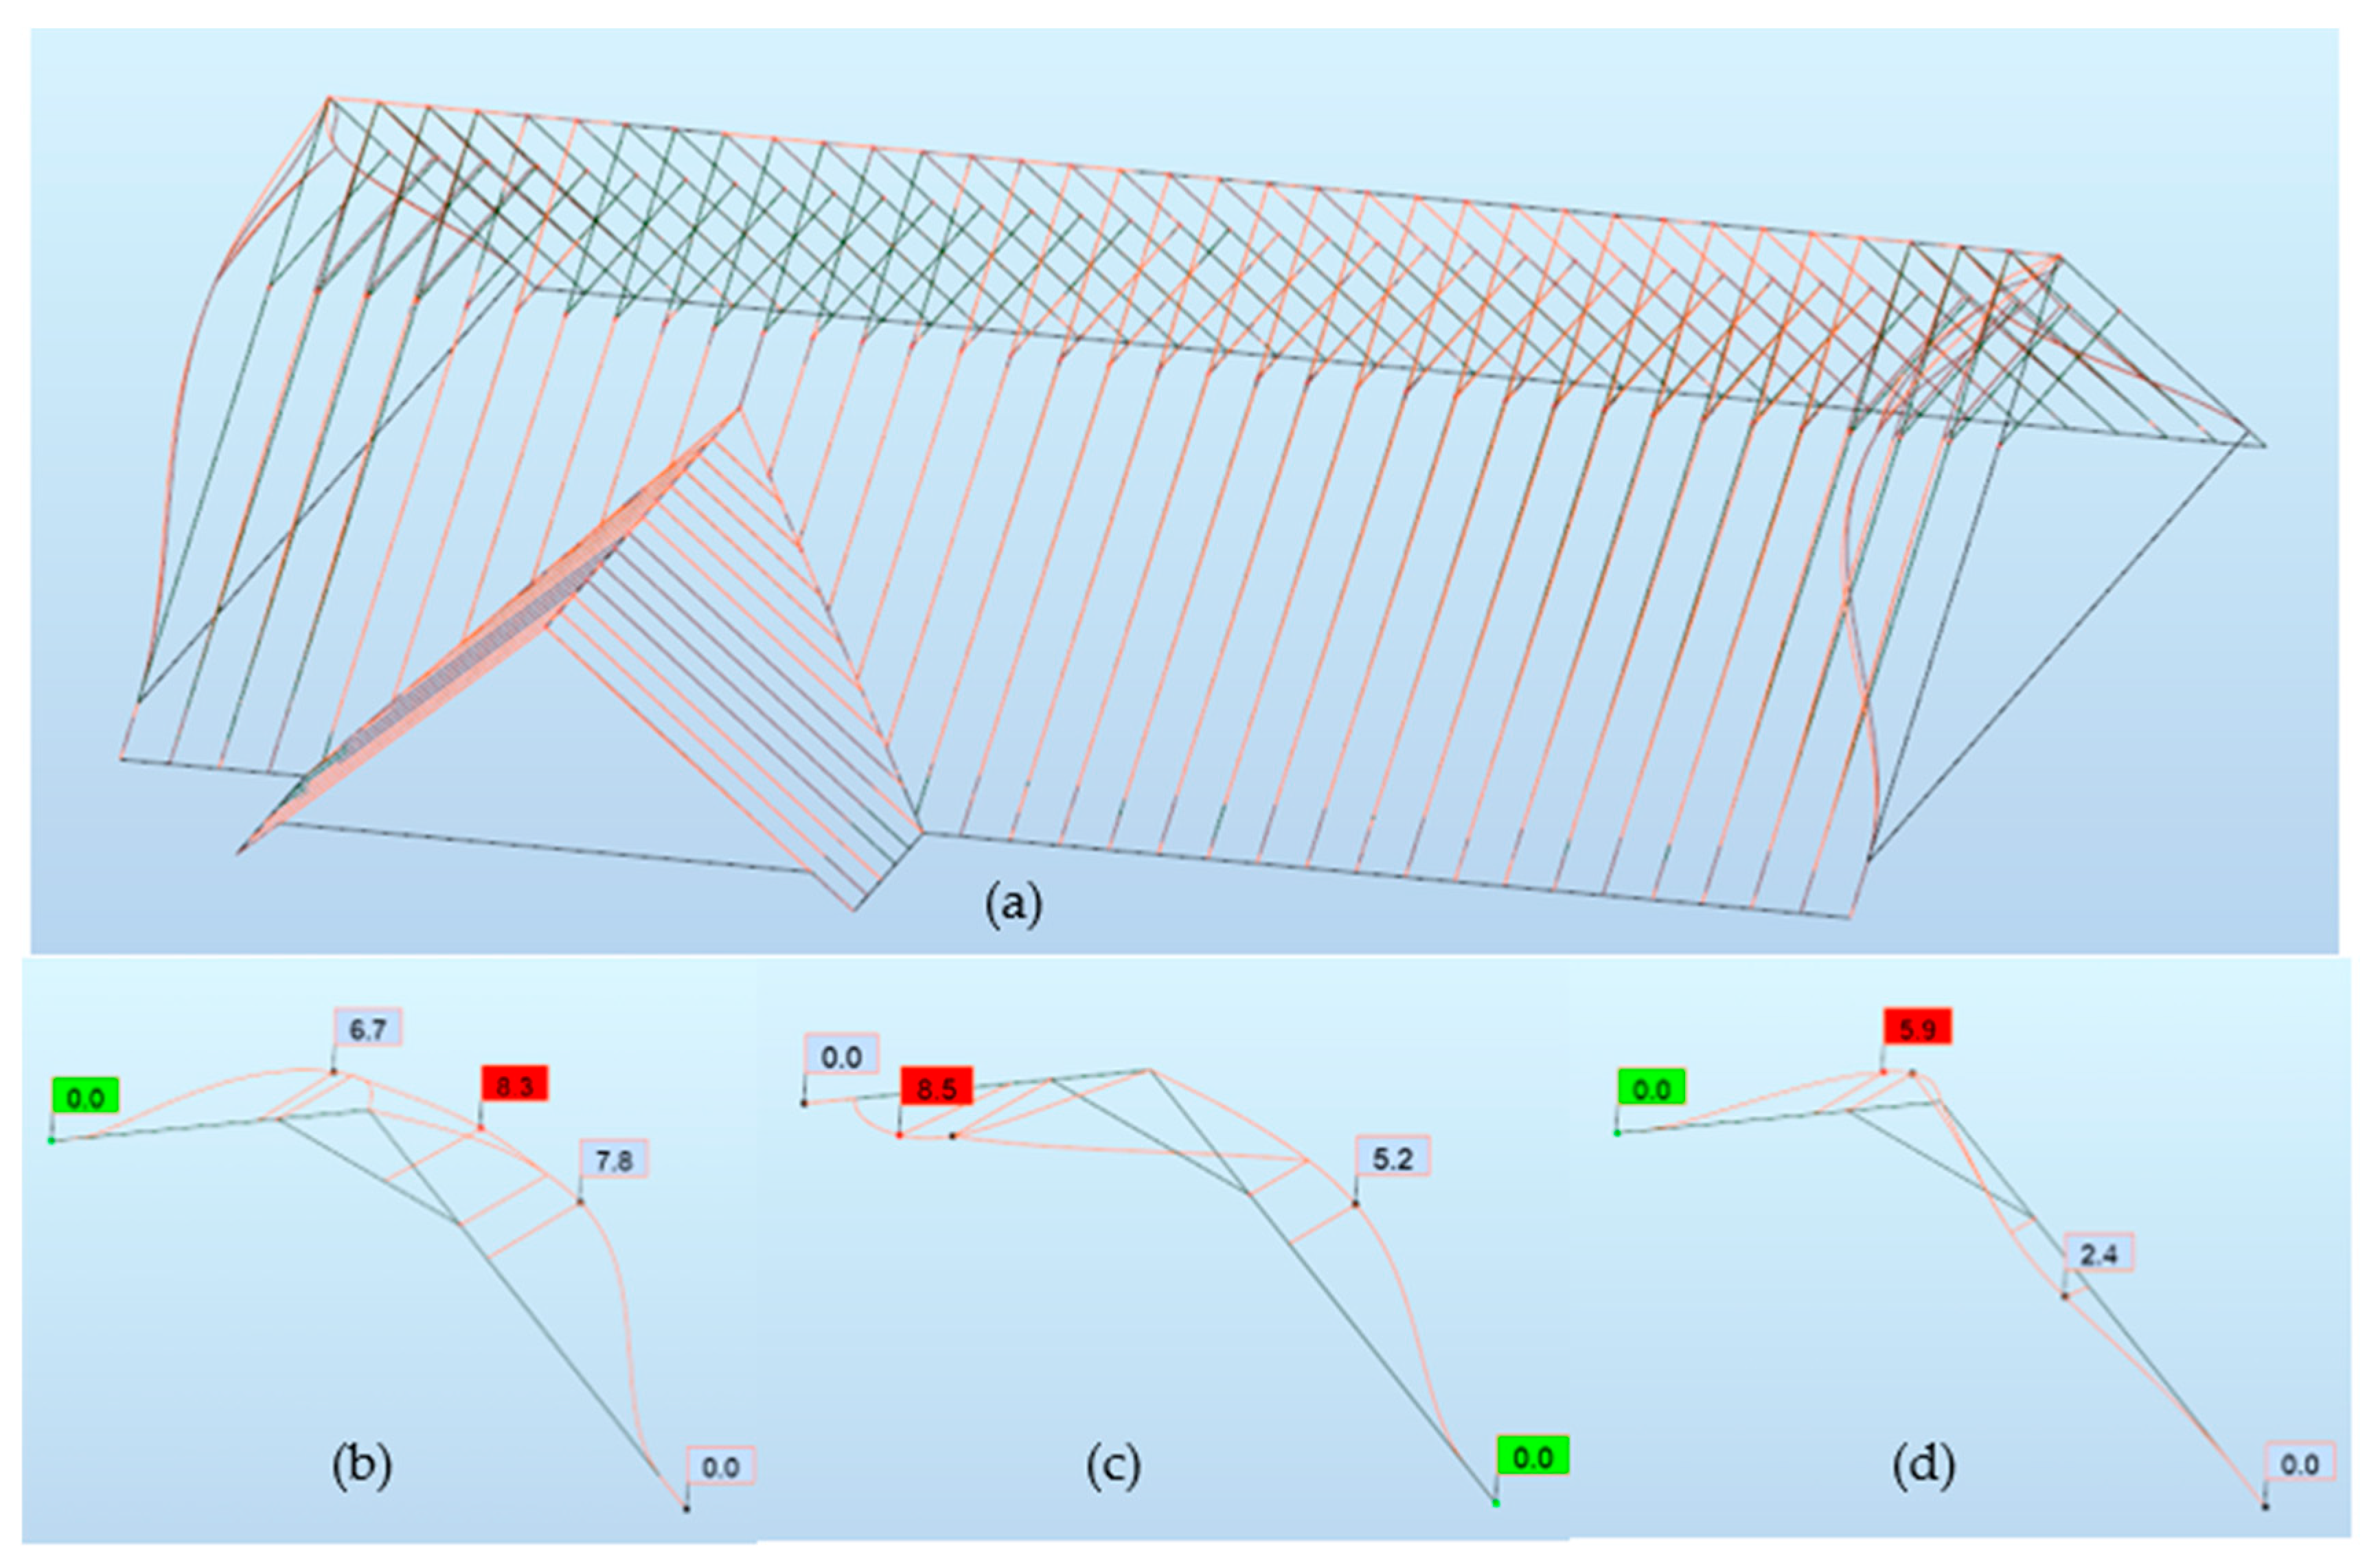
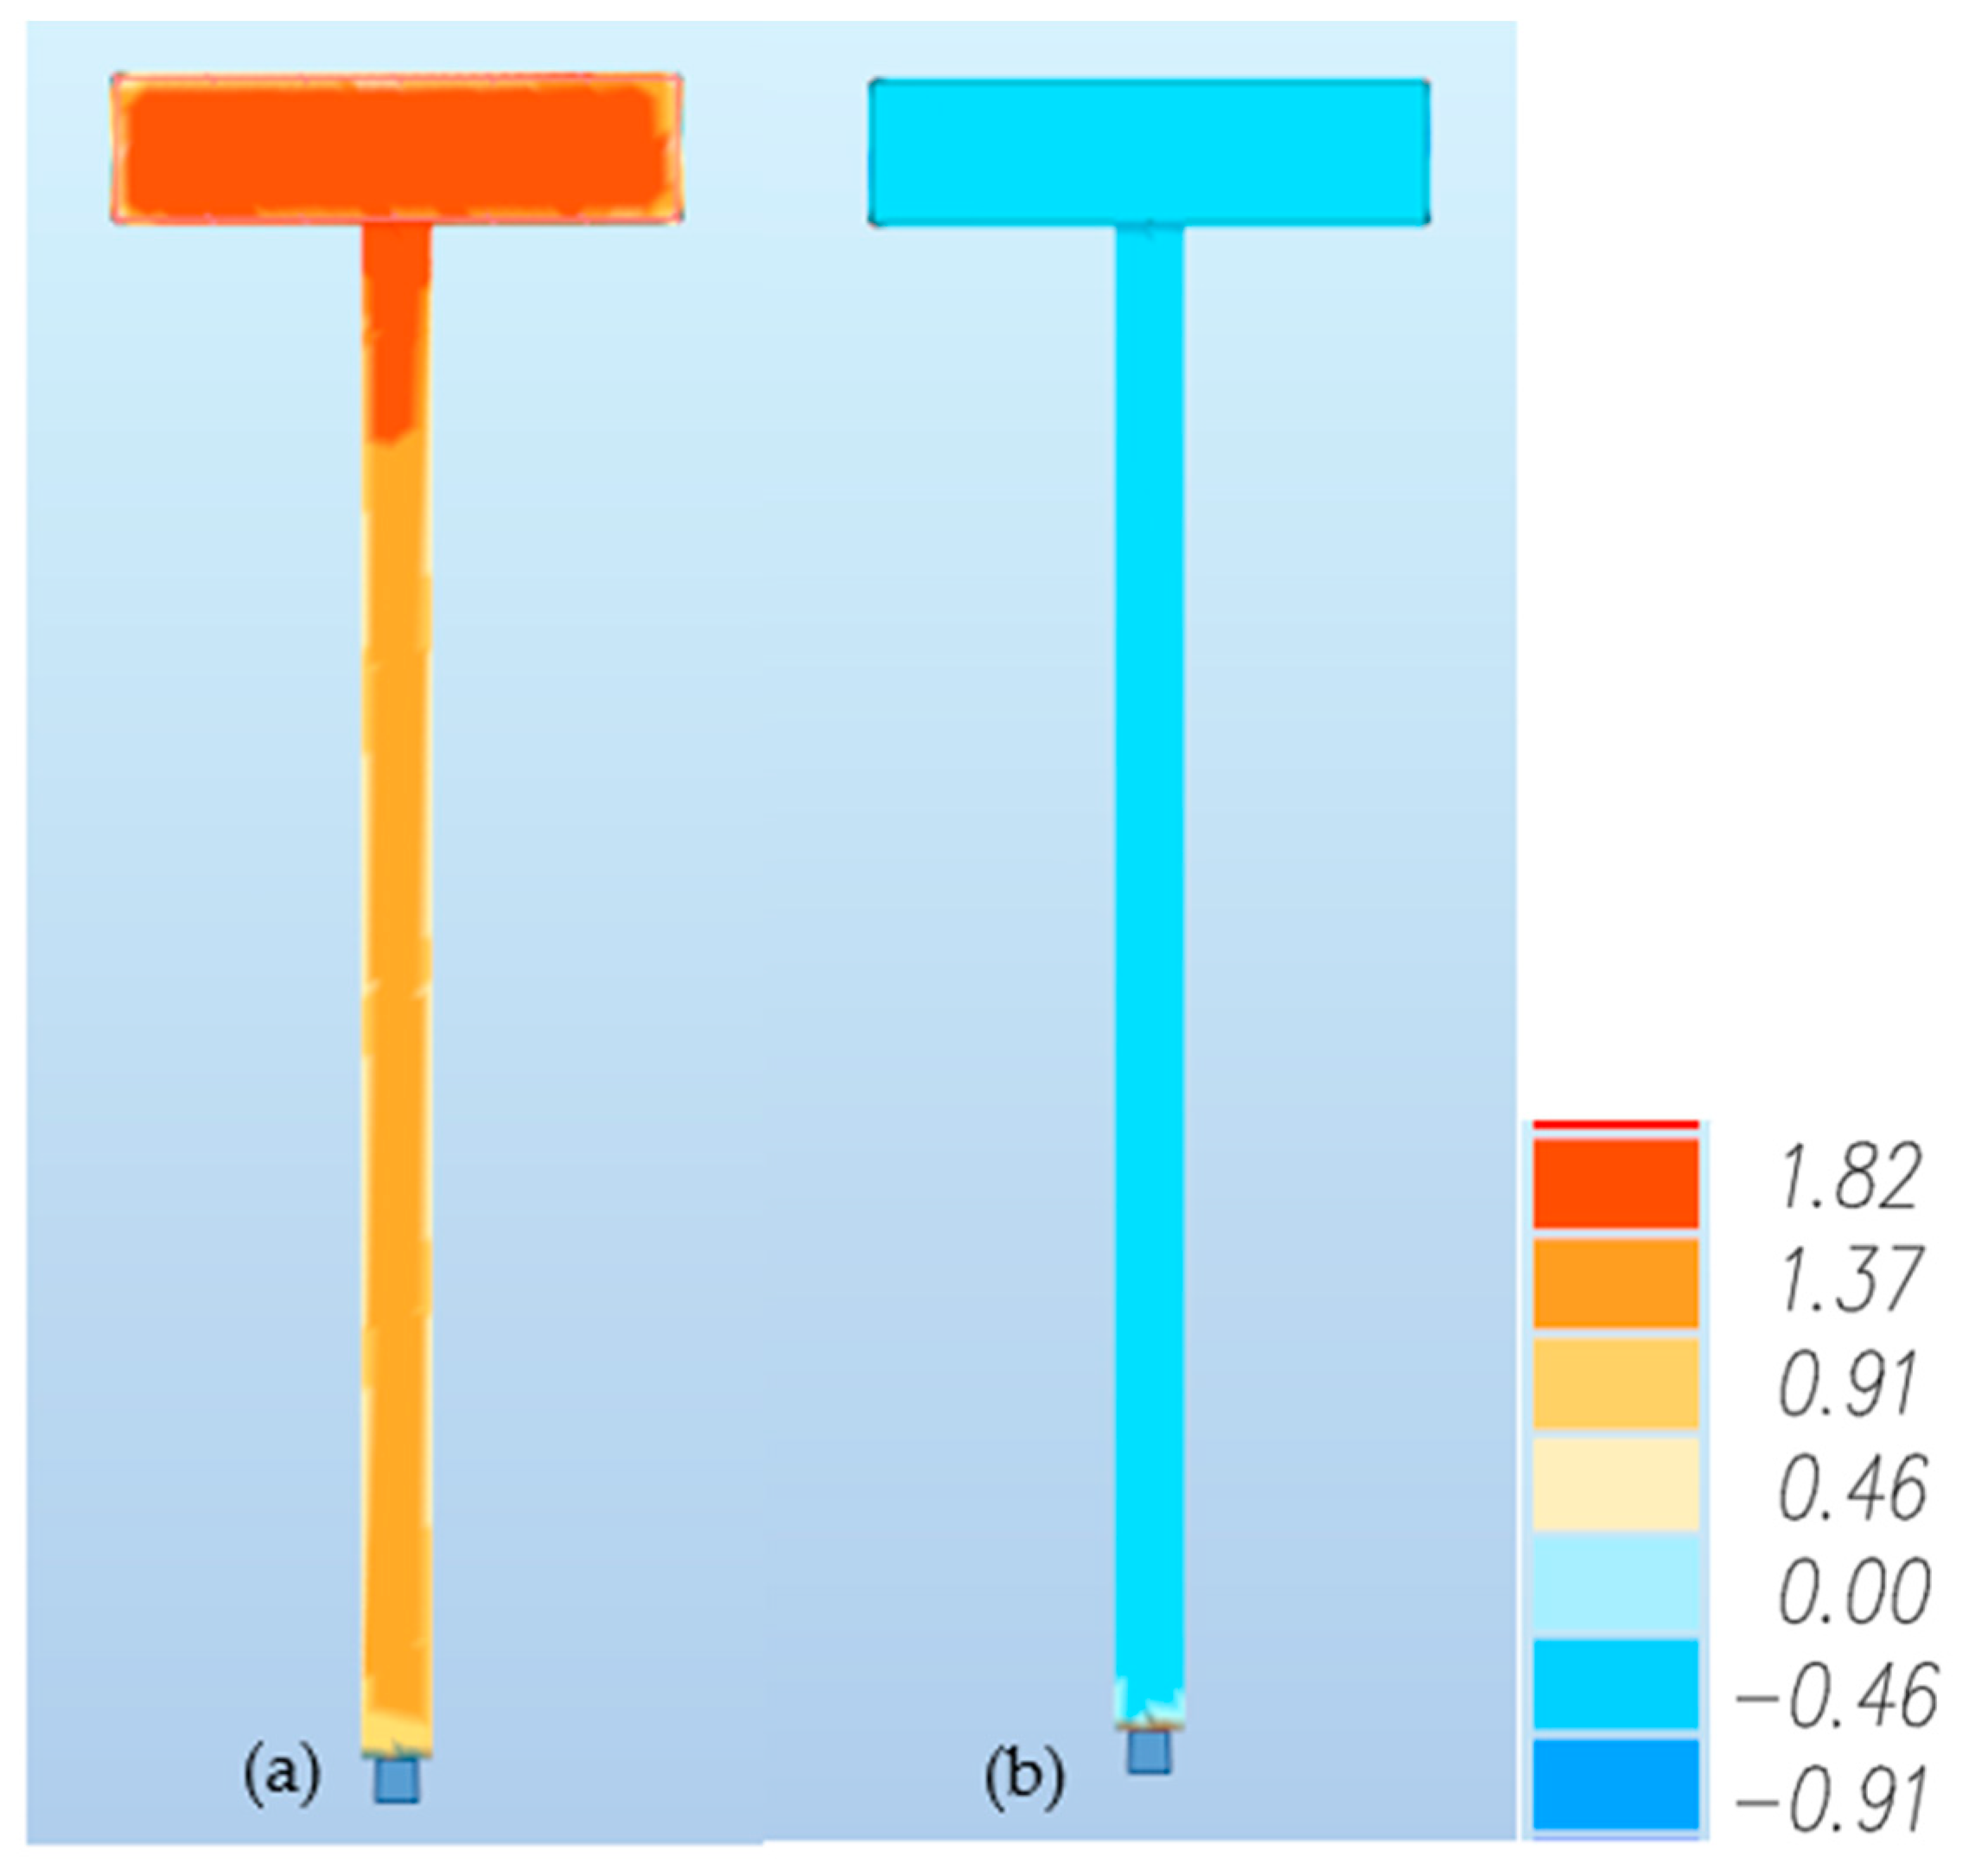
5.2.1. Structure Deformation Analysis

Another possible mode of failure may occur as a result of structural deformation, which includes horizontal displacement and vertical deflection. The diagram below shows the deformation of all elements (Figure 12a) and the detailed deformation of the damaged element depending on the wind direction (Figure 9) as follows: east W1 (Figure 12b), north-east W2 (Figure 12c) and south-east W3 (Figure 12d).
The exact displacement values are shown in Table 4. The data have been divided according to the type of load (permanent load or wind load, which has been divided according to speed, starting from 22 m/s (LWS) to 55.13 (T3)). The results for each wind direction are shown separately (see Section 4.3.1).
The largest displacement obtained was for the speed of 55.14 m/s in the W2 direction, corresponding to Figure 12b.

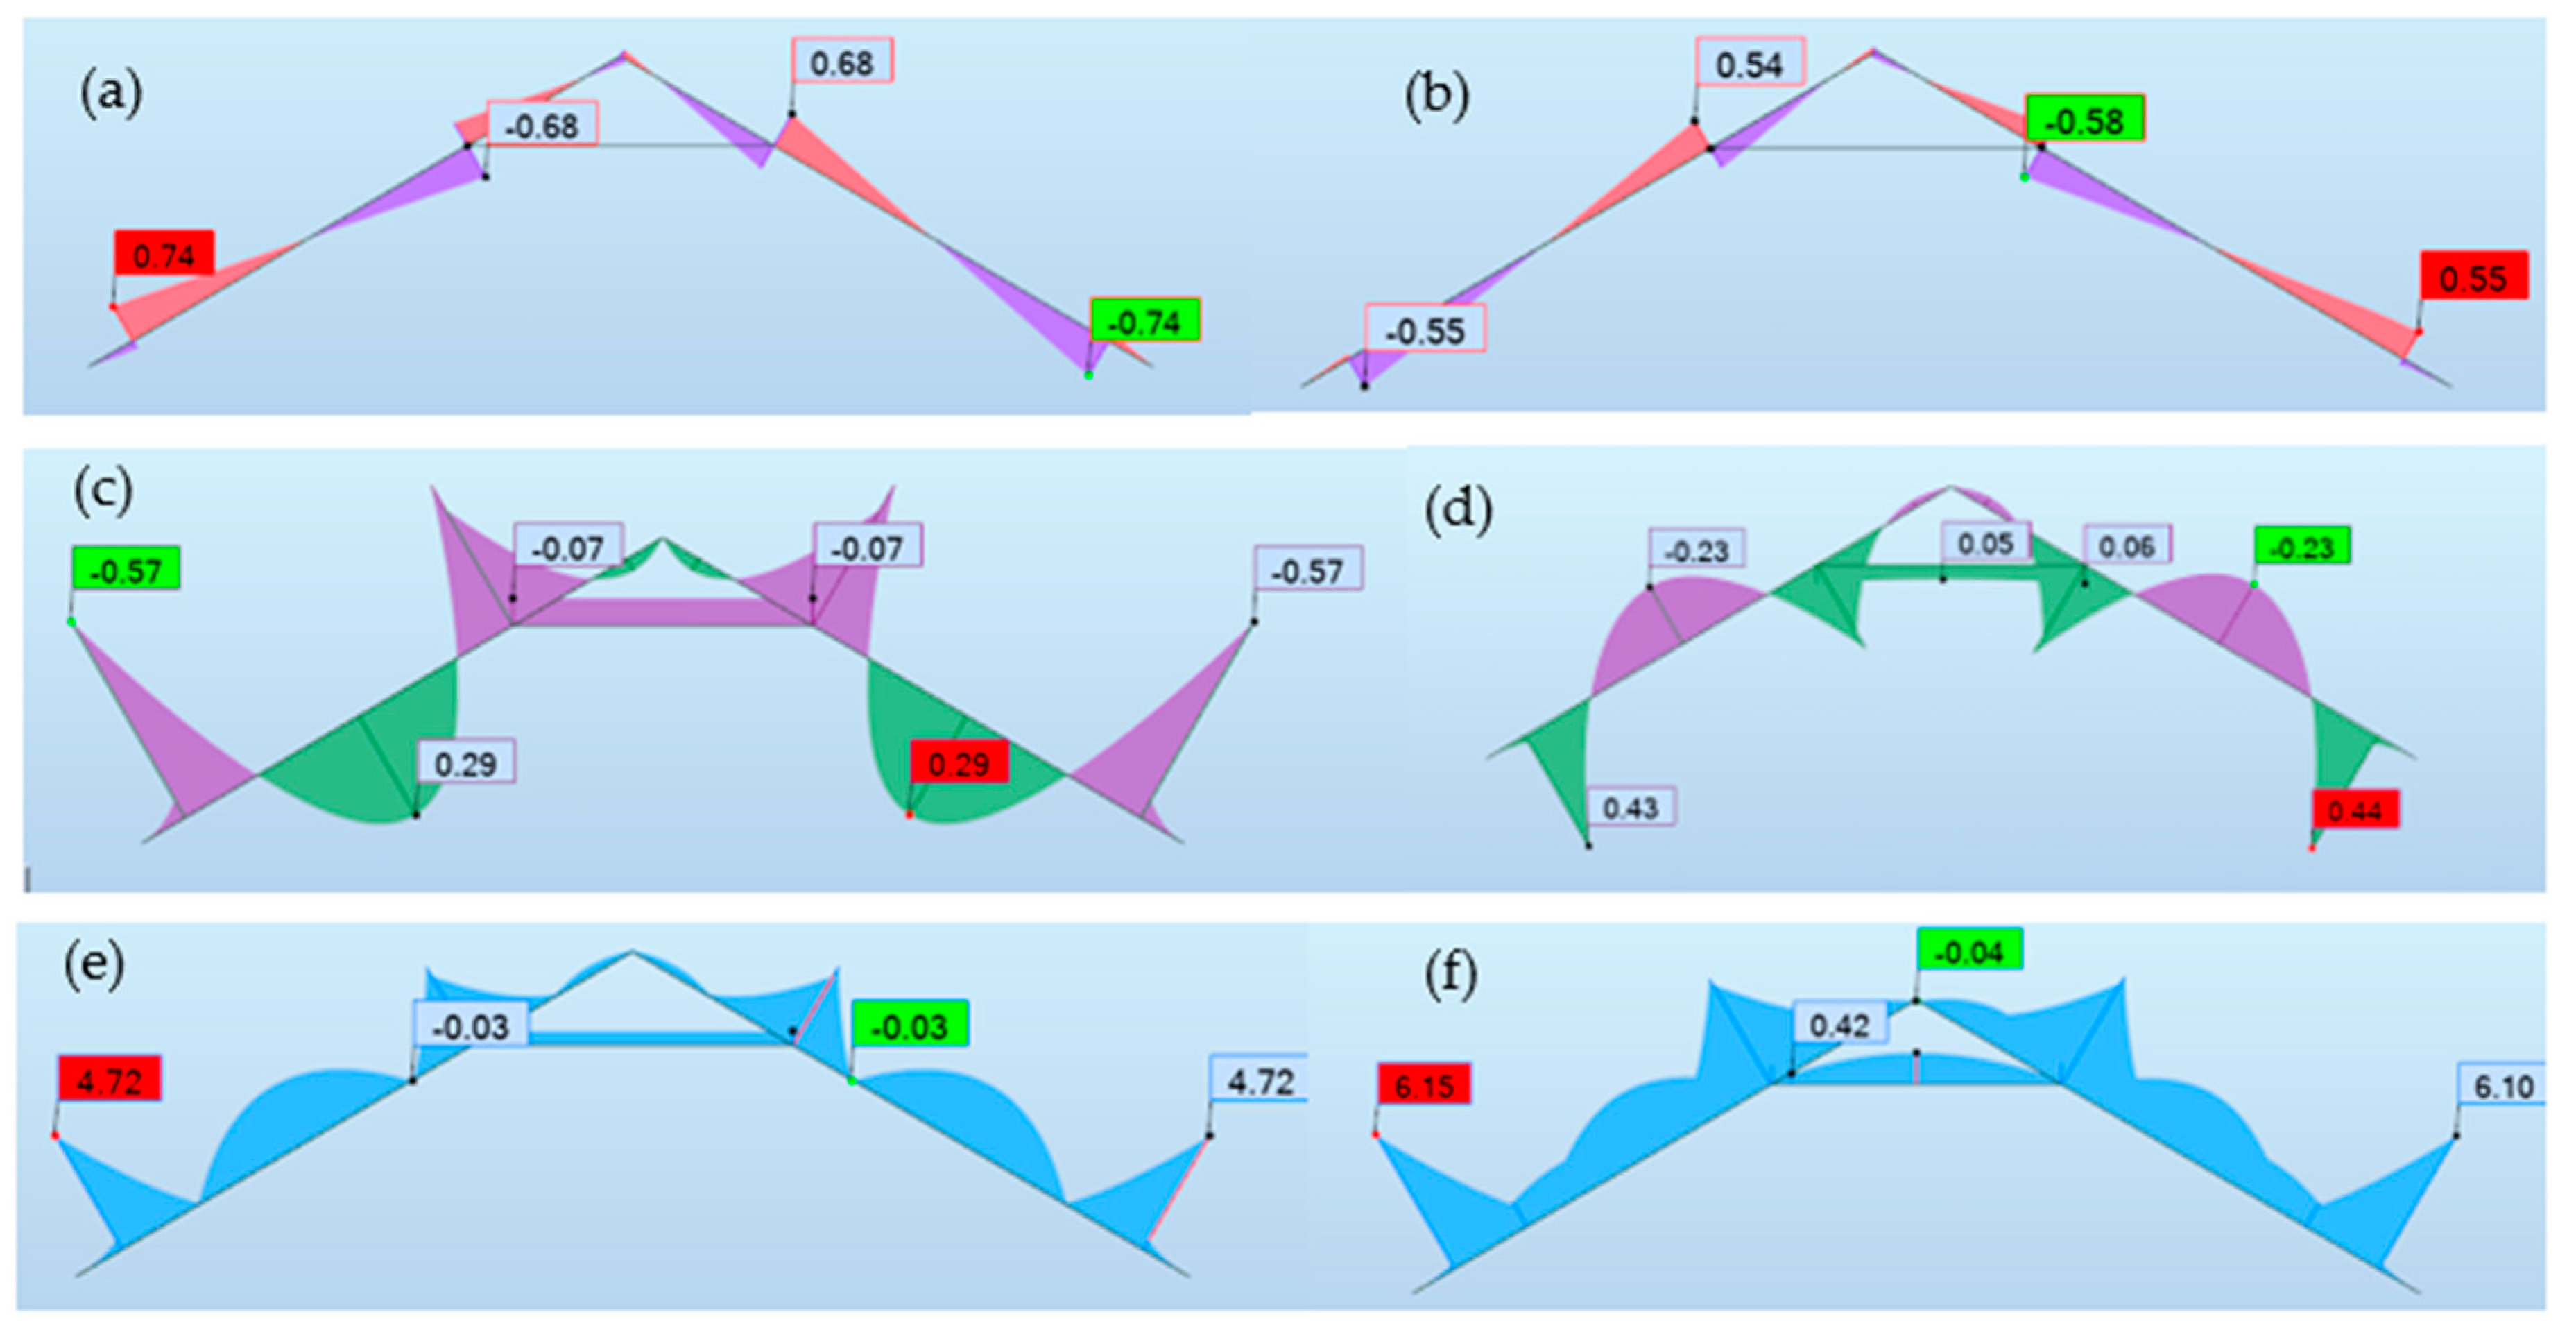
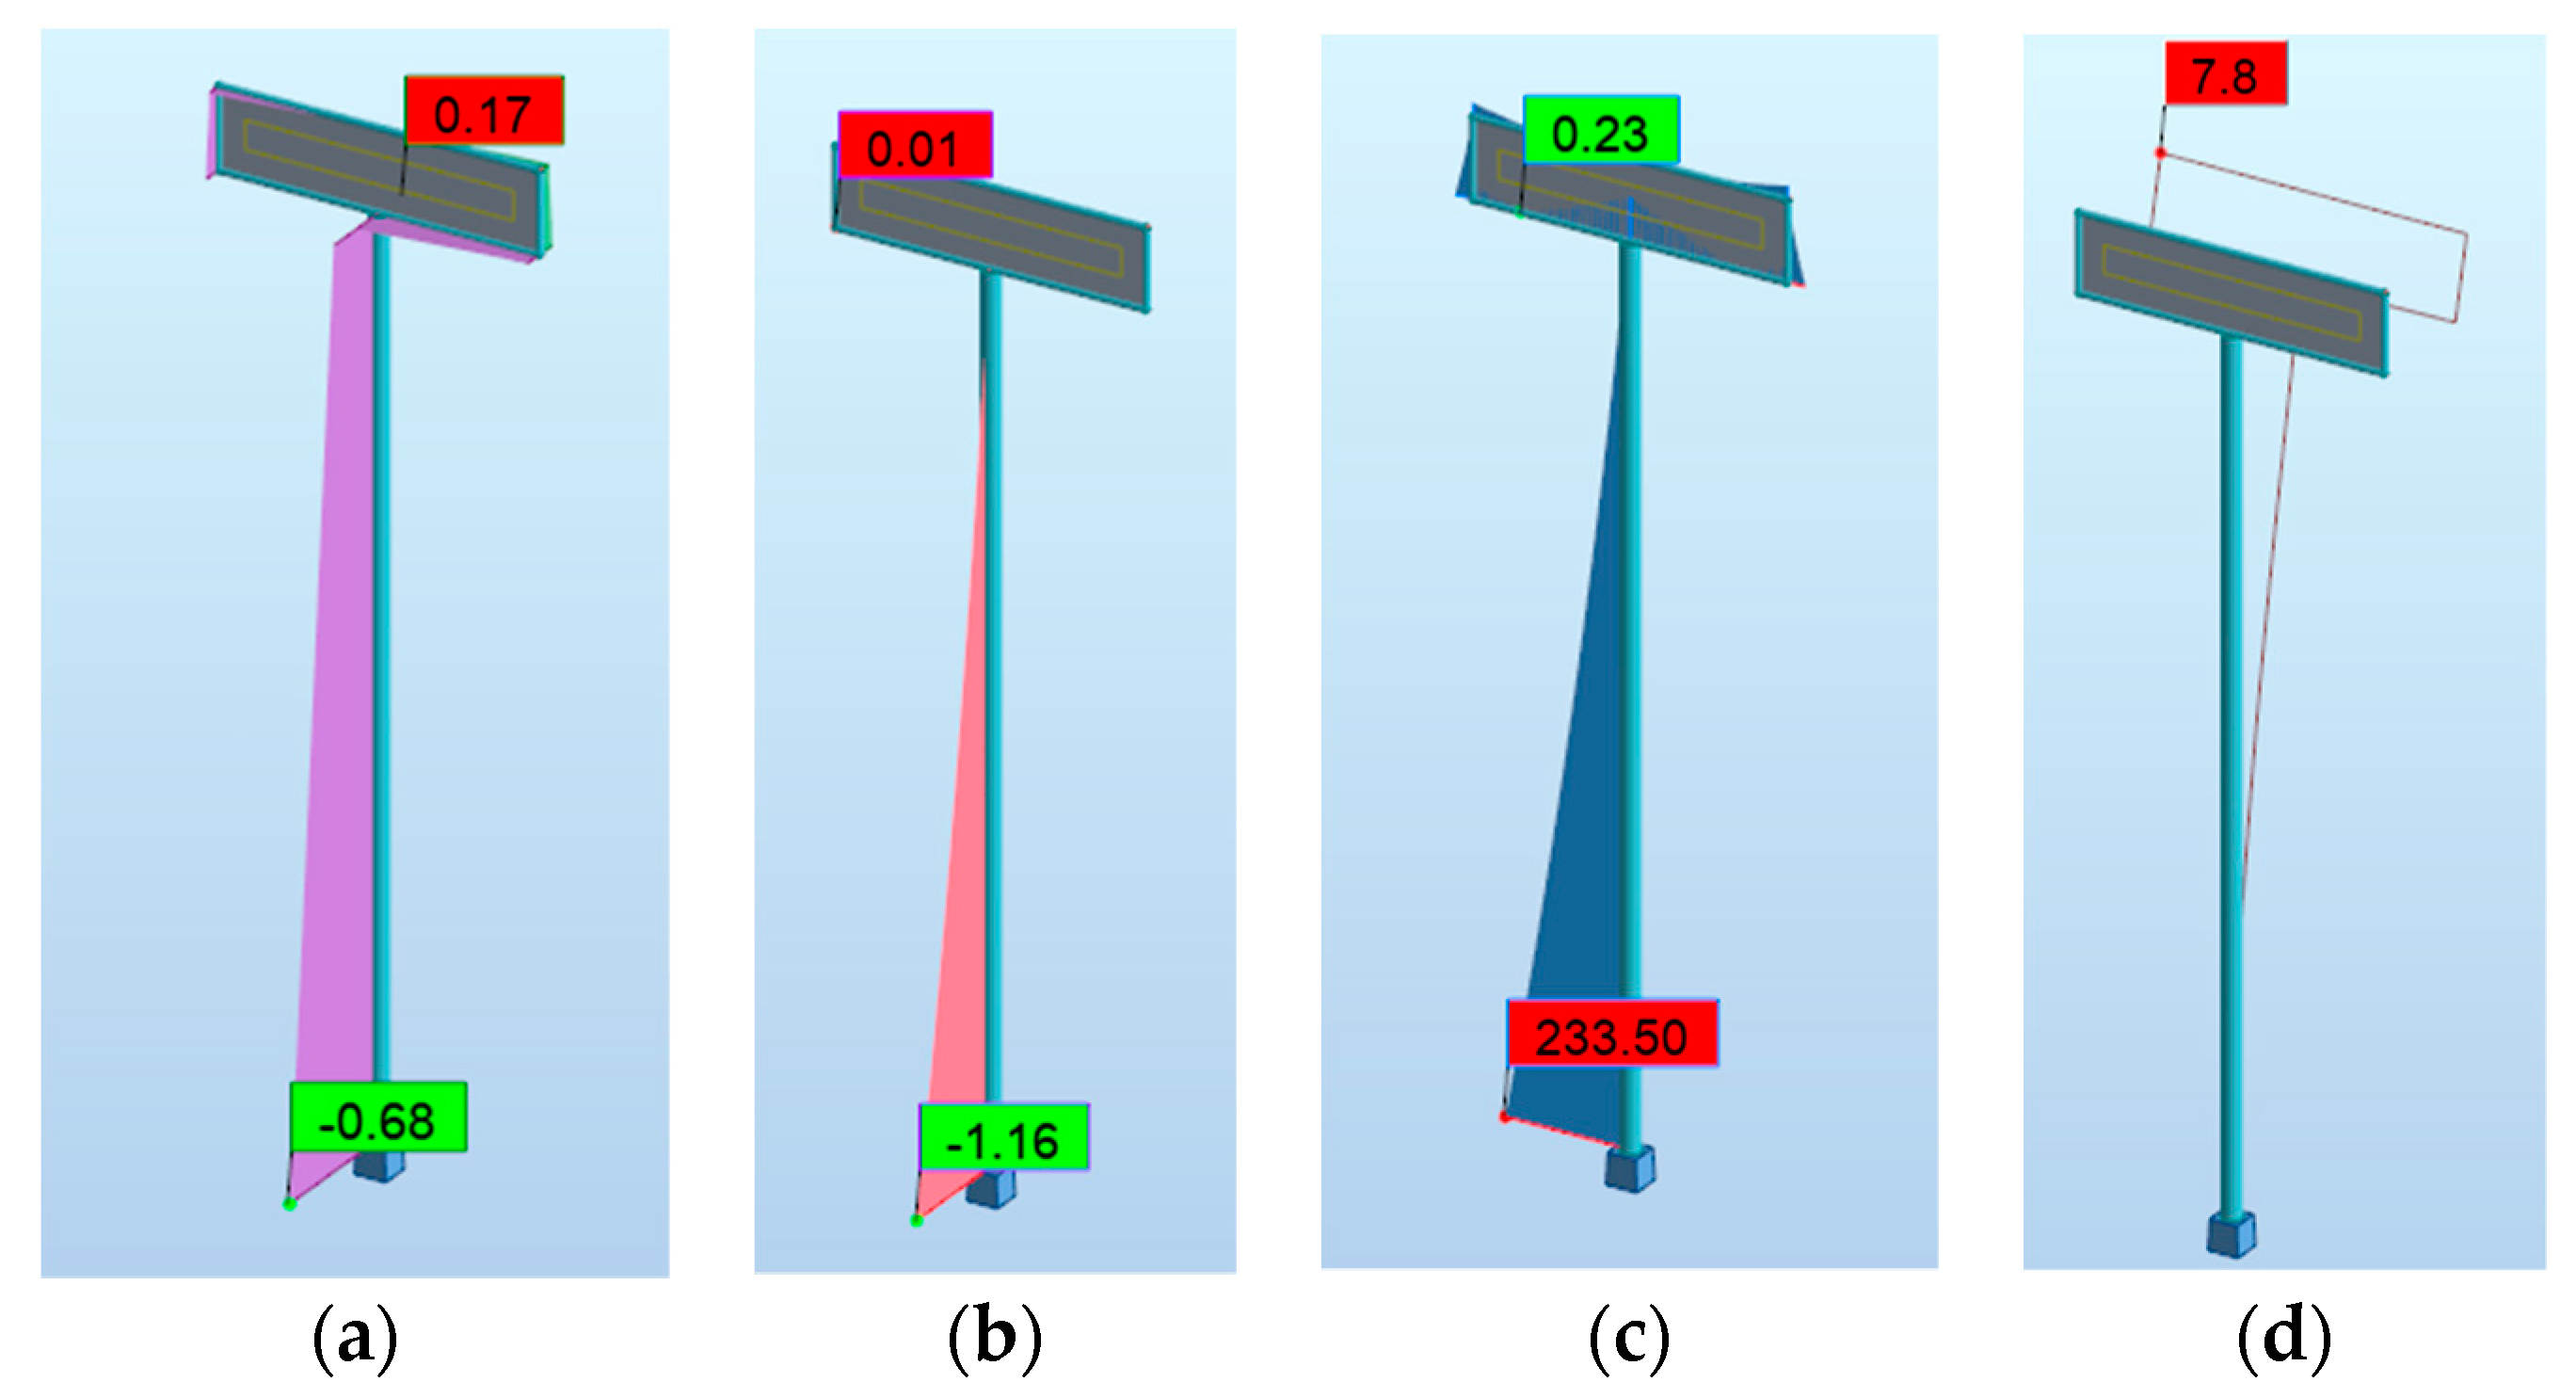
5.2.2. Analysis of Internal Forces

The exact values of the internal forces (stresses, bending moments, shear force, and normal force) are presented in Table 5. Three main sub-tables have been prepared, each of which applies to the wind with a different direction of action: W1, W2, W3 (see Section 4.3.1). The data have been divided according to the type of load (permanent load or wind load, which has been divided according to the speed starting from 22 m/s (LWS) to 55.13 (T3)). The summary focuses mainly on stresses (The assumption is to compare the stresses obtained with the bending strength of C24 wood). The highest obtained stress equal to 32.09 MPa was obtained for the speed of 55.14 m/s in the W2 direction, which significantly exceeds the allowable strength of 24 MPa.
According to Section 4.3. (load analysis) we can compare the bending strength with the stresses in the element. For comparison, the value of 24 MPa was adopted as the characteristic strength of wood. From Table 5 it can be observed that the smallest value of wind speed that generates exceeding this value is the speed of 49.44 m/s in the case of wind W2. The stress value achieved is 25.91 MPa, which exceeds the strength by 8%. This supports the assumption that the tornado that destroyed the facility is at the turn of the EF1 and EF2 groups on the extended Fujita scale. Unfortunately, the destructive wind speed cannot yet be unequivocally estimated; thus, further analyses of other structural elements have been carried out to check at what speed they will be destroyed.
Knowing the angle of inclination of the roof and using basic trigonometric formulas, we can convert the internal forces from the rafters to those occurring on the wall plate (Figure 13).
Based on the previous results (tables from Point 6.2), the maximum values of shear forces and normal forces were assumed. These forces have the direction of the vector consistent with the local arrangement of the rafters. Therefore, in order to calculate the vertical force in the anchor, it was necessary to add up the cosine of the shear force with the sine of the normal force.
Substituting into the formula, we obtain loads from permanent loads:
F z = 4.25   k N × cos ( 30 ° ) + 2.59   k N × sin ( 30 ° ) = 4.9756   k N
F x = 4.25   k N × sin ( 30 ° ) + 2.59   k N × cos ( 30 ° ) = 4.368   k N
Substituting into the formula, we obtain wind loads:
F z = 0.37   k N × cos ( 30 ° ) + 0.25   k N × sin ( 30 ° ) = 0.4454   k N
F x = 0.37   k N × sin ( 30 ° ) + 0.25   k N × cos ( 30 ° ) = 0.4015   k N

5.3. Distributed Force Loading Based on Tangential Wind Speed

The force of wind acting on a body can be computed by the following formula:
F w = 1 2 × ρ × S × C D × v w 2
where F w is a wind force, ρ is the air density, S is the area under consideration (projected area), C D is the drag coefficient, and v w is the wind speed.
The assumed area was equal to half of the gable wall and the area of one spacing between the rafters (Figure 14).
A = 1 2 × 12   m × 3.5   m 2 + 0.4   m × 7.0   m = 13.3   m 2
Substituting the values into the formula, we obtain
F w = 1 2 × 1.2   kg m 3 × 13.3   m 2 × 1 × 55.14   m s 2  
We arrive at the value of the force equal to:
F w = 24.26   kN
Based on the obtained force values, the assembly connection was checked.

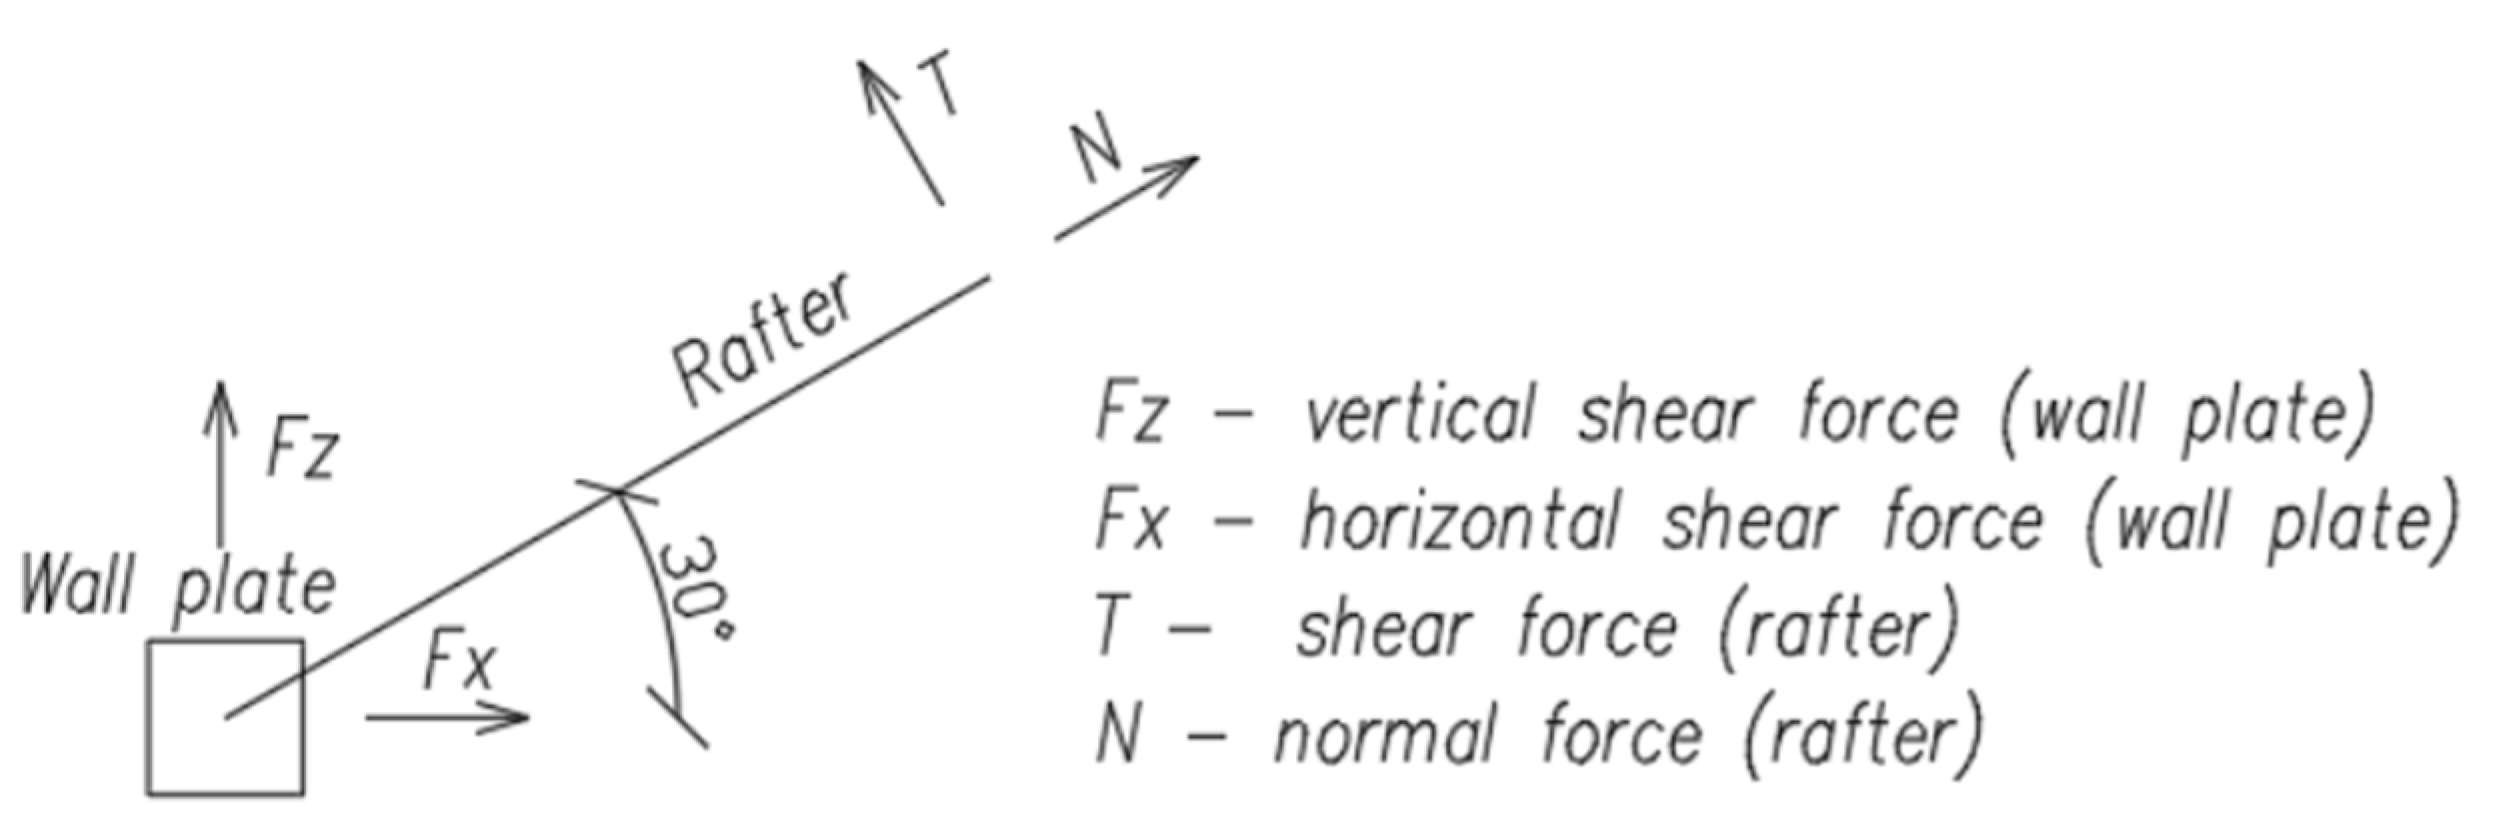
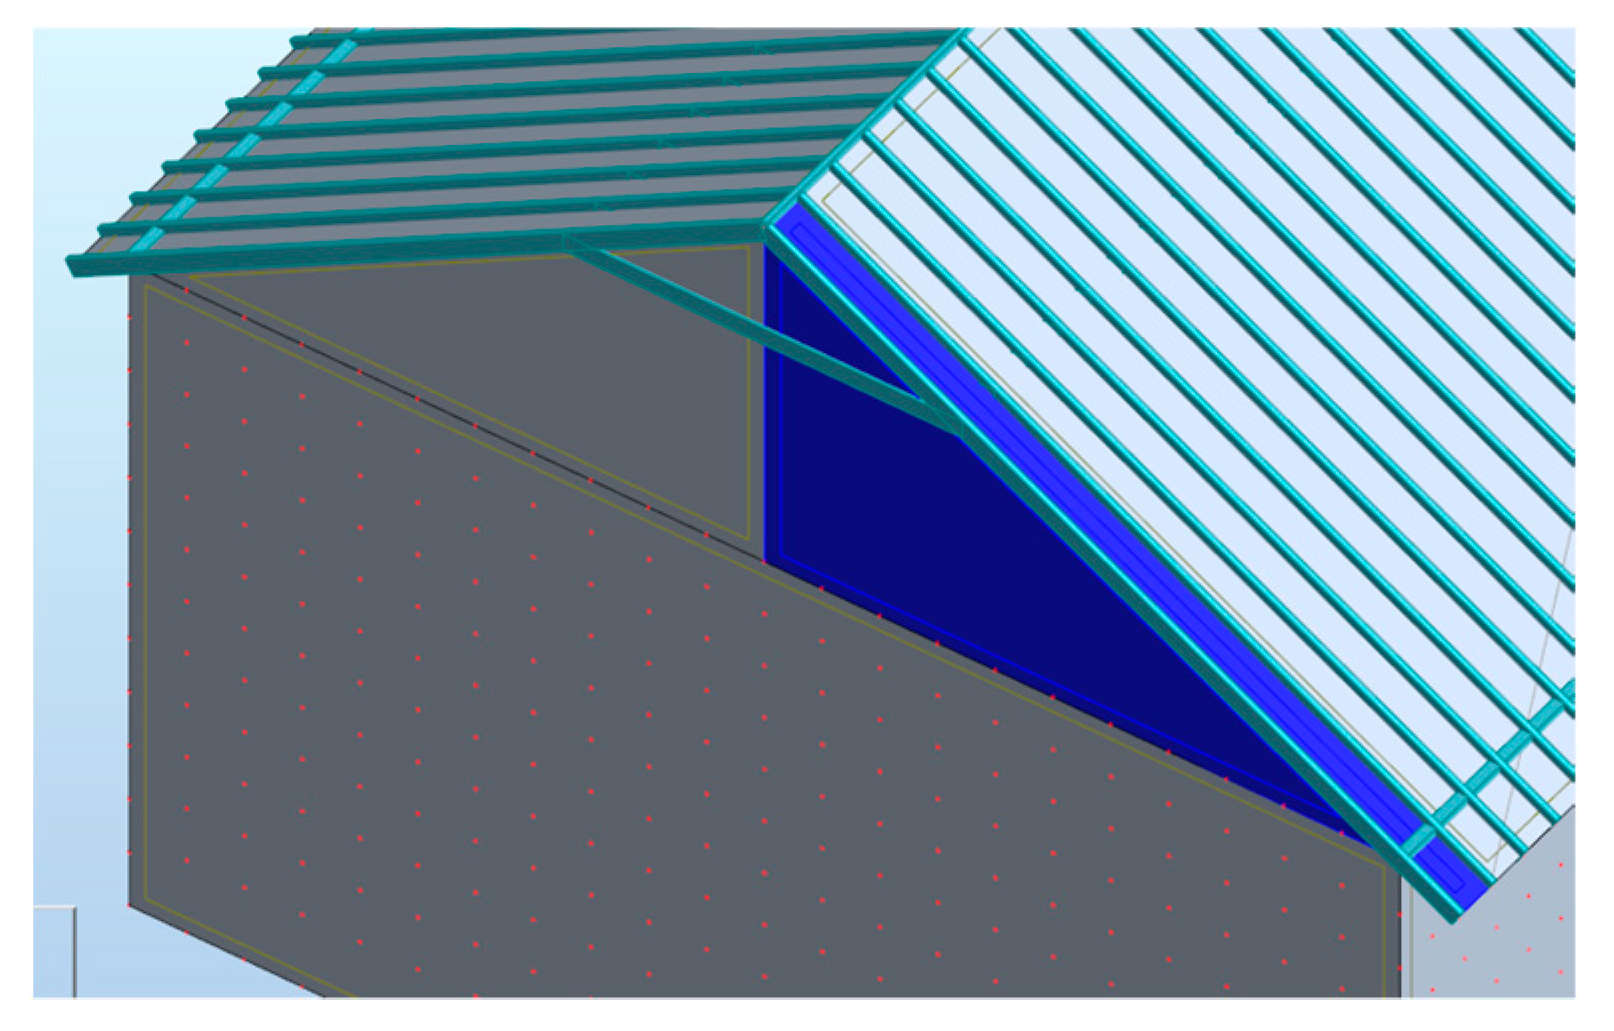
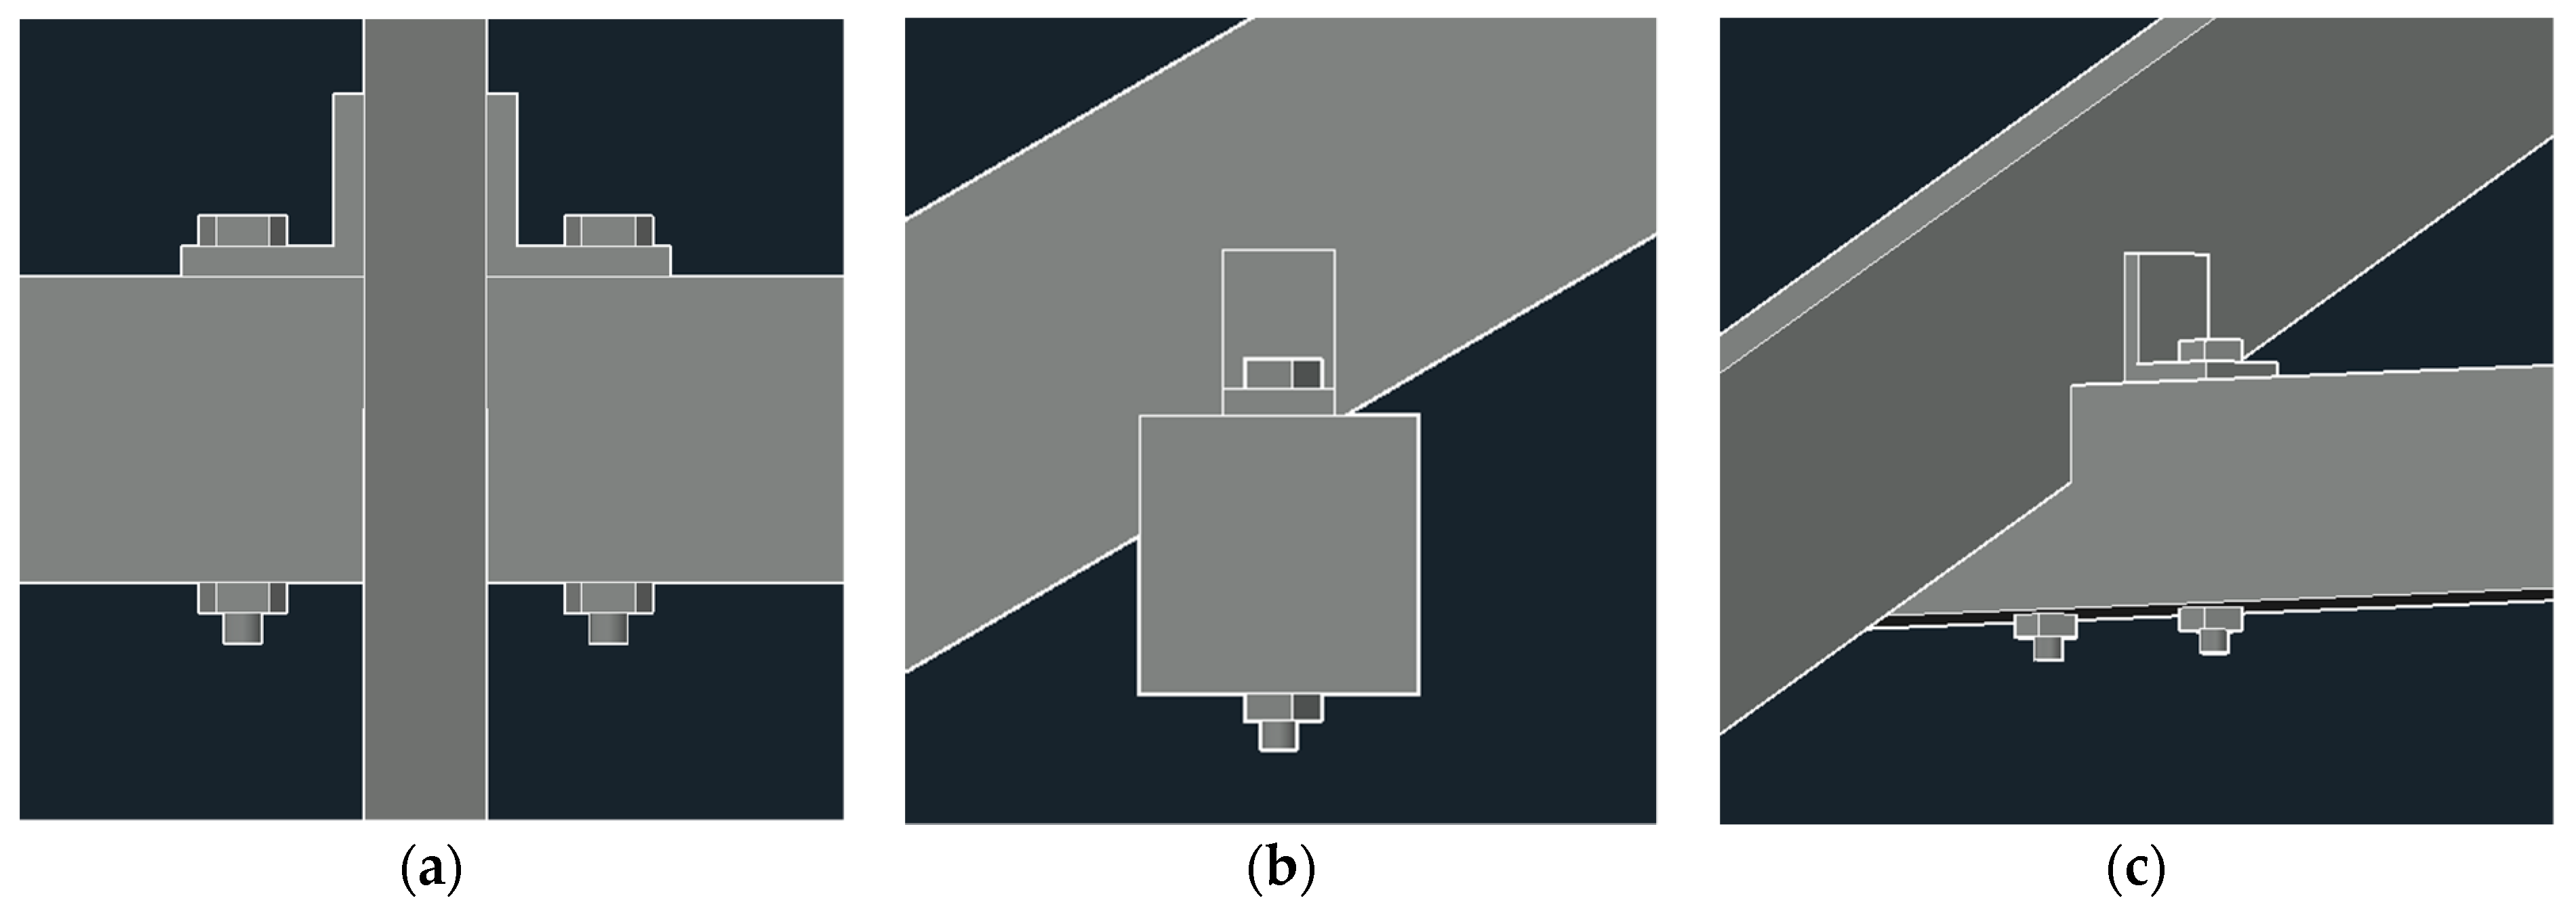
5.4. Anchorage Analysis of the Rafter

The analyzed element of the structure as a potential place of destruction is the assembly connection of the rafters. This is a sensitive place, where damage can occur in several ways. The main ones are cutting the mounting anchor, tearing out the fastening, cutting the wall plate, or cutting the rafter, which is cut out at this point at a maximum of 1/4 of the cross-section height.
The following parameters were assumed: rafters 2 × 6”, wall lath 4 × 4”, anchors 2× ϕ12 with a length of 6”. The connection is by means of metal sheets attached to the rafters, as shown in Figure 15.
At the beginning, the possibility of cutting wooden elements was checked, taking into account the weakening of the profiles.
(a)
Fixing weakened by the anchor hole
The surface area was reduced by 14%, and the shear stresses (arising from the force calculated in Point 6.3) are equal to τ = 2.82   MPa .
(b)
Rafter weakened by shear stresses
The surface area was reduced by 25%, and the shear stresses (arising from the force calculated in Point 6.3) are equal to τ = 4.17   MPa .
Comparing the shear stresses with the characteristic shear strength of f v , k = 4   MPa , it can be concluded that at the maximum allowable cut of the rafters, the cross-section is exposed to shear failure, as shown in the Table 6.
The next element is the anchor connecting both beams.
Based on the forces obtained in Point 6.2, the stresses in the anchor bolt were calculated:
τ = F S = 4.368   kN + 0.401   kN π × ( 12   mm 2 ) 2 = 4.77   kN 1.13   cm 2 = 42.17   MPa
Comparing the stress value with the shear strength of S235 steel, we obtain:
τ k t = 42.17   MPa 0.65 × 120   MPa = 54 %
The calculations show that shearing off the fixing anchor was not the direct cause of the structural failure.

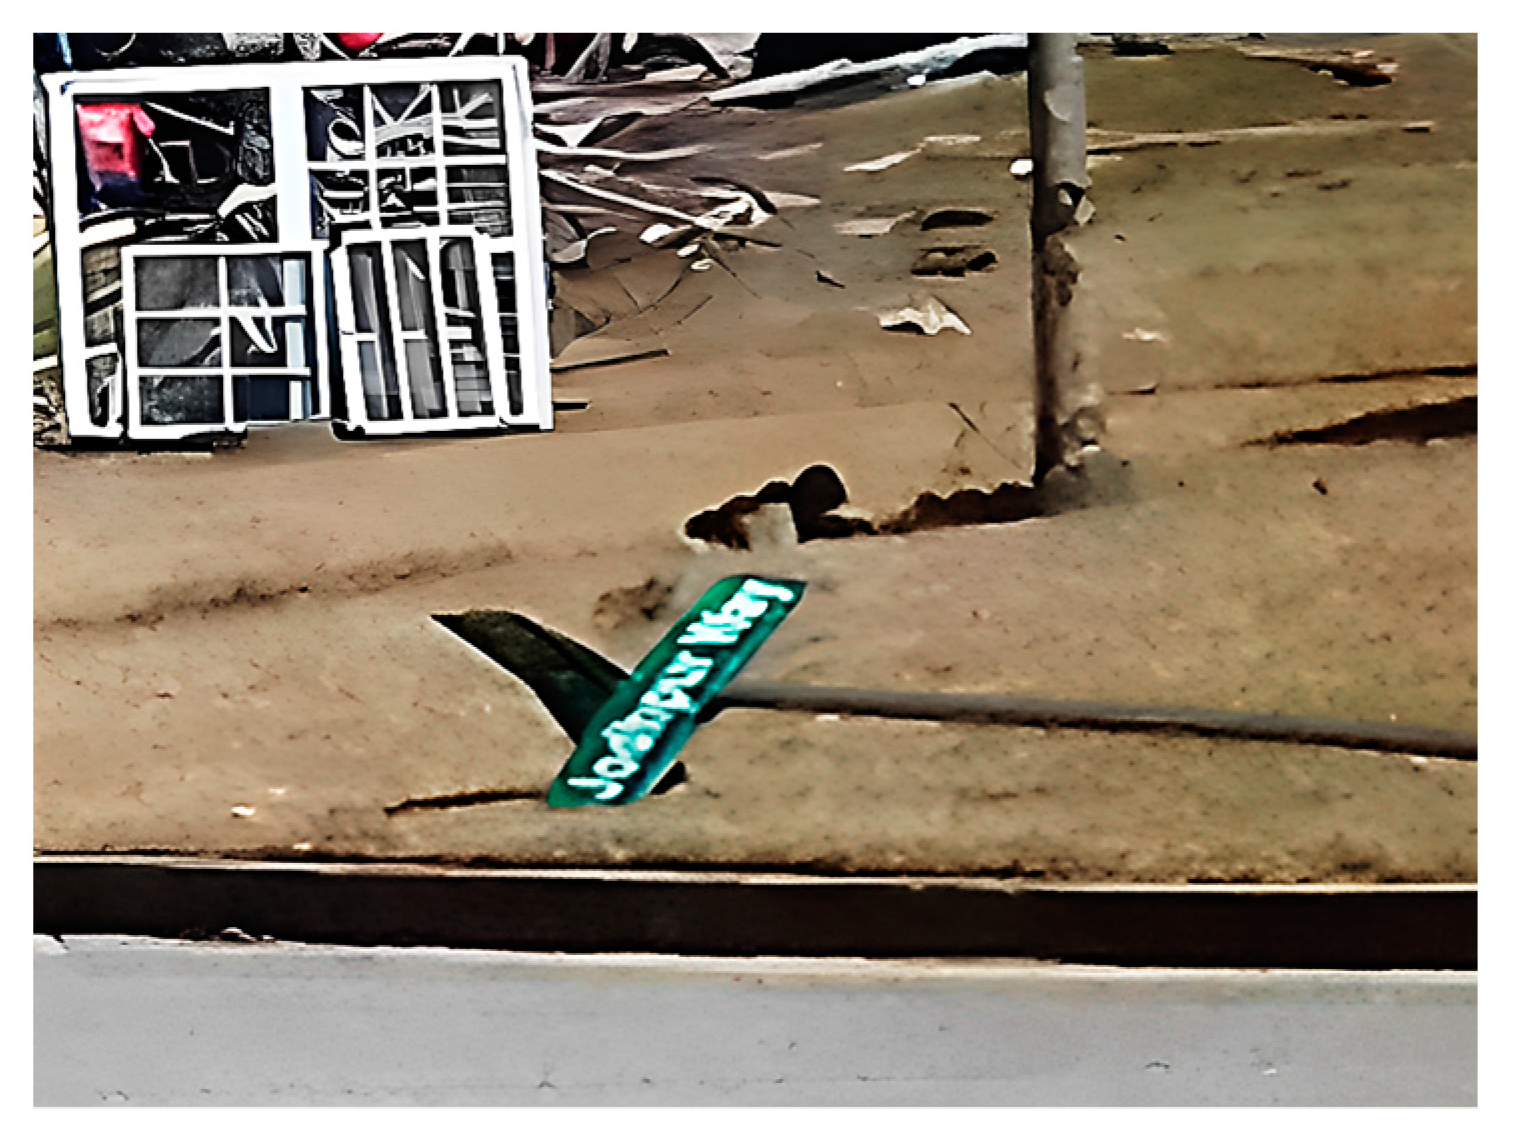
5.5. Wind Speed Analysis Based on a Damaged Road Sign

There were many objects that were also destroyed in the vicinity of the destroyed building., These were primarily cars, trees, letter boxes, and road signs. An example road sign damaged during the 2018 Georgia tornado. has been shown in Figure 16.
The Strength of a Road Sign under Load Caused by a Tornado Was Tested in this Article. The course of the investigation, including the analysis of damage based on research documentation, the creation of a computational model, and the comparison of the values derived from a strong wind with the strength of the material, was carried out in the same way as with the previously analyzed building.
The model of the sign was calculated in the same way as the residential building, and a wind load perpendicular to the surface of the sign was applied. The pressure maps for the analyzed object are shown in Figure 17.
The round pipe RP 51 × 2.9 cm was used for the calculations.
The ensuing results are presented in Figure 18.
The profile was checked in the calculation program for damage caused by exceeding the cross-section load capacity, buckling at a wind speed of 49.58 m/s.
The sum of the quotients of the internal forces to the bearing capacity
N E d N t R d + M y E d M y c , R d + M z E d M z c , R d = 1.00
The results show that with wind gusts reaching a speed of 49.58 m/s, the analyzed structure works at full effort and can be destroyed at any time.

6. Conclusions

The current article presents a case study of the destruction of a single-family home in Georgia in 2018. Using theoretical and numerical models, the wind speed that led to the destruction of the structure was estimated. Various elements of the structure were analyzed as well as an element of the object’s surroundings—a road sign. Using the reversed method of limit states, the strength of structural elements—rafters and wall plates--was analyzed. The connection of these elements was also checked. The obtained results were compared with the assumed load capacity of the elements.
In this article, the numerical model describing the response of the roof structure to the tornado’s horizontal component was validated, and the estimation of the wind speed based on the degree of damage of the building according to the EF scale was performed. The analysis of the ultimate limit state of the rafter to the horizontal beam joint was presented. The low capacity of the joint was the direct cause of the roof’s structure failure. The analysis demonstrates that the stresses were exceeded in the connection of the rafter to the horizontal beam.
Based on the FEM analysis and real results validation, the wind force, locally acting on the roof structure, pulled out the external beams of the roof. The response of the structure corresponded to the EF 2 scale.
Each stage indicates that at the speed of 44.89 m/s (corresponding to the middle of the EF1 interval), the structure was at the limit of load capacity but met the conditions of limit states (ULS and SLS). Some of the elements, especially the rafters, were destroyed (The limit states were exceeded) when the speed increased to 49.44 m/s (The wind above this speed corresponds to Group 2 on the Enhanced Fujita scale), which indicates that the tornado that occurred in Georgia in 2018 can qualify for EF2.
An important aspect that needs to be emphasized is that some structural elements had a large margin of load capacity (e.g., wall plates or anchor bolts), which would indicate that they were overdesigned. To sum up, to properly design any object in a tornado-prone zone, it is necessary to conduct a detailed analysis of each of the structural elements separately. The ideal scenario occurs when all possible elements and their connections have a similar effort, and the calculated limit states are obtained at similar loads.
As tornadoes are becoming more and more frequent in newer and newer areas, they leave behind a series of destruction. Knowing all this, we should recalculate the load capacity of older structures, taking into account wind gusts with higher speeds than those experienced in recent decades.
Each structural failure is an individual case that should be considered in detail by analyzing the most likely critical point of the structure, the destruction of which led to the destabilization of the remaining elements. We also assume that each tornado is different, which means that not the entire analyzed building must be equally loaded by strong wind: e.g., individual rafters may experience greater local overloads, greater force may act on the anchor, and the wind may move objects, generating point loads. Even the best computer programs are still not perfect, so we cannot predict all combinations of the above possibilities.
Rarely is a single-family house perfectly symmetrical with a square-shaped base. Modern forms dominate today: a projection of the base in a polyhedral shape with an extended garage, additional dormers over the entrance or different heights and roof slopes. The high asymmetry of the objects makes it easier to find places sensitive to gust loads. An additional difficulty is the complicated wind flow model.
The presented analysis proves the need for further research modeling the effect of strong winds on structures. Future investigations will concern further application of the wind models to real structure and validation of models based on real tornados.

Author Contributions

Conceptualization, M.D., T.L.; validation, M.D., T.L.; formal analysis, M.D.; investigation, M.D., T.L.; writing—T.L., M.D.; writing—review and editing, M.D.,T.L.; supervision, M.D.; funding acquisition, M.D. All authors have read and agreed to the published version of the manuscript.

Funding

This research received no external funding.

Institutional Review Board Statement

Not applicable.

Informed Consent Statement

Not applicable.

Data Availability Statement

Not applicable.

Conflicts of Interest

The authors declare no conflict of interest.

References

  1. McDonald, J.R.; Mehta, K.C.; Mani, S. A Recommendation for an Enhanced Fujita Scale (EF-Scale), Revision 2. In Wind Science and Engineering; Texas Tech University: Lubbock, TX, USA, 2006; 111p. [Google Scholar]
  2. Fujita Tornado Damage Scale. Available online: https://www.spc.noaa.gov/faq/tornado/f-scale.html (accessed on 30 November 2022).
  3. Enhanced Fujita Scale. Available online: https://en.wikipedia.org/wiki/Enhanced_Fujita_scale (accessed on 30 November 2022).
  4. Fernandes, Y.M.S.; Machado, M.R.; Dutkiewicz, M. The Spectral Approach of Love and Mindlin-Herrmann Theory in the Dynamical Simulations of the Tower-Cable Interactions under the Wind and Rain Loads. Energies 2022, 15, 7725. [Google Scholar] [CrossRef]
  5. Dutkiewicz, M.; Machado, M.R. Spectral Element Analysis of Non-stationary Wind Acting on Overhead Transmission Line. In Acoustics and Vibration of Mechanical Structures—AVMS 2019, Proceedings of the 15th AVMS, Timisoara, Romania, 30–31 May 2019; Springer: Berlin/Heidelberg, Germany, 2019; pp. 463–471. [Google Scholar]
  6. EN 1990: Eurocode 0: Basis of Structural Design (EN 1990). Available online: https://www.phd.eng.br/wp-content/uploads/2015/12/en.1990.2002.pdf (accessed on 30 November 2022).
  7. EN 1991: Eurocode 1: Actions on Structures (EN 1991) Parts 1-1 to 1-7. Available online: https://www.phd.eng.br/wp-content/uploads/2015/12/en.1991.1.1.2002.pdf (accessed on 30 November 2022).
  8. EN 1992: Eurocode 2: Design of Concrete Structures (EN 1992) Parts 1-1 to 1-6. Available online: https://www.phd.eng.br/wp-content/uploads/2015/12/en.1992.1.1.2004.pdf (accessed on 30 November 2022).
  9. EN 1995: Eurocode 5: Design of Timber Structures (EN 1992) Parts 1-1 to 1-2. Available online: https://www.phd.eng.br/wp-content/uploads/2015/12/en.1995.1.1.2004.pdf (accessed on 30 November 2022).
  10. Davies-Jones, R.P.; Wood, V.T. Simulated Doppler velocity signature of evolving tornado-like vortices. J. Atmos. Ocean. Technol. 2006, 23, 1029–1048. [Google Scholar] [CrossRef]
  11. Lewellen, W.S. Tornado vortex theory, the tornado: Its structure, dynamics, prediction, and hazards. In Geophysical Monography; AGU: Washington, DC, USA, 1993; pp. 19–39. volume 79. [Google Scholar]
  12. Alexander, C.R.; Wurman, J.M. Updated mobile radar climatology of supercell tornado structures and dynamics. In Proceedings of the 24th Conference on Severe Local Storms, Savannah, GA, USA, 27–31 October 2008. [Google Scholar]
  13. Karstens, C.D.; Samaras, T.M.; Lee, B.D.; Gallus, W.A.; Finley, C.A. Near-ground pressure and wind measurements in tornadoes. Mon. Weather Rev. 2010, 138, 2570–2588. [Google Scholar] [CrossRef] [Green Version]
  14. Burgers, J.M. A mathematical model illustrating the theory of turbulence. Adv. Appl. Mech. 1948, 1, 171–199. [Google Scholar]
  15. Rott, N. On the viscous core of a line vortex. Z. Angew. Math. Phys. ZAMP 1958, 9, 543–553. [Google Scholar] [CrossRef]
  16. Bjerknes, V. The meteorology of the temperate zone and the general atmospheric circulation. Mon. Weather Rev. 1921, 49, 1–3. [Google Scholar] [CrossRef]
  17. Rankine, W.J.M. A Manual of Applied Physics, 10th ed.; Charles Griff and Co.: Pittsburgh, PA, USA, 1882; 663p. [Google Scholar]
  18. Sullivan, R.D. A two-cell vortex solution of the navier-stokes equations. J. Aerosp. Sci. 1959, 26, 767–768. [Google Scholar] [CrossRef]
  19. Alekseenko, S.V.; Kuibin, P.A.; Okulov, V.L. Theory of Concentrated Vortices; Springer: Berlin/Heidelberg, Germany, 2003. [Google Scholar]
  20. Hayashi, H.; Mitsuta, Y.; Iwatani, Y. Several tatsumakis and their damages in Bousou peninsula on December 11, 1990. J. Wind Eng. 1992, 51, 1–14. [Google Scholar] [CrossRef] [PubMed]
  21. European Severe Weather Database. Available online: https://eswd.eu/ (accessed on 30 November 2022).
  22. NOAA’s National Weather Service. Storm Prediction Center. Available online: https://www.spc.noaa.gov/climo/online/monthly/newm.html (accessed on 30 November 2022).
  23. Tornado Alley. Available online: https://pl.wikipedia.org/wiki/Aleja_Tornad (accessed on 30 November 2022).
Figure 1. Model of tangential velocity.
Applsci 13 04661 g001
Figure 2. Rankine model’s component of radial velocity.
Applsci 13 04661 g002
Figure 3. Bar graphs of the recorded number of tornadoes over the years 2015–2021. (a) in Poland, (b) in other areas of Europe, (c) in the USA [21,22].
Applsci 13 04661 g003
Figure 4. Tornado activity in the USA. Number of recorded EF3, EF4 and EF5 tornadoes per 2470 square miles [23].
Applsci 13 04661 g004
Figure 5. Damages in Fairburn, Georgia, 2018 [Foto made by authors of the article].
Applsci 13 04661 g005
Figure 6. Building’s geometry, (a) roof structure layout, (b) ground floor layout.
Applsci 13 04661 g006
Figure 7. Comparison of the model and building after damage, (a)—computer model, view from the windward side, (b)—structure after damage, view from the windward side, (c) computer model, view from the leeward side (d) structure after damage, view from the leeward side. [Foto made by authors of the article].
Applsci 13 04661 g007
Figure 8. Roof truss construction. Numbering of roof bar elements.
Applsci 13 04661 g008
Figure 9. Directions of wind action assumed in the numerical analysis: (a) east—W1, (b) north-east—W2, (c) south-east—W3.
Applsci 13 04661 g009
Figure 10. Pressure maps for case LWS, (a) for the W1 direction, (b) for the W2 direction, (c) for the W3 direction.
Applsci 13 04661 g010
Figure 11. Diagram of internal forces (shear force, bending moment, stresses) for the extreme structure resulting from the acting of dead load and gusts of wind. (a) shear force from dead load, (b) shear force from gusts of wind, (c) bending moment from dead load, (d) bending moment from gusts of wind, (e) stresses from dead load, (f) stresses from gusts of wind.
Applsci 13 04661 g011
Figure 12. Deformation of the roof structure: (a) the entire roof structure, andthe most loaded pair of rafters ((b)—W1, (c)—W2, (d)—W3).
Applsci 13 04661 g012
Figure 13. Comparison of the internal forces of the rafters (T, N) and those occurring in the wall plate ( F z ,   F x ).
Applsci 13 04661 g013
Figure 14. Area of projected area.
Applsci 13 04661 g014
Figure 15. Scheme of rafter support on the wall: (a) front view, (b) side view, (c) 3D view.
Applsci 13 04661 g015
Figure 16. Analyzed road sign. Photo taken after destruction [Foto made by authors of the article].
Applsci 13 04661 g016
Figure 17. Model created in the calculation program. Maps of the pressure resulting from the applied wind load (a) front, (b) back.
Applsci 13 04661 g017
Figure 18. Obtained results of internal forces: (a) shear force, (b) bending moments, (c) stresses and (d) deflections.
Applsci 13 04661 g018
Table 1. Enhanced Fujita Scale [2,3].
CategoryWind Speed
[km/h]
Frequency of Appearance [%]Description of the Damage
EF0105 to 13738.9Damage to the roofs of houses, uprooted small trees and bushes
EF1138 to 17835.6Broken roofs, overturned and destroyed caravans
EF2179 to 21819.4Broken roofs made of solid structures, large trees uprooted, light cars lifted from the ground
EF3219 to 2664.9Entire floors of solid houses destroyed, damage to large buildings, derailed trains, heavier cars lifted from the ground
EF4267 o 3221.1Solid houses razed to the ground, cars thrown into the air
EF5Above 322Below 0.1Houses with a very strong frame razed to the ground foundations, cars moved over distances of up to 100 m, skyscrapers with deformed structures
Table 2. The number of recorded tornadoes in Poland, other areas of Europe, and the USA in 2015-2021 [21,22].
YearPolandEuropeUSA
201545731178
201611848976
2017209171418
2018127681123
2019227971571
2020158211075
2021339061379
Table 3. Characteristic strength values of softwood [9].
ParameterSymbolUnitC14C16C18C20C22C24
Bendingfm,kMPa141618202224
Stretching along the fibersft,0,k81011121314
Stretching across the fibersft,90,k0.4
Compression along the fibersfc,0,k161718192021
Compression across the fibersfc,90,k2.02.22.22.32.42.5
Shear (no cracks)fv,k3.03.23.43.63.84.0
Table 4. Tabular list of displacement values for winds W1, W2, W3.
LoadW1W2W3
TypeValueDeflectionDeflectionDeflection
[kN/m2][km/h][m/s][mm][mm][mm]
Dead load—Roof covering0.48--0.10.10.1
Wind LWS-79.222.001.41.31.1
Wind T1-158.044.895.65.64.3
Wind T2-178.049.446.86.94.8
Wind T3-198.555.148.38.55.9
Table 5. Tables presenting the list of maximum internal forces (stresses, bending moments, shear force, normal force) and deflection at different wind directions and speeds.
Wind Direction—W1
LoadStressesBending MomentShear ForceNormal Force
TypeValue
[kN/m2][km/h][m/s][kPa][kNm][kN][kN]
Dead load—Roof covering0.48--1.490.140.370.25
Wind LWS-79.222.004.050.440.540.11
Wind T1-158.044.8916.481.862.310.46
Wind T2-178.049.4420.132.292.840.57
Wind T3-198.555.1424.812.823.510.7
Wind direction—W2
LoadStressesBending MomentShear ForceNormal Force
TypeValue
[kN/m2][km/h][m/s][kPa][kNm][kN][kN]
Dead load—Roof covering0.48--1.490.140.370.25
Wind LWS-79.222.004.870.530.650.4
Wind T1-158.044.8921.252.312.821.73
Wind T2-178.049.4425.912.813.432.11
Wind T3-198.555.1432.093.494.252.59
Wind direction—W3
LoadStressesBending MomentShear ForceNormal Force
TypeValue
[kN/m2][km/h][m/s][kPa][kNm][kN][kN]
Dead load—Roof covering0.48--1.490.140.370.25
Wind LWS-79.222.002.070.310.40.21
Wind T1-158.044.899.031.311.680.91
Wind T2-178.049.4414.442.092.661.47
Wind T3-198.555.1417.652.553.261.8
Table 6. Bearing capacity due to shear force.
ElementStressShear StrengthBearing Capacity
[MPa][MPa][%]
Fixing2.82471%
Rafter4.174104%
Disclaimer/Publisher’s Note: The statements, opinions and data contained in all publications are solely those of the individual author(s) and contributor(s) and not of MDPI and/or the editor(s). MDPI and/or the editor(s) disclaim responsibility for any injury to people or property resulting from any ideas, methods, instructions or products referred to in the content.

