Article

Analysis of Fire Resistance of Prestressed Concrete T-Beam Based on ABAQUS Numerical Simulation

College of Civil Engineering, Changsha University of Science and Technology, Changsha 410114, China
*
Author to whom correspondence should be addressed.
Appl. Sci. 2023, 13(8), 4683; https://doi.org/10.3390/app13084683
Submission received: 14 February 2023 / Revised: 26 March 2023 / Accepted: 4 April 2023 / Published: 7 April 2023

Abstract

:
The analytical fire resistance calculations were carried out on 57 prestressed concrete T-beam models using the finite element software ABAQUS. The effects of different fire modes, different concrete strengths, different flange plate thicknesses, different ratios of the prestressing bar, and different concrete protection layer thicknesses were investigated in three cases with load ratios of n = 0.4, n = 0.6, and n = 0.8. The fire resistance of prestressed concrete T-beams shows a large variability under different fire modes. The fire mode significantly affects the fire resistance of the structure and should be given more consideration in the subsequent fire resistance design of the structure. The configuration of prestressing bars will significantly increase the fire resistance of concrete T-beams, while the thickness of the concrete protective layer and the concrete strength will significantly affect the fire resistance of prestressed concrete T-beams. Therefore, the fire resistance can be improved by adding prestressing bars, increasing the concrete strength, and increasing the thickness of the protective layer in the design. Finally, a fitting equation for fire resistance of the prestressed concrete T-beams based on the finite element model calculation data was created. The equation has good prediction accuracy and can provide a reference for the fire resistance design of prestressed concrete T-beams.

1. Introduction

Compared with concrete beams, prestressed concrete T-beams have the advantages of good performance, light structure weight, simple and fast construction, and strong structural ductility and seismic performance [1]. Recently, they have been used in many high-rise buildings and large-span bridge projects, such as the comprehensive training hall of Hainan Provincial Sports Center, Chengdu Fuhe Bridge, and Zhuzhou Baimarang Viaduct. However, in the face of high fire temperatures, the concrete’s mechanical properties will degrade for concrete structures. The heat generated by the fire will be transferred from the outside of the concrete to the internal steel and prestressed steel bundles, which will lead to further damage, resulting in the direct failure of the structure after the fire [2]. For prestressed concrete T-beams, especially, because the flange plates and web walls of T-section beams are thin, they are more prone to structural instability and hence instantaneous damage under the high temperature of fire [3]. Therefore, it is necessary to carry out a study on the fire resistance of prestressed concrete T-beams.
In recent decades, scholars have begun to pay more attention to the fire resistance of structures, and the current research mainly focuses on reinforced concrete beams. Han et al. [4] carried out a fire resistance test research of four reinforced concrete beams under the ISO 834 standard heating curve and analyzed the change in the fire resistance of reinforced concrete beams at different load levels, pointing out that increasing the load level resulted in a significant reduction in the fire resistance of reinforced concrete beams and a substantial increase in the residual deformation in the span when the fire resistance was reached. Wang et al. [5] used finite element simulation to analyze the internal temperature field of reinforced concrete beams during a fire to determine its distribution pattern at different moments of fire resistance. In the heating section, the temperature field of continuous beam sections showed a laminar distribution pattern of high external temperature and low internal temperature. In the cooling section, the temperature field showed a circle distribution pattern of low external and high internal temperatures. Kodur et al. [6] proposed a method to assess the fire resistance of reinforced concrete beams by investigating the different parameters influencing the fire resistance of reinforced concrete beams, pointing out that fire conditions can significantly affect the fire resistance of reinforced concrete. Liu et al. [7] carried out a comparative study of the flexural properties of reinforced concrete beams at room temperature and after the fire. Two reinforced concrete beams were subjected to static load tests at room temperature, and three reinforced concrete beams were subjected to fire for 30 min, 60 min, and 90 min, according to the ISO 834 heating curve, and then naturally cooled to room temperature before being subjected to static load tests. The study showed that the flexural properties of the reinforced concrete beams decreased parabolically with increasing fire time. The results of the temperature field of the elevated section and the post-fire flexural properties obtained by finite element simulation are in good agreement with the experimental results. They can be used to research and analyze reinforced concrete beams after the fire. Although research on the fire resistance of reinforced concrete beams is relatively well established, the fire resistance of prestressed concrete beams exhibits significant differences from that of reinforced concrete beams due to the incorporation of prestressing bars [8]. Therefore, research on the fire resistance of prestressed concrete beams needs to be initiated.
Some scholars have researched the fire resistance of prestressed concrete structures, but at present, it is mainly concerning prestressed concrete rectangular beams. Wang et al. [9] carried out an experimental study on the force performance of 26 prestressed concrete beams at high temperatures, and explored the effects of load level, concrete protective layer thickness, and ratio of prestressing bar on their fire resistance performance at high temperatures. They then carried out static tests after high temperature exposure, comparing and analyzing the residual load bearing capacity of prestressed concrete beams, and proposed a simplified calculation method for the residual load bearing capacity of prestressed concrete flexural members after high temperature exposure. Zhang et al. [10] designed prestressed concrete beams with different cross-sectional forms, including T-sections, and carried out fire resistance tests under simulated fire heating conditions. It was found that the cross-sectional form has an important influence on the fire resistance performance, and for the structure’s safety, the fire resistance design needs to be carried out for different cross-sectional forms of prestressed concrete beams. Yan et al. [11] found that the fire resistance design code for concrete beams was not applicable to the fire resistance design of prestressed concrete beams by carrying out a full-scale simulation analysis of eight prestressed concrete beams with different prestressing levels and that a method for assessing the fire resistance of prestressed concrete beams needed to be established. Yu et al. [12] conducted fire resistance tests on prestressed concrete beams under different prestress levels and concluded that the prestress level affects the failure mode, and thus exhibits different fire resistance properties.
Few studies have been carried out on the influencing parameters in the fire resistance of prestressed concrete structures, while the form of the cross-section has an important influence on the fire resistance. The T-section is widely used in existing prestressed concrete beams, and attention needs to be paid to the fire resistance of prestressed concrete T-beams. Therefore, ABAQUS finite element software is used to investigate the fire resistance of prestressed concrete T-beams under different conditions. This is to investigate the influence of fire mode, concrete strength, flange plate thickness, ratio of prestressing bar, concrete protective layer thickness, and load rate for the fire resistance, and to propose a calculation formula applicable to the fire resistance of prestressed concrete T-beams, which will provide a reference for subsequent fire resistance design and post-fire repair and strengthening.

2. Finite Element Model Building and Verification

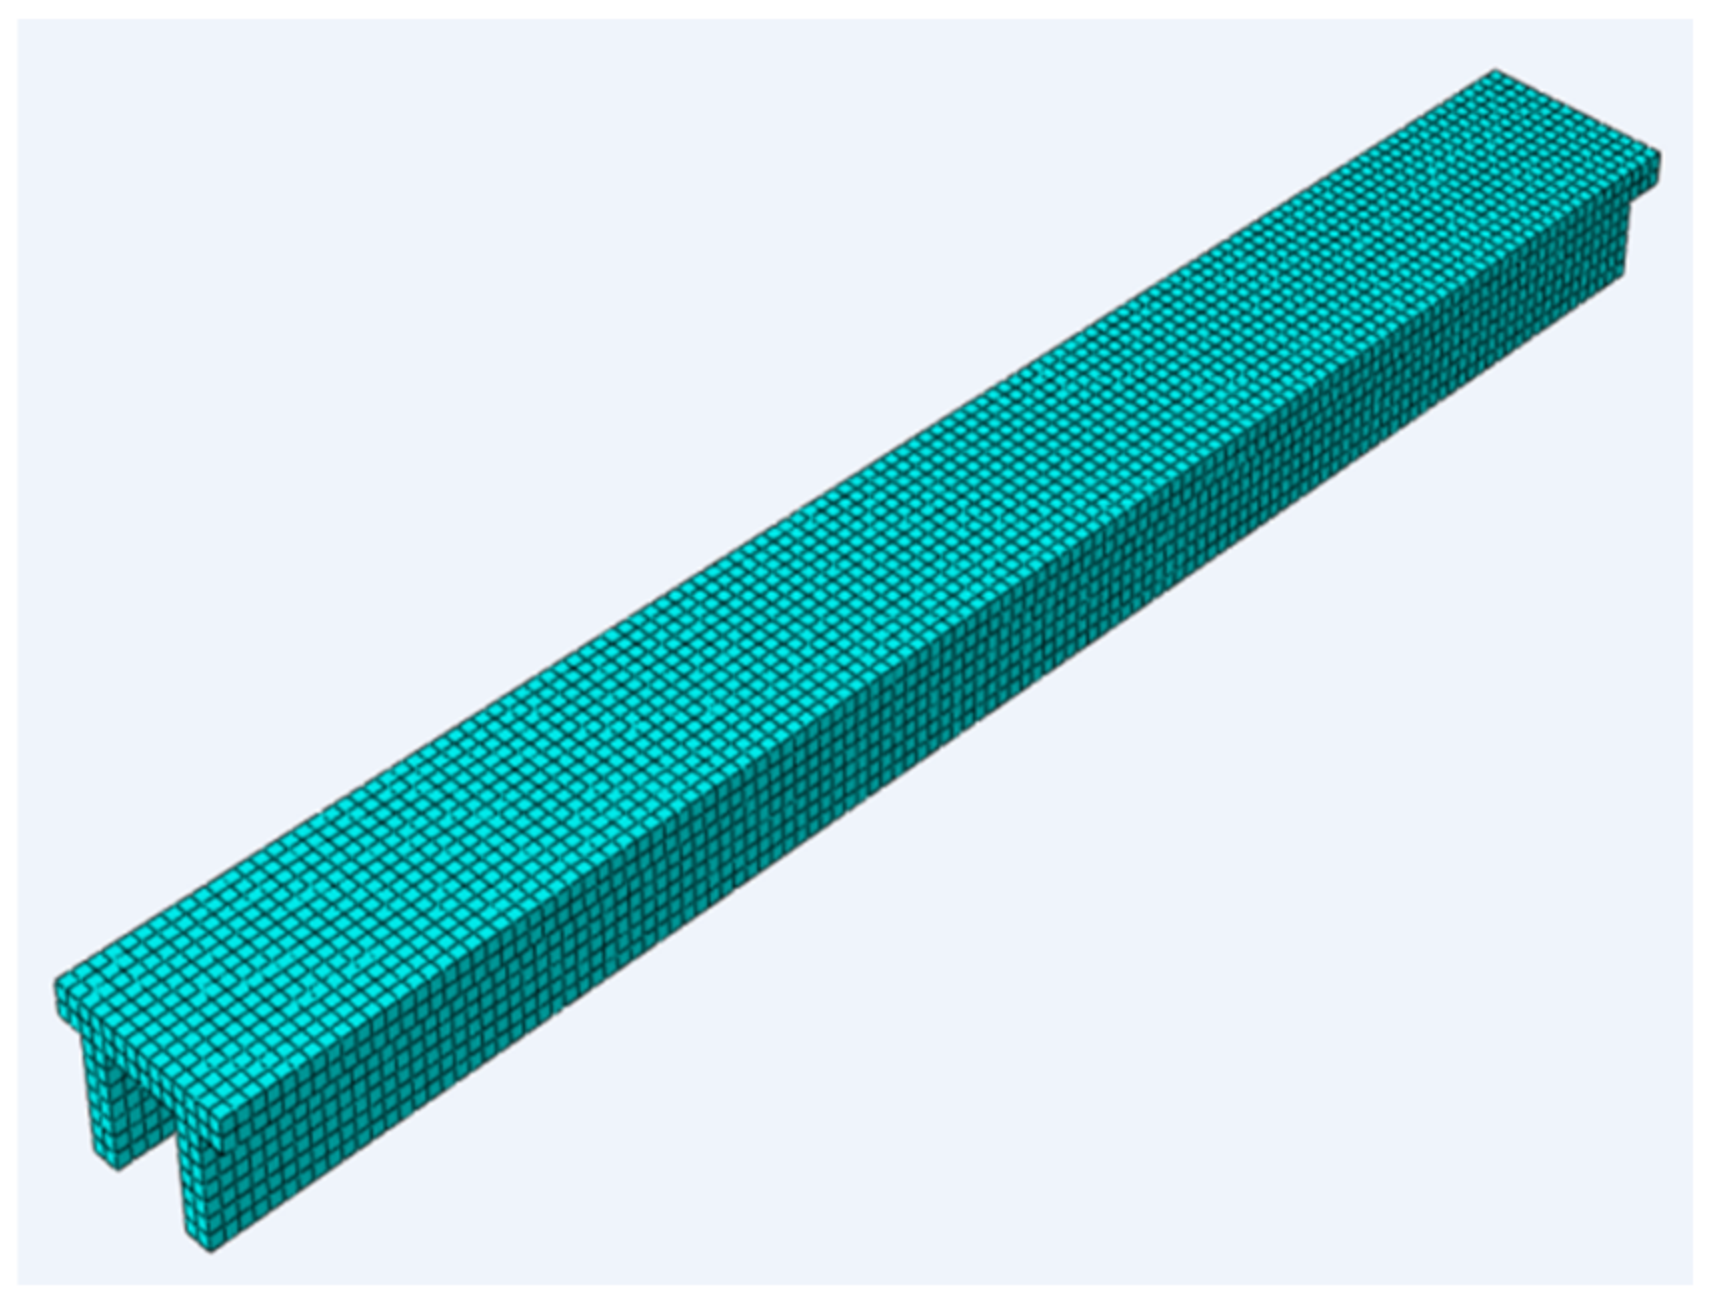
2.1. Finite Element Model and Simulation

This study includes the simulation and analysis of prestressed concrete T-beam fire resistance using finite element software ABAQUS. The finite element model reference is from the fire resistance test in the literature [10], and the model dimensions and finite element model are shown in Figure 1 and Figure 2. The method of model calculation is heat transfer analysis and thermal-force coupling analysis: first, the temperature field of a prestressed concrete T-beam is solved in the heat transfer analysis step according to ISO-834 international standard temperature rise curve. Then, the temperature field analysis results obtained in the heat transfer analysis step are imported into the calculation model of fire resistance analysis as predefined fields, and then the thermal-force coupling analysis is performed on the model. Finally, the fire resistance of the model is obtained. The temperature field calculation model and the calculation model of fire resistance analysis in the finite element simulation calculations are described in detail below.

2.1.1. Temperature Field Calculation Model

In the temperature field model, the international standard ISO-834 warming curve is used to warm the fire surface of the prestressed concrete T-beam, setting the initial ambient temperature at 20 °C. The material properties of the components will change with temperature. The thermal parameters of concrete in this paper are shown in Table 1, and those of steel in Table 2. Since the heat of the fire will be transferred through both forms of heat convection and heat radiation, the heat convection exchange coefficient and the integrated radiation coefficient of the fire surface in the prestressed concrete T-beam model are defined as 40 W/(m2 × k) and 0.5, respectively, and the heat convection exchange coefficient and the integrated radiation coefficient of the non-fire surface in the prestressed concrete T-beam model are defined as 20 W/(m2 × k) and 0.7, the Stefan–Boltzmann radiation constant δ = 5.67 × 10⁻⁸ W/(m2 × k4). In this paper, complete contact between concrete and steel is achieved by means of an embedded restraint method, in which the steel is embedded into the concrete, ensuring effective heat transfer between concrete and steel.
In this case, a heat transfer connection cell (DC1D2) with a grid size of 20 mm is used for steel, and a solid thermal analysis cell (DC3D8) with a grid size of 20 mm is used for concrete. The reduced temperature method for the simulation of prestressing bars in beams was used.

2.1.2. Calculation Model of Fire Resistance Analysis

For the fire resistance analysis of prestressed concrete T-beams, finite element simulations were carried out using the sequential thermal-force coupling analysis method. On the basis of the completed temperature field model, the static analysis was carried out, and the mesh size was kept consistent with that of the temperature field model for the accuracy of the temperature of the cells in the static analysis model. The mechanical properties of the component materials will deteriorate under the action of high temperatures; domestic and foreign scholars have conducted much experimental research on these materials. The high-temperature mechanical properties of concrete in this paper are shown in Table 3, the high-temperature mechanical properties of steel are shown in Table 4, and the high-temperature mechanical properties of the prestressing bar are shown in Table 5.
In this paper, the prestressed concrete T-beam is simply supported; its left-end boundary condition is displacement constrained in the x, y, z direction and it can only be rotated around the x-axis, and the right-end boundary condition is displacement constrained in the x, y direction, and it can be rotated around the x-axis. C3D8R eight-node linear hexahedral units were selected for concrete, and T3D2 two-node linear 3D truss units were selected for steel. The reduced temperature method for the simulation of prestressing bars in beams was used.

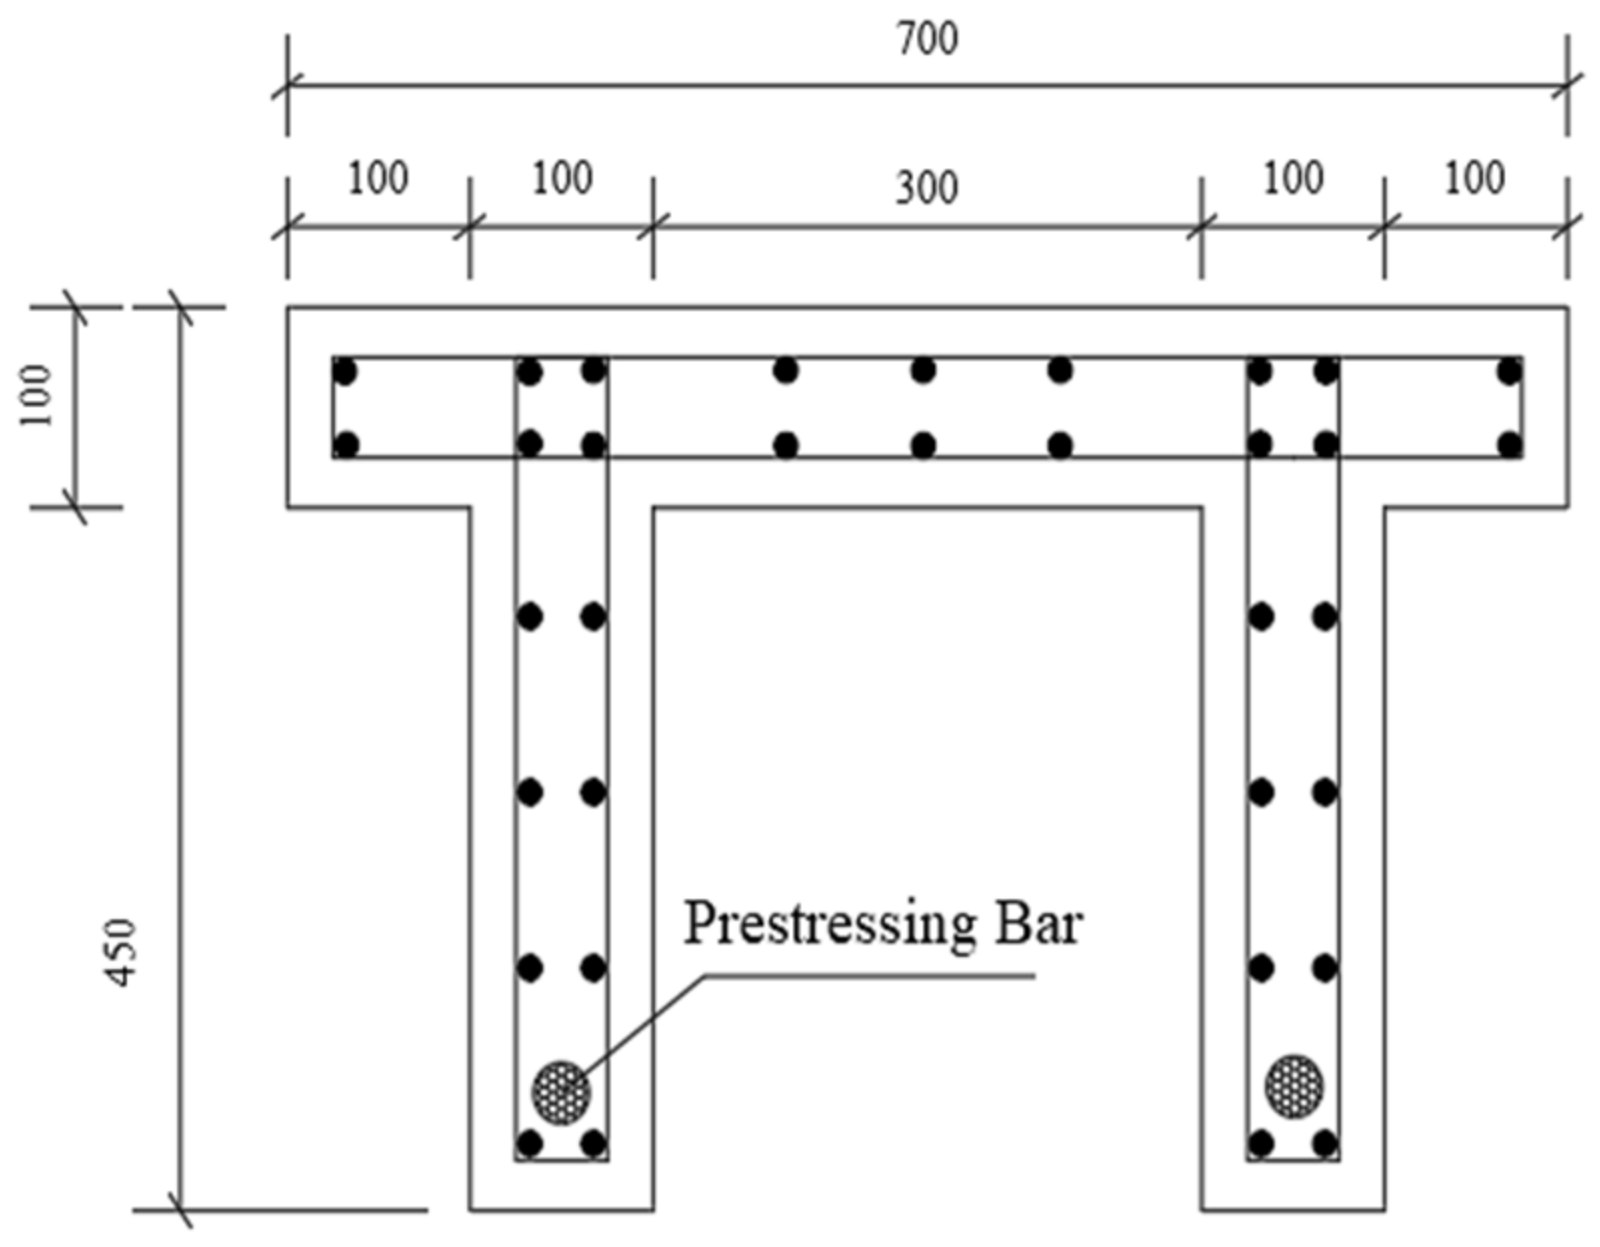
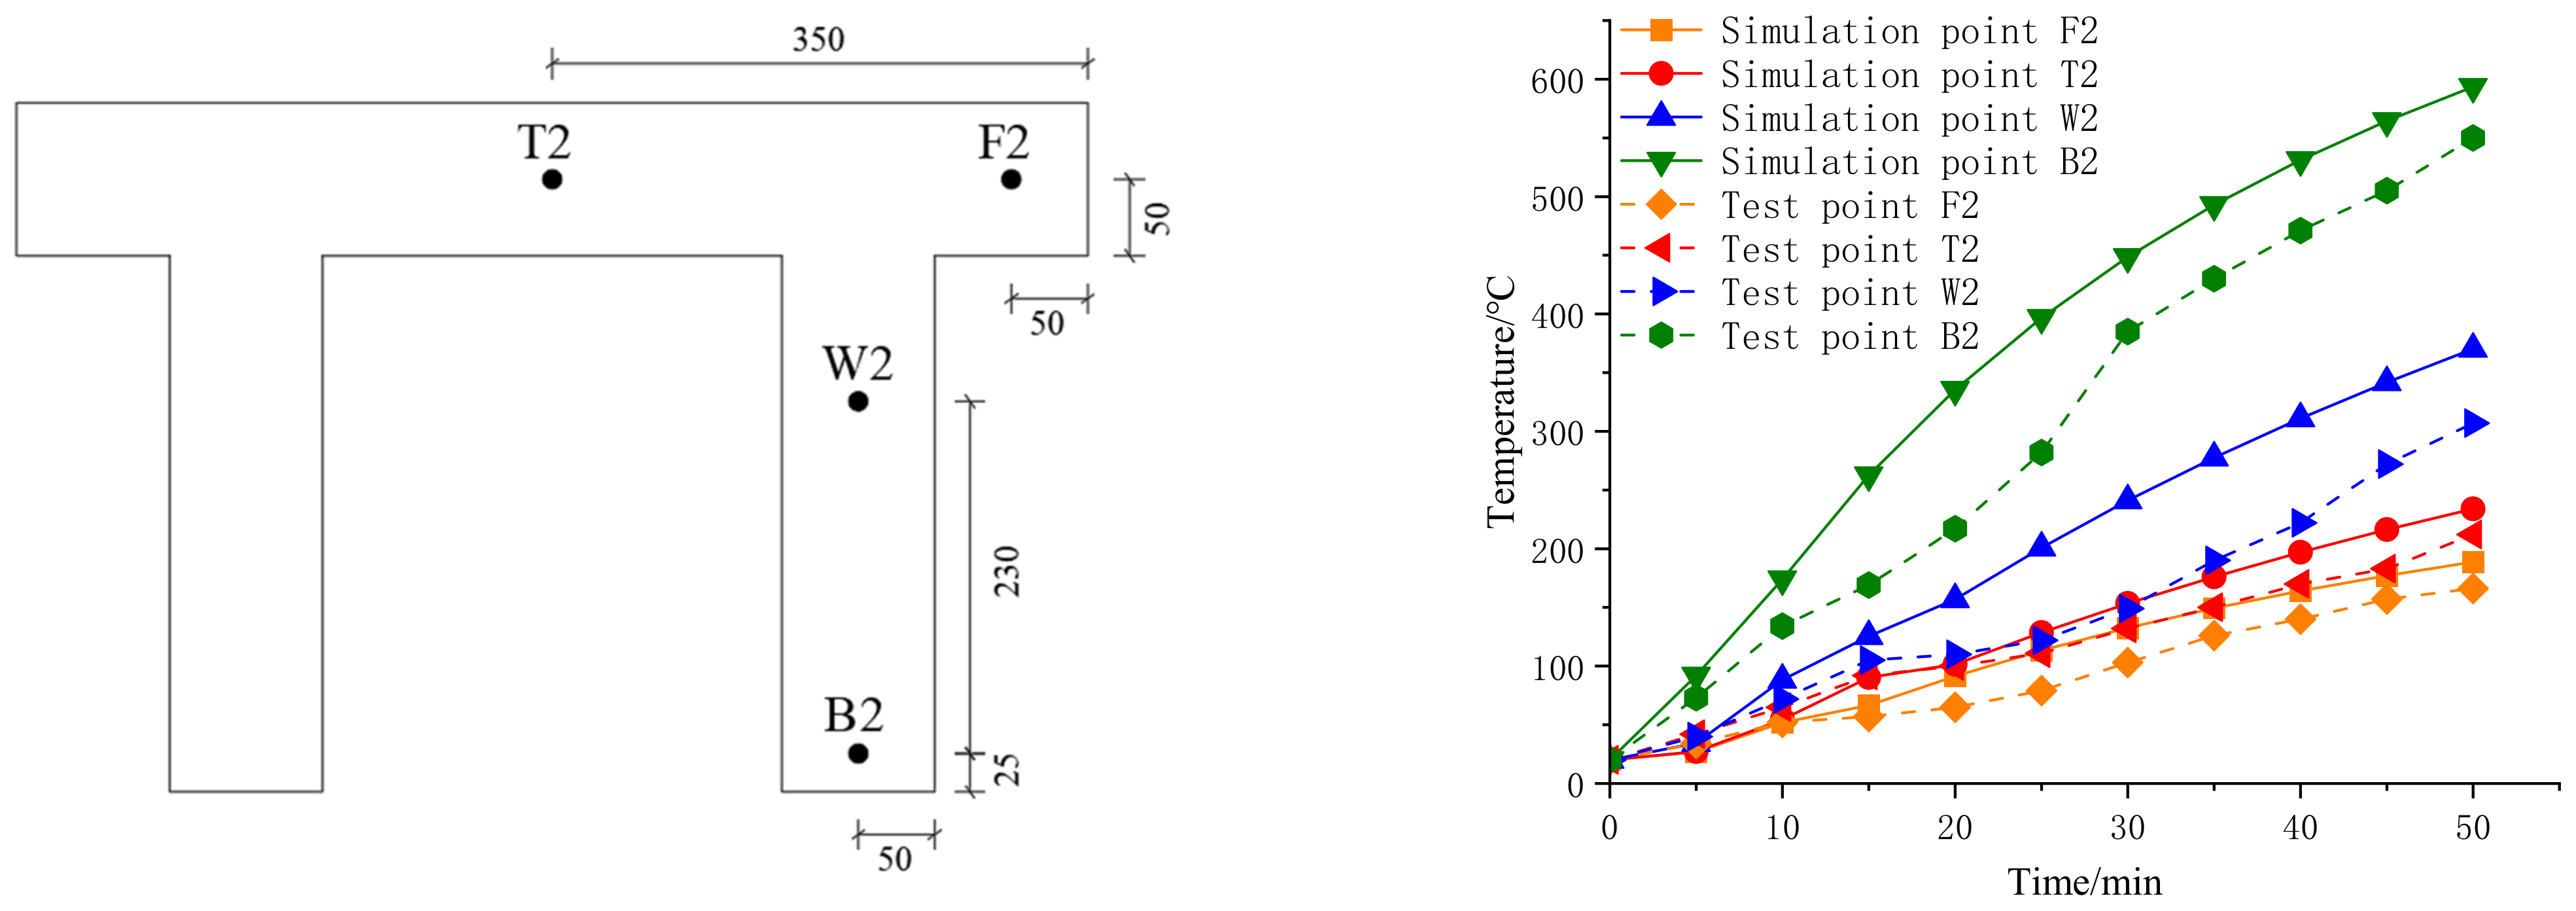
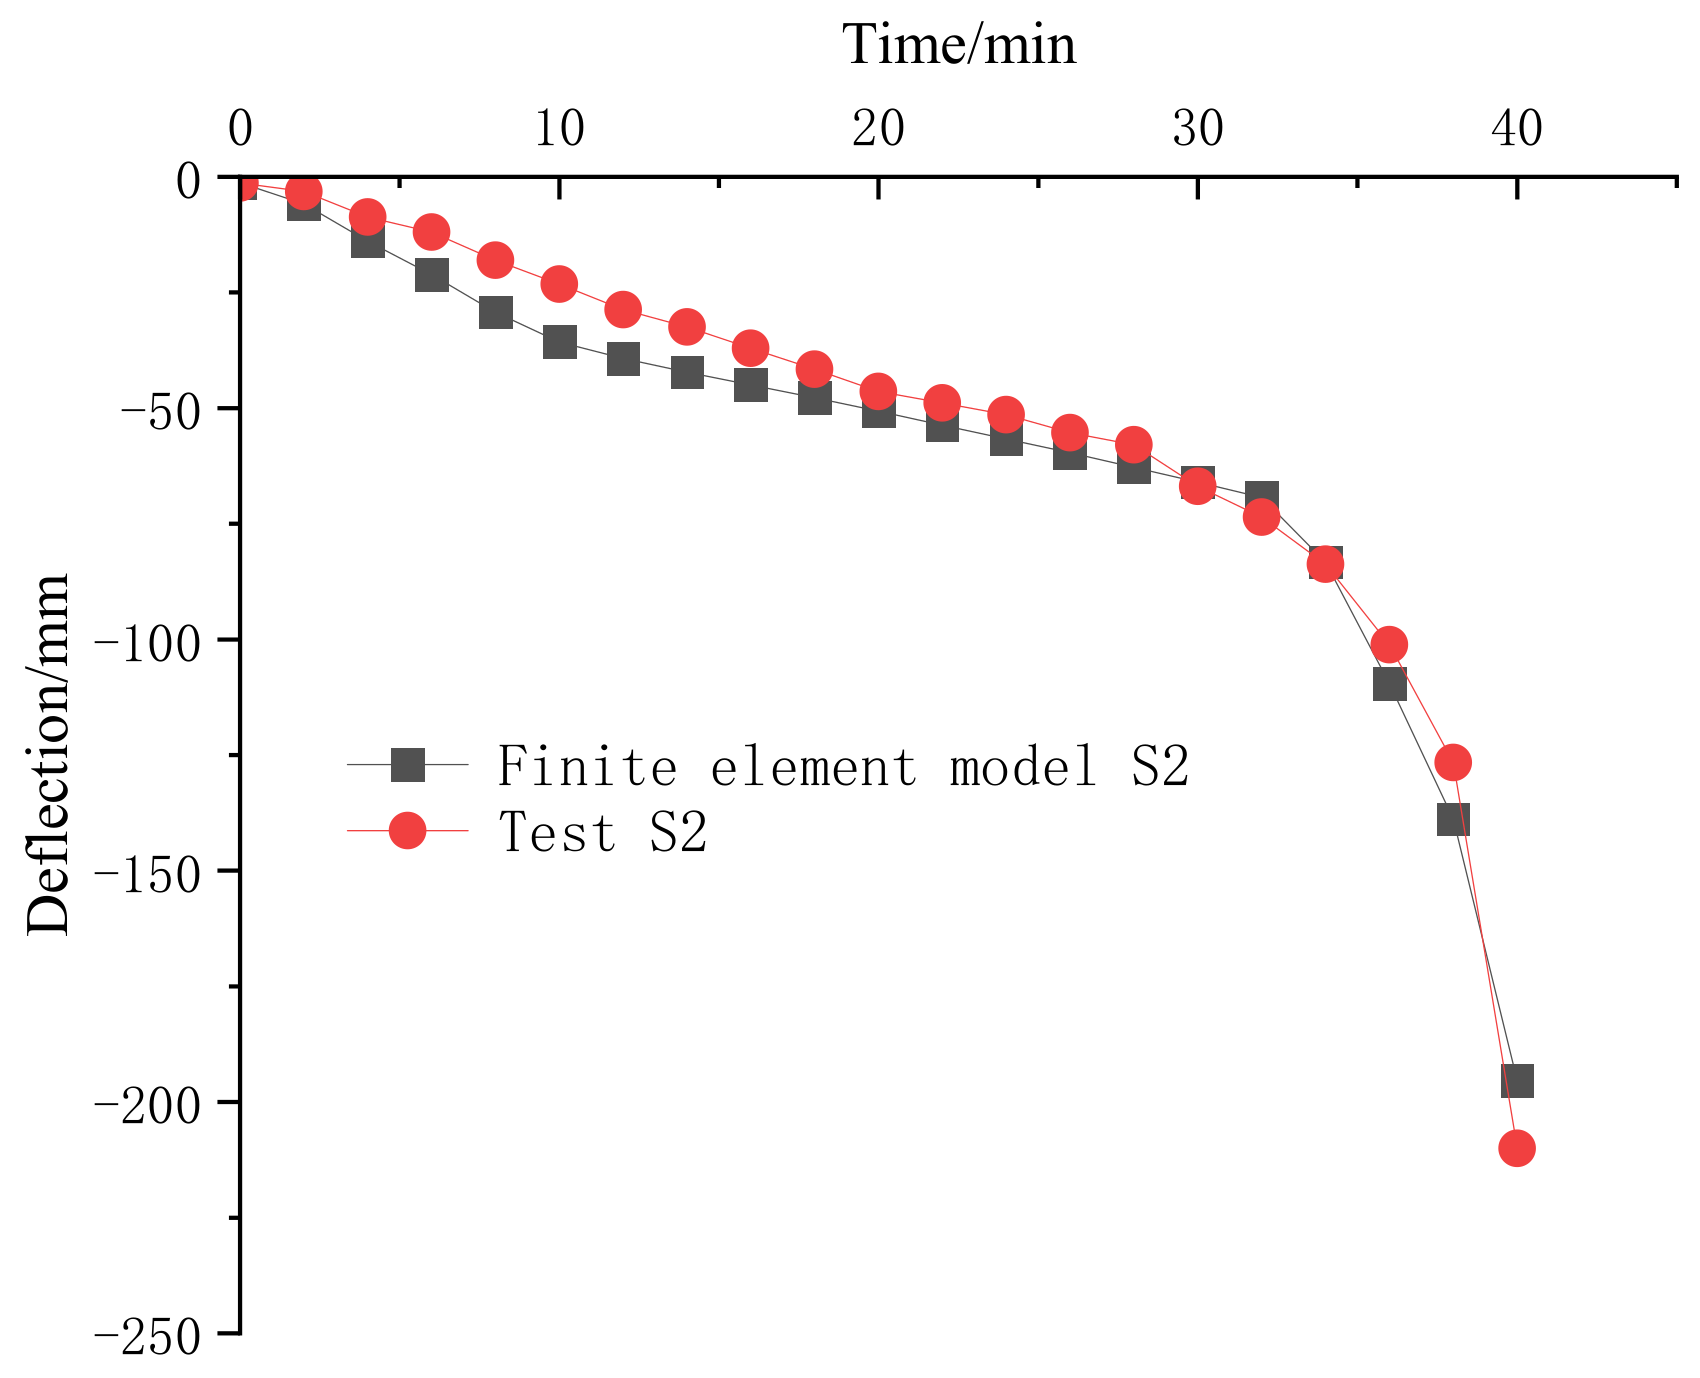
2.2. Finite Element Model Calibration Based on Existing Experimental Results

In order to explore the reasonable cell size and verify the convergence of the calculation results of different cell sizes, the model is divided into three sizes of cells, as shown in Figure 3. The basic cell sizes of grid 1, grid 2, and grid 3 are 30 mm, 20 mm, and 10 mm, respectively. Model S2 in the literature [10] was used as a reference to verify that the finite element model is correct, and the deflection time curves for three cell sizes are shown in Figure 4. The calculation results in Figure 4 show that the deflection calculation errors for the three cell sizes are within 5%, and the deflection–time curves basically overlap, indicating that the chosen 20 mm cell size has met the convergence requirements.
A comparison of the finite element model calculation results with the relevant experimental data in the literature [10] is shown in Figure 5 and Figure 6. For the temperature field model, the temperature measurement points T2, B2, W2, and F2 in the model beam S2 in the test were selected, and the results of the finite element model analysis were compared with the temperature–time course curves in the literature, as shown in Figure 5. The time course curves of the measured points obtained from the finite element numerical simulation do not differ much from the measured points obtained in the test, and the overall agreement between them is good. This indicates that the selection of thermal parameters of materials and the definition of loads and boundary conditions in the model establishment process are correct and reasonable, and they apply to the fire resistance analysis of prestressed concrete T-beams.
For the calculation model of fire resistance analysis, the time course curves of the mid-span deflection of T-beam S2 in the test at a load level of 0.35 were selected for comparison and analysis with the corresponding deflection time course curves in the numerical simulation model, as shown in Figure 6. Figure 6 shows the overall agreement of the deflection time course curves obtained from the finite element numerical simulation is good. This indicates that the finite element numerical model simulation is effective and can be used to calculate and analyze the fire resistance of the prestressed concrete T-beam.

3. Calculation Results and Parameter Analysis of Fire Resistance of Prestressed Concrete T-Beam

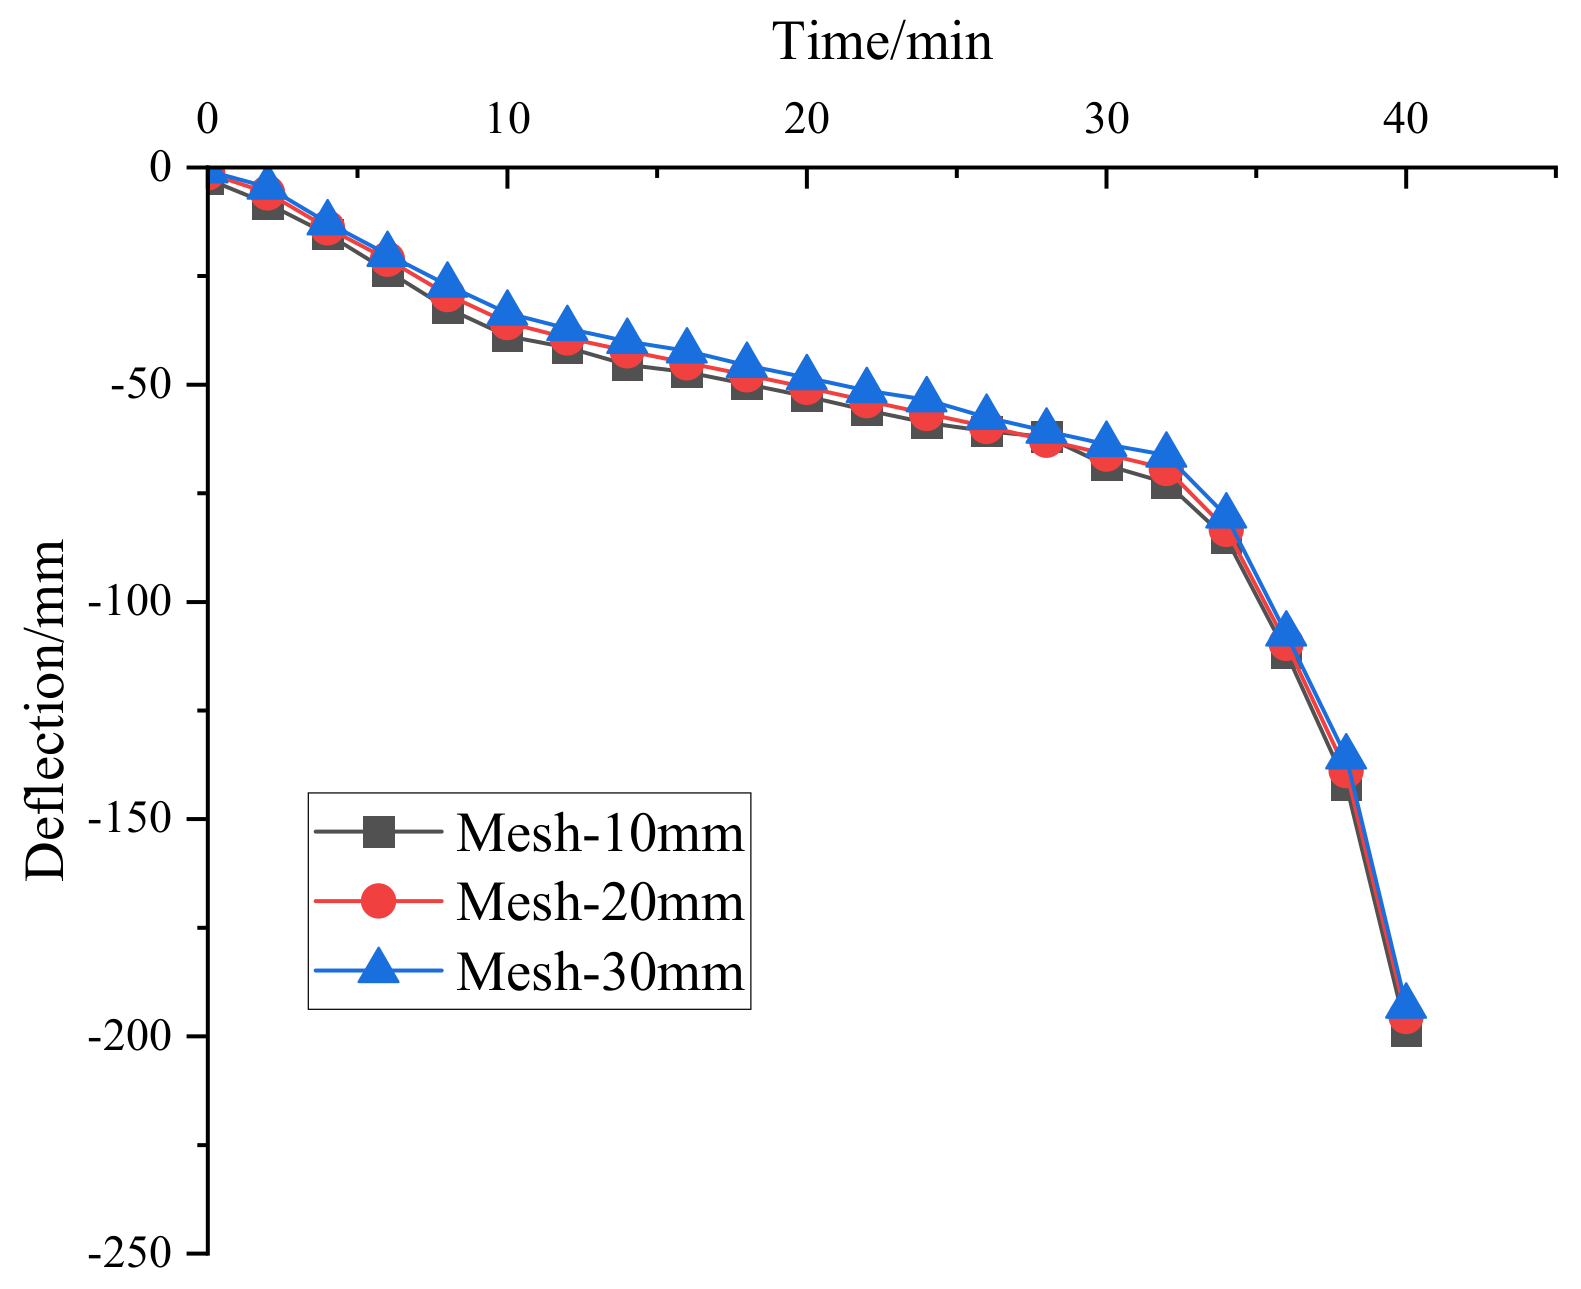
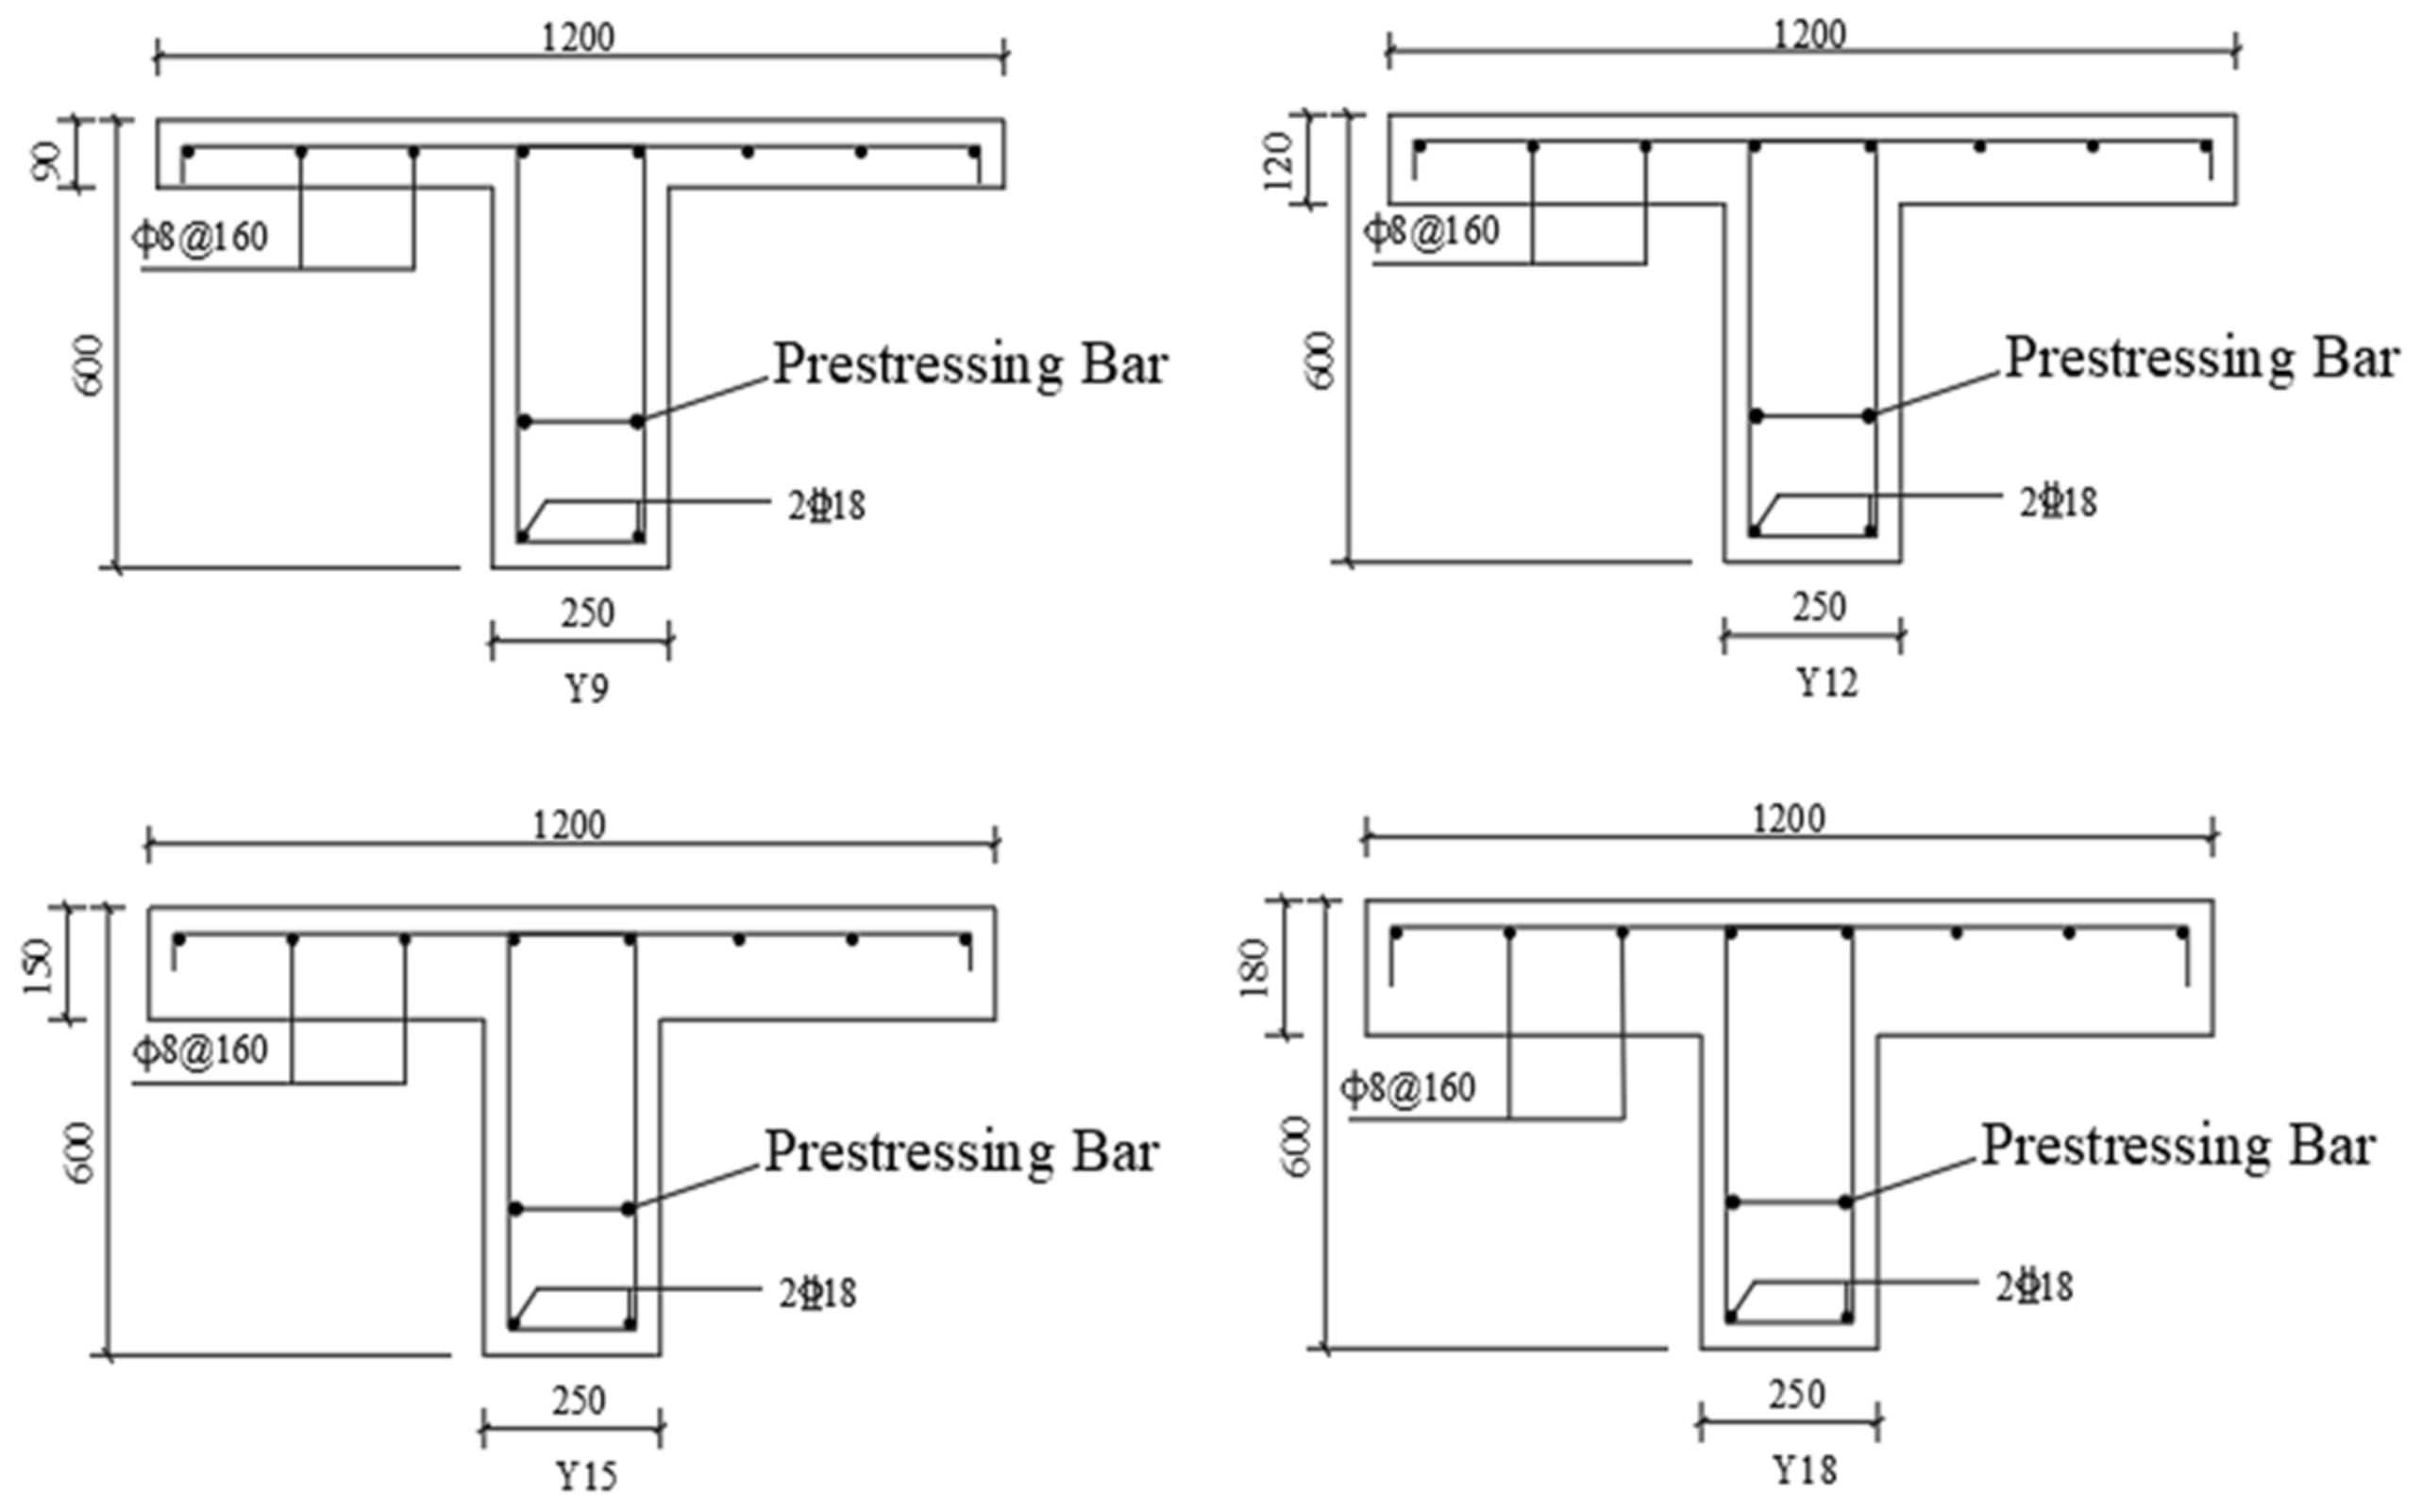
3.1. Determination of Finite Element Model and Analysis Parameters

Based on the validated finite element model, four prestressed concrete T-beams with the cross-sectional dimensions shown in Figure 7 were designed to develop a more extensive parametric analysis of their fire resistance. The calculated length of the prestressed concrete T-beam is 3.6 m, and the cross-section of the prestressed T-beam is designed as follows: beam height 600 mm, web width 250 mm, the width of flange plate 1200 mm, the height of flange plate 90 mm, 120 mm, 150 mm, and 180 mm. Three cases with load ratios of n = 0.4, n = 0.6, and n = 0.8 (n denotes the load ratio, calculated from the formula n = F / F u , where Fu is the ultimate load of prestressed concrete T-beam at room temperature) were designed. Additionally, the finite element model is divided into five groups in total to research and analyze different fire modes, different concrete strength classes, different flange plate thicknesses, different ratios of the prestressing bar, and different concrete protective layer thicknesses. The D1 represents the research of different fire exposure patterns. Five fire exposure patterns were selected from H1 to H5 to simulate most of the possible scenarios during a fire, as shown in Figure 8. The D2 represents the research of different ratios of the prestressing bar. The prestressing bar material is prestressing strand type 1 × 7 − 12.7 with an ultimate strength standard value of 1860 MPa, and its single cross-sectional area is 98.7 mm2. Five ratios of the prestressing bar are set at p = 0%, p = 0.0658%, p = 0.1316%, p = 0.1974%, and p = 0.3290%. The D3 represents the research of four different flange plate thicknesses, noted as Y9, Y12, Y15, and Y18. The D4 indicates the research of different concrete strength classes. According to Article 3.1.1 of the Code for the Design of Prestressed Concrete Structures (JGJ369-2016) [26], the concrete strength grade of prestressed concrete structures should not be lower than C40, and especially should not be lower than C30. In order to better obtain the influence law of concrete strength grade on the fire resistance of prestressed concrete T-beam, the concrete strength grades selected for the model are C30, C40, C50, and C60. The D5 represents the research of different concrete protection layer thicknesses, and the model was set up with four groups of concrete protection layer thicknesses, a = 15 mm, a = 25 mm, a = 35 mm, and a = 45 mm.

3.2. Finite Element Model Calculation Results

3.2.1. Definition of Fire Resistance

The fire resistance of building construction is the time experienced by the building construct from the onset of fire to the loss of stability, load-bearing capacity, or inability to continue functioning under the specified test conditions and the standard heating curve. By the “Fire-Resistance Tests-Elements of Building Construct” (GB/T9978-2008) [27], the fire resistance of building construction is determined by the spanwise deflection of the building construct, the rate of change of spanwise deflection, the temperature of the backfire surface, and the inability to perform its role in the event of combined damage. According to the code, the conditions were followed for the prestressed concrete T-beam model to reach fire resistance. The ultimate mid-span deflection of the prestressed concrete T-beam is 54 mm, or the rate of change of the ultimate mid-span deflection is 2.4 mm/min when the bending deformation of the prestressed concrete T-beam reaches 120 mm.

3.2.2. Fire Resistance Calculation Results

The fire resistance of the prestressed concrete T-beams were derived from the ABAQUS finite element model analysis and are summarized as shown in Table 6.

3.3. Analysis of Parameters Affecting the Fire Resistance of Prestressed Concrete T-Beams

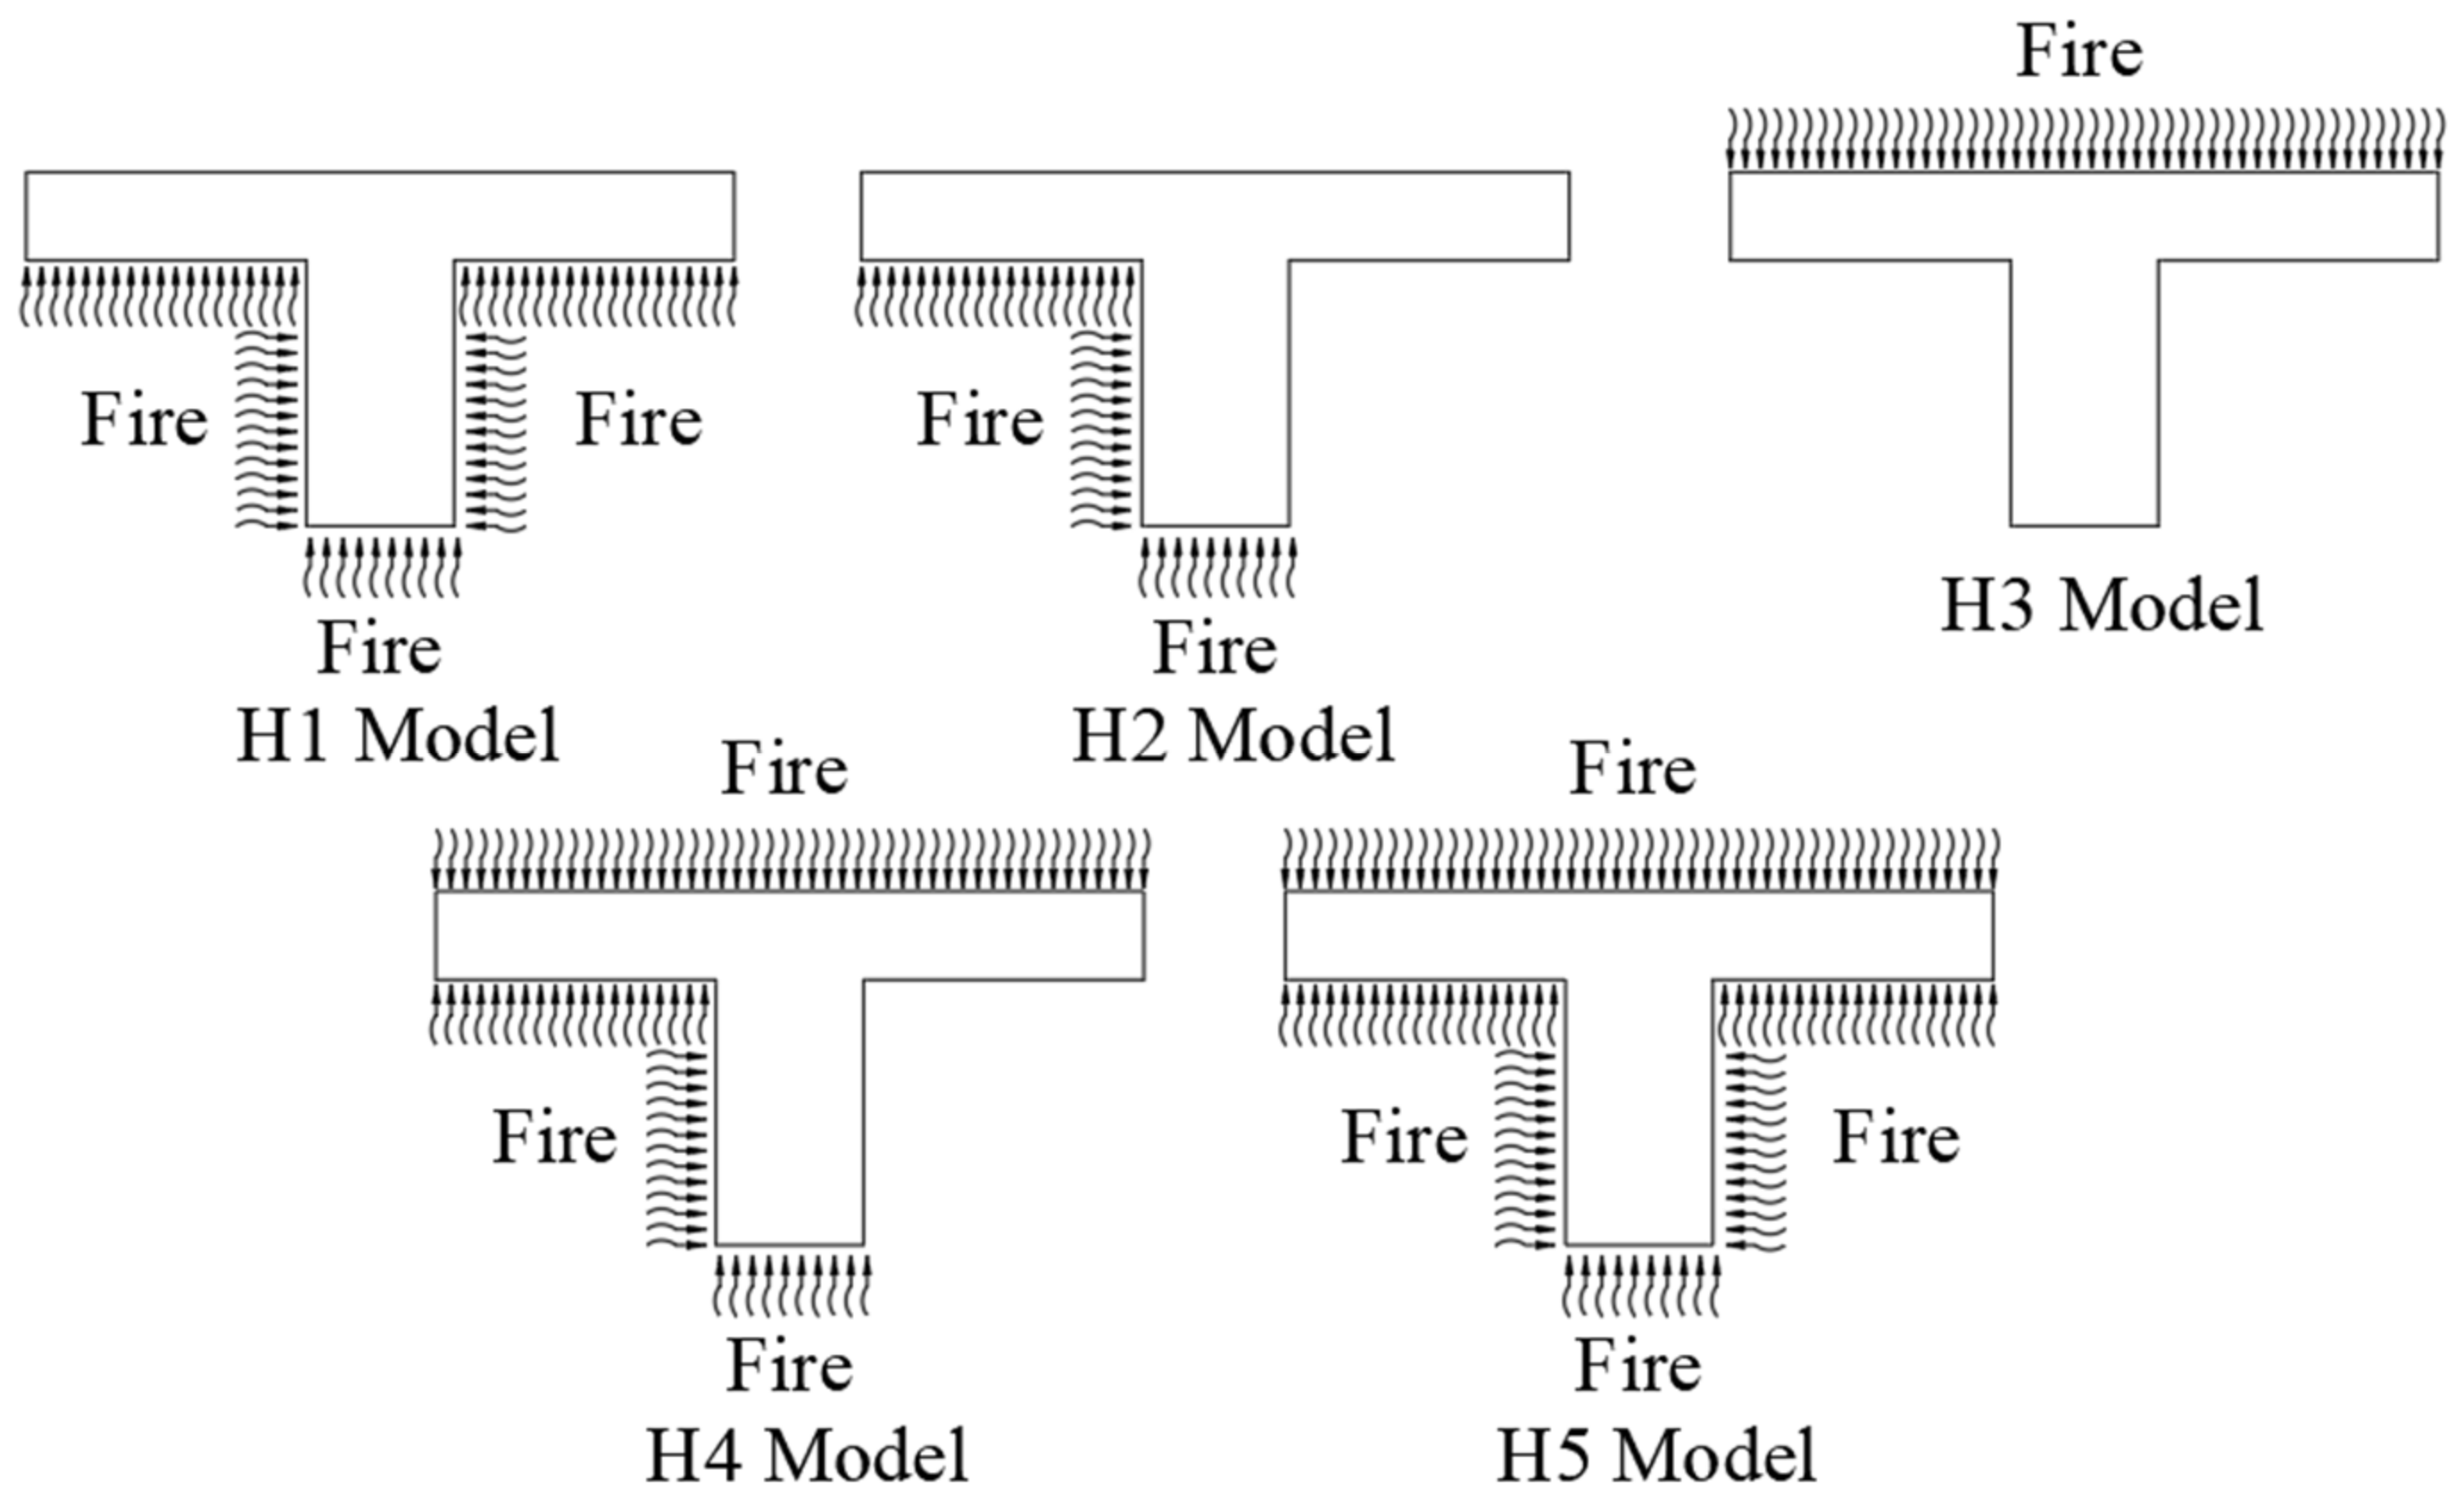
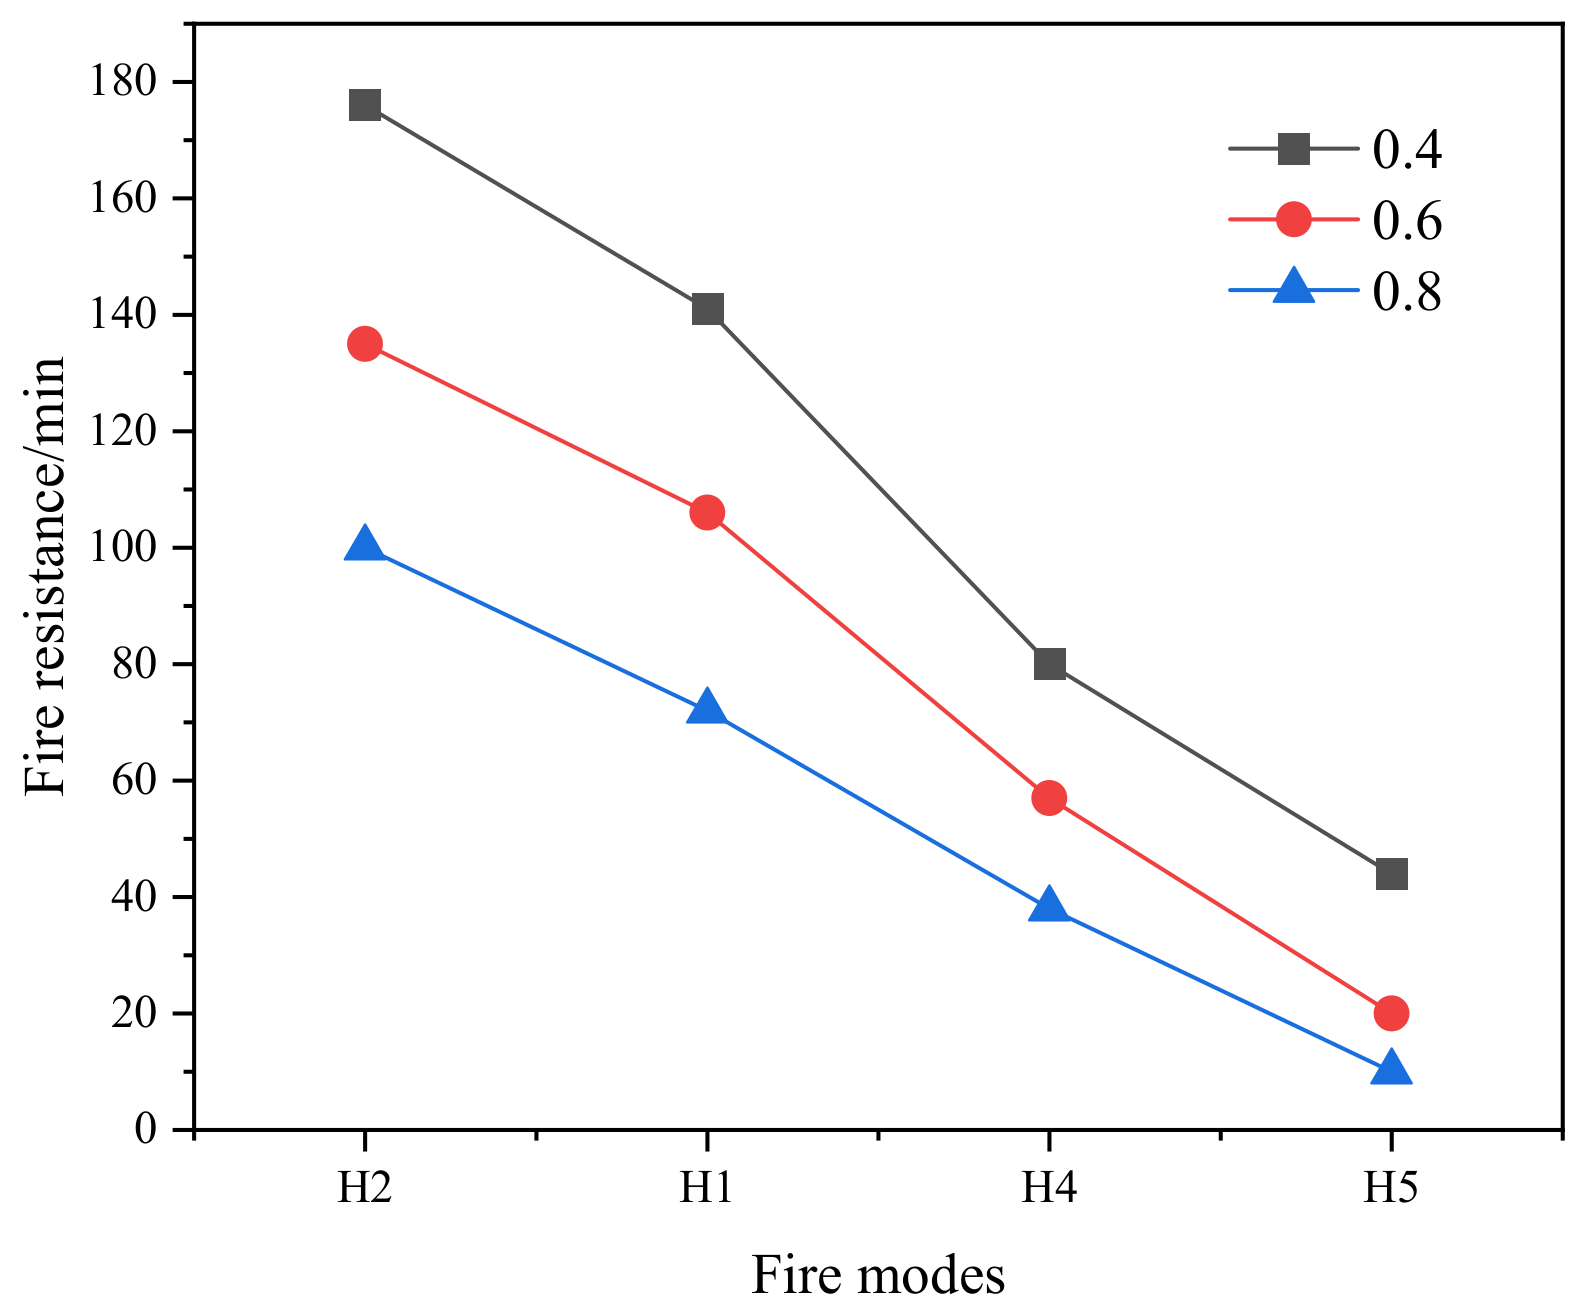
3.3.1. Effect of Different Fire Modes on Fire Resistance

Figure 9 shows the curves of the variation of the mid-span deflection of the prestressed concrete T-beams under different fire modes. The variation of mid-span deflection of prestressed concrete T-beams under different fire modes shows a large variability. As the fire time increases, the rate of decrease of the curve increases with the increase of the fire surface, and the difference of the mid-span deflection at the same moment becomes larger. The increase in the fire surface results in a faster temperature transfer in the prestressed concrete T-beam. The higher the temperature of the concrete, steels, and prestressing bars simultaneously, the faster the mechanical properties decrease. Thus, the more likely it is that the structure will reach its fire resistance. Figure 10 shows the variation of the fire resistance for different fire modes at load ratios n = 0.4, n = 0.6, and n = 0.8. An increase in the load ratio leads to an increased rate of decrease in the fire resistance of prestressed concrete T-beam because the load exacerbates the damage to the structural material under the action of high temperatures.

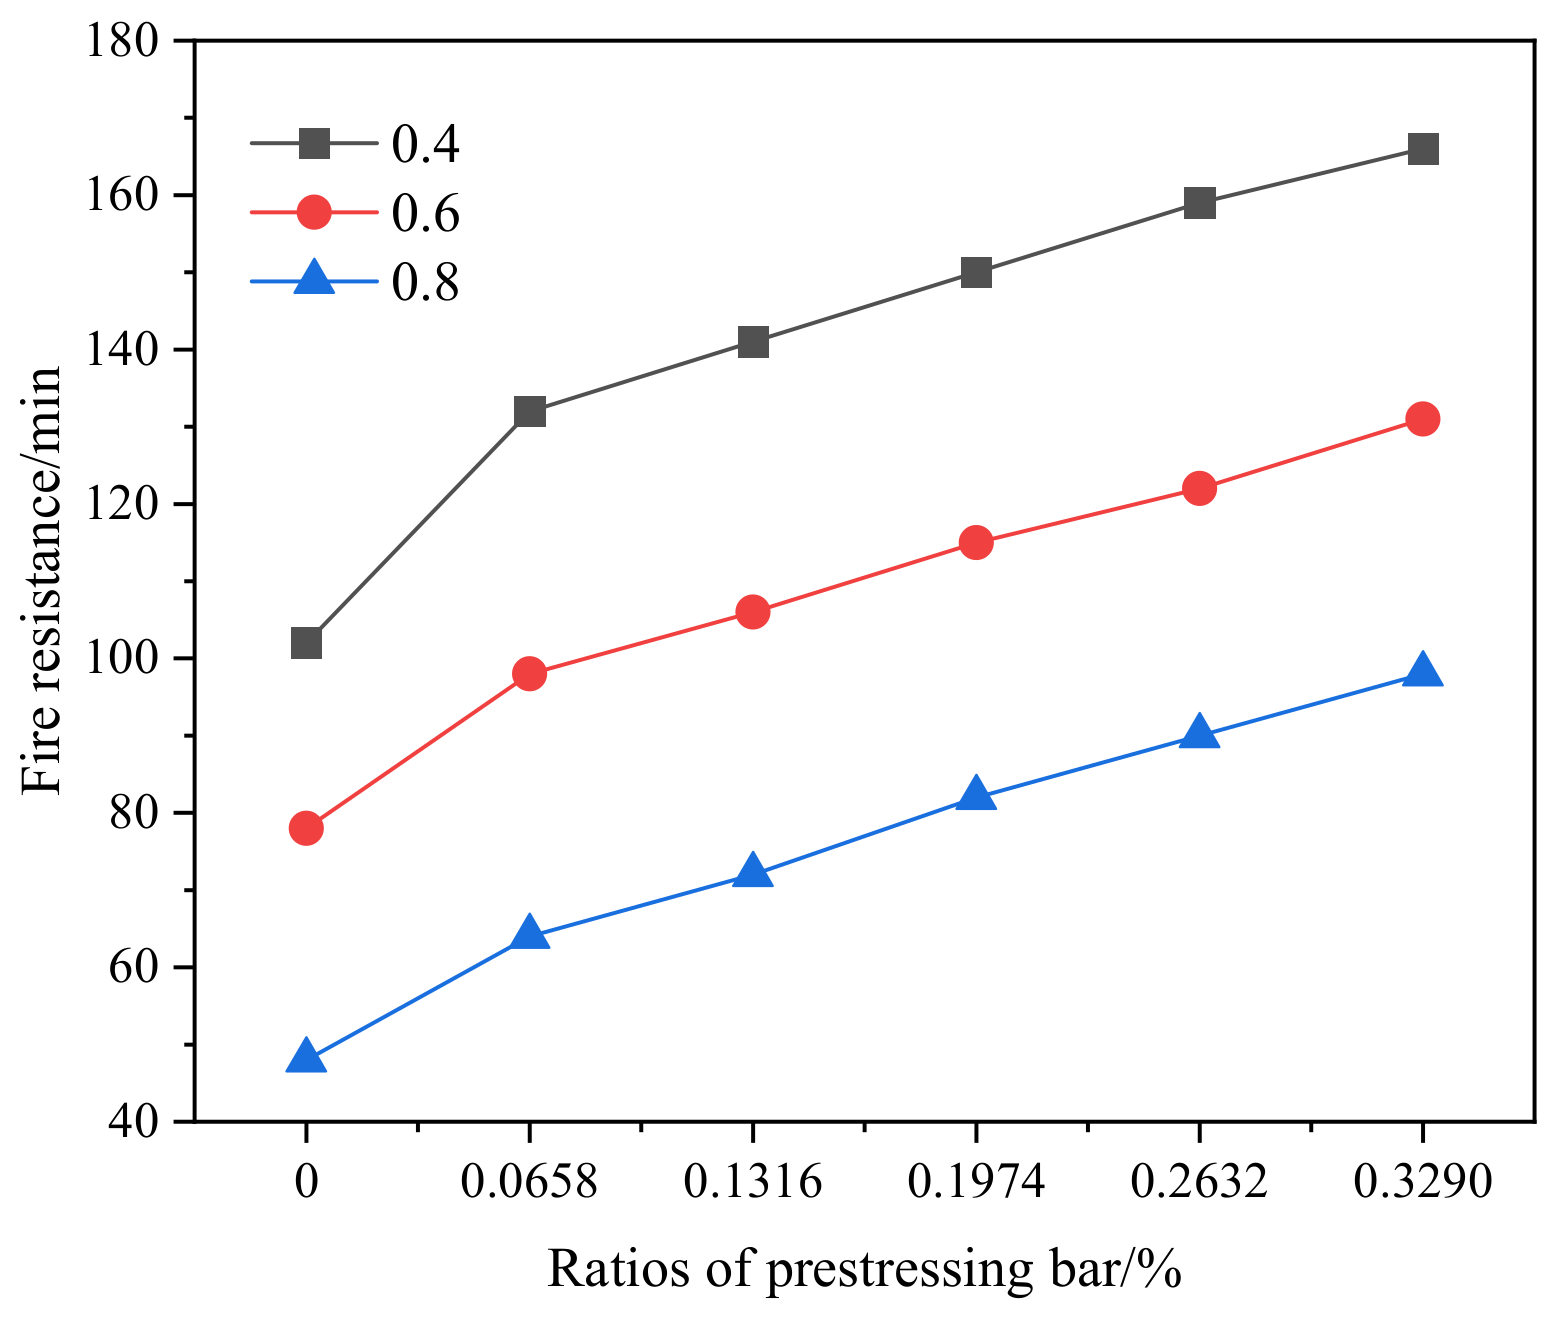
3.3.2. Effect of Different Ratios of Prestressing Bar on Fire Resistance

Under the conditions of load ratio n = 0.4, n = 0.6, and n = 0.8, the law of change of fire resistance of prestressed concrete T-beams with different ratios of the prestressing bar was compared and analyzed, as shown in Figure 11. When the ratios of the prestressing bar increase from 0% to 0.0658%, there is a 25~30% increase in the fire resistance of prestressed concrete T-beams. As prestressing bars play an important role in prestressed concrete T-beams, damage to prestressing bar performance can directly affect fire resistance. At the same fire time, there is little difference in the amount of reduction in prestressing performance for different ratios of the prestressing bar. Therefore, increasing the ratio of prestressing bar will increase the structure’s fire resistance.

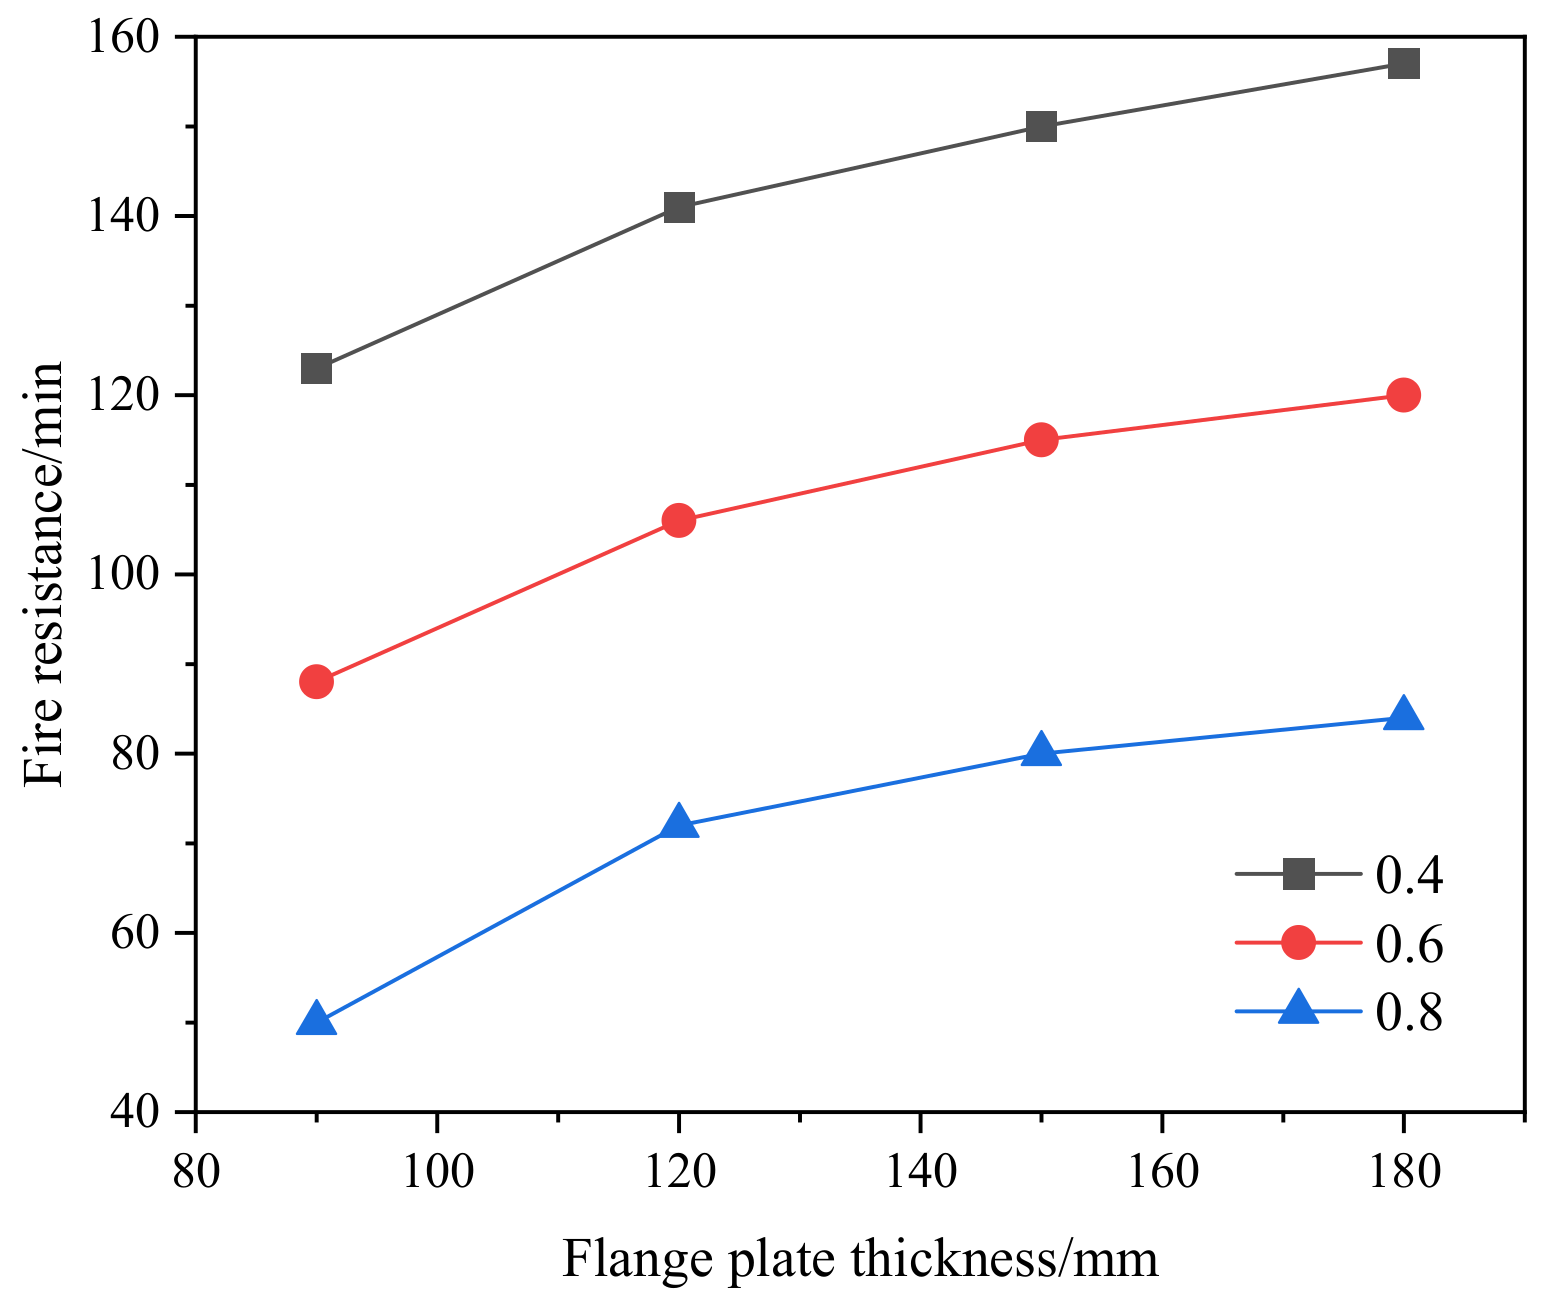
3.3.3. Effect of Different Flange Plate Thicknesses on Fire Resistance

The fire resistance of prestressed concrete T-beams at different flange plate thicknesses is shown in Figure 12. As the height of the flange plate increases, the fire resistance of the prestressed concrete T-beam gradually increases, but the rate of increase in the fire resistance will gradually become slower with the increase in the height of the flange plate. When the thickness of the flange plate increases from 90 mm to 120 mm, the fire resistance increases by about 15%. When the height of the flange is greater than 120 mm, the growth of the fire resistance gradually tends to equalize. This is because increasing the height of the flange plate will affect the temperature field of the prestressed concrete T-beam at high temperatures, as well as changing the temperature of the steel in the structure, and so will increase the fire resistance. However, the prestressed concrete T-beam flange plate mainly has the role of pressure resistance, so when the height of the flange plate increases to a certain extent, the prestressed concrete structure fire resistance will gradually tend to balance.

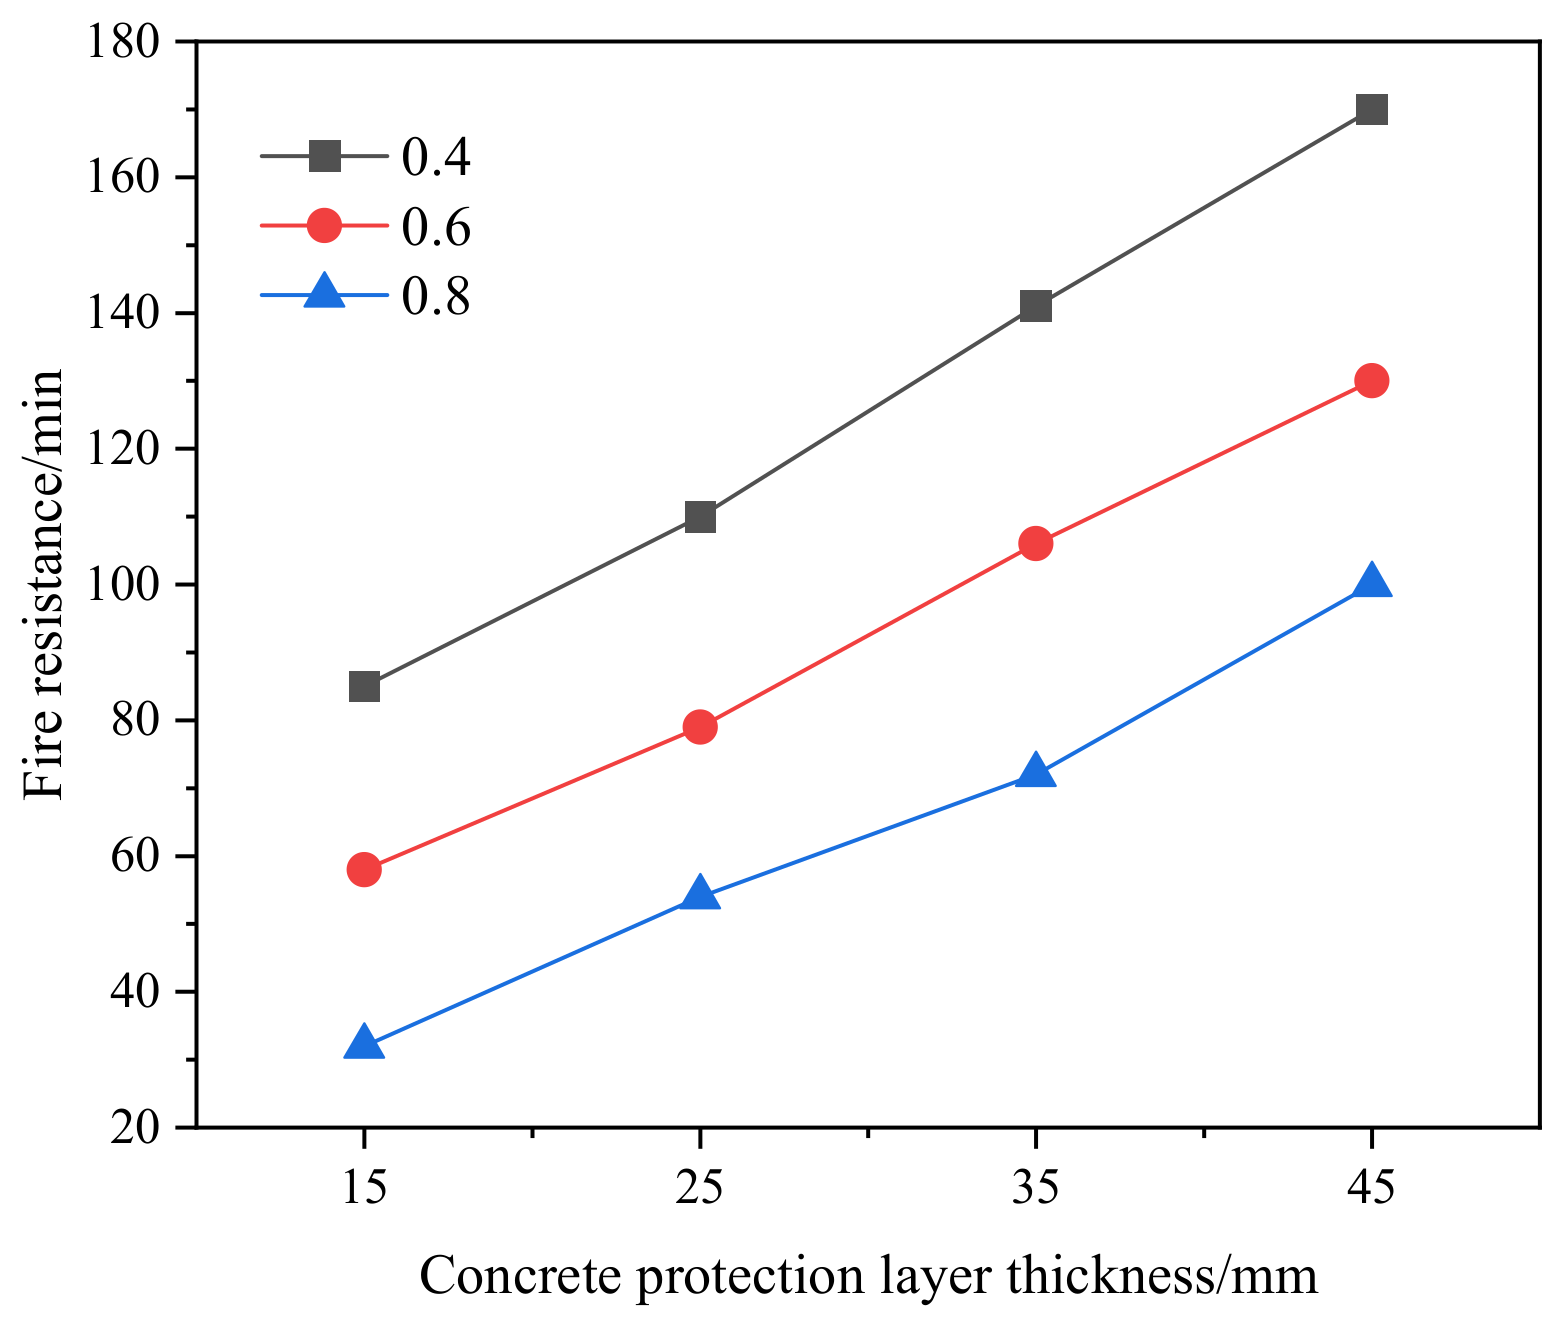
3.3.4. Effect of Different Concrete Protection Layer Thicknesses on Fire Resistance

The thickness of the protective layer of concrete can influence the fire resistance of prestressed concrete beams, as shown in Figure 13. The fire resistance grows as the protective layer increases, indicating an approximate linear upward trend. When the thickness of the protective layer is increased from 15 mm to 25 mm and 35 mm, the fire resistance of the prestressed concrete beam increases by about 30% and 40%, respectively. In particular, when the thickness of the protective layer of concrete is increased to 45 mm, the fire resistance of prestressed concrete beams can be increased by a factor of about one. This is due to the fact that increasing the thickness of the concrete protective layer effectively delays the high temperatures to which the steels and prestressing bars in the prestressed concrete T-beam are subjected, resulting in a reduction in the discounted high-temperature performance of the steels and prestressing bars, thus improving the fire resistance of the prestressed concrete T-beam. In prestressed concrete T-beams, whether the performance of prestressing bars can be effectively played directly affects the fire resistance of the structure, so unlike concrete beams, increasing the thickness of the concrete protective layer shows a tendency for the fire resistance to continue to grow.

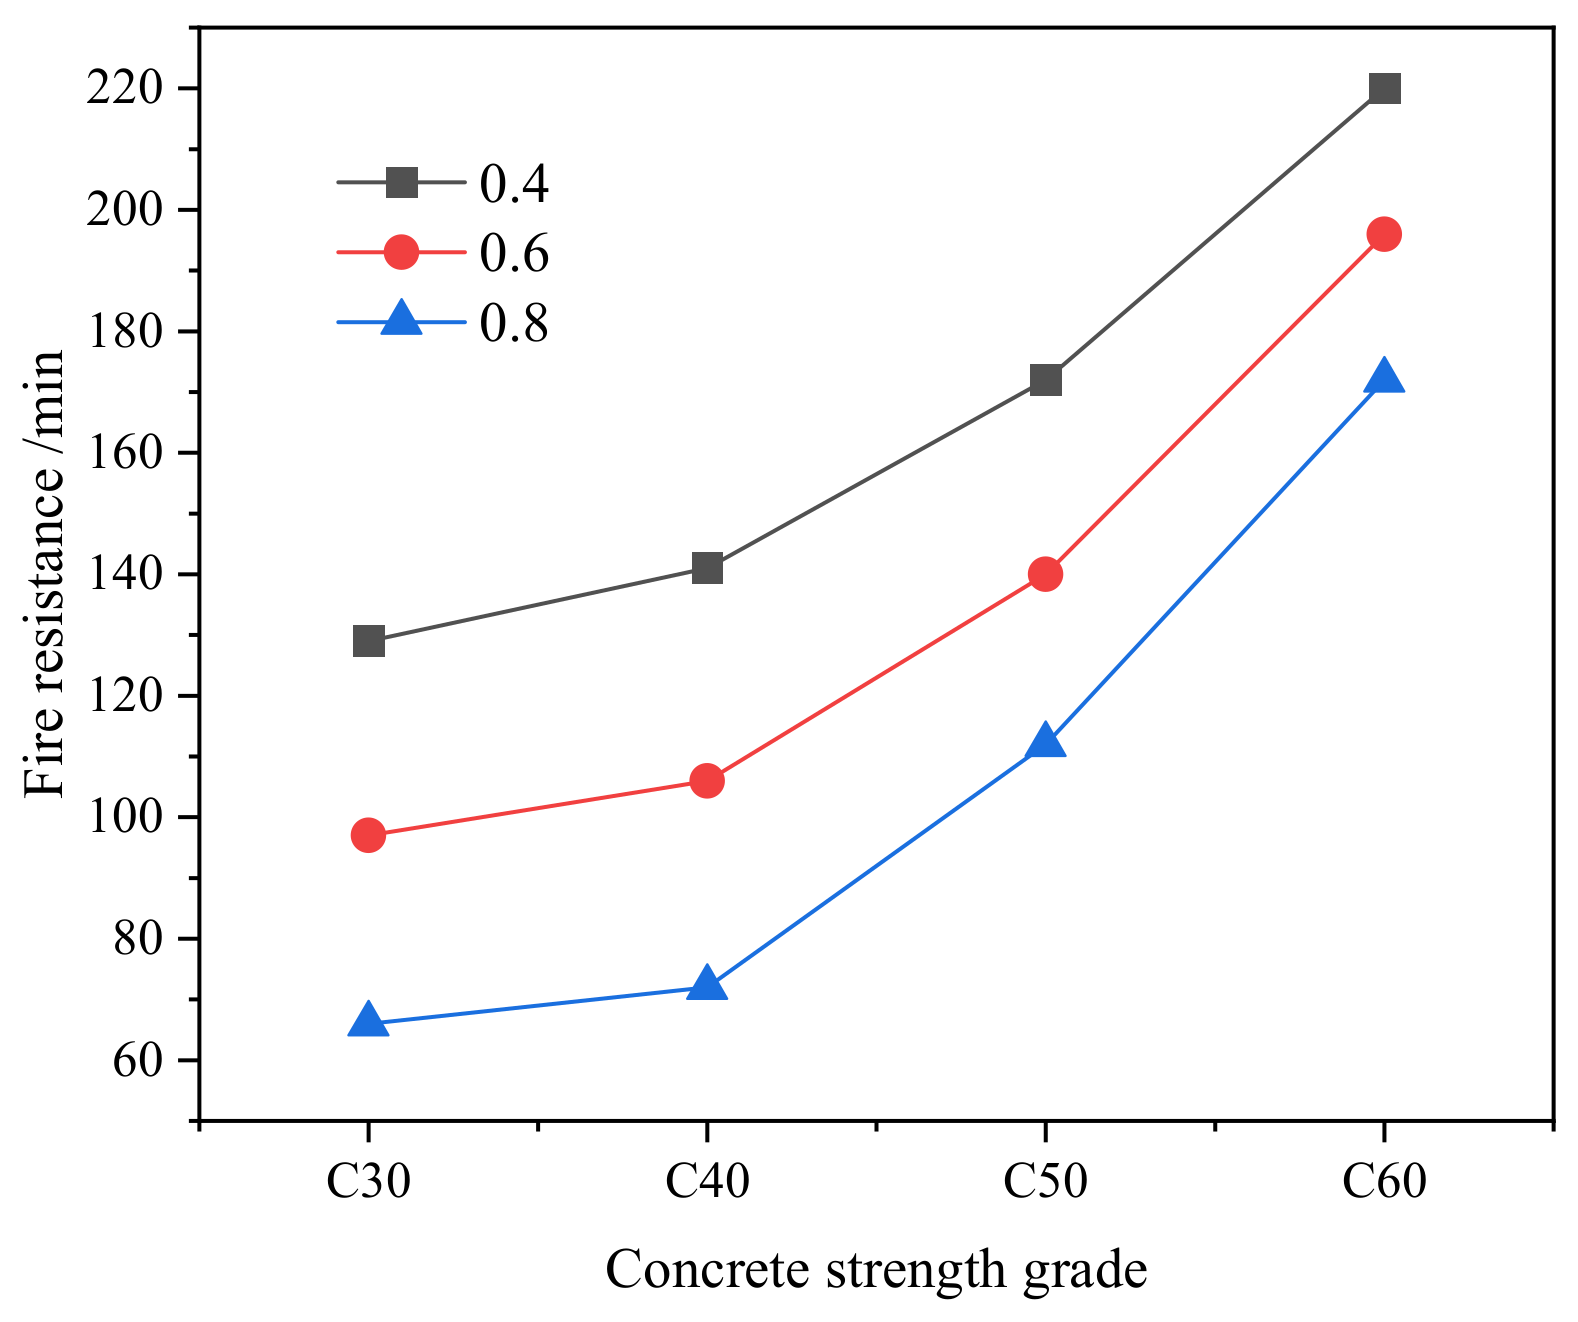
3.3.5. Effect of Different Concrete Strengths on Fire Resistance

The influence of different concrete strengths on the fire resistance of prestressed concrete T-beams was compared and analyzed at load ratios of n = 0.4, n = 0.6, and n = 0.8, as shown in Figure 14. As the concrete strength level increases, the fire resistance of prestressed concrete T-beams shows an increasing trend. Furthermore, the increase is gradually accelerated with the increase in concrete strength. The magnitude of the discount of the high-temperature properties is only related to the fire temperature for concrete material. Under the same fire conditions, the residual strength of concrete with high strength is greater than that of concrete with low strength, which leads to increased fire resistance. A significant increase occurs when the concrete strength is C50. With load ratios of n = 0.4, n = 0.6, and n = 0.8, the fire resistance increases by 20%, 30%, and 50%, respectively. Therefore, in engineering design, if there is a requirement for structural fire resistant design, it is recommended that concrete strength classes of C50 or above be used for structural fire resistant design.

4. Regression Prediction Formula for Fire Resistance of Prestressed Concrete T-Beams

The parametric analysis results show that the fire resistance of the prestressed concrete T-beam is affected by the fire mode, load ratio, flange plate thickness, ratio of the prestressing bar, concrete protective layer thickness, and concrete strength. Based on the results of the fire resistance calculated from the finite element mode analysis of the prestressed concrete T-beam, an equation for calculating the fire resistance of the prestressed concrete T-beam is proposed for the fire mode H1, as in Equation (1). K represents the fire resistance of the prestressed concrete T-beam. K Y denotes the effect of flange plate thickness on fire resistance. K P denotes the effect of the ratio of the prestressing bar on the fire resistance. K a denotes the effect of concrete protective layer thickness on fire resistance. K C denotes the effect of concrete strength on fire resistance. K n denotes the influence of the load ratio on the fire resistance.
K = K Y K P K a K C K n
where K Y = 2.47271 ( Y / 100 ) 2 + 8.61385 ( Y / 100 ) 0.57829
K P = 6.32065 P 2 + 4.42725 P + 1.21516 K a = 15.78616 ( a / 100 ) + 1.74918 K C = 9.50256 ( C / 100 ) 2 5.76757 ( C / 100 ) + 1.74918 K n = 0.29974 n 2 2.41873 n + 2.88604
Then Y and a are in mm.
Figure 15 shows the comparison between the calculated value of the fire resistance formula and the simulated value of the finite element software. Among them, the correlation coefficient between the calculated value of the fire resistance formula and the finite element simulation value is 0.94635, which indicates that the accuracy of the fire resistance formula is good and shows good consistency.

5. Conclusions

The fire resistance of prestressed concrete T-beams was investigated by means of the ABAQUS finite element simulation method, and a wide range of influencing parameters were carried out. Based on the results of the finite element model calculations, an equation for calculating the fire resistance of prestressed concrete T-beams is presented. The following conclusions were obtained.
  • The fire resistance of prestressed concrete T-beams under different fire modes shows a large variability. Under the action of high temperature, the load will make the damage of the prestressed concrete T-beam aggravated, leading to a faster decrease of the fire resistance. The fire resistance mode should be considered in the fire resistance design.
  • The ratio of prestressing bar shows an approximately linear increase in the fire resistance of prestressed concrete T-beam, and an appropriate increase in the ratio of prestressing bar can improve the fire resistance of the beam. In practical applications, an appropriate increase in the ratio of prestressing bar can be considered under the premise that the code allows and the economy is reasonable.
  • Concrete protective layer thickness, and concrete strength can significantly improve the fire resistance of prestressed concrete T-beams. For the fire resistance design of practical projects, the addition of these two parameters is effective in obtaining higher fire resistance limits.
  • For the fire mode H1, a formula for calculating the fire resistance of prestressed concrete T-beam considering several influencing parameters of load ratio, the ratio of the prestressing bar, flange plate thickness, concrete protective layer thickness, and concrete strength is proposed. The predicted results of the Equation are in good agreement with the numerical simulation results.

Author Contributions

Conceptualization, Z.W. and M.C.; methodology, Z.W.; software, M.C.; validation, Z.W., M.C. and Y.L.; formal analysis, M.C.; investigation, Z.W.; resources, Z.W.; data curation, M.C.; writing—original draft preparation, M.C.; writing—review and editing, Z.W.; visualization, Y.L.; supervision, Z.W.; project administration, Z.W. All authors have read and agreed to the published version of the manuscript.

Funding

This research was funded by Innovative Projects of Civil Engineering (Changsha University of Science & Technology) 13ZDXK08 and Open Fund of Hunan Province University Key Laboratory of Bridge Engineering (Changsha University of Science & Technology) 13KA05.

Institutional Review Board Statement

Not applicable.

Informed Consent Statement

Not applicable.

Data Availability Statement

The relevant data are all included in the paper.

Conflicts of Interest

The authors declare no conflict of interest.

References

  1. Zheng, W.Z.; Hou, X.M.; Wang, Y. Progress and prospect of fire resisitance of reinforced concrete and prestressed concrete structures. J. Harbin Inst. Technol. 2016, 48, 1–18. [Google Scholar]
  2. Garlock, M.; Paya-Zaforteza, I.; Kodur, V. Fire hazard in bridges: Review, assessment and repair strategies. Eng. Struct. 2012, 35, 89–98. [Google Scholar] [CrossRef]
  3. Zhang, G.; He, S.H.; Hou, W. Review on fire resistance of prestressed-concrete bridge. J. Chang. Univ. 2018, 38, 1–10. [Google Scholar]
  4. Han, C.Q.; Xu, Q.F.; Liu, Q. Experimental research and FEA of fire resistance of RC continuous T-beam. J. Build. Struct. 2015, 36, 142–150. [Google Scholar]
  5. Wang, Y.Z.; Qiu, H.; Xiu, T.G. Change law of failure mode of reinforce concrete two-end consolidation beam in fire. J. Disaster Prev. Mitig. Eng. 2023, 2023, 1–10. [Google Scholar]
  6. Kodur, V.K.R.; Dwaikat, M.B. Design equation for predicting fire resistance of reinforced concrete beams. Eng. Struct. 2011, 33, 602–614. [Google Scholar] [CrossRef]
  7. Liu, Q.; Han, C.Q.; Xu, Q.F. Experimental research and numerical analysis of the flexural behavior of RC continuous T-beam with high-strength bar after fire. Eng. Mech. 2015, 32, 179–187. [Google Scholar]
  8. Yan, K.; Cai, H.; Zhang, Y. Experimental study on fire resistance of prestressed reactive powder concrete beams. J. Build. Struct. 2020, 41, 105–115. [Google Scholar] [CrossRef]
  9. Wang, Z.Q.; Xu, Z.W. Experimental research on unbonded prestressed concrete flat beams under high temperature. J. Build. Struct. 2011, 32, 98–106. [Google Scholar]
  10. Zhang, G.; Song, C.J.; Li, X.Y. Experimental study on fire resistance of prestressed concrete girders under fuel fire exposure. China J. Highw. Transp. 2022, 35, 210–221. [Google Scholar]
  11. Yan, K.; Qin, H.; Hu, Y. Experimental and numerical studies on the fire resistance of prestressed reactive powder concrete beams. Structures 2022, 45, 1814–1832. [Google Scholar] [CrossRef]
  12. Yu, Y.; Hang, Z.; Zhao, W. Fire-resistance mechanism and residual bearing capacity of prestressed concrete beams after fire exposure. J. Struct. Eng. 2021, 147, 04021109. [Google Scholar] [CrossRef]
  13. Guo, Z.H.; Shi, X.D. Experiment and Calculation of Reinforced Concrete at Elevated Temperatures; Tsinghua University Press: Beijing, China, 2011. [Google Scholar]
  14. EN 1992-1-2 (2004); Eurocode2: Design of Concrete Structures: Part 1–2: General Rules-Structural Fire Design. European Committee for Standardization: Brussels, Belgium, 2004.
  15. EN 1993-1-2 (2005); Eurocode 3: Design of Steel Structures, Part 1–2: General Rules-Structural Fire Design. European Committee for Standardization: Brussels, Belgium, 2005.
  16. Li, Y.Q.; Ma, D.Z.; Xu, J. Fire Protection Design Calculation and Construction Treatment of Building Structures; Architecture & Building Press: Beijing, China, 1991. [Google Scholar]
  17. Li, W.; Guo, Z.H. Experimental Study on the strength and deformation properties of concrete at high temperature. J. Build. Struct. 1993, 14, 8–16. [Google Scholar]
  18. Zhu, B.L.; Lu, Z.D. Ontogenetic relationship between concrete and reinforcement under high temperature (fire). Sichuan Build. Sci. 1990, 16, 37–43. [Google Scholar]
  19. Yang, H.; Han, L.H.; Wang, Y.C. Effects of heating and loading histories on post-fire cooling behaviour of concrete-filled steel tubular columns. J. Constr. Steel Res. 2008, 64, 556–570. [Google Scholar] [CrossRef]
  20. Lie, T.T. Fire Resistance of Circular Steel Columns Filled with Bar-reinforced Concrete. J. Struct. Eng. 1994, 120, 1489–1509. [Google Scholar] [CrossRef]
  21. Saafi, M. Effect of fire on FRP reinforced concrete members. Compos. Struct. 2002, 58, 11–20. [Google Scholar] [CrossRef]
  22. Hou, X.M. Research on Fire Resistance and Fire Safety Design Method of Prestressed Concrete Beam and Slab. Ph.D. Thesis, Harbin Institute of Technology, Harbin, China, 2009. [Google Scholar]
  23. Hua, Y.J. Research on Fire Response and Fire Resistance of Prestressed Concrete Structures. Ph.D. Thesis, Tongji University, Shanghai, China, 2000. [Google Scholar]
  24. Zhang, B. The Numerical Analysis of Temperature Field and Mechanical Properties for Prestressed Concrete Slab at High Temperature (In Fire). Ph.D. Thesis, Hefei University of Technology, Hefei, China, 2010. [Google Scholar]
  25. Fan, J.; Lv, Z.T. Experimental research on pretressed steel strand at high temperature. J. Build. Struct. 2002, 32, 50–63. [Google Scholar]
  26. JGJ/369-2016; Code for Design of Prestressed Concrete Structures. China Architecture & Building Press: Beijing, China, 2016.
  27. GB/T9978-2008; Fire-Resistance Test Elements Building Construction. Standards Press of China: Beijing, China, 2008.
Figure 1. Model dimensions.
Applsci 13 04683 g001
Figure 2. Finite element model.
Applsci 13 04683 g002
Figure 3. Three types of meshing details.
Applsci 13 04683 g003
Figure 4. MID–span deflection time curves of three types of meshing.
Applsci 13 04683 g004
Figure 5. Temperature rise curves of measurement points.
Applsci 13 04683 g005
Figure 6. MID-span deflection time curve.
Applsci 13 04683 g006
Figure 7. Dimensions and reinforcement of prestressed concrete T-beam.
Applsci 13 04683 g007
Figure 8. Fire pattern of prestressed concrete T-beam.
Applsci 13 04683 g008
Figure 9. Variation curves of span deflection under different fire modes.
Applsci 13 04683 g009
Figure 10. Curves of the effect of different fire modes on the fire resistance of T–beams.
Applsci 13 04683 g010
Figure 11. Curves of the effect of different ratios of prestressing bar on the fire resistance of T-beams.
Applsci 13 04683 g011
Figure 12. Curves of the effect of different flange plate thicknesses on the fire resistance of T-beams.
Applsci 13 04683 g012
Figure 13. Curves of the effect of different concrete protection layer thicknesses on the fire resistance of T-beams.
Applsci 13 04683 g013
Figure 14. Curves of the effect of different concrete strength grades on the fire resistance of T-beams.
Applsci 13 04683 g014
Figure 15. Numerical analysis of the fire resistance calculated value and fire resistance formula simulated value comparison.
Applsci 13 04683 g015
Table 1. Thermal parameters of concrete at elevated temperature.
Thermal
Parameters
FormulaReferences
Heat transfer coefficient λ c = 1.72 1.72 × 10 3 T + 7.16 × 10 7 T 2 (Gou et al. [13])
Heat capacity C C = 900 20   ° C < T 100   ° C 900 + T 100 100   ° C < T 200   ° C 1000 + T 200 / 2 200   ° C < T 400   ° C 1100 400   ° C < T 1200   ° C (Eurocode2 [14])
Density ρ c = 2400   k g / m 3
Table 2. Thermal parameters of steel at elevated temperature.
Thermal ParametersFormulaReferences
Heat transfer coefficient λ s = 54 - 0.0333 T    20   ° C < T < 800   ° C 27.3 T > 800   ° C (Eurocode3 [15])
Heat capacity C s = 473 + 20.1 × 10 2 T + 38.1 × 10 5 T 2 (Li et al. [16])
Density ρ s = 7850   k g / m 3
Table 3. Mechanical properties of concrete at elevated temperature.
Mechanical
Properties
FormulaReferences
Stress–strain principal structure relationship y = 2.2 x 1.4 x 2 + 0.2 x 3 x < 1 x 0.8 ( x 1 ) 2 + x x 1
y = σ f c ( T )    x = ε ε p T    ε p T ε p = 1 + 5 ( T 1000 ) 1.7
(Guo et al. [13])
Tensile–compressive strength f c ( T ) f c = 1 1 + 18 ( T 1000 ) 5.1    20   ° C T 1000   ° C
f t ( T ) f t = 1 0.001 T    20   ° C T 1000   ° C
(Guo et al. [13])
Thermal expansion α c = 28 T 1000 × 10 6 (Li et al. [17])
Elasticity E c ( T ) = ( 1 0.0015 T ) E C 20   ° C T 200   ° C ( 0.87 8.4 × 10 4 T ) E C    200   ° C < T 700   ° C 0.28 E C T > 700   ° C (Zhu et al. [18])
Note: “σ” represents the stress of concrete and “ε” indicates the strain of concrete at high temperature; “εp” represents the peak strain of concrete at normal temperature; “εpT” represents the peak strain of concrete at high temperature; “fc(T)” represents the compressive strength of concrete and “ft(T)” represents the tensile strength of concrete at high temperature; “fc” represents the compressive strength of concrete and “ft” represents the tensile strength of concrete at normal temperature; “αc” represents the thermal expansion of concrete; “Ec(T)” represents the elasticity of concrete at high temperature; “Ec” represents the elasticity of concrete at normal temperature.
Table 4. Mechanical properties of steel at elevated temperature.
Mechanical
Properties
FormulaReferences
Stress–strain principal structure relationship σ s ( T ) = E s ( T ) ε ε y ( T ) f y ( T ) + E s ( T ) ( ε ε y ( T ) ) ε > ε y ( T ) (Yang et al. [19])
Tensile–compressive strength f y ( T ) f y = 1 1 + 24 ( T 1000 ) 4.5
f v ( T ) f v = 1 1 + 36 ( T 1000 ) 6.2
(Guo et al. [13])
Thermal expansion α s = ( 0.004 T + 12 ) × 10 6 0   ° C T < 1000   ° C 16 × 10 6 T 1000   ° C (Lie et al. [20])
Elasticity E s ( T ) E s = 1 T 100   ° C 1.10 0.001 T 100   ° C < T 500   ° C 2.05 0.0029 T 500   ° C < T 600   ° C 1.39 0.0018 T 600   ° C < T 700   ° C 0.41 0.00004 T 700   ° C < T 800   ° C 0.27 0.000225 T    800   ° C < T 1200   ° C 0 1200   ° C < T (Saafi et al. [21])
Note: “σs(T)” represents the stress of steel and “εy(T)” indicates the strain of steel at high temperature; “ε” indicates the strain of steel at normal temperature; “fy(T)” represents the yield strength of steel and “fv(T)” indicates the ultimate strength of steel at high temperature; “fy(T)” represents the yield strength of steel and “fv(T)” indicates the ultimate strength of steel at normal temperature; “αs” represents the thermal expansion of steel; “Es(T)” represents the elasticity of steel at high temperature; “Es” represents the elasticity of steel at normal temperature.
Table 5. Mechanical properties of prestressing bar at elevated temperature.
Mechanical
Properties
FormulaReferences
Stress–strain principal structure relationship σ p ( σ , T ) = E P T ε P T 0 ε P T ε b T σ b ( σ , T ) + f 0.2 ( σ , T ) σ b ( σ , T ) ε 0.2 T ε b T ( ε p T ε b T ) ε b T ε P T ε 0.2 T f 0.2 ( σ , T ) + f p u ( σ , T ) f 0.2 ( σ , T ) ε p u T ε 0.2 T ( ε p T ε 0.2 T ) ε 0.2 T ε P T ε p u T (Hou et al. [22])
Tensile–compressive strength f 0.2 T f 0.2 = 1.0205 3.1131 × 10 4 T 4.4715 × 10 6 T 2 + 2.8806 × 10 9 T 3
f p t k T f p t k = 0.9257 1.2195 × 10 4 T 6.053 × 10 6 T 2 + 4.4621 × 10 9 T 3
(Hua et al. [23])
Thermal expansion α s = ( 12 + 0.008 T ) × 10 6    20   ° C T 600   ° C (Zhang et al. [24])
Elasticity E s ( T ) E s = 1 1.87 × 10 5 ( T 20 ) 2.41 × 10 6 ( T 20 ) 2    0   ° C T 600   ° C (Fan et al. [25])
Note: “σp(σ,T)” represents the stress of prestressing bar and “εyT” indicates the strain of prestressing bar at high temperature; “σb(σ,T)” represents the proportional limit stress of prestressing bar and “εbT” indicates the proportional limit strain of prestressing bar within the limit of proportionality at high temperature; “f0.2(σ,T)” represents the offset yield stress of prestressing bar and “ε0.2T” indicates the offset yield strain of prestressing bar at high temperature; “fpu(σ,T)” represents the break stress of prestressing bar and “εpuT” indicates the break strain of prestressing bar at high temperature, εpuT = 0.55; “f0.2(T)” represents the yield strength of prestressing bar and “fptk(T)” indicates the ultimate strength of prestressing bar at high temperature; “f0.2(T)” represents the yield strength of prestressing bar and “fptk(T)” indicates the ultimate strength of prestressing bar at normal temperature.
Table 6. Calculation results of fire resistance of prestressed concrete T-beams.
GroupsFire ModesFlange Plate Thickness Y/mmPrestressing Bar Ratio
P%
Concrete Thickness a/mmConcrete Strength Cload
Rate n
Fire
Resistance/min
D1H11200.131635400.4141
H21200.131635400.4176
H31200.131635400.4\
H41200.131635400.480
H51200.131635400.444
H11200.131635400.6106
H21200.131635400.6135
H31200.131635400.6\
H41200.131635400.657
H51200.131635400.620
H11200.131635400.872
H21200.131635400.8100
H31200.131635400.8\
H41200.131635400.838
H51200.131635400.810
D2H11200.000035400.4102
H11200.065835400.4132
H11200.131635400.4141
H11200.197435400.4150
H11200.263235400.4159
H11200.329035400.4166
H11200.000035400.678
H11200.065835400.698
H11200.131635400.6106
H11200.197435400.6115
H11200.263235400.6122
H11200.329035400.6131
H11200.000035400.848
H11200.065835400.864
H11200.131635400.872
H11200.197435400.882
H11200.263235400.890
H11200.329035400.898
D3H1900.131635400.4123
H11200.131635400.4141
H11500.131635400.4150
H11800.131635400.4157
H1900.131635400.688
H11200.131635400.6106
H11500.131635400.6115
H11800.131635400.6120
H1900.131635400.850
H11200.131635400.872
H11500.131635400.880
H11800.131635400.884
D4H11200.131635300.4129
H11200.131635400.4141
H11200.131635500.4172
H11200.131635600.4220
H11200.131635300.697
H11200.131635400.6106
H11200.131635500.6140
H11200.131635600.6196
H11200.131635300.866
H11200.131635400.872
H11200.131635500.8112
H11200.131635600.8172
D5H11200.131615400.485
H11200.131625400.4110
H11200.131635400.4141
H11200.131645400.4170
H11200.131615400.658
H11200.131625400.679
H11200.131635400.6106
H11200.131645400.6130
H11200.131615400.832
H11200.131625400.854
H11200.131635400.872
H11200.131645400.8100
Disclaimer/Publisher’s Note: The statements, opinions and data contained in all publications are solely those of the individual author(s) and contributor(s) and not of MDPI and/or the editor(s). MDPI and/or the editor(s) disclaim responsibility for any injury to people or property resulting from any ideas, methods, instructions or products referred to in the content.

