1. Introduction
Lithium-ion batteries (LiBs) are at the heart of electric vehicles (EVs). Despite their many advantages such as compact size, high charge and discharge efficiency, high usable capacity, and the ability to tolerate deep cycling, LiBs require careful voltage monitoring for safe operation, and their operating conditions must also be controlled to prevent temperature extremes. Thermal management is an important aspect of EV battery packs, and the heat generated during battery operation needs to be effectively removed from the system so as to maintain the cell temperature within prescribed limits. Hence, LIBs employ a battery management system (BMS) to maintain individual cells within safe operating limits of voltage, current, and temperature. Many BMS aspects have been covered in the literature [
1,
2,
3], in which researchers investigated the role of various parameters to improve thermal performance and safety, increase battery life, and reduce maintenance costs. However, one key area which has remained a significant challenge is capacity imbalance within a series/parallel lithium-ion battery pack over its lifetime. This imbalance can result from thermal gradients, current flow discrepancies caused by terminal connections, or inherent differences in individual cell impedance due to cell manufacturing discrepancies [
4]. In addition, heat generation rates can vary based on the cell type and even across cells of the same type within a pack [
5,
6]. The conventional method to deal with such imbalance is oversizing the passive or active electrical balancing components, which results in a suboptimal system. Compounding the problem is the tendency for cell capacity to fade at a faster rate after a high number of cycles (>600, saturation degradation stage) is reached [
7]. Failure to adequately balance cells can lead to poor charge and discharge rate performance, a drastically reduced battery pack lifespan, and even thermal runaway.
The two primary strategies for achieving a balanced battery pack are active balancing in which cells may be charged or discharged to obtain the same voltage within a pack, and passive balancing which involves only discharging cells. Ziegler et al. [
8] published a comparison study between active and passive balancing and found that active balancing performed better over 1000 cycles than passive balancing but at the cost of added complexity and the energy used to perform the voltage balancing process.
One important practical aspect of battery pack construction is reducing thermal gradients within the groups of cells inside the pack. For economic and safety reasons, often there is a series or parallel cooling loop with a single chiller for the entire pack. Liu et al. [
9] studied the thermal gradients within battery packs and determined that cells near the interconnect terminals experience higher currents than cells in the center of a parallel group of cells. This led to conclusions about how the resulting thermal gradients affected cell-to-cell imbalance that are used as the basis for our work.
Thermal effects on LiBs [
10] have been well studied in the literature. For example, Nemati et al. [
11] demonstrated that the thermal environment has a huge impact on battery degradation within a commercial battery pack. They used electrochemical impedance spectroscopy at different operating temperatures as a diagnostic tool and their results confirmed an increase in solvent resistance and significant thickening of the solid electrolyte interphase (SEI) at high and low temperatures, respectively. Yang et al. [
12] proposed a coupled electrochemical–thermal–mechanical model for LiB aging. Their model predicted that high ambient temperature caused the SEI layer to increase in thickness, low ambient temperature was responsible for anode plating, and high C-rates led to cathode material loss. Yuksel and Michalek [
13] linked the variation of battery electric vehicle range and efficiency with ambient temperature which would impact the cooling design. In [
14], Zhao et al. modified an air-cooled thermal management system by incorporating evaporative cooling to increase heat dissipation and extend the use of LiBs in harsher environments. Giuliano et al. [
15] designed and fabricated an air-cooled LiB thermal management system with metal-foam-based heat exchanger plates. Their experiments showed that an airflow of 1100 mls
−1 per cell ensured that the temperature rise of the coolant air was less than 10 °C over ambient even for 200 A charge/discharge cycles and the power required to drive the air through the heat exchanger was less than a conventional liquid-cooled thermal management system.
However, current LiB thermal management research has focused more on liquid cooling. Xu et al. [
16] focused on designs to enhance temperature uniformity and proposed a methodology to minimize temperature differences across an automotive battery pack by optimizing a serpentine channel design for liquid cooling. Wang et al. [
17] conducted an optimization study for cooling a LiB module composed of 90 cylindrical cells. They concluded that, of the three main types of battery thermal management systems (air cooling, liquid cooling, and phase change material cooling), liquid cooling systems are the most popular and practical in EVs because of their high cooling efficiency. They numerically studied the effect of many parameters such as channel geometry, water inlet velocity and temperature, contact angle, width of the plates, and flow direction.
In a recent review, Fayaz et al. [
18] summarized the role of thermal design parameters such as the maximum temperature of the cell and/or battery module, uniformity of cell temperature, the magnitude of temperature differences, coolant inlet temperature, flow velocity, and pressure drop for LiB thermal management systems. They also examined various studies that conducted structural design optimization in which the type of flow channel, channel number, channel configuration and geometry, and cell-to-cell spacing were the design parameters. The studies were conducted for various thermal management systems such as air cooling, water cooling, and the use of phase change materials and heat pipes. One important note in this review paper is that the optimal operating temperature range for LIBs was determined to be 25–40 °C and that the temperature difference between cells should be less than 5 °C. In practice, such a small margin may be difficult to achieve in long series-cooling loops. Several optimization methods to keep the operating temperature within the ideal range are discussed. Genetic algorithms use the Darwinian theory of evolution to create responses to specific thermal problems [
18]. Another unique and fairly recent optimization method is particle swarm optimization which is inspired by the cooperative behavior exhibited by animals to find an optimal solution [
18]. There have also been attempts to use hybrid approaches to cooling systems, such as combining liquid plate cooling with phase change materials. One main conclusion of this review paper was that liquid cooling is much more effective than air cooling due to the former’s high convective heat transfer coefficient. Therefore, liquid cooling is a better option to improve the LiB’s thermal efficiency and overall battery performance.
In our study, we examine a new concept of actively controlling the temperature of each individual cell group connected electrically in series during charge and discharge cycles. This approach differs from the current practice in which a chiller unit drives the coolant through the entire battery pack using a series/parallel cooling circuit without any thermal control at the individual cell group level. The primary benefit of this novel approach is the ability to maintain a capacity balance across the series cell groups purely by thermal control to increase the useful life of the pack.
2. Experimental
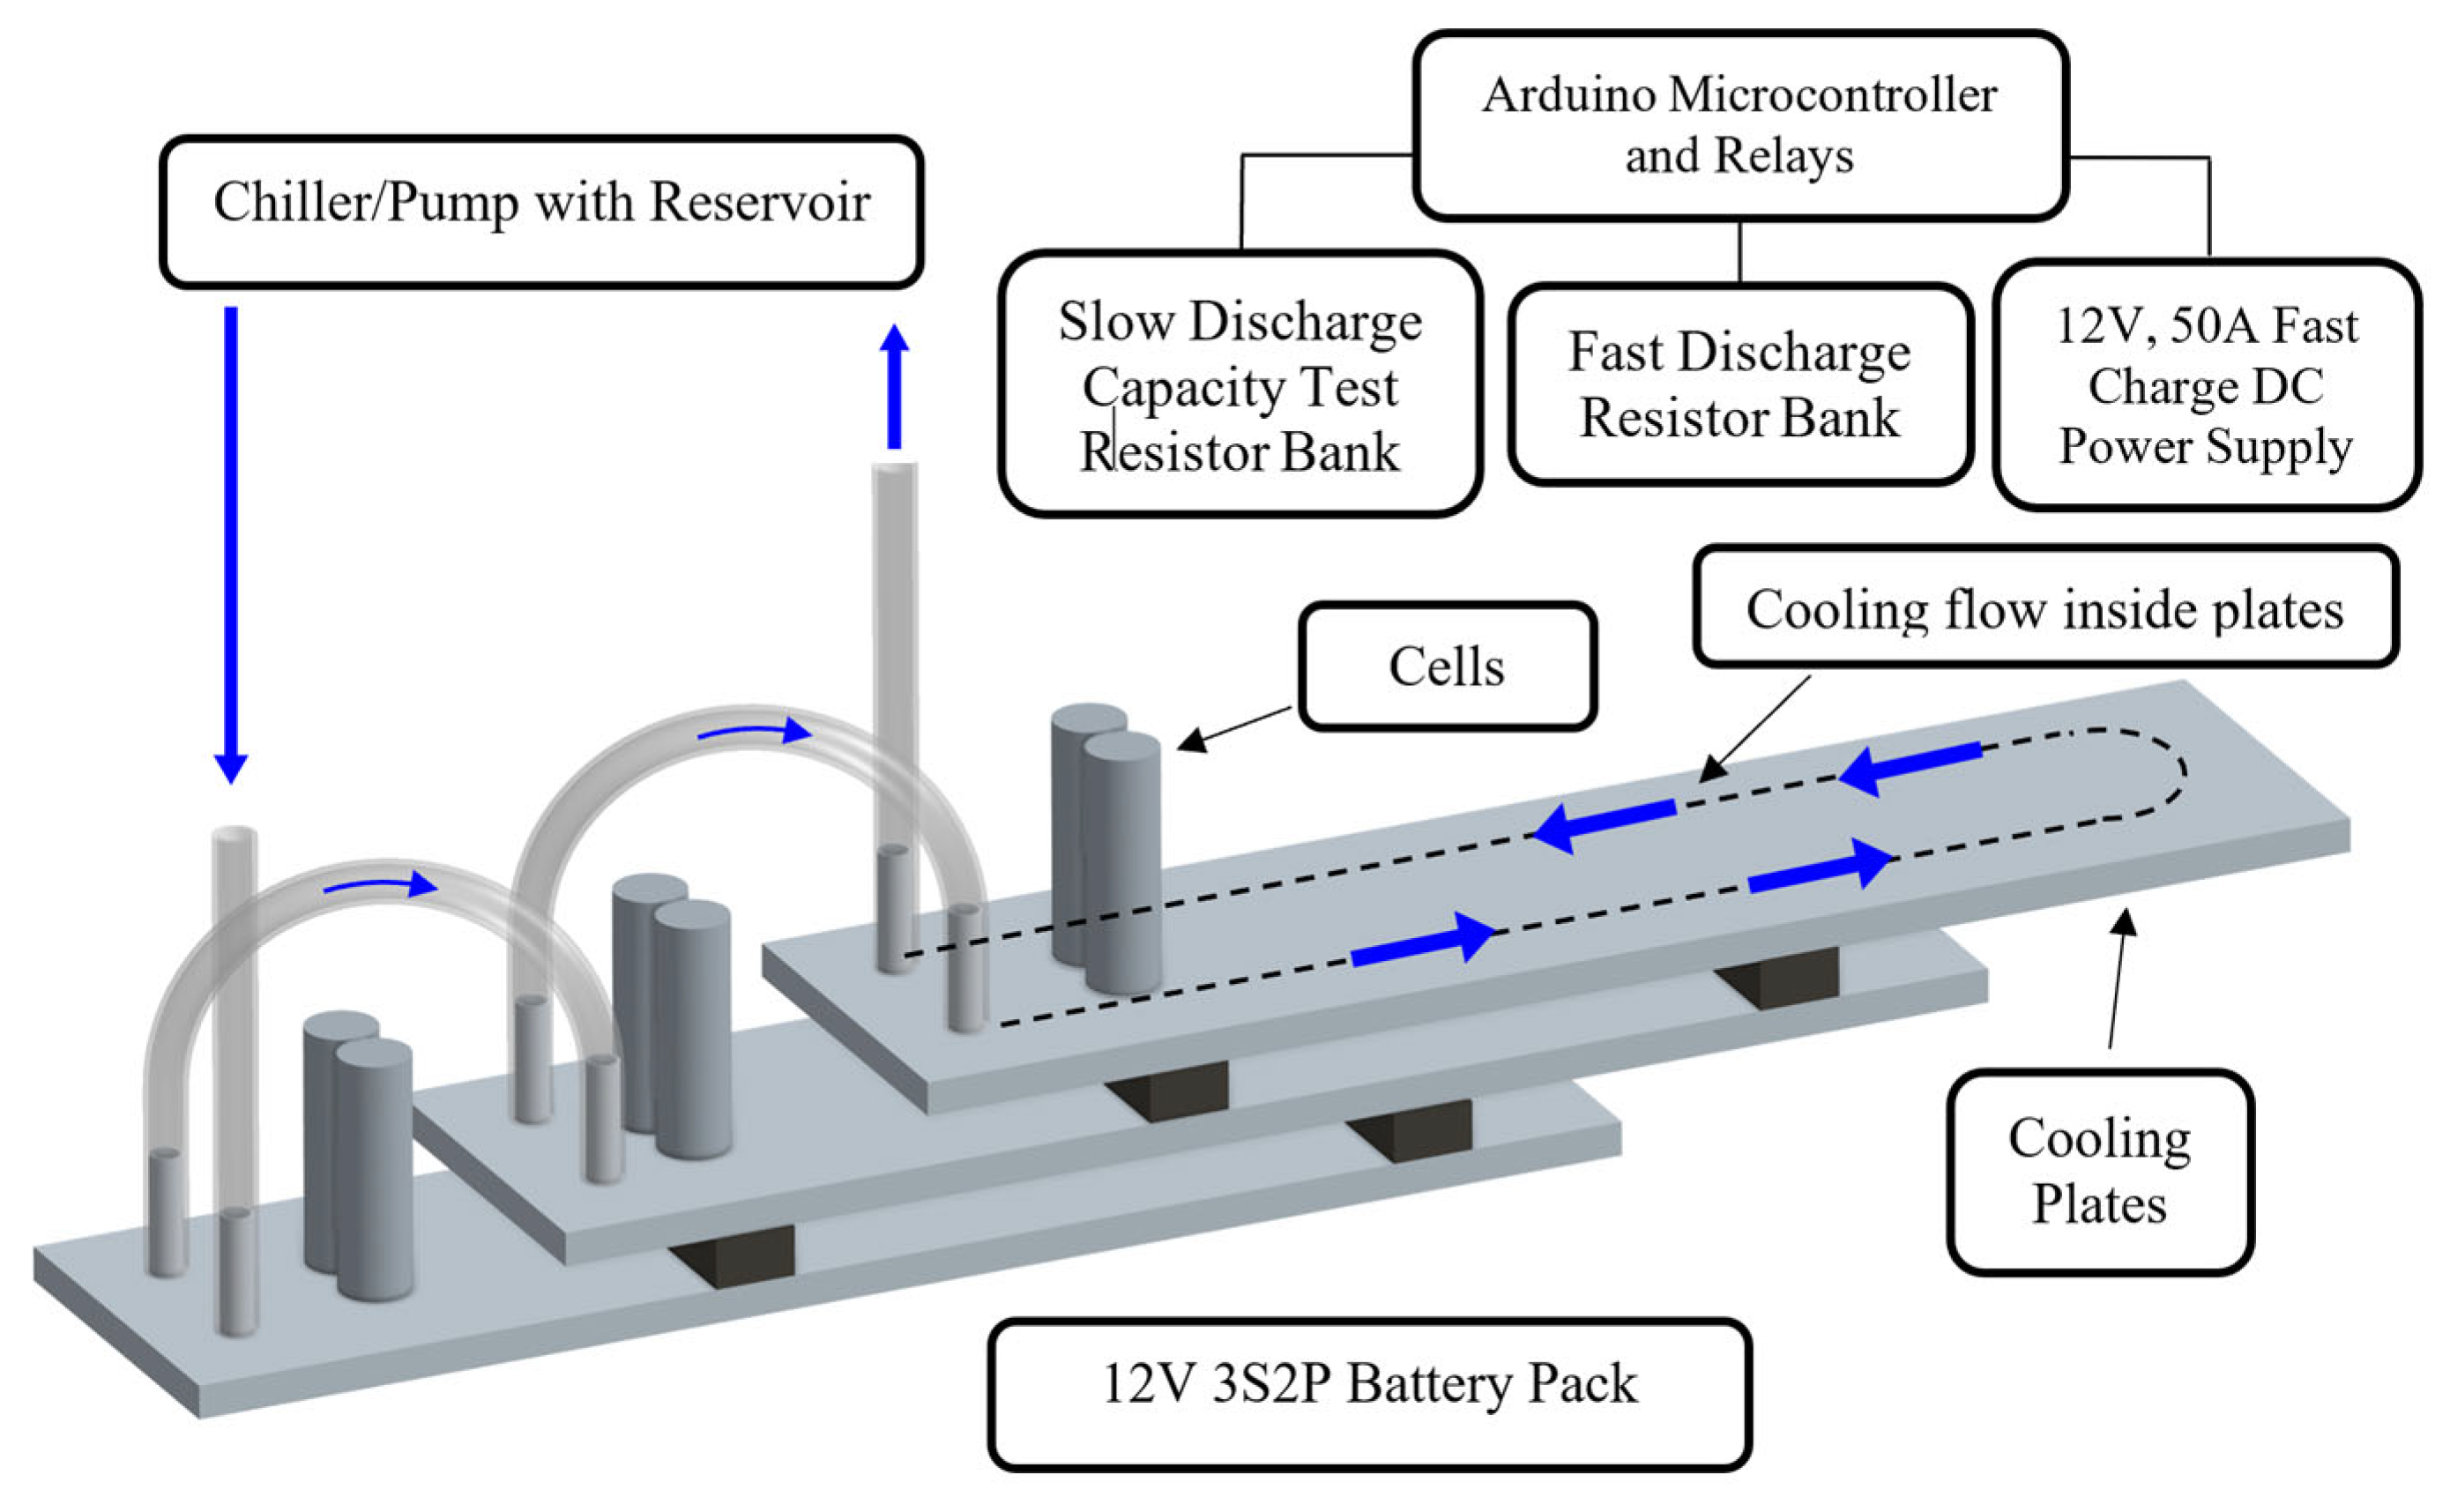
Figure 1 shows the experimental setup, consisting of six cells with three cooling plates. Using groups of two parallel cells allowed for small initial differences in capacity to be minimized.
Cell Selection and Cooling Plates—Molicel INR-21700-P42A [
19] cylindrical lithium-ion cells were used for the experiment due to their high discharge rating (45 A continuous). Cooling plates were obtained by disassembling a Smart Fortwo electric car battery pack and repurposing them for this experiment. Nylon spacers were placed between the cooling plates to electrically insulate them from each other and eliminate the risk of a short circuit in the pack. An image of the experimental setup with epoxy-bonded cells is shown in
Figure 2.
Series/Parallel Battery Pack Assembly—The experimental battery pack comprised six 21700-type cells (21 mm diameter, 70 mm height). The nominal capacity and voltage of each cell was 4.2 Ah and 3.6 V, respectively [
8]. The pack was assembled into a 3 series, 2 parallel (3S2P) configuration. Three groups of cells in series were chosen to enable electrical measurements of a pack with cell groups located at the negative and positive terminal ends, as well as a middle-sandwiched cell group, in addition to their thermal aspects. Having two cells in parallel within each group reduced the capacity variability across groups due to manufacturing discrepancies in individual cells. The cells were thermally bonded to the cooling plates by spot welding nickel tape (40 mm long × 10 mm wide × 0.2 mm thick) first to the negative side of the cylindrical shell casing (overlapping the diameter by a large margin), and then directly spot welding the overlapping nickel tape to the cooling plates. This method ensured excellent thermal contact between the cells and base plates, as nickel has a thermal conductivity of about 97 W/mK. In addition to spot welding, steel-reinforced epoxy was used to strengthen the physical bond between the base of the cells and the cooling plates. The thermal conductivity of epoxy by itself is quite low (<1 W/mK), which is why the nickel spot welding technique was employed. One difference between this experimental setup and a typical commercial battery pack is that we could incorporate a metal-to-metal connection between the cell casing and cooling plates as the cooling plates are electrically insulated from each other. In commercially produced packs, an electrically insulating layer must be inserted between the cell casing and cooling plate because many groups of cells are mounted in series onto the same cooling plate. In our case, we employed multiple cooling plates since our goal was to achieve the best possible thermal contact between the cell and the plate.
Electronics—An Arduino Uno (Arduino AG, Scarmagno, Italy) was used as a simple microcontroller to control the relays and log data to a serial monitor via USB. Small relays (10 A) were used for capacity measurement while large relays (100 A) were used for high-current cycling. Voltage sensors (3-01-1125, HiLetgo, Shenzhen, China) were used to monitor voltage to within 4.89 mV resolution. Ohm’s law was used to calculate the current from the known resistance and voltage values. A 5 s time step was used for data acquisition. Nine digital thermometers (DS18B20, Gikfun, China) were used to monitor temperatures with ±0.5 °C accuracy. In the DS18B20 specification manual [
20], a typical error curve is shown in
Figure 1, detailing the tendency for below-actual temperature readings at low temperatures and above-actual temperature readings at high temperatures, but all fall well within the 0.5 °C specification. Three digital thermometers were used to monitor the temperatures of the three cell groups by placing one thermometer at the top-center of each pair of cells and securing it with electrical tape. Three thermometers were used to monitor the temperatures of the three cooling plates by attaching one thermometer to the flat side of each plate. The three remaining thermometers were used to monitor the ambient temperature, the chiller water reservoir temperature, and the resistor bank reservoir water temperature (used for cooling the high C-rate discharge resistors).
Thermal Control—A 30 W submersible pump (Growneer, WP550-3, Amazon, Bellevue, WA, USA) was used to pump water through the cooling plates at approximately 8 L/min. The submersible pump was placed in the cooling reservoir of the chiller (Nestlab RTE 740, Thermo Fisher Scientific, Waltham, MA, USA) which was set to 15 °C. Clear polyethylene tubing (3/8-inch ID) was used to supply chilled water from the pump to the cooling plates. In addition, the resistor load bank was submerged in a chilling reservoir, which maintained a constant temperature thereby preventing a change in resistance after the current began flowing during discharge. Without this precautionary step, the rapid rise in resistor temperature would have resulted in a resistance change which would have impacted the voltage measurement, and thus the accuracy of the capacity measurement.
Cycling Parameters—Cells within the 12 V pack were charged using a 12 V, 50 A switching power supply (s-XHD12V, Mieshile, Amazon, Bellevue, WA, USA) which resulted in an approximate 3C average charge rate per cell (see Molicel data sheet [
19] for charge curves). The voltage was fixed at 12 V while the current varied according to the state-of-charge (current starts high at the beginning of charge and then tapers off as state-of-charge increases). This fixed 12 V charging supply resulted in each cell group being charged to approximately 4 V (or ~90% SOC). This was performed deliberately to allow a safety factor to prevent any group from exceeding 4.20 V, given the potential for slight imbalances between cell groups. If the power supply was instead set to 12.6 V, then any voltage imbalance would cause some cell groups to exceed 4.20 V, a potentially dangerous situation. The battery pack was discharged using a bank of 16 1-ohm resistors, with an 8 parallel, 2 series configuration. This created an equivalent resistance of 0.25 ohm, which resulted in an average 5C discharge rate per cell. This setup, consisting of a fixed voltage power supply along with a fixed load resistance, although simple, was adequately designed and equipped to conduct the proposed experiments. These high rates of charge and discharge were chosen to deliberately stress the cells and also to complete the experiment consisting of 100 cycles within a reasonable timeframe. During discharge, the stopping criterion for the end of the cycle was determined to be 2.5 V per cell group under load, which resulted in a steady-state voltage of approximately 2.9 V per cell group once the load was removed and 10 min had passed. The discharge stoppage point was automated by commanding the Arduino microcontroller to open the main discharge relay once the voltage of any group of cells reached 2.5 V.
For capacity measurements, each cell group was discharged over a 1-ohm resistor for a 1C discharge rate capacity test. Capacity measurements were first performed at the outset before starting fast cycling, and then again after 25, 50, 75, and 100 cycles. Two additional capacity tests were conducted after the 10th and 85th cycles to assess cell group capacities prior to completing 25 full cycles.
3. Results
Five calibration cycles were performed at the beginning of the experiment to determine the temperature rise of the cells, cooling plates, and water reservoirs during charge and discharge. A high level of temperature uniformity was expected across all three cell groups (denoted as CG1, CG2, and CG3) due to the high flow rate of water through the system.
Figure 3 confirms that all three cell groups stayed within about 1 °C of each other for the duration of this 5C-rate discharge.
It should be noted that although the cooling water was pumped through the system during this calibration cycle, the chiller was not turned on as with subsequent test cycles. All three cell groups started at a room temperature of 20 °C and rose to approximately 43 °C during the 400 s discharge. As the chiller reservoir was reasonably large, its temperature only rose from about 16 °C to 18 °C during this period. The resistor water reservoir temperature rose from about 14 °C to 18 °C. The resistor reservoir did not require active cooling during the initial calibration cycles since its maximum temperature was verified to not exceed 35 °C. Another calibration test was performed to ensure voltage uniformity of the three groups throughout discharge. It was confirmed that the voltage difference between cell groups did not exceed 0.1 V during discharge.
After performing the calibration cycles, the chiller was turned on and the system was set up to run autonomously for 100 charge/discharge cycles. The average maximum temperature of actively cooled cells during charge was 27 °C, compared with un-cooled cells which reached a maximum of 34 °C during charge. During discharge, the peak average temperature for cooled cells reached 40 °C, compared to un-cooled cells which reached 45 °C.
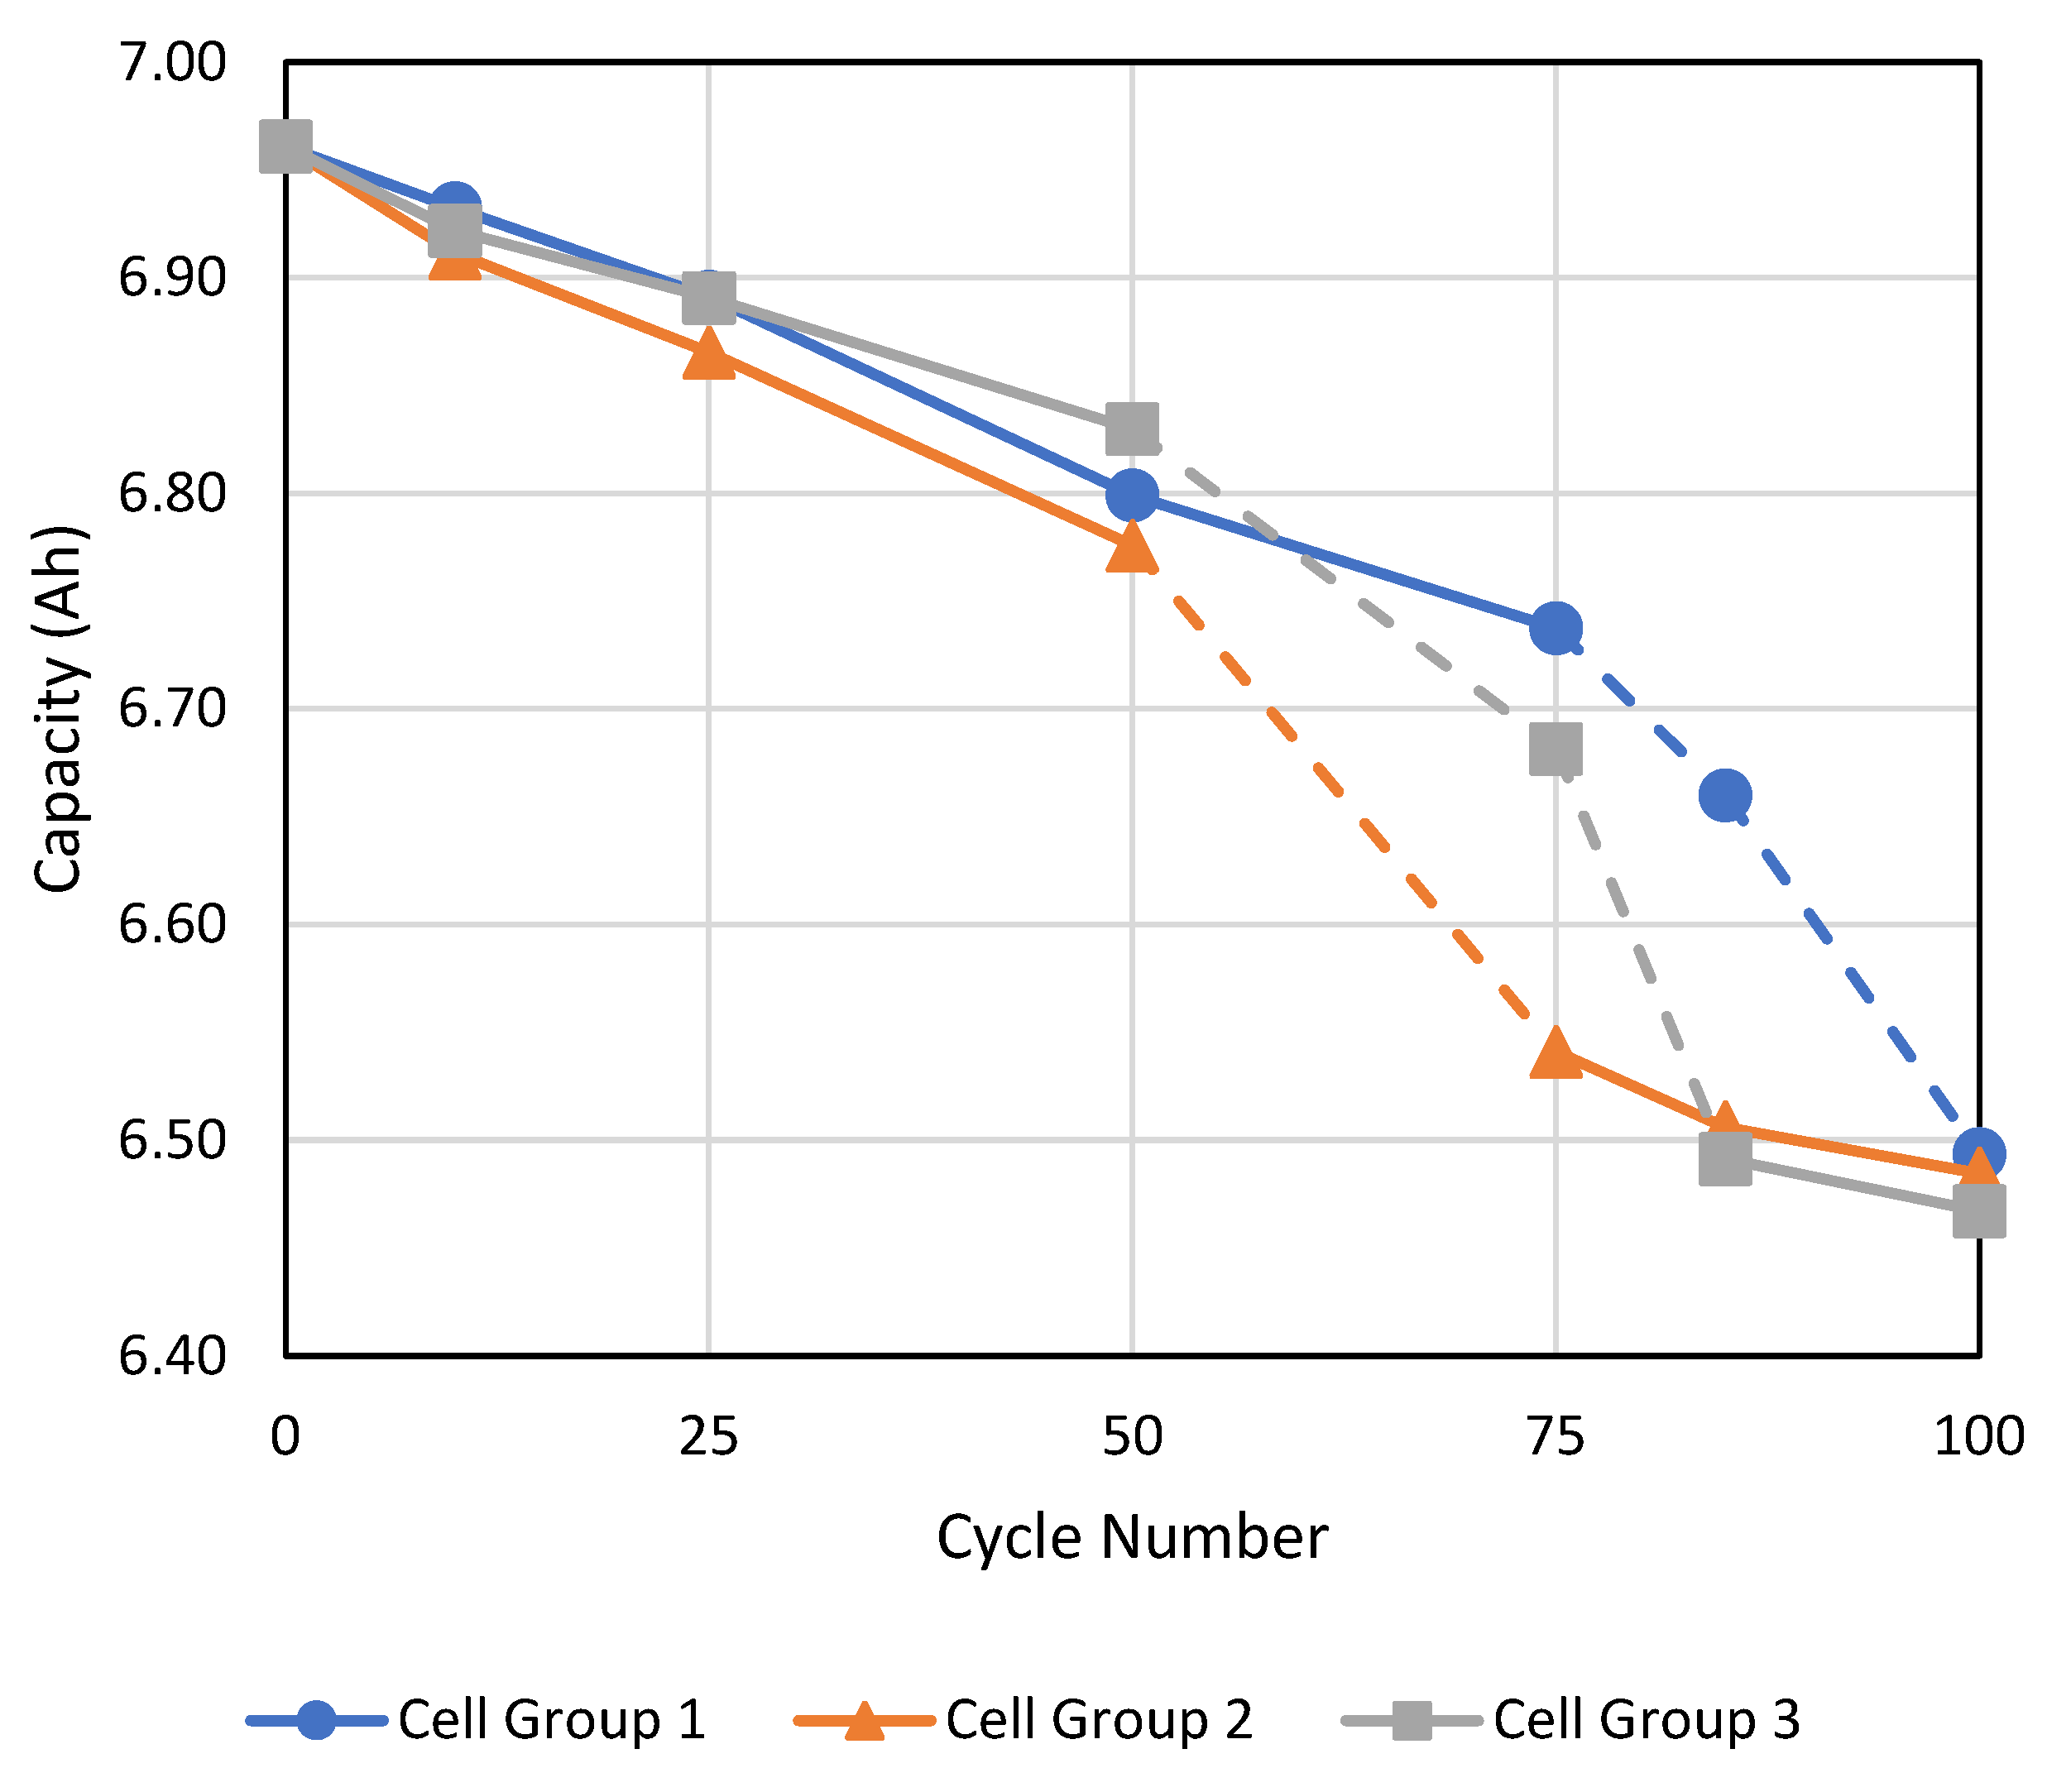
Figure 4 shows the capacity degradation of each cell group throughout the experiment. Since each cell group had two cells in parallel and the voltage ranged from 4.0 V down to 2.9 V under load, the starting capacity before the first fast cycle test (denoted as the 0th cycle) was just under 7 Ah for each cell group (the manufacturer’s specification sheet stated 4.2 Ah per cell for a voltage range of 4.2 V to 2.5 V [
19]). This voltage range was chosen to deliberately not span the full voltage range to ensure a safety margin in case the cells became unbalanced. This was especially important to restrict the cells below 4.2 V to prevent a thermal runaway. The accuracy of the capacity measurement was estimated to be approximately 0.03 Ah after repeated testing on the same cell group.
For the first 50 cycles, all three cell groups were actively cooled with the chiller reservoir set to 15 °C. The capacity of all cell groups declined steadily at about 3 mAh/cycle but remained within ±0.03 Ah of the mid-range value (CG1) which is within the capacity measurement accuracy. Hence, it can be inferred that there is no significant difference between cell group capacities after the first 50 cycles.
In order to deliberately induce a capacity imbalance, from the 50th to 75th cycle, only CG1 was cooled while CG2 and CG3 were not cooled. This resulted in a faster degradation rate of about 8 mAh/cycle for the two latter groups, as shown in
Figure 4 while CG1 continued to degrade at the same slower rate of 3 mAh/cycle. The higher degradation rate is due to a significantly higher operating temperature of the cell which causes the thermal breakdown of various components of the cell (for example: anode, cathode, electrolyte, and SEI layer breakdown). At this point, in order to restore capacity balance within the pack, we stopped cooling for CG1 as it had the highest capacity and resumed cooling for only CG2 as it had the lowest capacity. The capacity measurement at the 85th cycle revealed that CG2′s degradation rate had slowed to the original rate of about 3 mAh/cycle, while CG1′s degradation rate had accelerated to about 8 mAh/cycle. As
Figure 4 shows, both CG2 and CG3 had capacities within 0.03 Ah at the 85th cycle, hence cooling was also resumed for CG3, while CG1 still had significantly higher capacity so cooling for CG1 was not resumed. By the 100th cycle, all three cell groups were brought back into balance (within 0.03 Ah). The cells retained about 93% of their original capacity, based on using the 2.9–4.0 V as the voltage range for determining capacity. The reason for the large capacity fade after only 100 cycles was due to the high charge and discharge rate employed, in addition to uncooled cell groups (depending on the cycle number) during cycling. Typical current LIBs tend to last at least 500 cycles before dropping below 80% state of health (SOH), but these are estimated based on typical average charge and discharge rates of 1C. Even though we are not utilizing the full SOC range in this experiment, the severe capacity degradation in only 100 cycles observed in our experiments may be attributed to the extremely high discharge and very high charge rates employed here.
Since we are applying thermal control based on feedback from capacity measurements, it is appropriate to denote our protocol as “adaptive thermal control”.
4. Discussion
It is important to note some of the practical challenges while implementing thermal control for individual cell groups for future studies and the potential commercialization of this method. First, it is important to electrically isolate each series group along with its cooling plate to avoid shorting along the termination points. A series cooling loop is possible, but it must be ensured that the coolant is not electrically or ionically conductive, and a non-conducting pipe is used between each series group. To our knowledge, no previous studies have performed such thermal-based capacity balancing, so it is not possible to draw direct comparisons between our results and other prior work.
Furthermore, thermal control of individual cell groups could be accomplished with a system of valves and a bypass pipe as shown in
Figure 5 [
16]. instead of individual coolant pipes going to each cell group. Essentially, an optimization strategy such as the one used in [
18] could be used to control the amount of cooling applied to each parallel stack of cells. This arrangement would enable an autonomous system that would use capacity feedback to adaptively control the temperature of specific cell groups. One challenge is that a capacity measurement of each individual parallel cell group would need to be recorded periodically (every 10–20 cycles) at a low C-rate for accuracy. Cooling for each cell group would then be adjusted for the next interval of cycling before repeating the capacity check. This would involve a more complex electronic BMS system that has accurate capacity measurement, such as the method used in our study with a slow 1C discharge rate.
An alternative method to maintaining cell-to-cell capacity balance throughout the lifetime of a battery pack is to consider installing “disconnecting” fuses on a certain number of parallel cells in a pack. For example, consider the Tesla Model S 5.3 kWh battery module, which consists of 444 18650 cylindrical cells. These are arranged in 6 series groups of 74 parallel cells (6S74P) with friction-welded fuses inserted between each cell and the main busbar. Some of these fuses could then be replaced with a controllable fuse/relay which could be activated by a microcontroller. Let us now consider a situation where one of the groups of 74 parallel cells has lost a significant amount of capacity in the mid- to end-of-life of the pack. At that point, several of these controllable relays from cells in the other 5 groups which have higher capacity could be opened, equalizing the capacity between all 6 groups, and restoring functionality to the module again which does not take an inordinate amount of time to balance during charge or after discharge. However, this method has a major drawback in removing functional cells from the pack and having them ride along in the EV as dead weight. Therefore, the extra upfront cost and space allocated to an adaptive thermal control implementation could have high utility.
This type of adaptive cooling configuration would be particularly well suited to grid storage applications where space is not as much of a constraint as in EVs. One drawback of this approach is that it would take up more space than existing series cooling methods and incur a higher initial capital cost. However, this could be offset by the increase in the lifespan of battery packs, especially for grid storage.
As an example of a basic preliminary techno-economic analysis, we consider this adaptive thermal control method applied to the Tesla module of 444 cells mentioned above. Current information acquired from the Tesla Motors Club forums [
21] is that the EV packs tend to last ~250,000 miles before needing replacement. The pack replacement costs
$22,000 on average [
21], and there are 14 modules per pack, giving an average module cost of
$1571. In a recent study, Niu et al. [
22] determined that when the battery packing unit price is below 1800 ¥/kWh (~
$262 USD/kWh), a grid-connected energy storage system (ESS) can provide a positive return on investment within 5 years. Thus, deploying balanced battery modules directly in a grid-tied ESS application can significantly improve economics after the SOH reaches 80% in the electric vehicle (typical end-of-life for that application). A more detailed techno-economic analysis is necessary to gain deeper insights into the feasibility of implementing such functionality in an actual EV battery and subsequent second-life repurposing for a grid-connected ESS.

