1. Introduction
The demand for high-speed and high-precision machine tools has increased due to the increasing demands from different industries, including defense, aircraft, computers, communications, and consumer electronics. Tool manufacturing design is particularly important to achieve high speed and precision. Presently, computer-aided design is usually used in designing machine tools because it does not necessitate producing, processing, assembling the casting, or identifying areas of the structure that contribute to reduce the cost of development, shortening the development time. CNC machine tools are the most important tools in modern manufacturing, and they are widely utilized in the automobile, ship, aircraft, and other equipment manufacturing industries. The issue of machining precision has always been an active and difficult research problem [
1,
2,
3].
Bilgili et al. [
4] suggested a computationally efficient multi-body dynamics model for five-axis machine tools that proved to be 90% faster than previous structural multi-body models. Tian et al. [
5] proposed a topology optimization method, which was used to optimize the jacket structure by changing the structural layout to improve its design, minimize weight, and reduce cost. The maximum stress was reduced by 9.6%, and the stress distribution was more uniform, effectively reducing the stress concentration. Lee et al. [
6] presented a numerical study of a solar air collector with and without thermal storage. The collector’s performance was evaluated using a validated mathematical model, and the results showed that the collector’s efficiency increased with an increase in the mass flow rate and the size of the collector. The thermal storage system improved the collector’s thermal performance by increasing the outlet air temperature, and it also helped to maintain the outlet air temperature when solar radiation was low. The study found that the maximum efficiency achieved for the collector with thermal storage was 80.9%, while that of the collector without storage was 64.5%. The method for optimizing the topological design of composite structures is presented by Zhao et al. [
7]. In this method, the stiffness and vibration modes, among others, can both be optimized at the same time by using a coupled level set and a moving morphable component approach. The performance of a cantilever beam and a wing structure was significantly enhanced after being designed using the proposed method. Both the stiffness and the first natural frequency of the cantilever beam were improved by 34% and 20%, respectively. Both the torsional stiffness and the first natural frequency of the wing’s structure were improved by 17% and 14%, respectively. The results of the research showed that the proposed method was useful for designing high-performing multifunctional composite structures. Han et al. [
8] proposed a topology optimization method to minimize the maximum stress of multi-material structures with graded interfaces. The topology results revealed that the maximum stress could be effectively reduced compared to that using the stiffness design. Wang et al. [
9] suggested an integrated optimization design method for structural topology and embedded heat source layout. By using the velocity field-level set method, multiple constraints and two design variable problems were solved using a general optimizer. The proposed multi-objective optimization obtained a reasonable compromise between the two related physical properties.
Another important thing to think about when designing the structure of a machine tool is its dynamic performance. A modal analysis finds the shapes of the fundamental vibration modes and the frequencies that go with them. Moreover, natural frequency is a measure of how stiff a structure is when it is in motion [
10]. In the classical precision machine tool design, the machine operation frequency is usually higher than the first natural frequency [
11]. The harmonic response analysis can determine whether or not the designs will be able to overcome resonance and the negative impacts of forced vibrations [
12]. The micro machine tool has been the subject of much research, development, and production. When designing a five-axis ultra-precision micro milling machine tool, Huo et al. [
13] took a comprehensive dynamic approach to conceptualizing and designing the machine. Dong et al. [
14] studied an electromechanical–hydraulic design method based on co-simulation and showed that it could accurately reflect the actual situation. Shengqin et al. [
15] established a finite element analysis model of the car body, calculated its bending and torsional strength according to the actual situation, and finally optimized its structure. Zhao et al. [
16] redesigned the rib of the column based on the principles of bones and plant stems to improve the static and dynamic performance of the column. Triebe et al. [
17] achieved energy savings by reducing the weight of the machine worktable and conducting studies on a three-axis vertical milling machine. Liu [
18] studied a multi-objective optimization design method for machine tool structural parts, which also had strong reference values for the multi-objective optimization designs of other mechanical parts. Shen et al. [
19] established a new dynamic design optimization method by using both structural topology design optimization techniques and dynamic sensitivity analysis, while considering both members and contact parts. The proposed design method was beneficial to the machine tool’s product upgrade design and contributed to the effective improvement of the machine’s dynamic performance. Shindo et al. [
20] developed a completely new structure for surface profile grinders by violating basic design rules and using topology and shape-optimization methods to pursue the ideal structure. Deng et al. [
21] improved the optimization efficiency by using the orthogonal experiment method. Hung et al. [
22] investigated the machining stability by using the integrating spindle unit model [
23,
24,
25], while considering the machine frame’s structure [
26,
27]. Tzu-Chi Chan et al. [
28] investigated and the recorded three small five-axis machine tools’ temperature, spindle current, and vibration real-time signals.
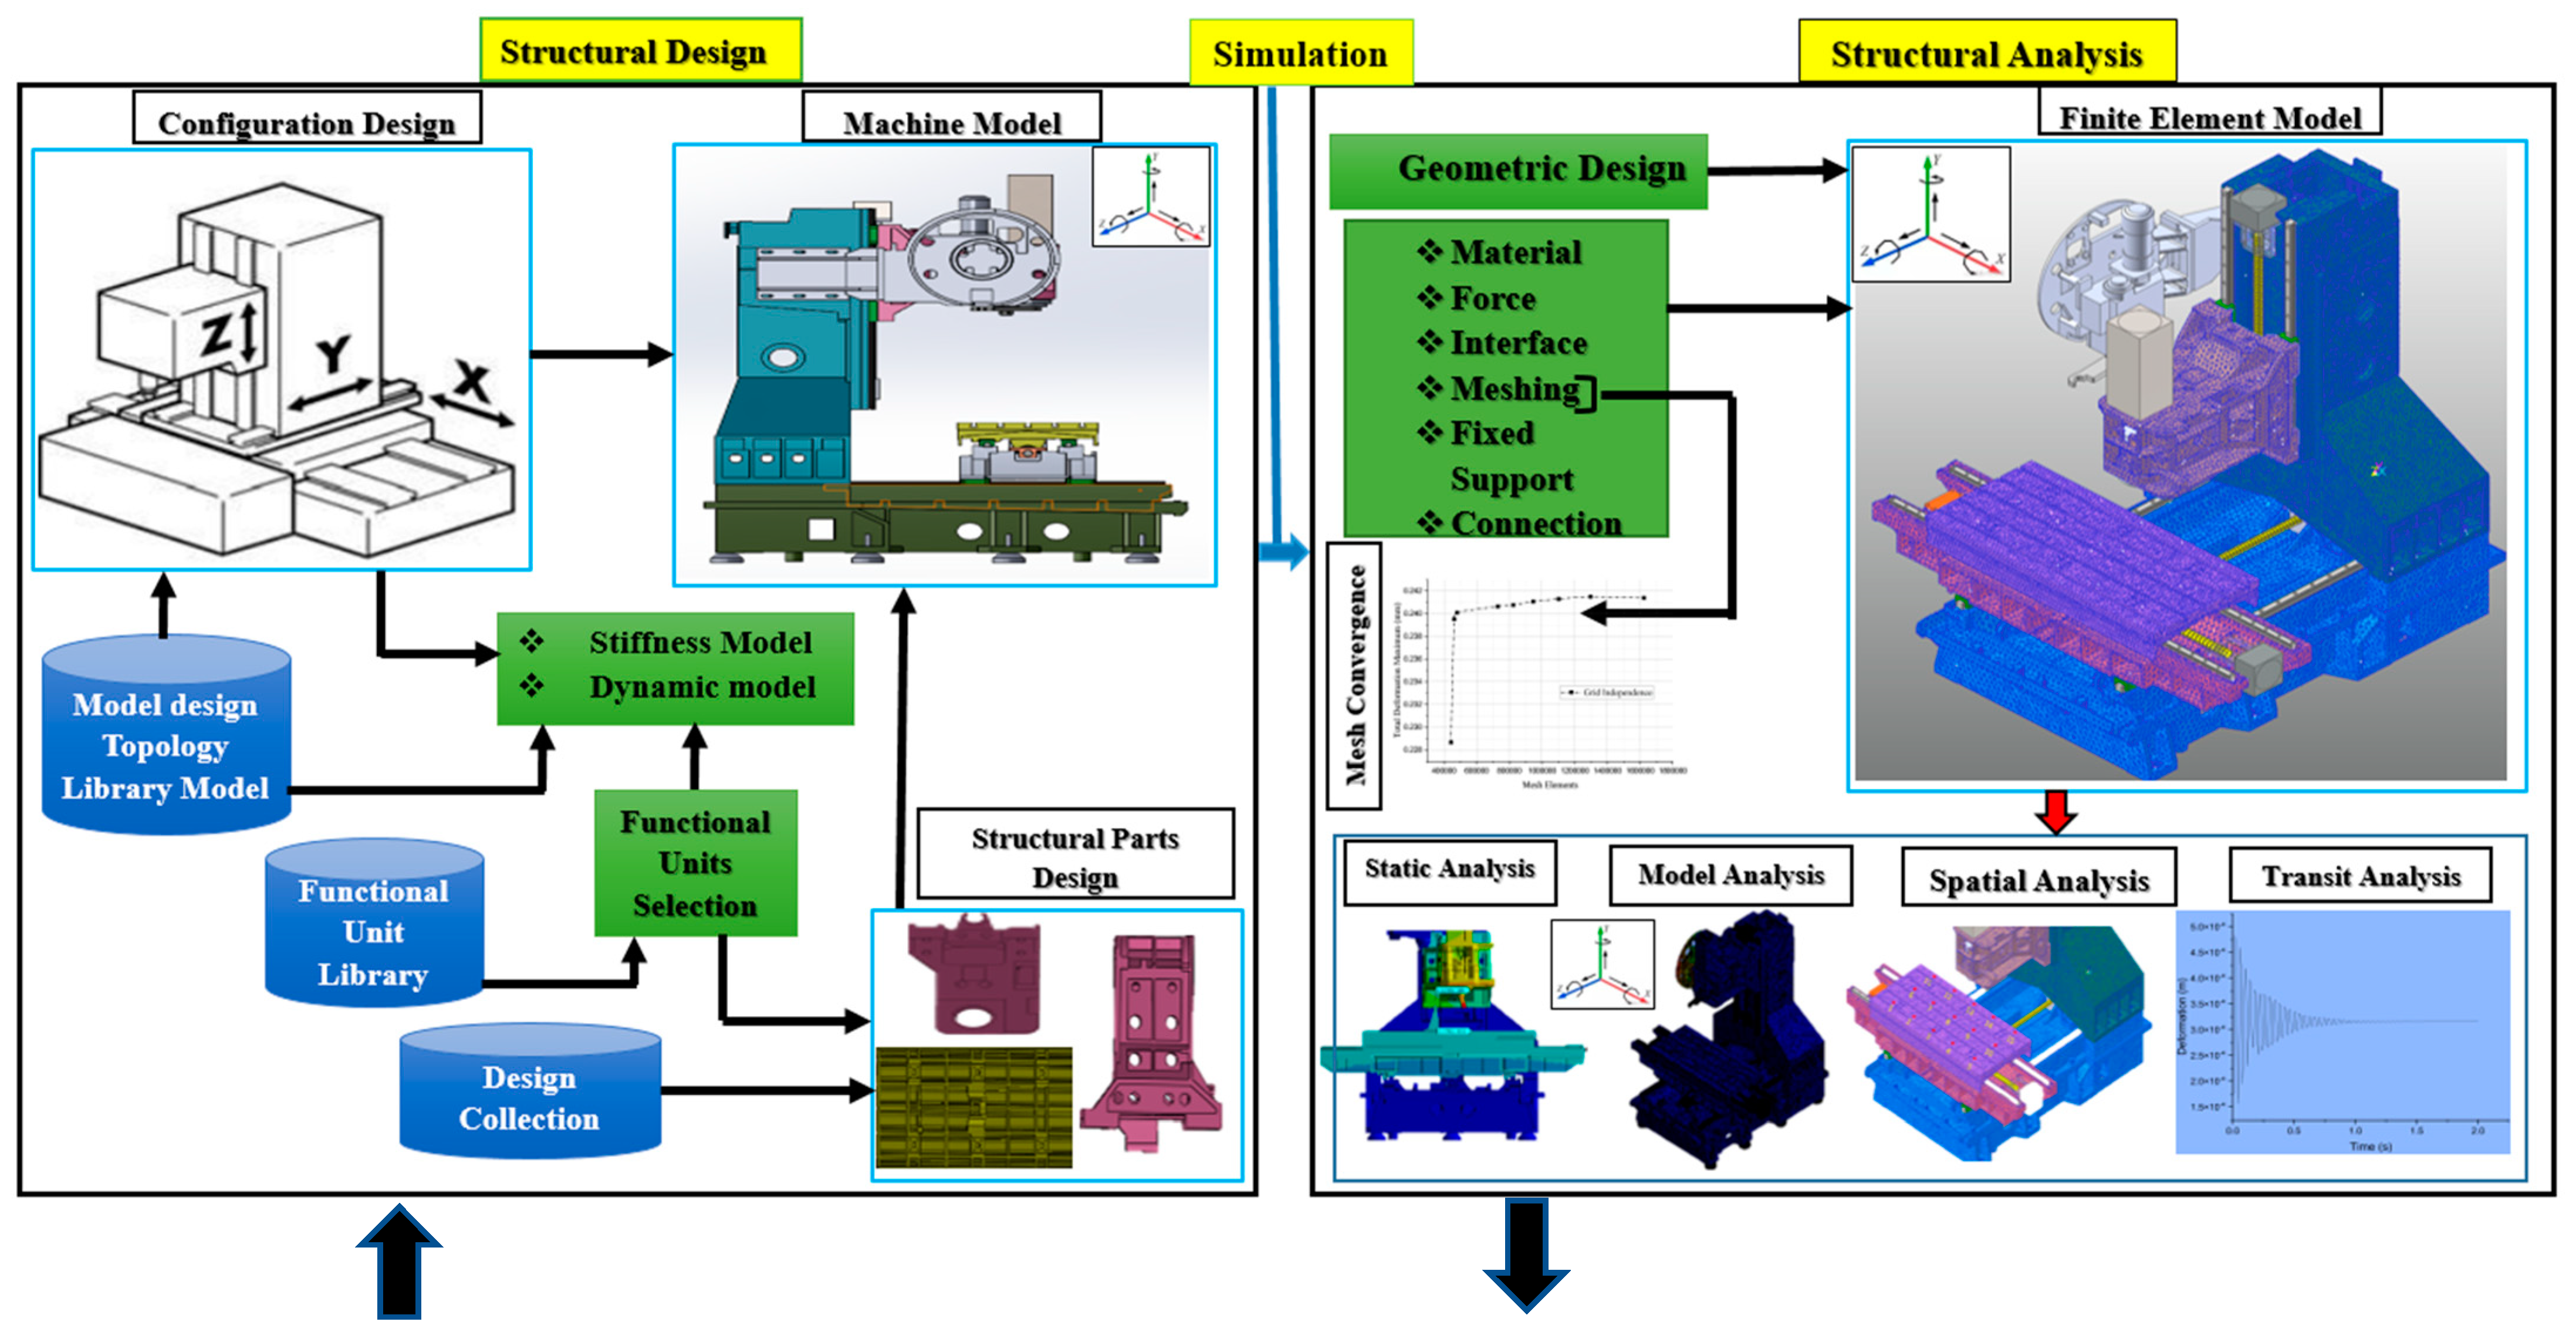
Unfortunately, the previous publications are insufficient and mostly concerned with the principle of conventional equipment; few studies have concerned themselves with the design of a micro machine tool. Therefore, the progress of micro machine tools depends on their systematic design and dynamic optimization. The abovementioned literature review shows that the finite element analysis is widely used for structural analysis. The static and dynamic analyses of the model can be performed using the finite element analysis, and the natural frequency of the machine can be obtained. In a few cases of topology optimization for structure optimization, the weight of the model was reduced, and the natural frequency increased. The primary goal of the current study was to create an experimental technique for measuring the effect of machine-tool stiffness. To ensure that the analysis results were consistent with the experimental results, the analysis model and conditions were modified. The force of each component and casting of the machine tools, as well as the load of the motor during the cutting stroke, were examined using multi-body dynamics analyses. The finite element analysis of the existing machines was mainly conducted using the ANSYS FEA package, and the results were verified using modal experiments. The machine was optimized using topology optimization to reduce both the quality of the machine and production cost and, finally, to improve the quality of the surfaces of the parts machined. Detailed steps of the development process are shown in a flowchart in
Figure 1.
2. Materials and Methods
2.1. Machine Analysis
For the Vertical Machining Centre (Hartford LG1370), which is under consideration in present study, setting the material is primordial in an experimental analysis. The construction of the machine was carried out using a combination of two materials, namely FC300 cast iron and structural steel. FC300 was used primarily for the casting, while the rails, screws, and motors were manufactured using structural steel. The physical properties of these materials are listed in
Table 1 and
Table 2, respectively.
2.1.1. Mesh Independent Study
To create finite element models, the generated CAD models were exported to ANSYS Workbench. The meshing operation was the first stage’s step. The finite element analysis depends heavily on the mesh-generating process. The precision of the calculation is related to the size of the mesh used. The results can be believed more if the mesh is smaller, but this comes at the expense of significantly more processing time. First, a preliminary mesh generation is performed to find the right balance between mesh quality and processing time. During the analysis, the mesh of the model is divided into multiple elements. During mesh division, the element used was Solid187 tetrahedral nonlinear mesh, and the mesh size of the base, column, saddle, worktable, and spindle head was set at 0.028 m. The remainder of the line rail (0.01 m) and the screw and motor were set at 0.028 m. The total number of grid nodes was 1,830,379, with 1,049,621 elements. Consequently, a suitable mesh size must be selected. Shen-Yung Lin et al. [
29] established a procedure for the element size meshed in finite element analysis (FEA), resulting in the natural frequency falling inside the convergent range of 1% in the convergent analysis of each subsystem’s three-dimensional geometrical model.
Table 1.
Structural steel properties [
30].
Table 1.
Structural steel properties [
30].
| Structural Steel |
|---|
| Density (kg/m3) | 7850 |
| Young’s modulus (Pa) | 2 × 10¹¹ |
| Poisson’s ratio | 0.3 |
Table 2.
FC300 properties [
31].
Table 2.
FC300 properties [
31].
| FC300 |
|---|
| Density (kg/m3) | 7300 |
| Young’s modulus (Pa) | 1.15 × 10¹¹ |
| Poisson’s ratio | 0.25 |
For each case in this study, mesh convergence tests were performed to increase the accuracy of the FE analysis. The findings of the variation of elastic deformations, total deformation, and maximum shear stresses were examined for various element numbers as the mesh convergence tests were carried out. As depicted in
Figure 2, with the rise in the number of mesh elements, there was a change in the value of the elastic deformation, total deformation, maximum shear stress, and maximum elastic strain. However, the variation in deformation of all variables stabilized after the eighth point. Therefore, for this investigation, the converged mesh number was defined as elements.
2.1.2. Boundary Condition
The main purpose of the boundary conditions is to generate bonding conditions between the different parts. The three axes of the machine used roller-type linear slides, with dimensions of 35, 45, and 45 mm for the X, Y, and Z axes, respectively. The main boundary conditions of the linear slides were divided into the radial (PR) and lateral (PT) directions. As shown in
Figure 3, the rigidity for the 35 and 45 mm rail was approximately
N/μm and
N/μm, respectively.
2.2. Static Analysis
Machine tools need to be both statically and dynamically stiff for optimal performance. Its static stiffness determines how precisely it can cut metal, while its dynamic stiffness affects the surface polish and metal removal rates of the components it makes. The inadequate rigidity of the machine affects the machining accuracy. The worse the rigidity, the greater the impact during heavy cutting. The boundary condition of the analysis has as objective applying a force of 1470 N to a test tool holder, which is 100 mm below the spindle nose, and a reaction force of 1470 N to the force-applying jig. The analysis results are shown in
Figure 4. The deformation of the spindle head and worktable were 126.3 and 40 μm, respectively. Consequently, the deformation of spindle head is 126.3 μm which is greater than that of the deformation bed which comes out to be 40 μm. When an external force was applied, resulting in structural improvements.
2.3. Modal Analysis
Modal analysis was mainly used to analyze the natural frequency of the entire machine. When the machine runs at a natural frequency, it considerably vibrates (some parts generate the vibration and some have poor dynamic rigidity). The vibrations produced during the impact hammer test enveloped the entire machine. The results are shown in
Table 3.
2.4. Spectrum Analysis
The harmonic response analysis analyzes the dynamic behavior of cutting-tool structures, allowing designers to determine whether their designs will successfully overcome resonance, fatigue, and other detrimental impacts of vibrations or rather fail. A linear structure’s steady-state response to harmonically varying loads is calculated using this method. A graph of displacements can be obtained by computing the structure’s response at different frequencies. The stresses are then analyzed to determine their “peak” responses. By using spectrum analysis, the response of the machine in each axis after applying an external force was understood. To start, the 1860 N load is applied to the column in the directions of X, Y, and Z, respectively. The frequency range for harmonic analysis is set from 0 to 250 Hz. The first three mode shapes and the natural frequencies of 48.4, 59.8, and 64.7 Hz are used to identify the critical forcing. The machine structure’s acceleration frequency response and displacement frequency response curves for the X-axes were evaluated.
Figure 5 shows the maximum values of acceleration amplitude and displacement amplitude in the X-directions. Considering the result of the harmonic response, modal vibrations can be represented more accurately than modal analysis vibrations. In the modal analysis, there are five frequencies with peaks between 0 and 210 Hz that correspond to the modal frequencies. Furthermore, it is found that the dynamic stiffness changes with the vibration response. When the frequency of vibration approaches the modal frequency, the dynamic stiffness decreases, ultimately resulting in a more violent vibration.
2.5. Transient Analysis
The main purpose of the transient analysis is to understand the response of the machine when subjected to an external force. Thus, an external force of 1000 N was applied in the Z-direction of the main shaft for 0.05 s to analyze the dynamic response of the entire machine.
Figure 6 shows the analysis results, with the machine being stable at approximately 0.75 s.
2.6. Machine Dynamics Analysis
In this study, multi-body dynamics analysis software was used. The line rail and screw module were used for modeling, in which the movement of the machine was simulated, whereas the force, deformation, and movement of each part during the movement of the machine were calculated.
2.7. Spatial Deformation Analysis
Here, the machine inevitably moves the worktable, saddle, and spindle-head position when processing. When the machine parts are in different positions or the machine processes objects of different weights, the machine’s force is different.
Hence, in this study, the worktable was divided into 15 points, as shown in
Figure 7. The height of the spindle was located at low, middle, and high positions. The spindle nose and worktable were located at different positions of the machine and were analyzed after adding a one-ton load onto the workpieces. The relative deformation between both was used to simulate the state between the tool and the workpiece when machining.
2.8. Spatial Deformation Analysis Results
The analysis results were divided into six parts: the main shaft located at the low, middle, and high points of the machine, and the main shaft in these points with a one-ton load of the processed objects placed onto the worktable.
The first part shows the spindle located at 245 mm, that is, between the low point of the machine and worktable (no workpiece was placed on the worktable here). The analysis results are shown in
Figure 8 which revealed that the values in the Z-direction were all negative. Hence, the distance between the spindle and the worktable was less than the ideal 245 mm, and that between the highest and lowest points was 0.046 mm.
The second part shows the main shaft located at 245 mm, that is, between the low point of the machine and worktable (a ton of processed objects were placed on the worktable here). The analysis results shown in
Figure 9. Which revealed that the values in the Z-direction were positive and negative. Thus, the distance between the spindle and worktable was greater than 245 mm in some points and lower than 245 mm in others, and the distance between the highest and lowest points was 0.137 mm.
Compared to the results of the first part, the errors between points 1–5 in the first part were the largest, but those in the second part were the smallest. The error between the headstock and worktable was minimal.
The third part shows the spindle located at 495 mm, that is, between the center of the machine and the worktable (no workpiece was placed on the worktable here). The analysis results shown in
Figure 10 which revealed that the values in the Z-direction were all negative. Thus, the difference between the spindle and the worktable was less than the ideal 495 mm, and that between the highest and lowest points was 0.001 mm.
The fourth part shows the main shaft located at 495 mm, that is, between the center of the machine and the worktable (a ton of processed objects were placed on the worktable). The analysis results shown in
Figure 11. Which revealed that the values in the Z-direction were positive and negative. Hence, although the distance between the pointed spindle and worktable was greater than 495 mm in some points, in other points, it was lower than 495 mm. The distance between the highest and lowest points was 0.138 mm.
Compared to the results of the third part, the point errors of the third part were quite close. The errors of points 1–5 of the fourth part were the smallest, thereby reducing the error between the spindle and worktable.
The fifth part shows the spindle located at 745 mm, that is, between the high point of the machine and the worktable (no workpiece was placed on the worktable here). The analysis results which shown in
Figure 12 revealed that the values in the Z-direction were all negative. Consequently, the distance between the spindle and worktable was less than the ideal 745 mm, and that between the highest and lowest points was 0.008 mm.
The sixth part shows the main shaft located at 745 mm, that is, between the center of the machine and the worktable (a ton of processed objects were placed on the worktable). The analysis results in
Figure 13. Which revealed that some values in the Z-direction were positive, whereas others were negative. Hence, the distance between the spindle and worktable at some points was greater than 745 mm and lower than 745 mm, whereas that between the highest and lowest points was 0.138 mm.
Comparing the results, we see that the point errors of the fifth part were quite close, but the errors for points 1–5 of the sixth part were the smallest. The deformation was greater when the worktable was located at the midpoint of the base, thereby reducing the error between the spindle table and worktable.
2.9. Torsion Analysis
The motor power considerably influences the cutting force of machine tools. The analysis reveals the torque that a motor needs to provide when the machine is subjected to external forces. Selecting an appropriate motor power can meet the expected cutting force and avoid the use of excessively large or very small motors, thereby contributing to reduced cutting force.
In this study, 0.2 s after the machine was started, an external force of 1000 N was applied in the Y-direction of the worktable. When the machine was affected by the external force, the load of the
Y-axis motor increased, and the final output torque value was 3077 N-mm. The results are shown in
Figure 14.
5. Results and Discussion
5.1. Static Analysis Test Comparison
According to the static analysis results, a force of 1960 N was applied to the X-direction of the spindle head, and the worktable was equally subjected to a similar force. The deformation of the spindle nose and worktable were 126.3 and 40 μm, respectively. The relative deformation of the table was 86.3 μm, and the rigidity of the entire machine in the X-direction was 2.36 kg/μm. According to the static rigidity experiment, the rigidity of the entire machine in the X-direction was 2.16 kg/μm. Consequently, the error between the static analysis and static rigidity experiment was 8.4%.
5.1.1. Modal Analysis Test Comparison
The main goal of the research is to prove that the finite element model of the machine is accurate by comparing the results of the modal analysis, using ANSYS Workbench and experimental modal analysis. Both approaches successfully extracted the results. The 3D CAD model utilized for the study in ANSYS Workbench was the original molded component used in modal testing. The boundary condition was also implemented in the ANSYS Workbench to match the experimental testing configuration. To connect the results of two techniques of modal analysis, the extracted natural frequencies of the machine are compared which shown in
Figure 25. numerical validation of model analysis. There are certain frequencies that neither ANSYS Workbench nor the experimental approach can stimulate. Therefore, only those frequencies that were stimulated by both methods are selected for comparison. The graph depicts the comparison of the natural frequencies. The first-order frequency of the modal analysis was 28.7 Hz, and its main vibration shape was the X-direction displacement of the tool. The first-order frequency of the modal experiment was 27.3 Hz, and its main vibration was the X-direction displacement.
The results of the first-order modal analysis and modal experiment, as well as the mode shape, had a frequency error of 4.8%. The second-order frequency of the modal analysis was 34 Hz, and its main mode shape was the displacement of the tool magazine in the Z-direction. The results of the first-order modal analysis and the modal experiment, as well as the mode shape, had a frequency error of 1.1%. The third-order frequency of the modal analysis was 48.5 Hz, and its main vibration shape was the Z-direction displacement of the tool magazine and the Y-direction displacement of the worktable. The third-order frequency of the modal experiment was 48.3 Hz, and its main vibration shape was the displacement of the tool magazine. The displacement in the Z-direction and that of the worktable in the X-direction, as well as the third-order modal analysis and modal experiment results, had a frequency error of 0.4%, with a slightly different mode shape.
5.1.2. Institutional Dynamic Analysis Results Comparison
According to the dynamic analysis of the mechanism, when the machine worktable was subjected to an external force of 1000 N, the load of its motor was 3077 N-mm. According to the experiment, when the machine worktable was subjected to an external force of 1000 N, its motor load was 2740 N-mm. Hence, the error between the analysis and experiment was 10.95%.
5.2. Structural Optimization Design
Generally, machine-tool castings are often designed using the empirical method. If it is not optimized, an excess of materials may occur. To achieve high speed and precision, the structure is optimized using a computer, which effectively saves materials. Unnecessary material removal contributes to improved mechanical properties of the machine tool and reduced cost.
In this study, the structure of the machine tool was optimized using topology optimization. The optimization goals were divided into maximizing rigidity, increasing natural frequency, and quality. Here, maximizing rigidity was chosen. The spindle head, worktable, and saddle of the machine tool were optimized. The model was then modified according to the optimized results, and the original and optimized models were imported into the finite element analysis software for static analysis. In addition, modal analyses were conducted, and the differences were compared. Finally, the results of the modified model and those of the entire machine analysis were compared.
5.2.1. Spindle-Head Optimization Results
Table 11 shows the optimized results of the spindle head. The masses before and after optimization were 306 kg and 284 kg (7.1% reduction), respectively. For a load of 1000 N, the maximum deformation before and after optimization was 7.32 µm and 6.55 µm, respectively, showing a decrease of 10.5%. The first-, second-, and third-order natural frequencies before optimization were 510, 610, and 670 Hz, respectively. After optimization, they were 559, 696, and 750 Hz, increasing by 9.6%, 14%, and 11.9%, respectively.
5.2.2. Worktable Optimization Results
The topology optimization analysis in ANSYS Workbench is another option for increasing the rigidity of the worktable. The worktable is examined for modal frequencies and stress–strain contours. Topology optimization reduces the machine’s weight without affecting the design characteristics. As a preliminary precaution, the analysis is set to restrict 85% of the actual mass in order to avoid changing too much of the design. The analysis shows the area that is unaffected by stress caused by the weight of the parts lying on it. An engineering design can be used to clear the marked area; the modified design is reanalyzed, and the results are compared. For topology-shape optimization, the ANSYS FEA package was used; it determines the reduced mass and deformation under a specific shape. Now, the new shape, as approved by the FEA package, has some material removed from the places which would not only partake in major stress bearing but also load bearing. It was effective to remove this excess mass, as we can still get a shape optimized enough to have less stress, as well as less deformation.
Table 12 shows the optimized result of the worktable. For the static characteristics of the worktable after optimization, the mass before and after optimization was 341 and 326 kg (4.3% reduction), respectively. For a load of 1000 N, the maximum deformation before and after optimization was 6.77 µm and 5.99 µm, respectively, which is a 11% reduction. The first-, second-, and third-order natural frequencies before optimization were 93, 220, and 301 Hz, respectively. After optimization, they were 102, 228, and 327 Hz, increasing by 9.6%, 3.6%, and 8.6%, respectively.
5.2.3. Saddle Optimization Results
Table 13 presents the static characteristics of the saddle after optimization. The mass before and after optimization was 545 kg and 471 kg (a 13.6% reduction), respectively. For a load of 10,000 N, the maximum deformation before and after optimization was 6.28 and 6.1 µm, respectively, showing a decrease of 2.9%. The first-, second-, and third-order natural frequencies before optimization were 248, 274, and 277 Hz, respectively. After optimization, they were 269, 297, and 304 Hz, increasing by 8.5%, 8.4%, and 9.7%, respectively. The body was then reanalyzed using modal and structural analysis and checked for improvements.
5.2.4. Machine Optimization Results
The mass of the entire machine before and after optimization was 4687 kg and 4576 kg, respectively, a reduction of 2.3%. Before optimization, the force 100 mm below the spindle nose end was 1470 N, and the reaction force of the fixture was 1470 N. After optimization, the deformation of the spindle end was 92 µm, and that of the worktable was 29 µm. The rigidity of the entire machine before and after optimization was 2.30 and 2.38 kg/µm, respectively, increasing by 3.2%. No significant difference in natural frequency was observed.
6. Conclusions
In the past, machines were designed based on experience, and this process was costly and time-consuming. The newly designed model was analyzed using a computer-aided analysis to ensure that the designed product met the requirements, and the model was optimized using structural optimization. The model optimization removed the unnecessary parts, reduced the production cost, and improved the overall static and dynamic rigidity of the model. The results of this study obtained using finite element analysis, testing, and topology optimization of the machine are as follows:
The static and dynamic characteristics of the machine were obtained using finite element analysis and dynamic analysis of the machine. According to the analysis results, the static rigidity of the machine in the X-direction was 2.28 kg/µm. The first-, second-, and third-order natural frequencies were 28.7, 33.9, and 48.4 Hz, respectively. From the dynamic analysis of the mechanism, when the spindle was located at the low point of the machine table and the worktable was not loaded, the distance between the spindle nose and the highest and lowest points of the 15 points on the table was 0.046 mm, whereas this distance was 0.137 mm when the worktable was loaded for a while. The distance between the highest and lowest points of each point was 0.001 mm. When the spindle was at the center of the machine table and the worktable was loaded for a while, the distance between the spindle nose and the highest and lowest points of the 15 points on the table was 0.138 mm. When the spindle was located at the high point of the machine table and the worktable was not loaded, this distance was 0.008 mm. The distance between the end and the highest and lowest points of the 15 points on the workbench was 0.138 mm. From the dynamic analysis of the mechanism, when the machine worktable was subjected to an external force of 1000 N in the Y-direction, the torque required by the Y-axis motor was 3077 N-mm.
- (2)
Experimental Results
From the comparison of multiple experiments and analysis results, the static rigidity of the machine was obtained using the static rigidity experiment. The experimental result showed that the rigidity of the X-axis of the machine was 2.20 kg/μm. The natural frequency and mode shape of the machine were shown using modal experiments. The experimental results showed that the first-, second-, and third-order natural frequencies of the machine were 27.3, 34.4, and 48.3 Hz, respectively. By applying an external force of 1000 N in the Y-direction of the machine worktable, the load table of the machine controller showed that the Y-axis motor load was 20%. According to the original data conversion, the motor load currently was approximately 2740 N-mm.
- (3)
Analysis and Experimental Comparison
By comparing the static analysis results to the static stiffness experimental results, we found that the error of both was approximately 8.4%. From the modal analysis and modal experiment results, the errors of the first-, second-, and third-order natural frequencies were approximately 4.8, 1.1, and 0.4%, respectively. From the dynamic analysis of the mechanism, the error between the torque of the motor and the application of an external force to the Y-direction of the machine worktable was approximately 10.95%. The actual cutting results showed that when the machine was cutting at the natural frequency, the surface was relatively rough. Consequently, it was concluded that the machine influenced the natural frequency.
- (4)
Topology Optimization Results
The original mass of the spindle head was 306 kg. After the optimized design, it was reduced by 7.1% to 284 kg. The original design withstood a load of 1000 N, with a maximum deformation of 7.32 µm. After the design optimization, it was reduced by 18% to 3.4 µm. The first three natural frequencies increased by 9.6%, 14%, and 11.9%, respectively. The original mass design of the worktable was 341 kg; after optimization, it decreased by 4.3% to 326 kg. The original design withstood a load of 10,000 N, with a maximum deformation of 6.77 µm. After optimization, it decreased by 11% to 5.99 m. The first three-order natural frequencies increased by 9.6%, 3.6%, and 8.6%, respectively. The original mass design of the saddle was 545 kg, and after optimization, it decreased by 13.6% to 471 kg. The original design withstood a load of 1000 N, with a maximum deformation of 6.28 µm. After optimization, it decreased by 2.9%, to 6.1 µm. The first three-order natural frequencies increased by 8.5%, 8.4%, and 9.7%, respectively. Finally, this was performed to enhance the quality of the surfaces that are generated by the manufacturing processes.


