Article

Experimental Investigation and Theoretical Prediction Model of Flexural Bearing Capacity of Pre-Cracked RC Beams

1
School of Civil Engineering, Changsha University of Science & Technology, Changsha 410114, China
2
School of Civil Engineering, Hunan City University, Yiyang 413000, China
*
Author to whom correspondence should be addressed.
Appl. Sci. 2023, 13(8), 4775; https://doi.org/10.3390/app13084775
Submission received: 20 March 2023 / Revised: 31 March 2023 / Accepted: 8 April 2023 / Published: 10 April 2023

Abstract

:
Cracking is one of the main diseases of small- and medium-span reinforced concrete (RC) bridges. It is a key problem to determine the change in mechanical properties of RC beams after cracking in bridge-performance evaluation. The present study performs static loading tests on seven simply supported T-beams with different crack damage conditions. The influences of crack location, crack depth and steel-bar diameter at a prefabricated crack on the stress, deflection and crack distribution pattern of pre-cracked test beams are investigated. The failure mode and mechanism of pre-cracked beams are revealed. Based on the experimental results, a finite element model of a pre-cracked beam is developed and validated. Following this, a theoretical prediction method is proposed to calculate the ultimate load of pre-cracked RC beams. The results indicate that the direct damage to mid-span section size can significantly affect the stiffness of the RC beam. The local damage of the tensile steel section has insignificant influence on the overall stiffness of the beam. The stiffness degradation of the pre-cracked beam at the quarter span is smaller than that of the pre-cracked beam at mid-span. The strain of the T-beam section in the pre-cracked test conformed to the assumption of the flat section. The experimental observations are in good agreement with the theoretical predictions, which can provide a theoretical basis for the performance evaluation of existing RC beams.

1. Introduction

The bridge is the key node of the transportation infrastructure system. More than 90% of bridges in China are concrete bridges. The bridges inevitably suffer from different degrees and different types of diseases under the effect of external long-term environmental corrosion and cyclic vehicle load [1,2,3]. Cracks are the main forms of diseases of existing reinforced concrete (RC) bridges [4,5,6]. The reinforcement will be corroded with the propagation of cracks, further accelerating the degradation of structural stiffness and bearing capacity [7,8,9]. Therefore, it is of great theoretical significance and engineering value to investigate the failure mechanism and bearing capacity of RC bridges under cracking conditions.
Over the last decades, some researchers have made important contributions to the cracking behavior of concrete structures, crack distribution mode, crack width, and section stress distribution, as well as ordinary steel bar stress at the cracks [10,11,12,13,14,15,16]. For small- and medium-span bridges, simply supported RC beams (such as hollow plates or T-beams) are widely used in practical engineering [17,18]. Generally, most RC beams in service work with cracks. This will have more engineering representativeness and application value for investigating the performance of RC beams under cracking conditions. Several experimental studies evaluated the influence of cracking on the flexural bearing capacity and shear behavior of RC beams [19,20,21]. It was found that cracks influence the ductility and structural capacity of an RC member [22,23,24]. Based on experimental investigations, the dynamic response of the RC beam to the development of cracks was investigated [25], and the stress–strain curves of tensile concrete in cracked RC beams were also presented [26]. Other researchers established a comprehensive model to accurately describe the whole process of crack initiation, propagation and rotation [27]. Davoudi et al. [28] used image recognition processing and machine learning regression technology to establish the relationship between the surface-crack-distribution information and the bearing capacity of RC beams. However, most of the existing studies focused on the cracking location of a complete beam under test or environmental load. The obtained variation law or model cannot be directly applied to the bridges with cracks before formal operation [29], and it is necessary to improve and supplement the relevant results.
Finite element (FE) numerical simulation has the advantages of convenient parameter adjustment and reasonable characterization of data results [30,31,32,33], which has become an indispensable tool in the field of concrete structures. Ismail et al. [34] determined the flexural stiffness of simply supported RC beams with prefabricated cracks using the FE model modification method. Castel et al. [35] established an FE model that can reveal the influence of cracks on the section stiffness of RC members under short-term loads. Yu et al. [36] further clarified the influence of initial cracks on the bearing capacity of cracked beams by FE simulation. In addition, Qu et al. [37] investigated the influence of initial crack location, width, depth and longitudinal-reinforcement ratio on the dynamic performance of pre-cracked RC beams, using the numerical method. The results showed that the dynamic behavior of pre-cracked RC beams was insensitive to the width and depth of initial cracks, to a certain extent. However, the existing works mainly focused on the stiffness degradation or flexural behavior of the beam under crack development, and the analysis data mainly come from numerical simulation. FE numerical simulation has the disadvantage of the idealistic application or assigning process of materials, boundaries and loads, which may deviate from the real test results. The credibility of a single FE simulation is questionable. The FE model must be modified and verified, based on the test results. In addition, the assessment of bearing capacity degradation was mostly performed based on experiments, lacking in-depth theoretical model representation and engineering guidance value. Therefore, it is still a focus in this field to reveal the failure mode and mechanism of RC beams with cracks and to quantify the calculation law of bearing capacity degradation.
In this paper, stepwise static loading tests were performed on seven reinforced concrete T-beams. The cracks with different characteristics were prefabricated at the mid-span or one-quarter position of the bottom beam, to invert the distribution of cracks. The influences of crack location, crack depth and steel bar diameter on the stress, deflection and crack distribution pattern of pre-cracked beams were investigated. Next, the failure mode and mechanism of the pre-cracked test beam under load were revealed. The influence of prefabricated cracks on the bearing capacity of the beam was compared and quantified. Based on the test results, the FE numerical simulation method of the pre-cracked test beam was developed and validated. Following that, a theoretical prediction method was proposed to calculate the ultimate load of the pre-cracked RC beam. Finally, some conclusions were drawn.

2. Experimental Programs

2.1. Specimen Design

In order to reveal the similarities and differences between the beams with cracks before the formal operation and the complete beam in terms of service performance and failure mechanism, pre-cracked RC test beams were manufactured with a T-type cross section, based on scale ratio similarity theory [38], due to the constraints of test sites and the maximum range of the equipment. The concrete strength grade was C50 with P.O 42.5 cement. The water–cement ratio was 0.31 and the sand rate was 0.39. The amount of concrete material per cubic meter consisted of 160 kg water, 460 kg cement, 1062 kg coarse aggregate, 678 kg fine aggregate, 10.2 kg admixture, and 50 kg fly ash. The density of the material was 2410 kg/m3. The length of the test beam was 2 m, and the calculated span was 1.9 m. HRB400 steel bar was used. The yield and ultimate strength of the HRB400 steel bar was 489 MPa and 618 MPa, respectively. The elongation was 14.6% and the Young’s modulus was 210 GPa. The diameter of the bottom tension bar was 12 mm. The diameter of the other longitudinal steel bars was 10 mm. The diameter of the stirrup was 8 mm. Figure 1 shows the cross-section size and reinforcement of the test beam.
The prefabricated cracks were arranged at the mid-span and l/4 position on the left side of the test beams. The prefabricated crack was performed by inserting thin sections during concrete placement. The crack width and depth are the two main parameters to describe the characteristics of the crack, and only the influence of the crack depth was considered in this study. The crack depth was set at 20 mm and 60 mm, and the prefabricated crack width of the test beams was 1 mm. In addition, the mechanical method was adopted to polish the diameter of the steel bar at the mid-span prefabricated crack from 12 mm to 10 mm, to study the influence of the steel bar diameter at the crack on the bearing capacity of the test beam. A total of seven test T-beams were made. The test-condition settings are listed in Table 1.

2.2. Loading and Measuring-Point Arrangement

Strain gauges were arranged along the height direction of both webs at l/4, mid-span and 3l/4 positions, within the span of the test T-beam. In addition, strain measuring points were also arranged on the surface of the bottom plate at the above positions of the beam to measure the strain distribution on a concrete surface. Displacement measuring points were arranged at l/4, mid-span and 3l/4 positions within the span of the T-beam to record the deflections under various loads. Figure 2 shows the measuring-point arrangement. To accurately represent the stress variation of the steel bar in the test beam, strain gauges were arranged at the l/4, l/2 and 3l/4 positions of the bottom tensile steel bar. Meanwhile, a strain gauge was arranged on the stirrup at the supports of the test beam. The position and number of measuring points of strain gauges for reinforcement are shown in Figure 3.
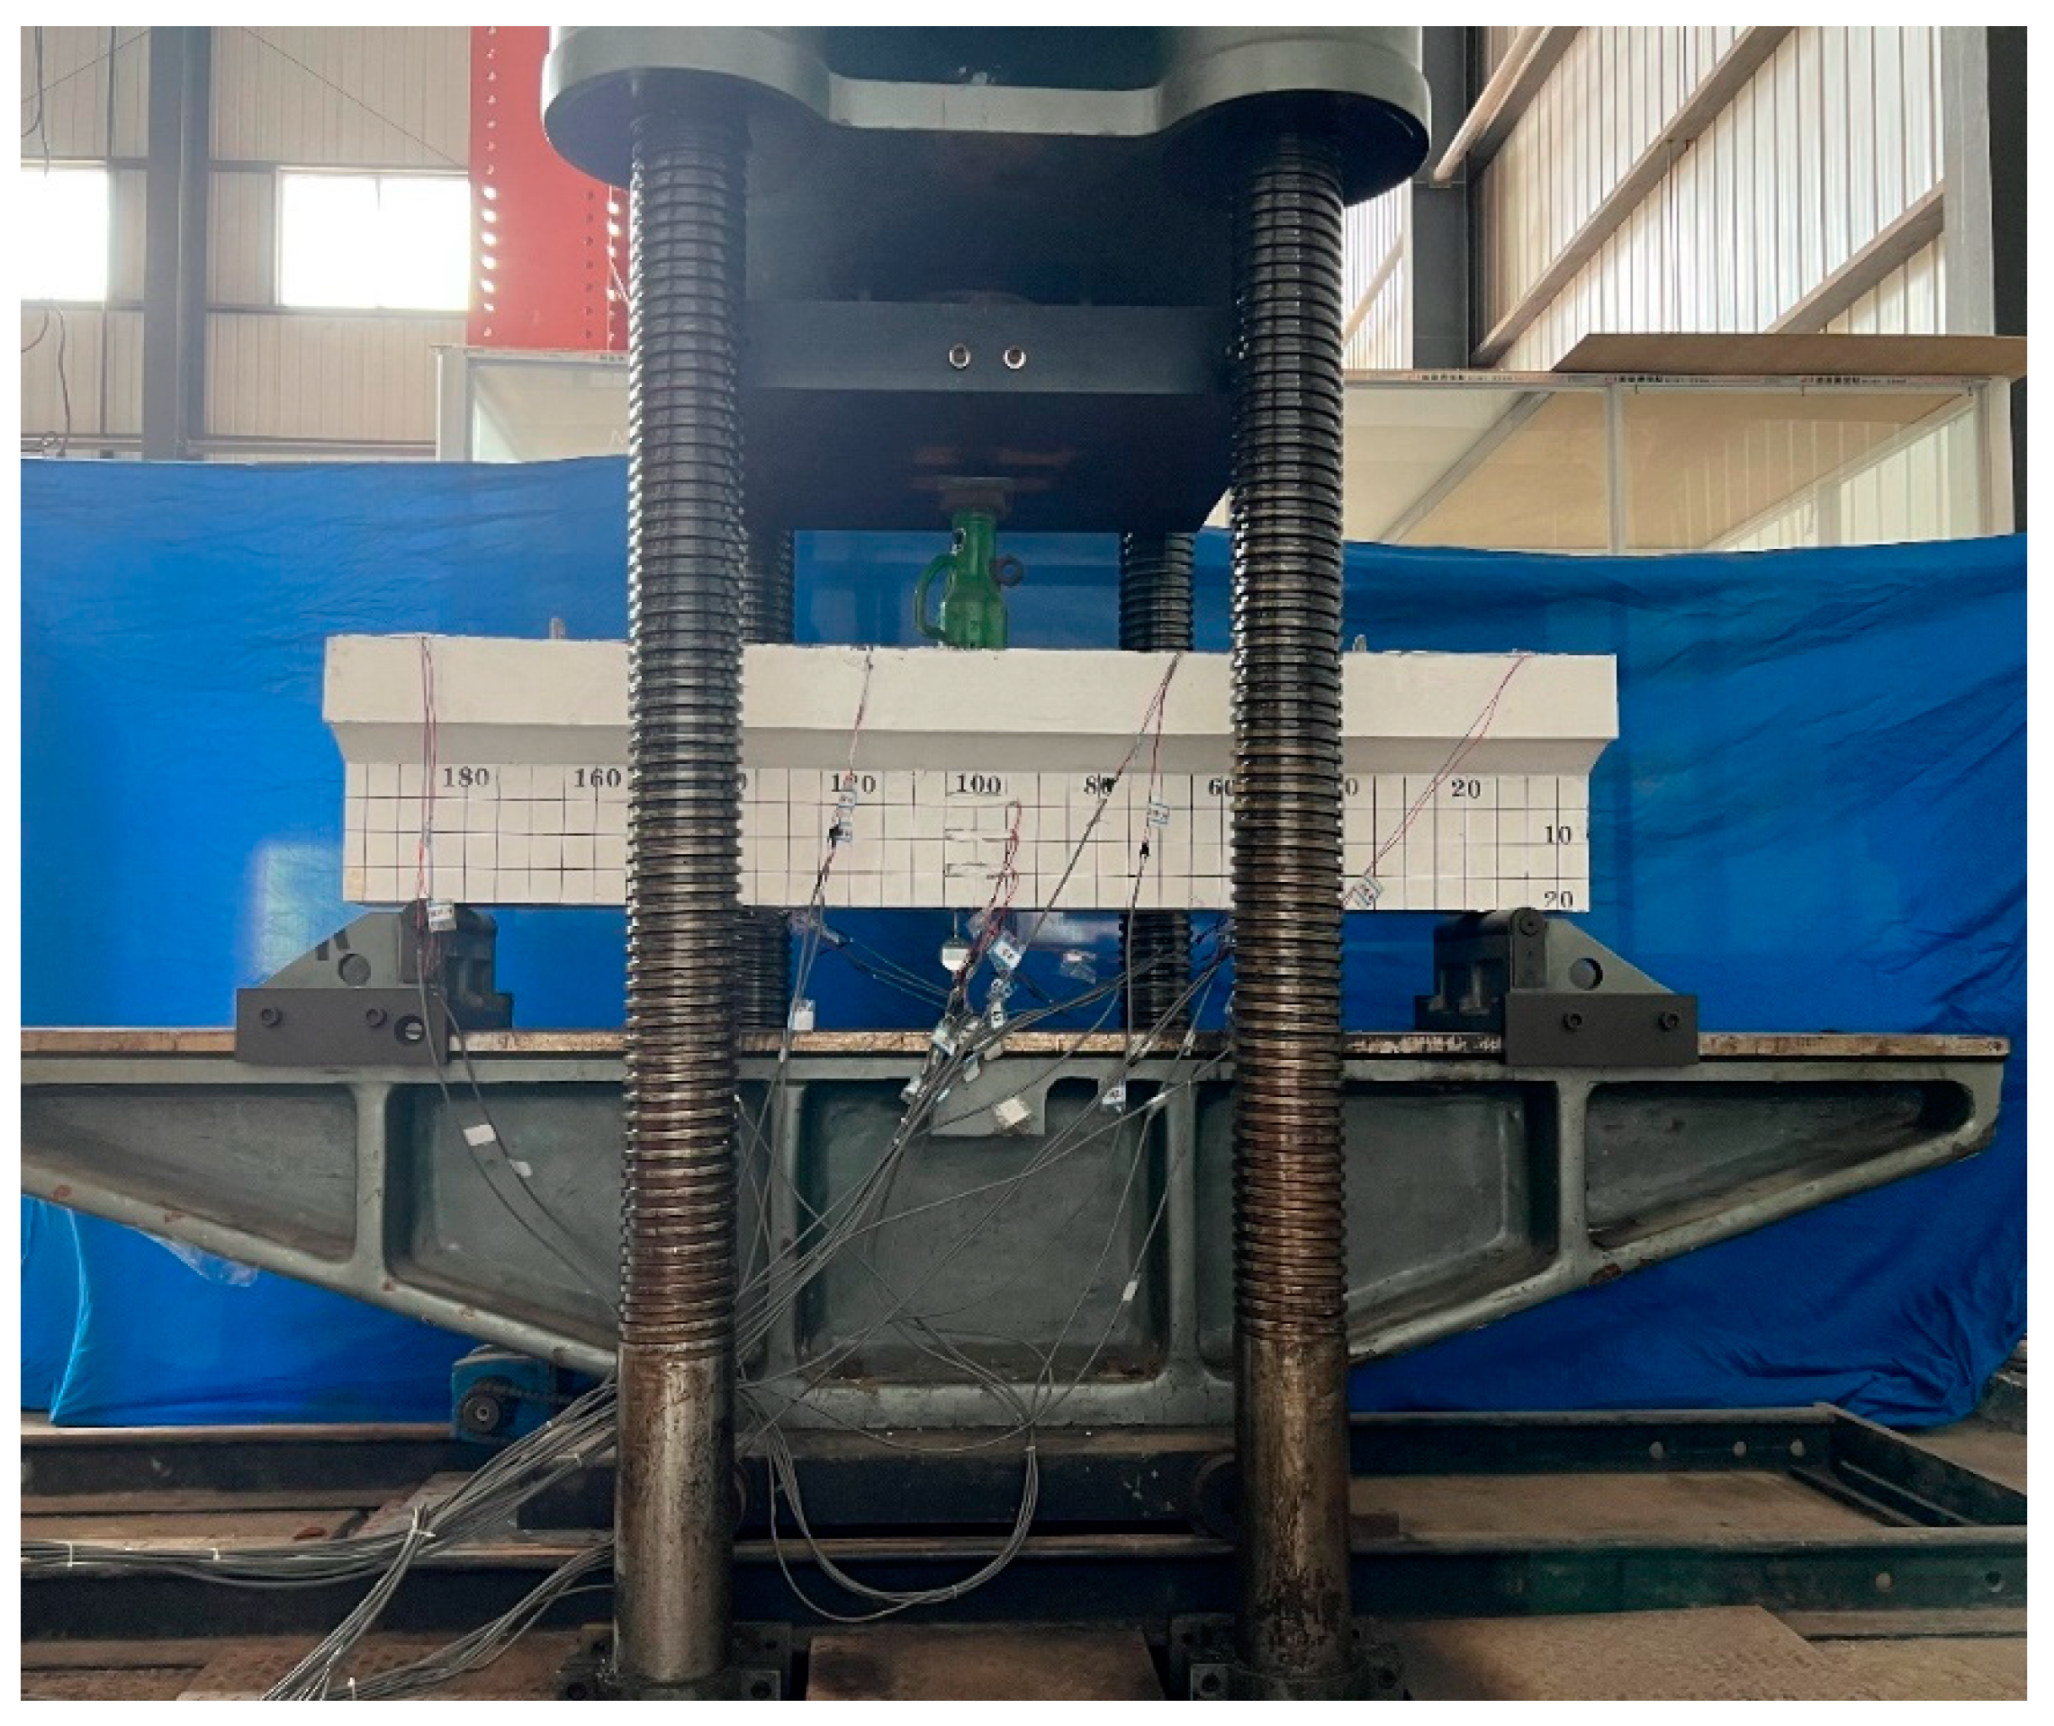
The test beam was simply supported and loaded by three-point bending. A pre-loading test was first conducted before formal loading. The control force in the pre-loading process was 20 kN. The load was unloaded to 1 kN after 5 min, which can test the accuracy of data acquisition at each measurement point and eliminate the gaps between the structures. Hydraulic graded loading was used for the formal loading process. The load of each stage was set at 5 kN before beam cracking, and the load of each stage was 10 kN after cracking. The force index was used to control the loading process when the load was in the range of 0–200 kN, and the loading rate was 0.4 kN/s. The displacement index was used when the load exceeded 200 kN, and the loading rate was 1 mm/min. The load was held for three minutes before data recording at each loading level. Two termination criteria were set for the loading test: the cumulative deflection increment of the beam was larger than 6 mm within 30 min, or the single measured mid-span deflection increment in the last 5 min was larger than 0.5 mm. Figure 4 shows the loading test device.

3. Experimental Results and Discussion

3.1. Crack Distribution and Failure Mode

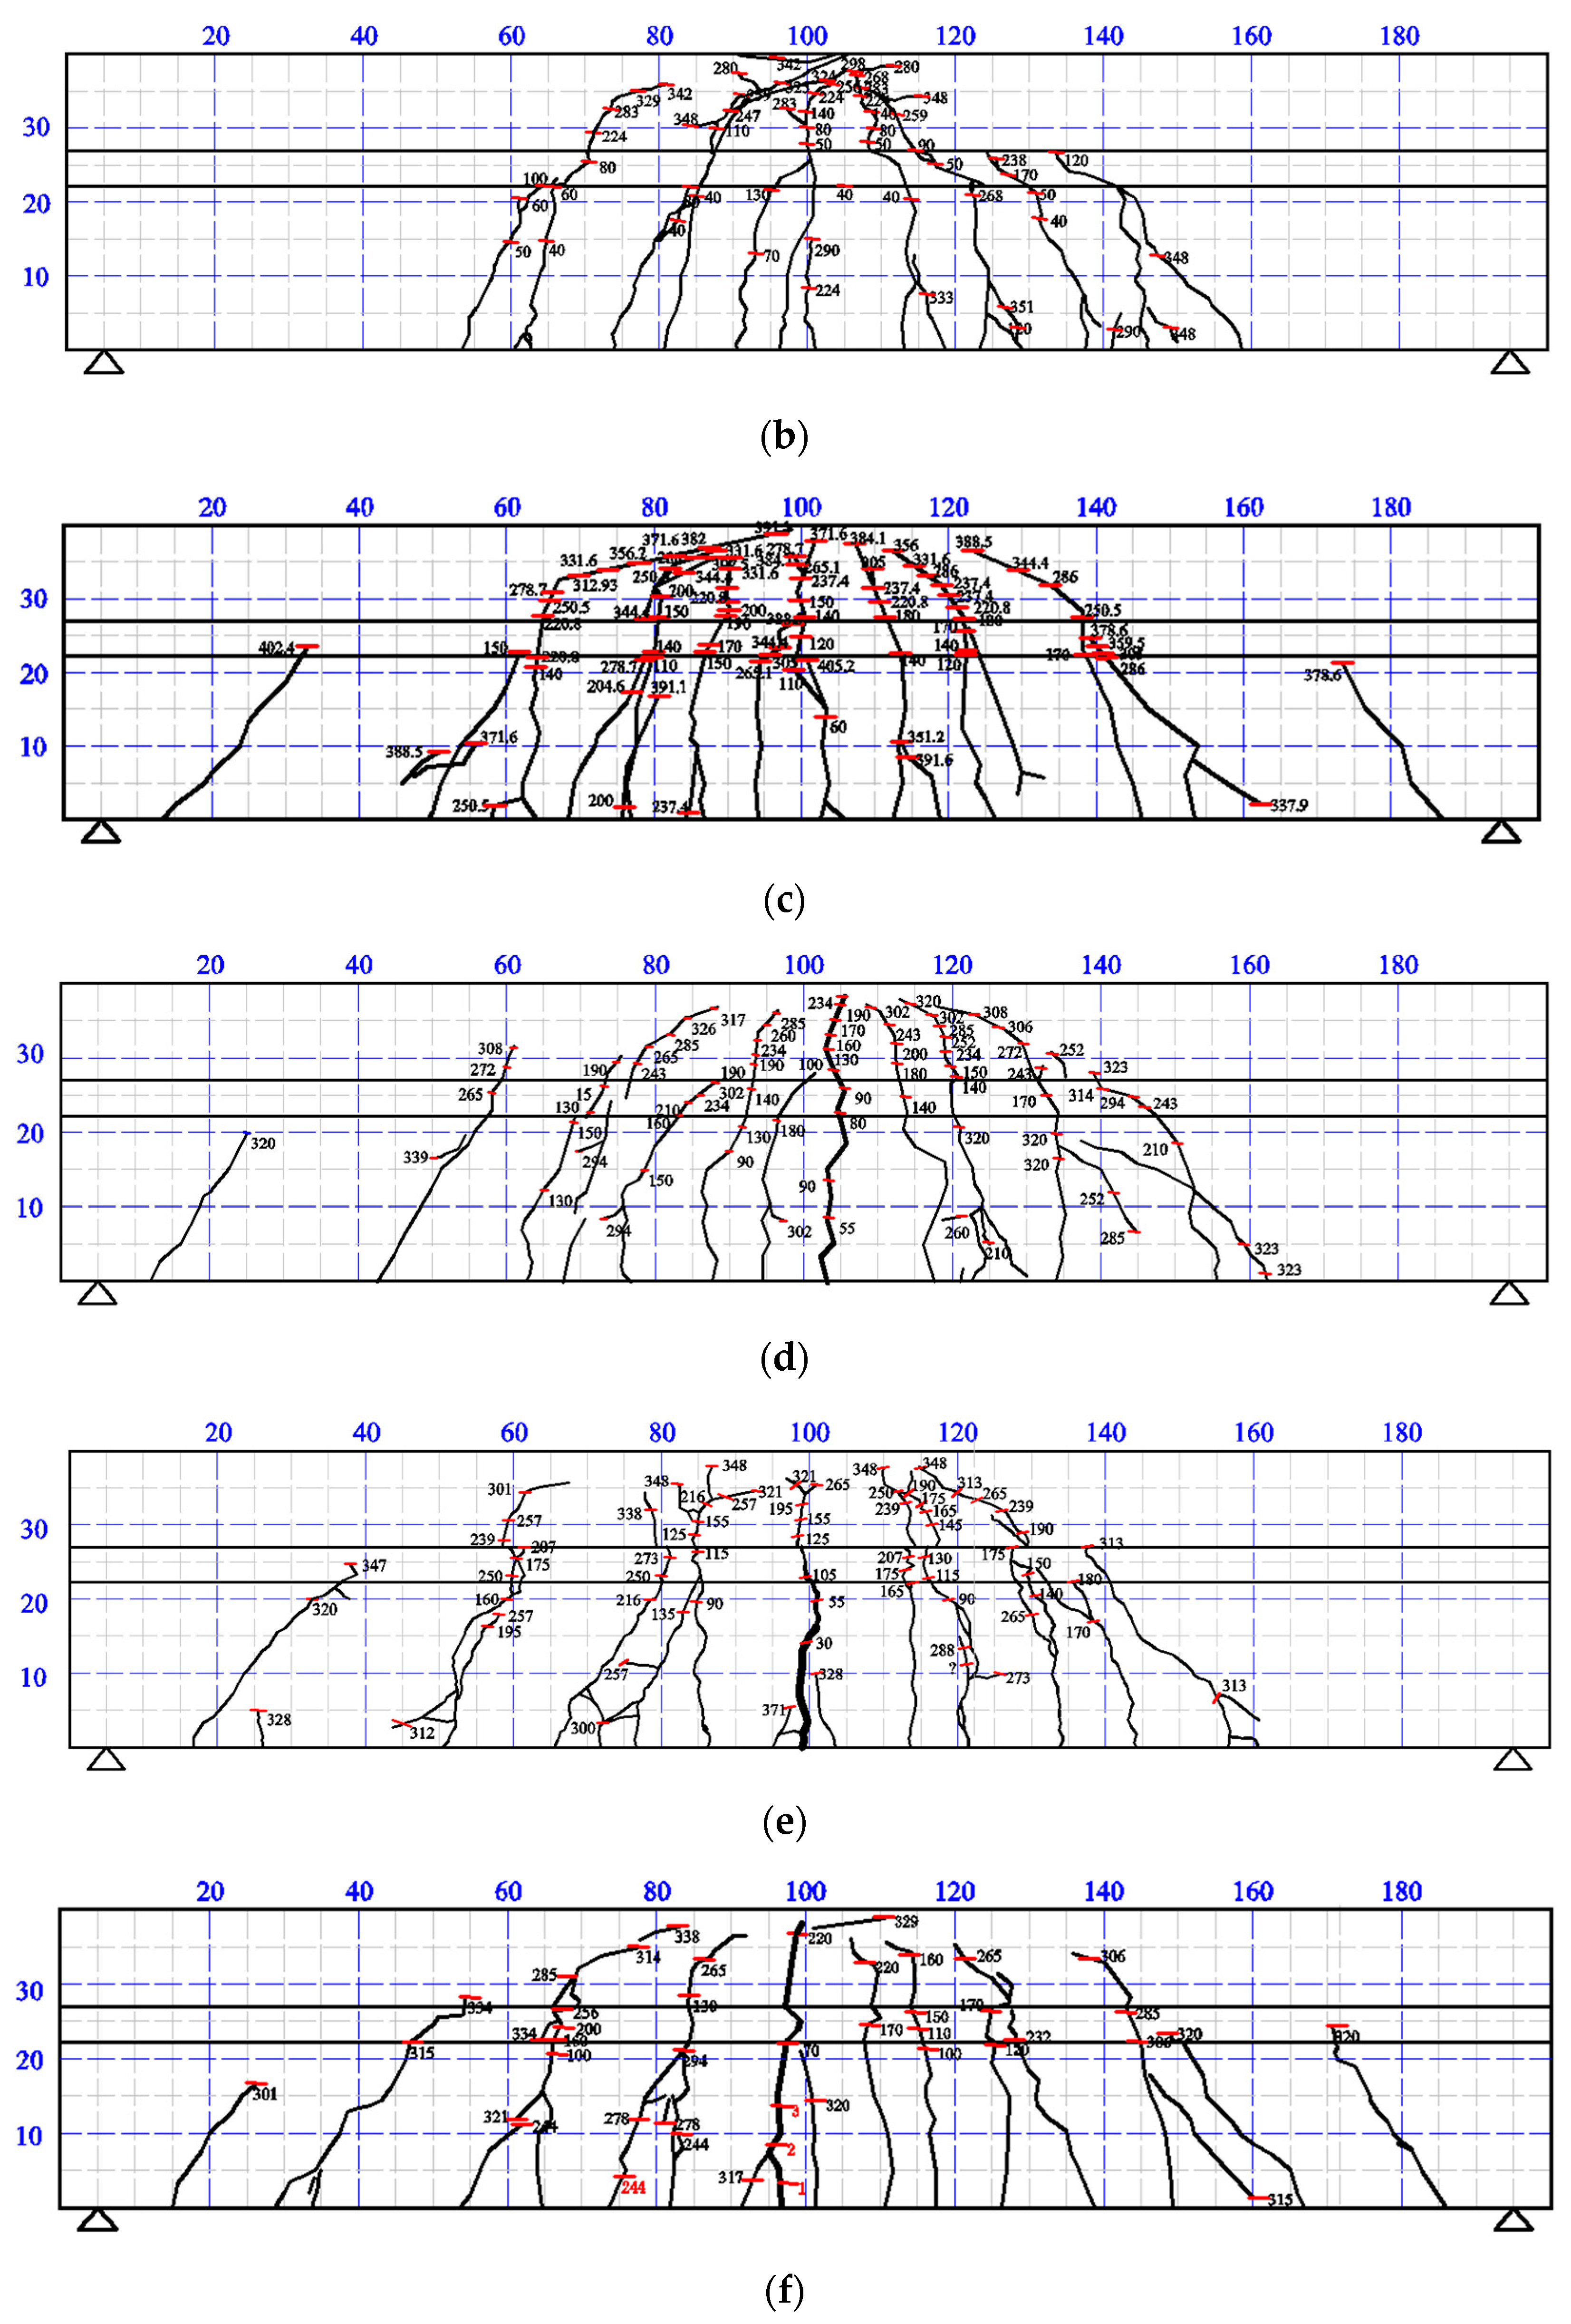
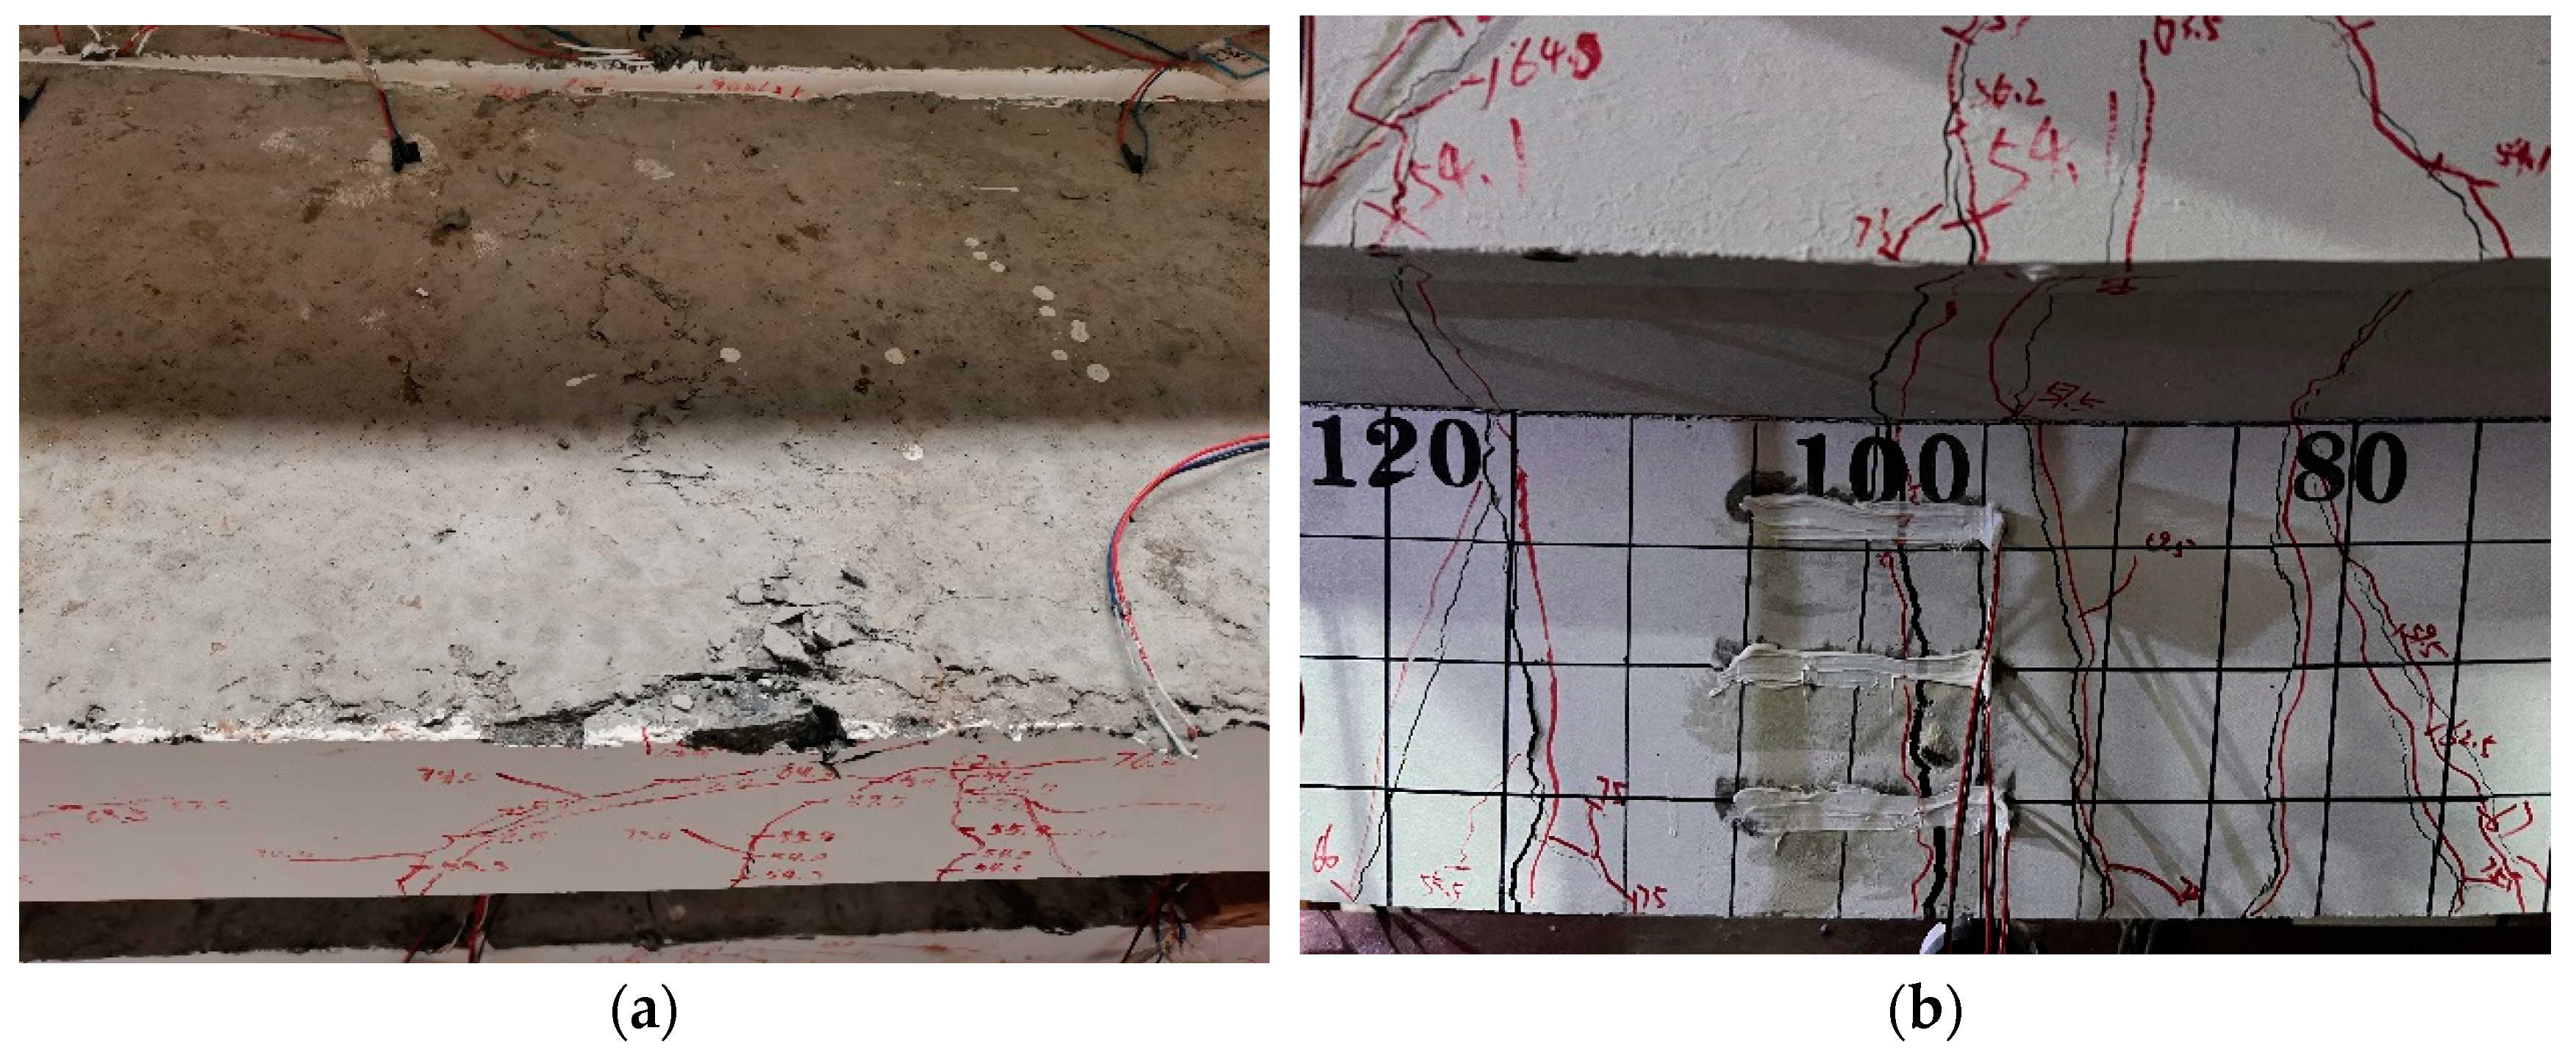
Figure 5 shows the crack distribution and failure mode of the test beam. As Figure 5 shows, the failure mode of all test beams is typically appropriate reinforcement failure, i.e., concrete cracks first appear in the tension zone, then the tensile steel bar reaches the yield strength, and finally the concrete in the compression zone is crushed. During the failure process, a large number of uniform cracks appear in the beam. Compared with the intact test beam (WS beam), the crack spacing of the mid-span for pre-cracked test beams (i.e., the ZSS1, ZSS2 and ZSS3 beam) is larger, and the main crack develops from the prefabricated crack at the mid-span. The crack distribution of pre-cracked test beams at l/4 (the DSS1, DSS2 and DSS3 beam) is similar to that of the WS beam. Due to the stress concentration effect at l/4 position prefabricated cracks, beams DSS1, DSS2 and DSS3 have inclined cracks here, which develop along the beam height direction. The largest cracks in the test beam occur in the mid-span, and all the inclined cracks of the T-beam develop towards the loading point, resulting in a dense distribution of cracks near the top loading point. Figure 6 shows the typical failure mode of the test beams.
The maximum crack width of the WS beam is 2.02 mm, and the maximum crack widths of ZSS1, ZSS2 and ZSS3 are 6.44 mm, 6.35 mm and 7.09 mm, respectively, which are 3.19 times, 3.14 times and 3.51 times, respectively, that of the WS beam. The results indicate that the prefabricated crack in mid-span significantly weakens the cross-section stiffness of the test beam. In addition, the height of the prefabricated crack in the ZSS2 beam is 60 mm, and the concrete in the tension zone will exit the work earlier, resulting in the tension steel bar bearing the tensile stress induced by the load earlier. Therefore, the maximum crack width of the ZSS2 beam is slightly smaller, compared with the ZSS1 beam. As the diameter of the steel bar at the ZSS3 beam decreases, the stress of the steel bar is greater under the same load, and its elastic deformation also increases. Therefore, the maximum crack width of the ZSS3 beam increases by 11.7%, compared with the ZSS2 beam.
Compared with the mid-span pre-cracked test beam, the prefabricated cracked beam at the l/4 position has little effect on the stiffness of the test beam. The maximum crack widths of DSS1, DSS2 and DSS3 are 1.83 mm, 1.91 mm and 2.63 mm, respectively, which are 0.94 times, 0.95 times and 1.31 times, respectively, that of the WS beam. As the height of the prefabricated crack in the DSS3 beam is relatively large, and the diameter of steel bar at the prefabricated crack decreases, some oblique cracks are generated and expanded here (Figure 5g), which has a great impact on the integrity of the test beam. Therefore, the maximum crack width of the DSS3 beam is increased by 30.2%, compared with the WS beam.

3.2. Load-Deflection Curves

Figure 7 shows the load-deflection curves of each measuring point for pre-cracking at mid-span. As Figure 7 shows, the stiffness of the pre-cracked test beam is reduced to different degrees, especially at the mid-span position. The load-deflection curves at the l/4 and 3l/4 measuring points are approximately symmetrical. When the prefabricated crack depth in the mid-span is small (20 mm), the load-deflection curves at the l/4 and 3l/4 measuring points of the ZSS1 beam are similar to that of the WS beam. The load-deflection curves of the ZSS2 and ZSS3 beams are significantly lower than that of the WS beam when the prefabricated crack depth in mid-span is larger (i.e., 60 mm), which indicates that the depth of the mid-span crack has significant influence on the section stiffness of the test beam. In addition, the load-deflection curves of beams ZSS2 and ZSS3 at each measuring point show a similar trend compared with the ZSS1 beam, and obviously lower than the ZSS1 beam. The results show that section damage significantly affects the stiffness of the test beam, while the local damage of the tensile steel bar section has little effect on the overall stiffness of the test beam.
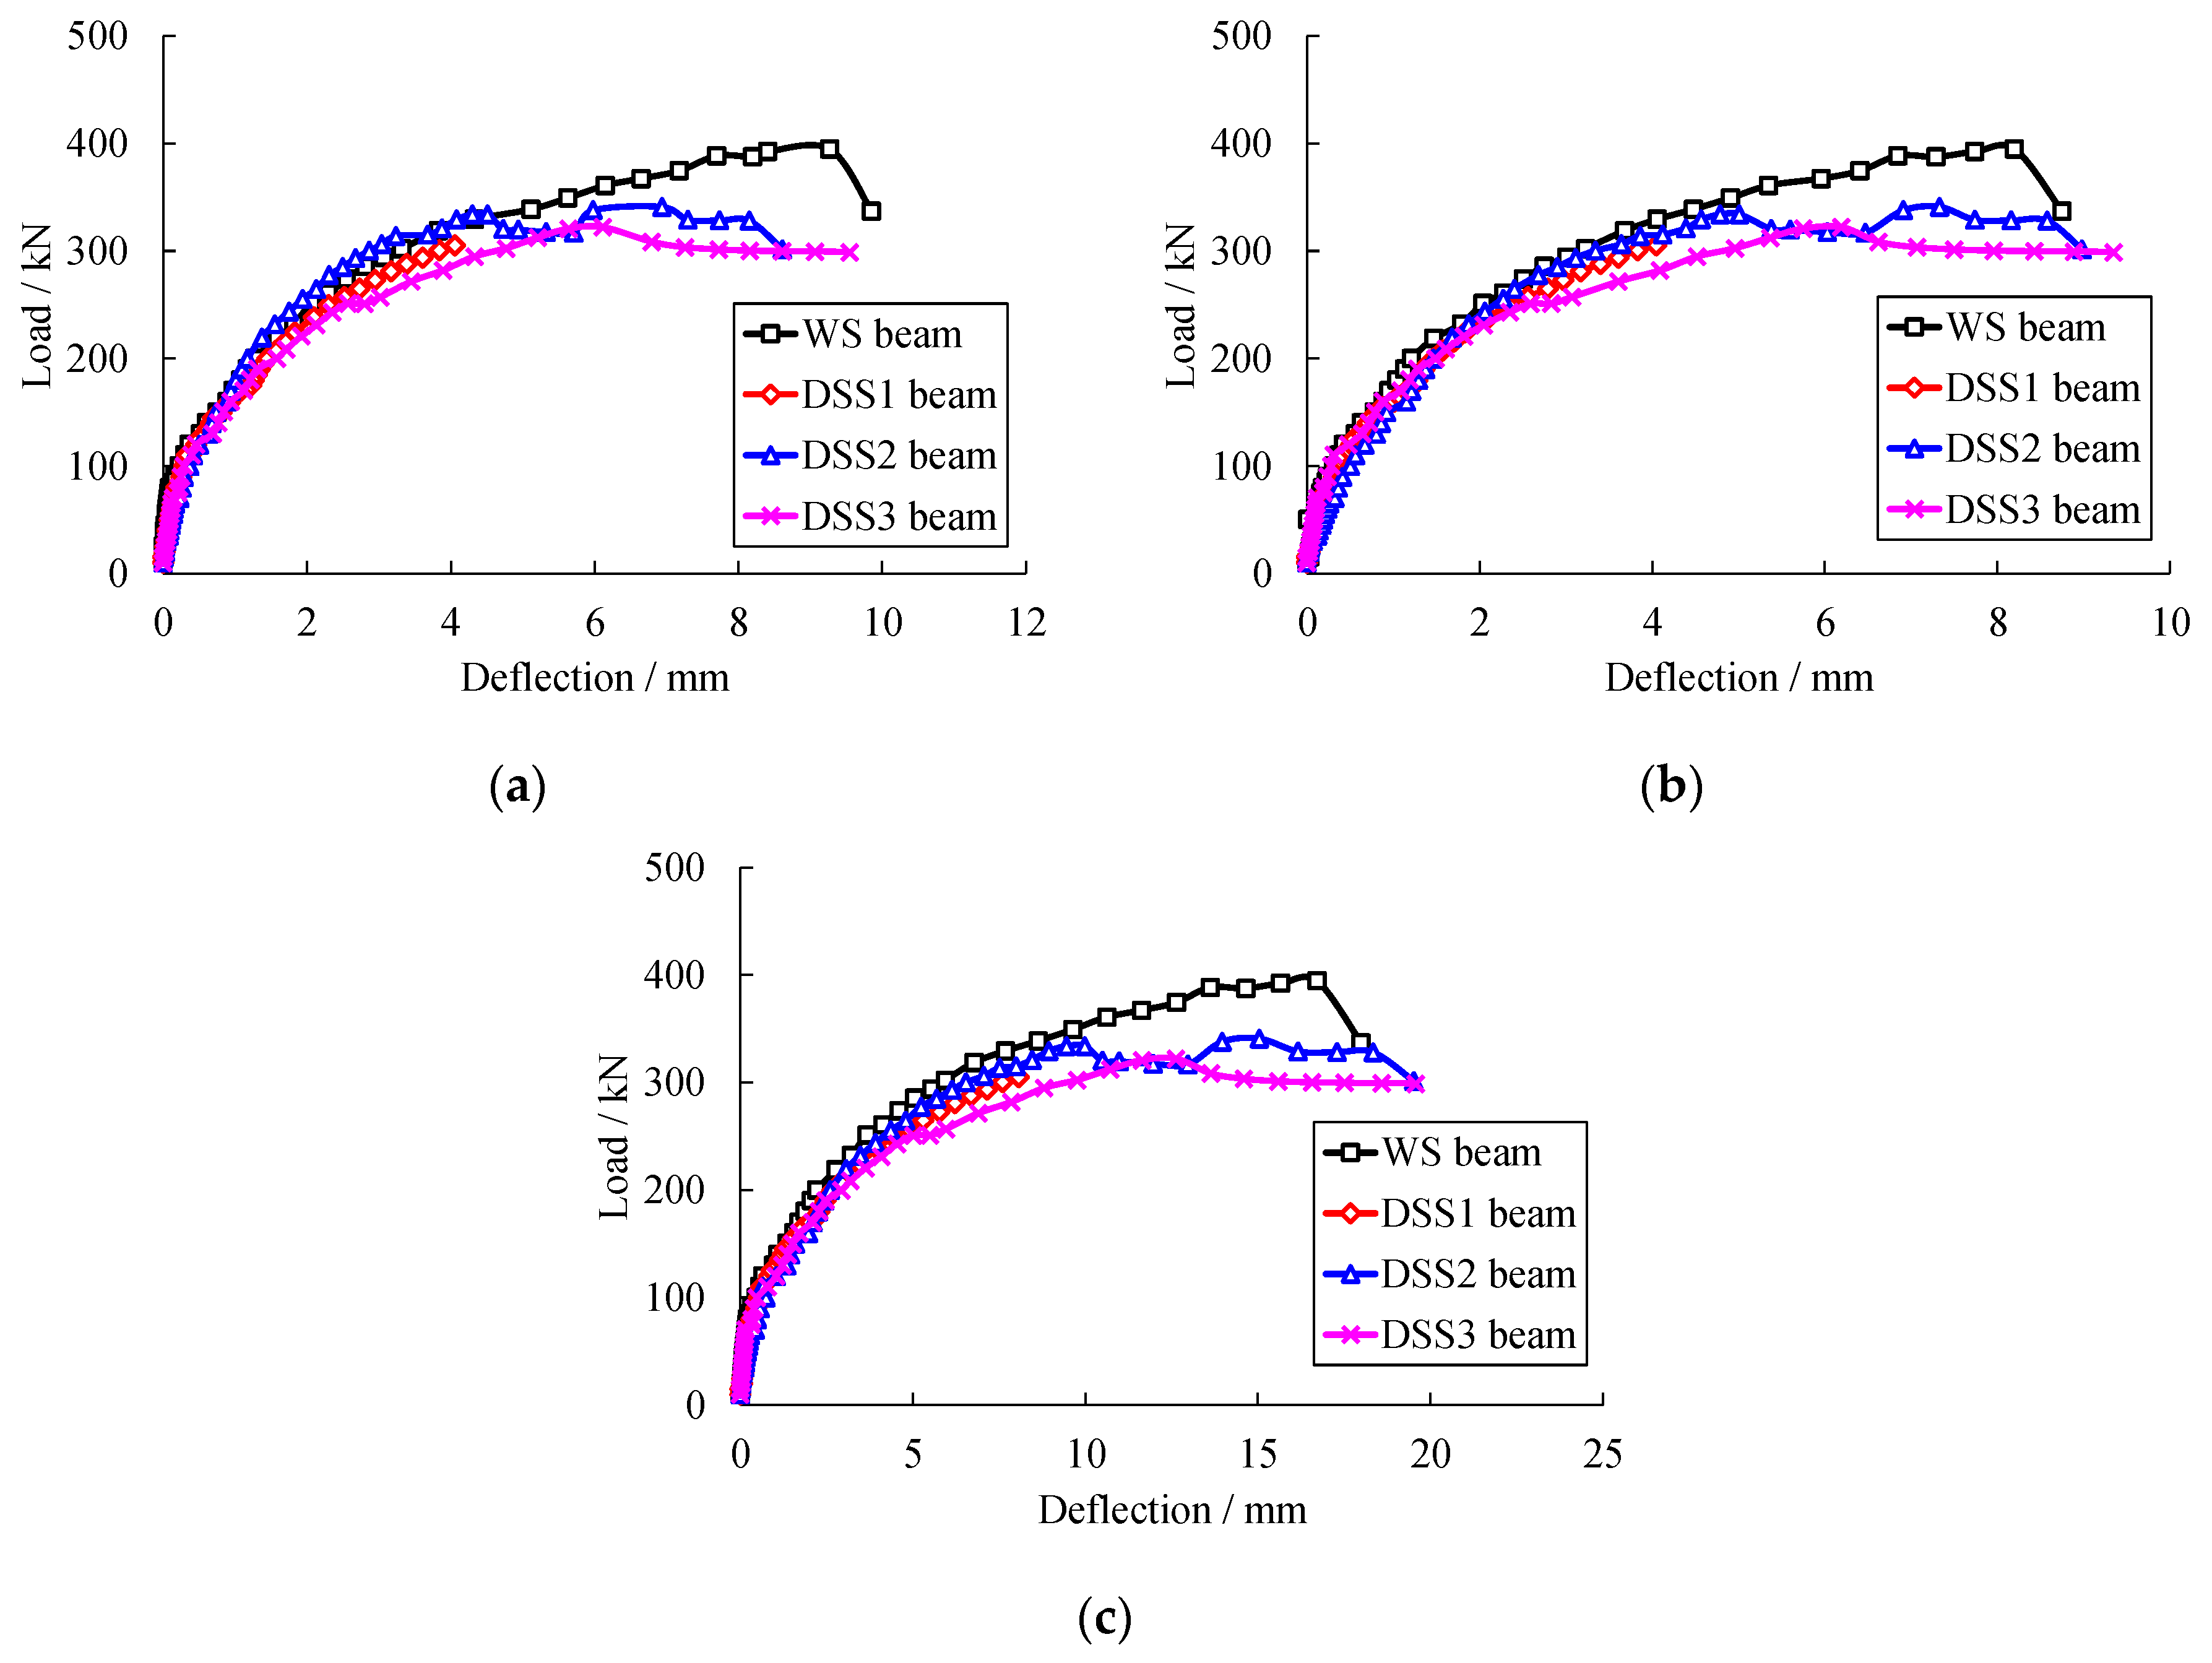
Figure 8 shows the load-deflection curves of each measuring point for pre-cracking at the l/4 position. As Figure 8 shows, the stiffness degradation of the test beam after pre-cracking at the l/4 position is not obvious. The load-deflection curve at each measuring point is in good agreement with that of the WS beam. Similar to beams ZSS1 to ZSS3, the load-deflection curves of beams DSS2 and DSS3 in the latter-half stage are significantly lower than those of WS beams when the prefabricated crack depth is larger (e.g., 60 mm), which indicates that the larger prefabricated crack depth at the l/4 position also affects the overall stiffness of the test beam.

3.3. Strain Distribution of Concrete and Reinforcing Steel

The load–stress relationship of the tensile steel bar at the main crack is shown in Figure 9. As shown in Figure 9, the load–stress curves of the steel bar showed a linear and slow growth trend before test beam cracking. The curves basically coincided. It can be seen that the tensile steel bar will bear tensile stress generated by the external load earlier with the increase in pre-cracked depth. The stress value of the steel bar under the same load condition is also larger. For example, the stress of the tensile steel bar at the main crack of the ZSS1 beam under 200 kN is 140.7 MPa, while the stress of the tensile steel bar in the ZSS2 beam is 149.6 MPa. Compared with the ZSS2 beam, the diameter of the steel bar at the main crack in the mid-span of the ZSS3 beam is further reduced, and the stress is 188.7 MPa under 200 kN.
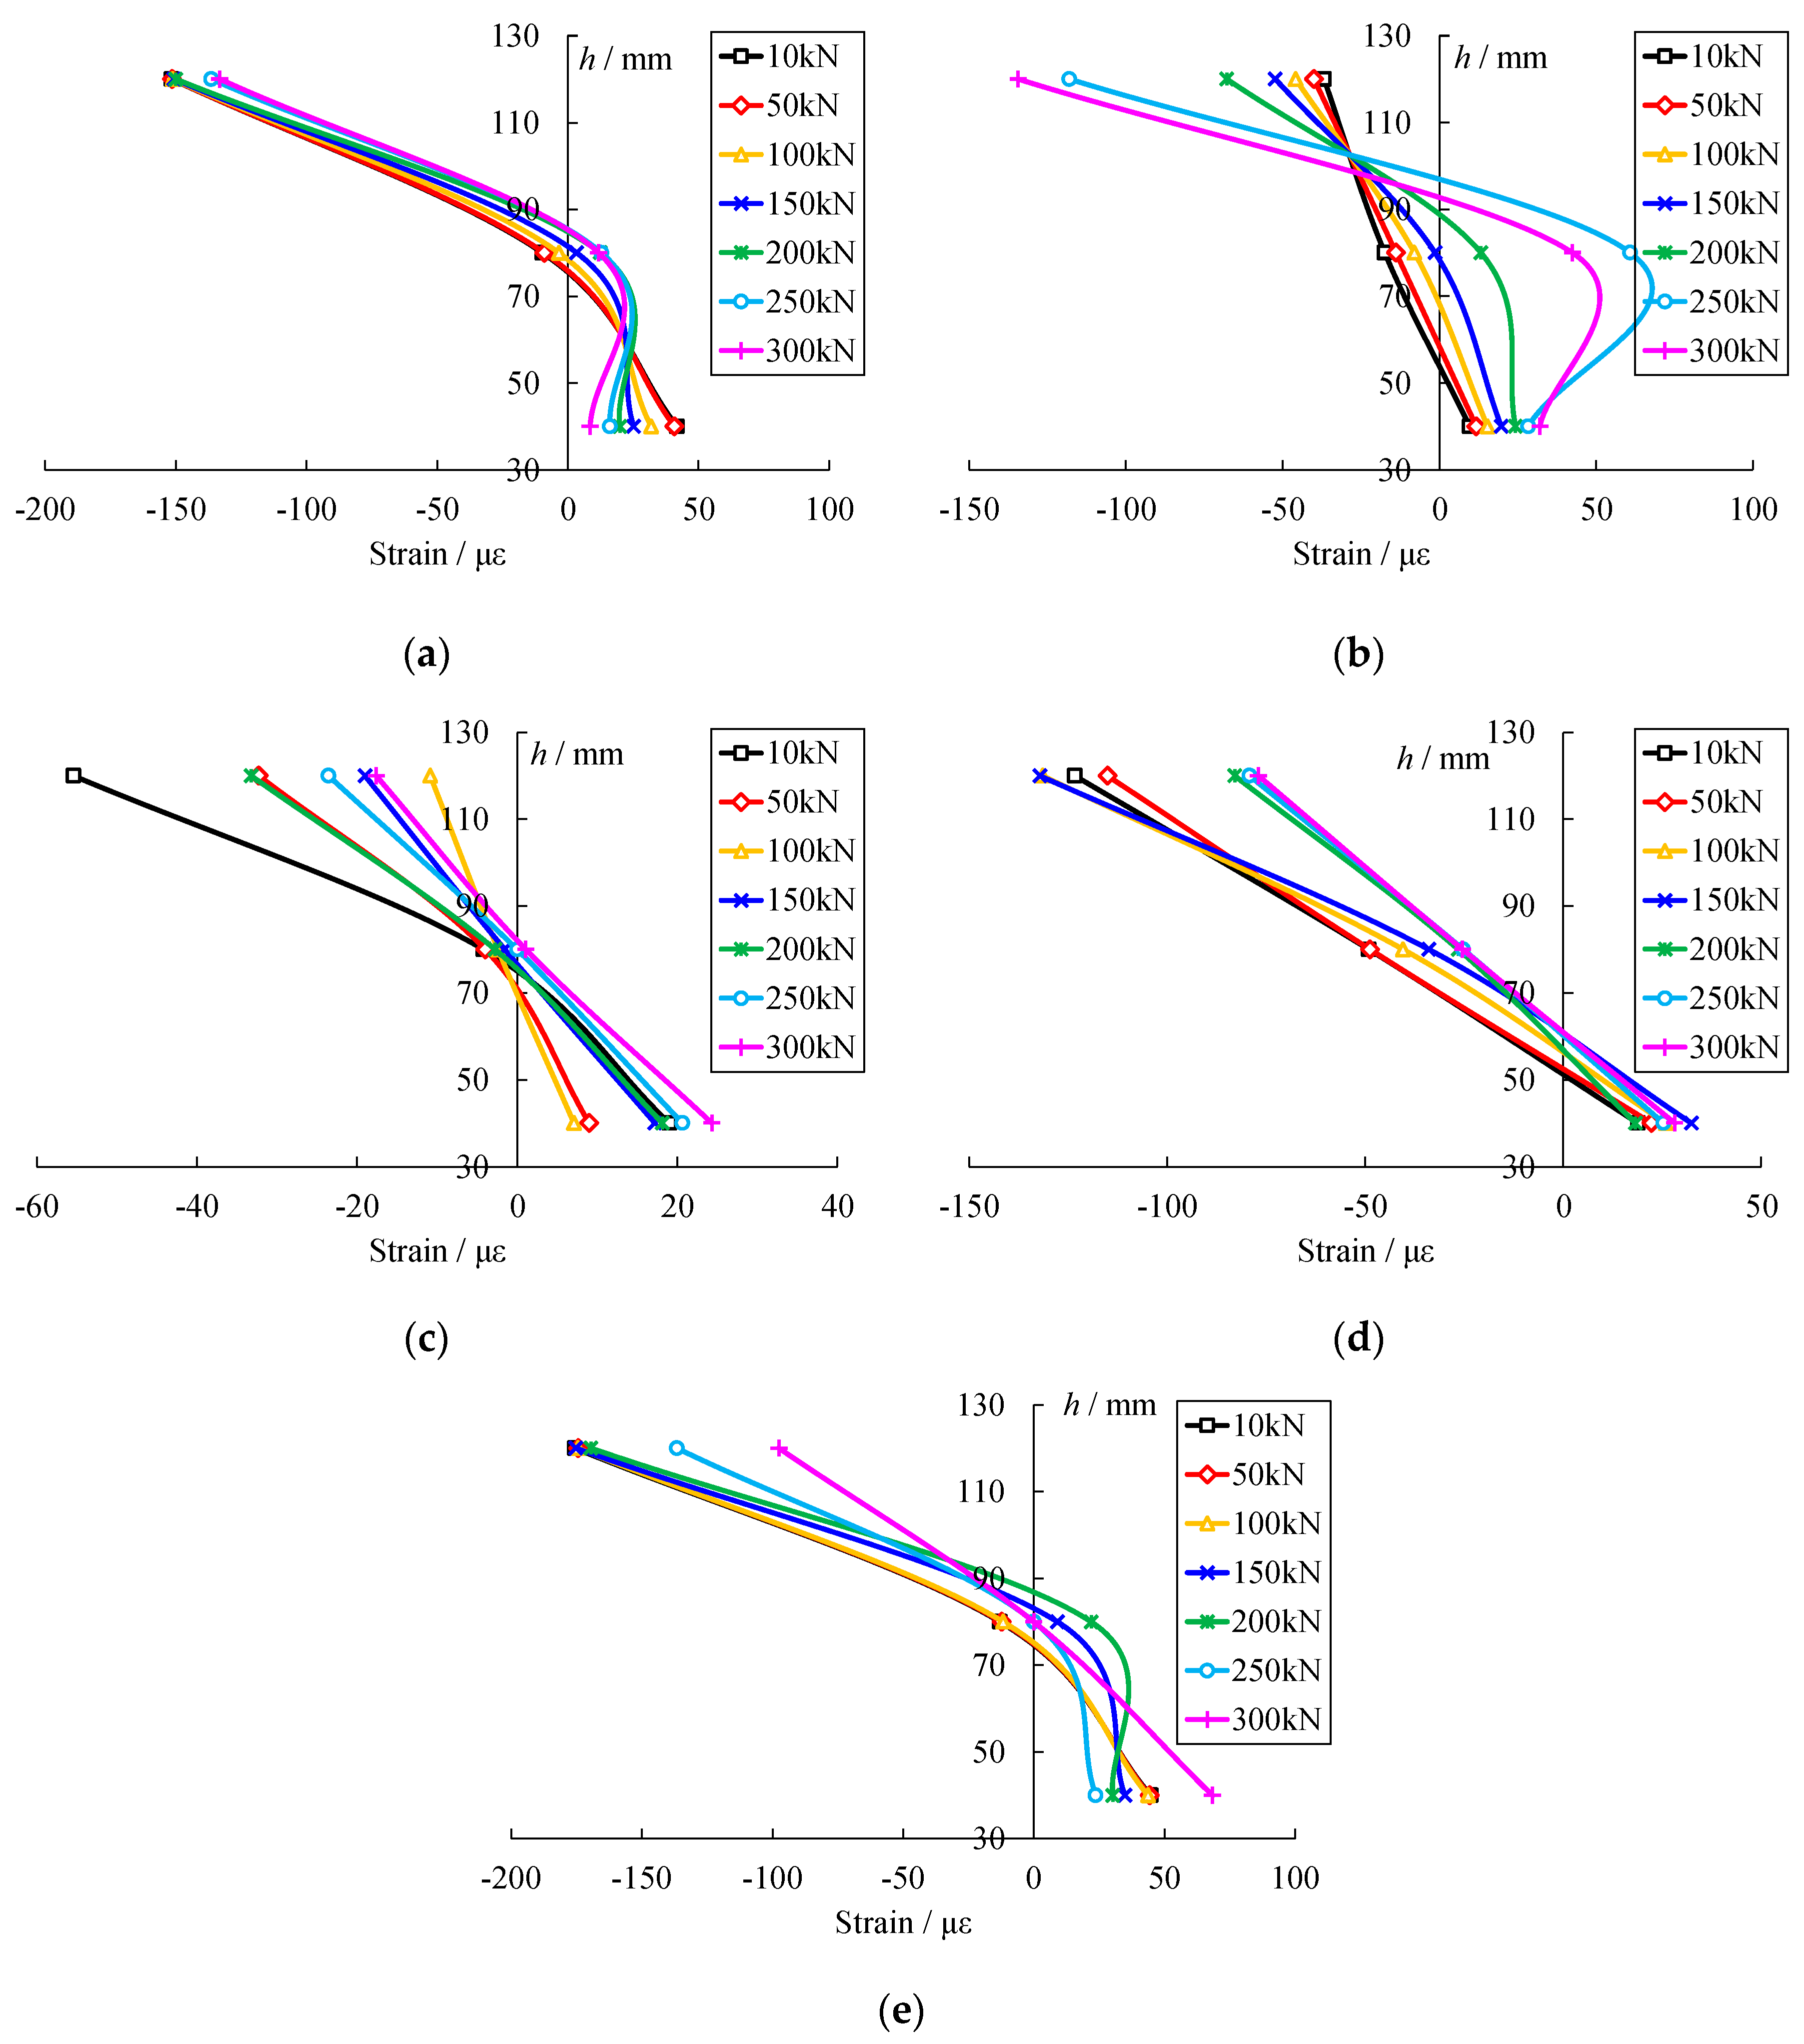
Figure 10 shows the distribution of concrete strain in the mid-span section along the height of the T-beams. As Figure 10 shows, the longitudinal strain of the concrete is linearly distributed along the height of the beam during the loading process. The prefabricated cracks do not change the strain distribution of concrete in the mid-span section. The pre-cracked test beams still conform to the assumption of the flat section. The position of the neutral axis of the pre-cracked test beam is higher than that of the WS beam under the same load. The result indicates that the prefabricated crack reduces the height of the compression zone, thus reducing the bearing capacity of the test beam. In addition, the neutral axis of the test beam moves upward as the crack grows. The rise rate of the neutral axis of the pre-cracked test beam is higher than that of the WS beam, which further indicates that the test beam with cracks degrades the mechanical properties of the structure.

3.4. The Cracking Load and Ultimate Load

Figure 11 shows the cracking load of each test beam. As is shown in Figure 11, the cracking load of pre-cracked test beams decreased in different degrees compared with the WS beam, which is mainly due to the stress concentration effect at the prefabricated crack. For example, the cracking loads of beams ZSS1, ZSS2 and ZSS3 are 40 kN, 60 kN and 55 kN respectively, which decrease by 52.9%, 29.4% and 35.3%, respectively, compared with the WS beam (cracking load is 85 kN). The cracking loads of beams DSS1, DSS2 and DSS3 are 30 kN, 70 kN and 70 kN, respectively, which are reduced by 64.7%, 17.6% and 17.6%, respectively, compared with the WS beam. This is mainly because of the spatial heterogeneity of the concrete aggregate, and there are several weak points in the test beam. Cracks form easily in the weak positions under the action of the load.
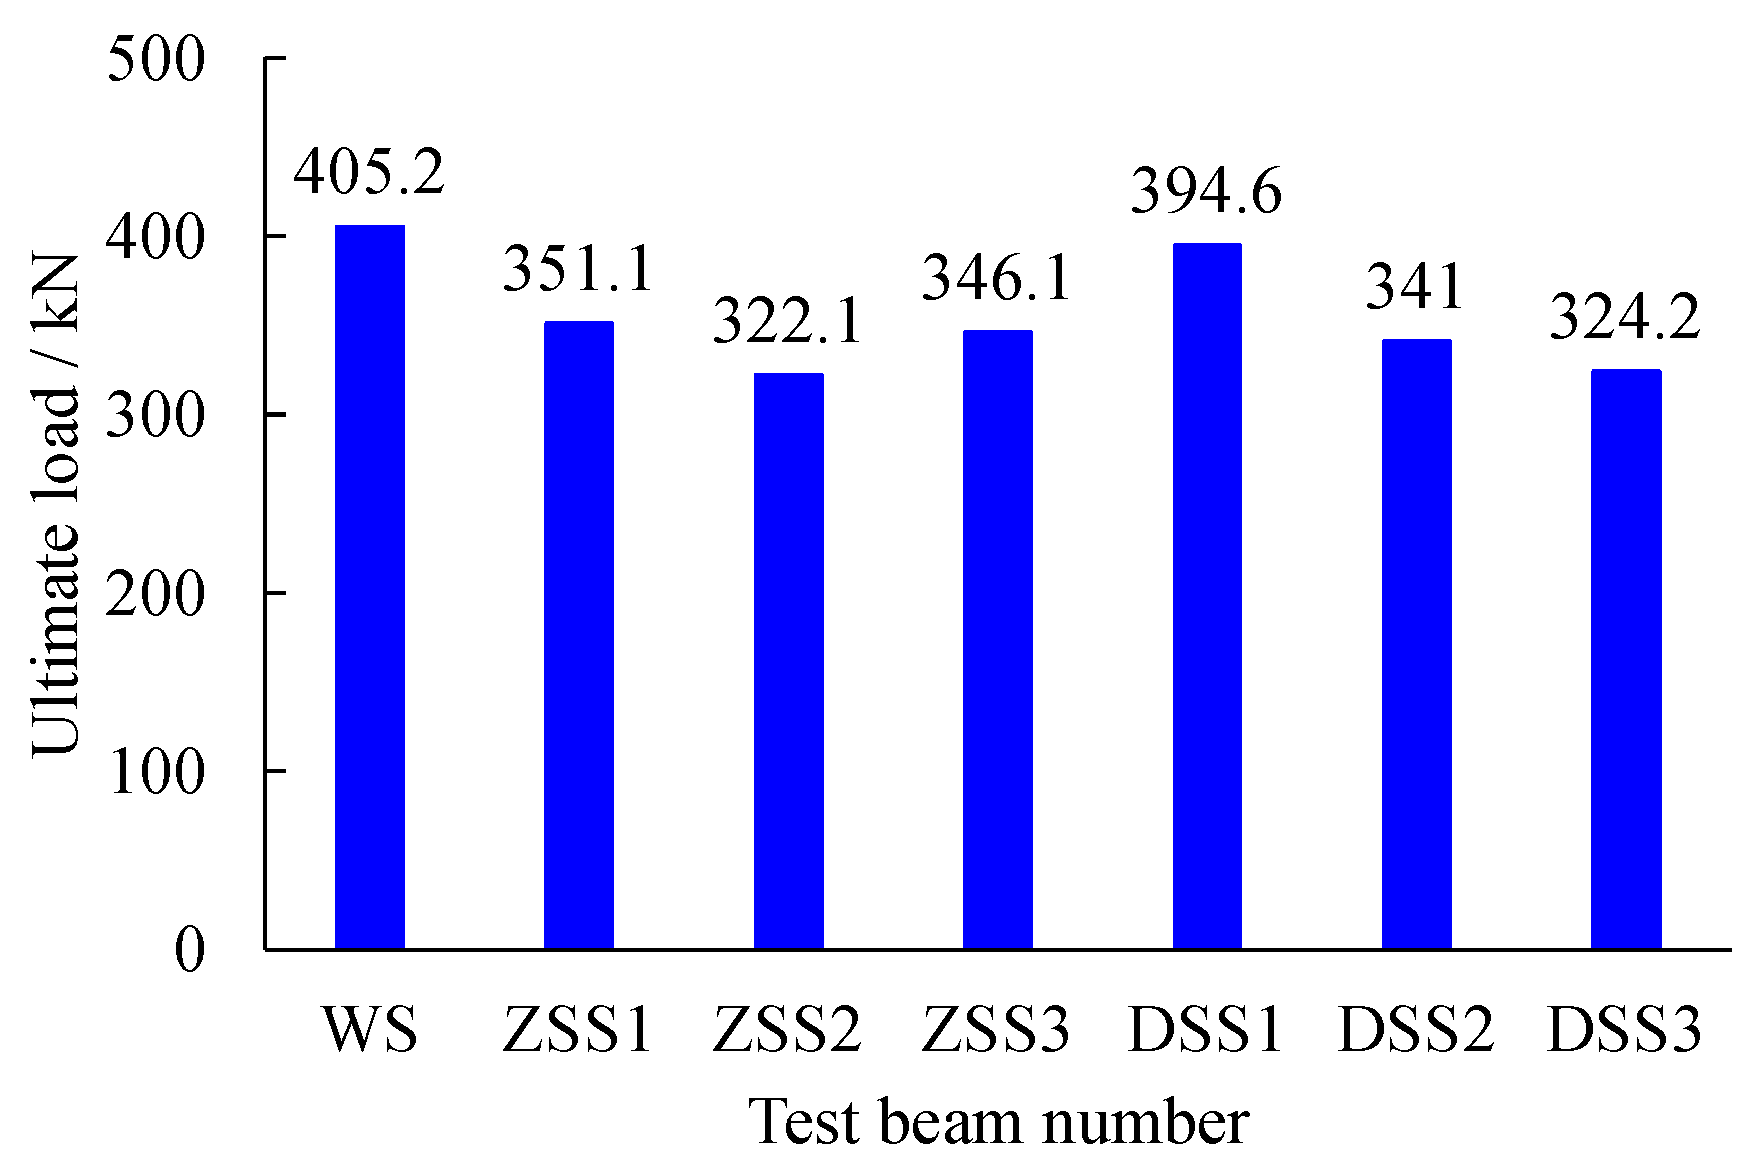
Figure 12 shows the ultimate load of each test beam. As Figure 12 shows, the ultimate load of the pre-cracked test beams decreased in different degrees, compared with the WS beam. For example, the ultimate loads of beams ZSS1, ZSS2 and ZSS3 are 351.1 kN, 322.1 kN and 346.1 kN, respectively, which decrease by 13.4%, 20.5% and 14.6%, respectively, compared with the WS beam (the ultimate load is 405.2 kN). The results show that the prefabricated crack in the mid-span has significant impact on the bearing capacity of the test beam. The deeper the prefabricated crack height, the greater the reduction in the bearing capacity. For example, the depth of the prefabricated crack in the ZSS2 beam is 60 mm, and its ultimate bearing capacity is 322.1 kN, which is 29 kN lower than that of the ZSS1 beam with a 20 mm pre-cracked depth. Compared with the WS beam, the bearing capacity of the pre-cracked test beam at l/4 position also decreased, to varying degrees. The ultimate bearing capacity did not decrease significantly when the crack depth was small (20 mm). Because the test adopts a three-point bending load, the failure mode of the test beam is that the main crack forms at the mid-span, and the roof concrete is crushed near the loading point. Therefore, the overall change in the law of stiffness and bearing-capacity degradation caused by the prefabricated crack at the l/4 position is consistent with that of the test beam at mid-span.

4. FE Numerical Model of Pre-Cracked Beam

4.1. Overview of FE Numerical Models

In this section, ABAQUS is used to establish the FE model of the pre-cracked test T-beam. The FE model was mainly composed of concrete, steel cage and prefabricated cracks. The steel cage was embedded in the T-beam concrete. The translational freedom degrees of the reinforcement joints were consistent with the embedded concrete units. The network division of the T-beams was executed using three-dimensional 8-node reduction integral element (C3D8R). The three-dimensional 2-node truss elements (T3D2) were used to divide the network of the steel cage. The global network size was 20 mm. The freedom degree of the T-beam loading surface was coupled to a reference point above the top surface of the beam. Load was applied to the reference point. The calculation and analysis adopted the position control method. The FE model of the pre-cracked T-beam is shown in Figure 13.
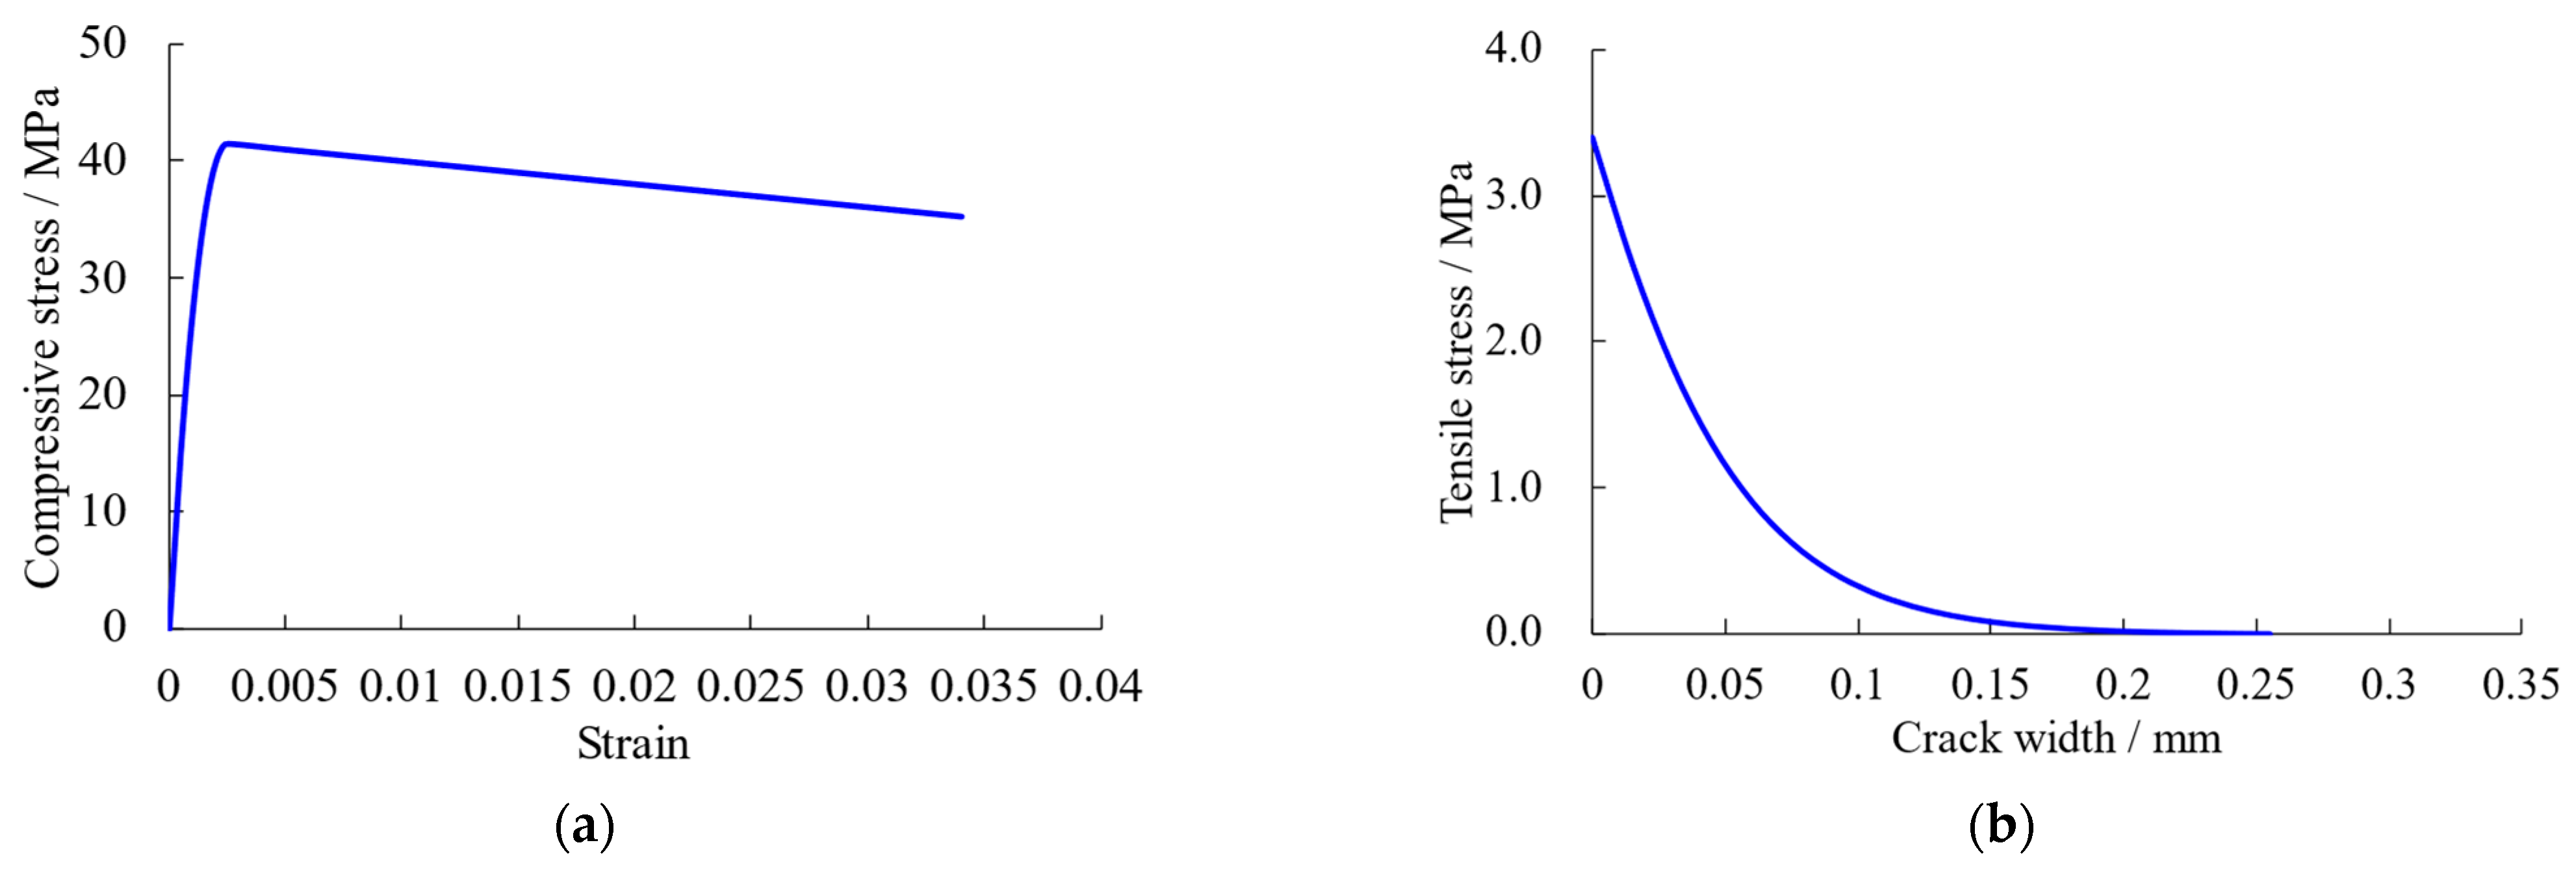
The compressive performance of concrete adopts a uniaxial compressive stress–strain curve. The tensile performance of concrete adopts a tensile stress-crack width curve. The constitutive relation curve of C50 concrete used in this test is shown in Figure 14. The concrete compressive stress–strain curve is divided into three stages. Stage I: the relationship between stress and strain is linear when the compressive stress is less than 0.4fc. The slope of the curve is Ec. Stage II: the relationship between stress and strain is parabolic when the compressive stress is greater than 0.4fc and less than the compressive strength. Stage III: the stress decreases linearly with the increase in strain when the compressive stress is greater than the compressive strength of the concrete. The ultimate strain of the concrete is taken as 0.034. The constitutive relationship of the concrete can be expressed as [39]
σ c = { E c ε c , 0 σ c 0.4 f c f c ( k η η 2 ) [ 1 + ( k 2 ) η ] , 0.4 f c σ c f c ( 1 4.76 ε c ) f c ε c p , ε c p ε c 13.6 ε cp
σ t f t = [ 1 + ( c 1 w w t ) 3 ] e ( c 2 w w c ) w w c ( 1 + c 1 3 ) e ( c 2 )
where σc is the compressive stress of the concrete; Ec is the elastic modulus of the concrete, Ec = 3.45 × 10⁴ MPa; εc is the compressive strain of the concrete; fc is the compressive strength of the concrete cylinder, fc = 41.5 MPa; k is the plasticity value, k = Ec × εcp/fc, which is 2.078 in this study; η is the ratio of strain to peak strain, η = εc/εcp, εcp = 0.0025; σt is the tensile stress of the concrete; ft is the tensile strength of the concrete, ft = 3.4 MPa; w is the crack width; wc is the crack width when the stress is completely released, wc = 0.216 mm; and constant items c1 = 3, c2 = 6.93.
The plastic-damage model is used to consider the nonlinear behavior of concrete. The compression damage factor (dc)and tension damage factor (dt)are used to represent the degradation response of concrete materials. The damage factors of dc and dt range from 0 to 1, where the damage factor of 0 or 1 means no damage or complete failure, respectively. dc and dt of concrete are related to plastic strain (εcpl) and plastic crack width (wpl), respectively. The concrete plastic-damage factor can be expressed as [39]
d c = 1 σ c / [ E c ε c p l ( 1 b c 1 ) + σ c ]
d t = 1 σ t / [ E c w p l ( 1 b t 1 ) + σ t ]
where constant items bc = 0.7, bt = 0.1.
The steel adopts the ideal elastic-plastic model, with its density set at 7900 kg/m3, elastic modulus of 200 GPa, Poisson’s ratio of 0.3, yield stress of 400 MPa and ultimate strain of 10,000 με.

4.2. Numerical Simulation Results

Figure 15 shows the comparison results of the load–slip curves of the test beams. Beams WS, ZSS1 and DSS1 were taken as examples, for illustration purposes. As Figure 15 shows, the experimental results are in good agreement with the theoretical values in the elastic stage, which validates the reliability of the FE numerical model of the pre-cracked test beam established in this study. Since the hydraulic equipment has automatic protection during the test, the test will be terminated after reaching the ultimate range. Therefore, the development trend of the load–deflection curve in the plastic stage is not obvious, compared with the FE results.

5. Theoretical Model of Flexural Bearing Capacity of Pre-Cracked Beam

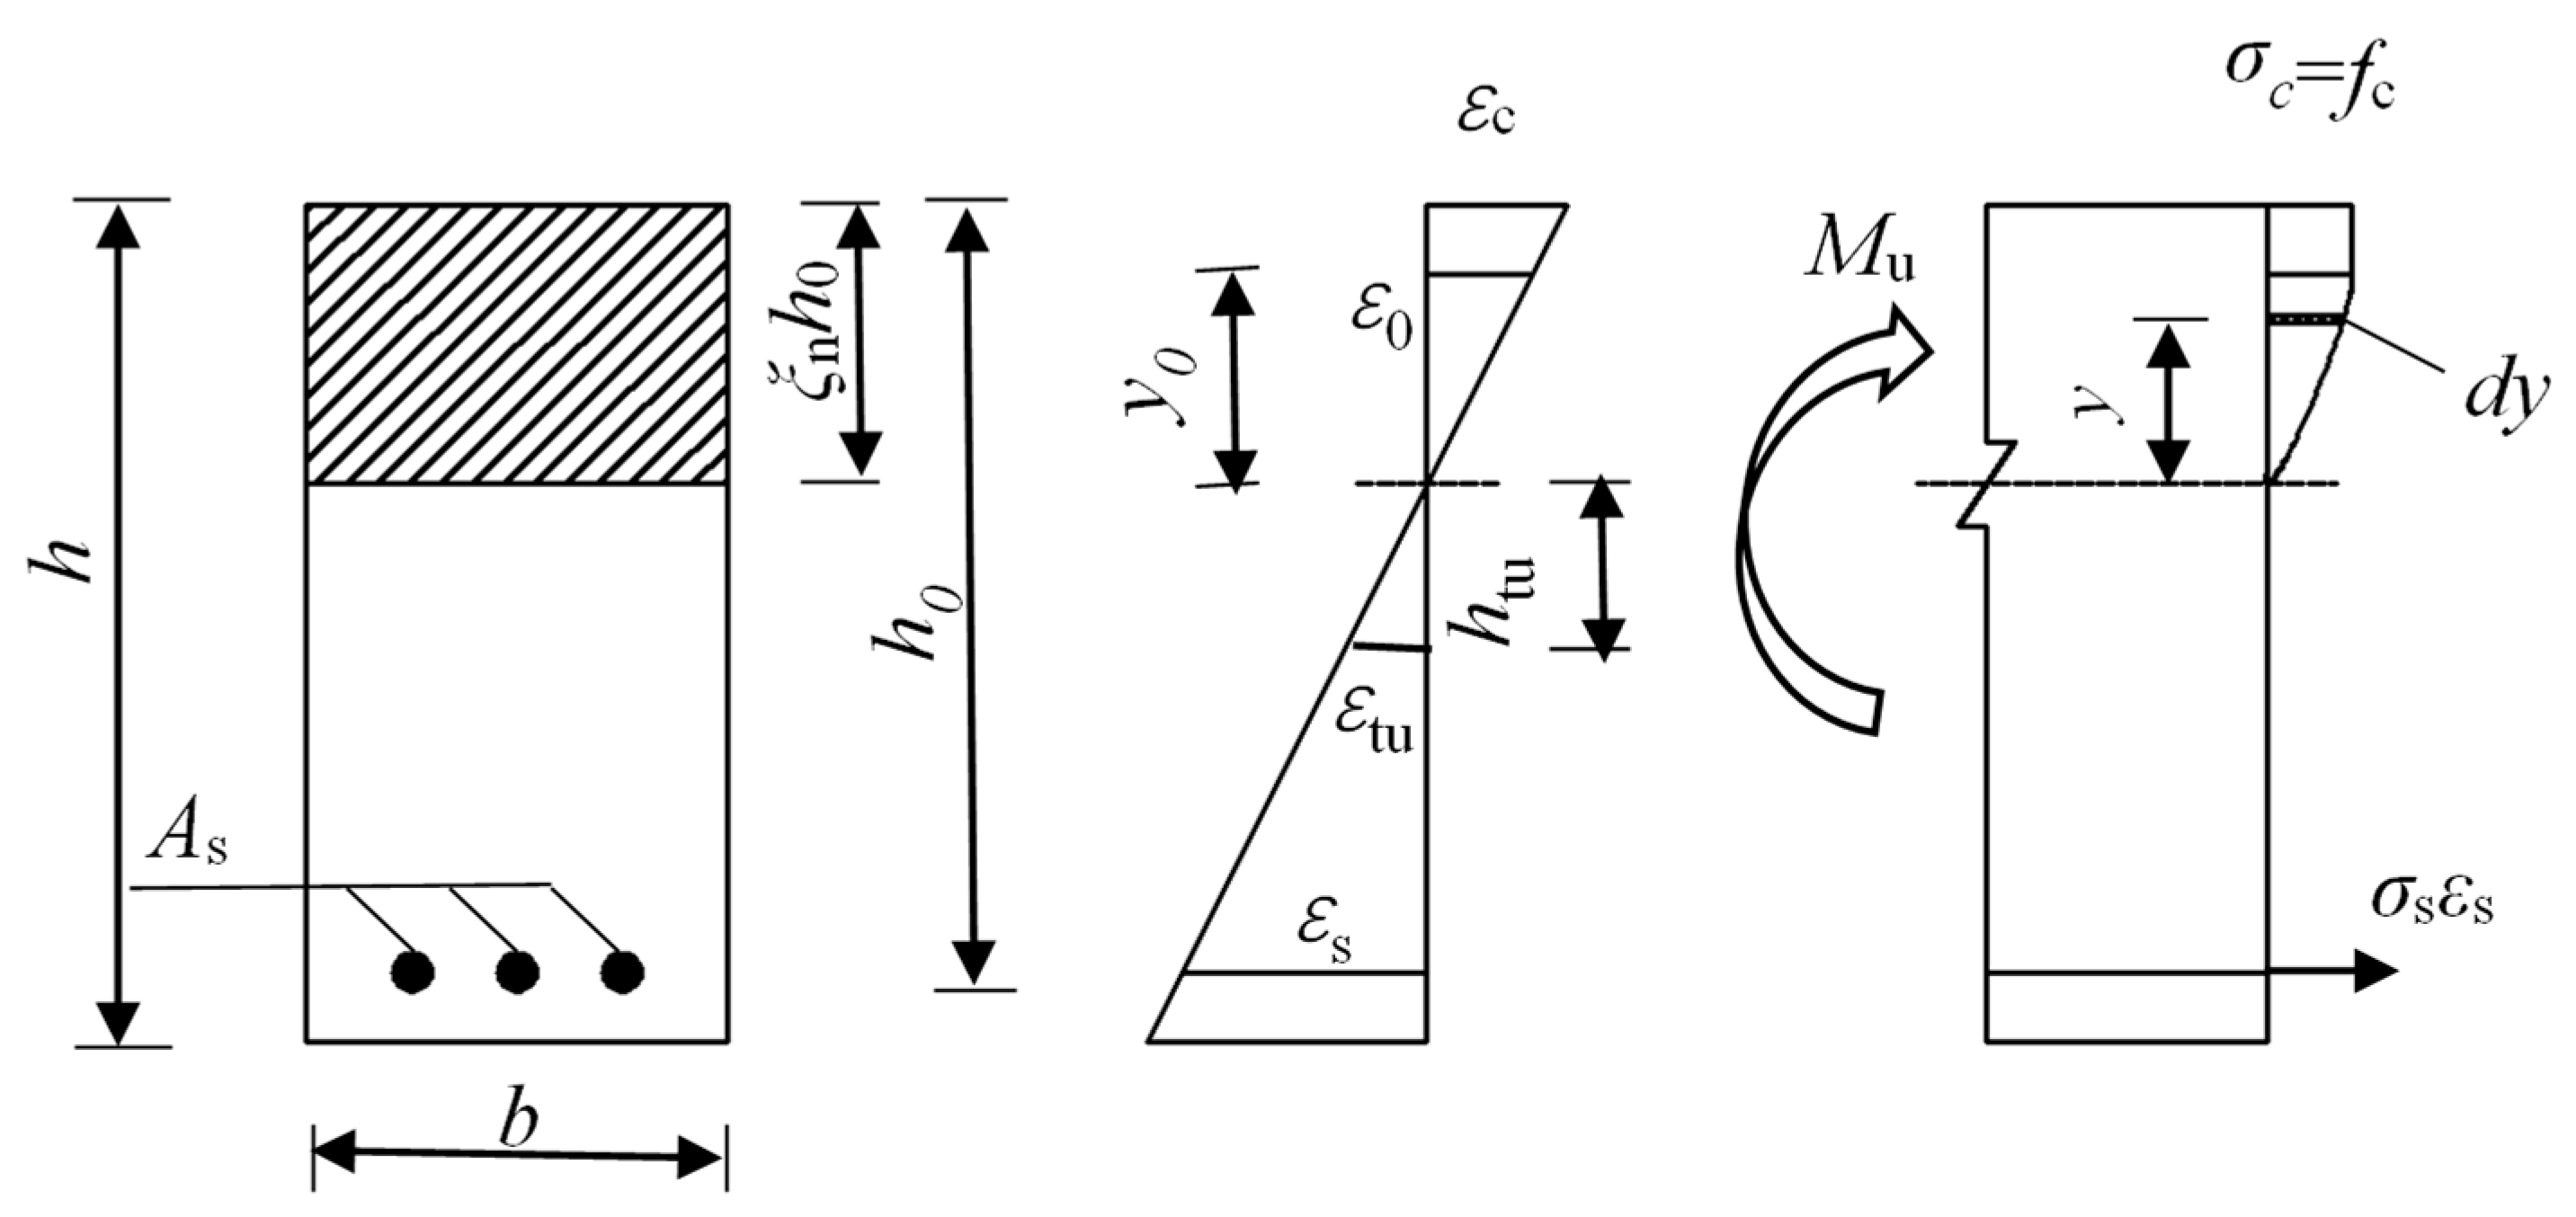
The experimental results showed that the failure mode in the limit state was cracking in the tensile zone of the concrete. Then, the tensile steel bar reached the yield strength. Finally, the concrete in the compression zone was crushed. At this stage, the concrete strain (εc) in the compression zone was greater than the peak strain (ε0) in the elastic stage, which was the plastic stage. According to the design code GB 50010-2010 [40], the stresses of concrete in the compression zone and the steel bar in the tension zone reached the design strength at the ultimate stage. The concrete compression zone (ε > ε0) was equivalent to a rectangular distribution, and the stress of the concrete compression zone (εε0) was a curved distribution. The geometric relationship can be expressed as
ε c ξ n h 0 = ε t u h t u = ε y = ε s h 0 ( 1 ξ n )
where εc is concrete strain; ξ n is the height of the relative boundary compression zone; h0 is the height of the effective section; εtu is the section strain in the tension zone; htu is the height of the current section from the neutral axis; εs is rebar strain. The meaning of the parameters is shown in Figure 16.
The equilibrium equation can be expressed as
{ σ s A s = 0 ξ n h 0 σ c b ( y ) d y σ s A s = 0 y 0 σ 0 ( 2 ϕ y ε 0 ϕ 2 y 2 ε 0 2 ) b d y + y 0 ξ n h 0 σ 0 b ( y ) d y
where σ0 is the peak stress in the elastic stage of concrete; φ is geometric parameters; b is the width of the cross section.
The height of the neutral axis can be obtained according to the limit condition of concrete compressive strain (εc = 0.0033), i.e.,
ξ n h 0 = f y ρ h σ 0 ( 1 ε 0 ε c )
where fy is the tensile design strength of reinforcement; ρ is the reinforcement ratio; h is the height of the beam.
Assuming εu = 0.0001, the crack growth height can be expressed as
h c r = h 0.95 ξ n h 0
Generally, the tensile steel bar also reached the ultimate tensile strength when the concrete in the compression zone entered plastic failure, i.e., εc = 0.0033 and εs = 0.01. The geometric relationship can be written as
ε c ξ n h 0 = ε s h 0 ( 1 ξ n )
Then, ξ n = 0.248 can be obtained. The maximum height of the crack can be expressed as
h c r = h 0.255 h 0
At this time, the load carried by the RC beam was the ultimate bending moment. To simplify the calculation, the stress curve of the concrete -plastic zone was simplified as a triangle shape. The geometric relationship can be derived as
{ y 0 = ε 0 ε c ξ n h 0 = 0.002 0.0035 ξ n h 0 = 0.57 ξ n h 0 M u = ( h 0 ξ n h 0 + 2 3 y 0 ) σ s A s + ( ξ n h 0 y 0 2 + y 0 3 ) σ c b ( ξ n h 0 y 0 )
where Mu is the ultimate bending moment.
Combining Equations (5)–(11), the ultimate bending moment can be written as
M u = ( h 0 0.62 ξ n h 0 ) σ s A s + 0.18 σ c b ξ n 2 x 0 2
Generally, RC bending members work with cracks, in practical service. Each cross section subjected to a bending load will rotate at an angle of φ, as shown in Figure 17. The curvature of the deflection curve can be obtained according to material mechanics, i.e.,
φ = 1 ρ = d 2 y d x 2 = M B
The mid-span deflection of the RC beam can be expressed as
f = α M l 2 B
where α is the influence coefficient, which is related to support conditions and load forms; l is the calculated span; f is the mid-span deflection; and M and B are mid-span bending moment and bending stiffness, respectively.
Under a three-point bending load, the bending moment at the mid-span of a simply supported RC beam can be expressed as
M = P u l 4
where Pu is the vertical concentrated load and l is the calculation span of the simply supported beam, l = 1900 mm.
For RC flexural members, the flexural stiffness of cracked members can be expressed as
B = B 0 ( M c r M s ) 2 + [ 1 ( M c r M s ) 2 ] B 0 B c r
The short-term stiffness (Bs) calculation formula of RC flexural members can be derived as
B s = E s A s h 0 2 1.15 ψ + 0.2 + 6 α E ρ 1 + 3.5 γ f
The meanings and values of related parameters in Equations (16) and (17) can be found in Specification JTG 3362-2018 [41].
Figure 18 shows the schematic diagram of the effective height of the pre-cracked T-beam section. The effective height of the T-beam section considering prefabricated cracks can be expressed as [42]
h 0 = h c η h c
where h is the height of the cross section; c is the thickness of the concrete protection layer, which is 41 mm in this study; hc is the height of the prefabricated crack; and η is the impact factor of the prefabricated crack.
The value of η is taken as 1 when the prefabricated crack is located in the mid-span and the height does not exceed the thickness of the protective layer. The value of η is taken as 1.15 when the height of the prefabricated crack exceeds the thickness of the protective layer. At this time, the thickness of the protective layer is ignored. When the prefabricated crack occurs at the quarter position, η is taken as 0.5 in this study.
The measured strains of concrete and steel, and mid-span deflections of RC beams are used to calculate the ultimate load under the bending load of the pre-cracked test beam. Figure 19 shows the results of calculated values and experimental observations, where the x axis is the experimental values and the y axis is the theoretical predictions. In addition, 95% confidence intervals (CI) are also provided. It can be seen from Figure 19 that the calculated values all fall within the confidence intervals. The mean of the ratio of the theoretical calculations and measured results is 1.008, and the standard deviation is 0.031. The theoretical calculations are in good agreement with the experimental results, which verifies the validity and accuracy of the proposed calculation model for the flexural capacity of the pre-cracked test beam.

6. Conclusions

In this paper, stepwise static-load tests of RC T-beams are performed. The failure mode and mechanism of the pre-cracked test beam under load are revealed. The influence of prefabricated cracks on the bearing capacity is compared and quantified. The results indicate that the direct damage to the mid-span section size can significantly affect the stiffness of the RC beam. The local damage to the tensile steel section has little influence on the overall stiffness of the beam. The stiffness degradation of the pre-cracked beam at the quarter span is smaller than that of the pre-cracked beam at mid-span. The strain of the T-beam section in the pre-cracked test conformed to the assumption of the flat section. The neutral axis of the beam moves upward with the growth of the crack, and the rise rate of the neutral axis of the pre-cracked beam is higher than that of the intact beam. The cracks degrade the mechanical properties of the RC beam. Compared with the intact beam, the ultimate load of beams ZSS1, ZSS2 and ZSS3 decreased by 13.4%, 20.5% and 14.6%, respectively; i.e., the prefabricated crack in mid-span has a greater impact on the bearing capacity of the test beam than the pre-cracked at l/4 position. Based on the experimental results, an FE numerical simulation method of pre-cracked beam was used and validated. Following this, a theoretical prediction method was proposed to calculate the ultimate load of the pre-cracked RC beam. The mean of the ratio of the theoretical calculations and measured results is 1.008, and the standard deviation is 0.031. A satisfactory result is observed between the theoretical calculations and experimental values, which can provide a theoretical basis for the performance evaluation of existing RC beams.
In this paper, the flexural performance degradation of pre-cracked RC beams under static load is investigated. However, the distribution of concrete cracks is often random in practical engineering, and the stochastic finite-element modeling method still needs further study. RC beams with cracks under vehicle loads are also subjected to repeated load and environmental erosion, and the structural behavior of cracked RC beams under the corrosion fatigue effect will be included in the future. Furthermore, due to the limited number of samples, there are some empirical assumptions of the height of the prefabricated crack, and caution should be exercised when extending this theoretical model to other types of concrete structures. Pre-cracked RC beams are a relatively new branch of reinforced concrete. Our future work will continue to reveal the similarities and differences between the pre-cracked beam and the complete beam in terms of service performance and failure mechanism.

Author Contributions

Conceptualization, S.Z.; methodology, S.Z.; software, S.Z.; validation, D.Y.; formal analysis, S.Z.; investigation, S.Z.; resources, D.Y.; data curation, S.Z.; writing—original draft preparation, S.Z.; writing—review and editing, D.Y.; visualization, D.Y.; supervision, D.Y.; project administration, S.Z.; funding acquisition, S.Z. All authors have read and agreed to the published version of the manuscript.

Funding

This research received no external funding.

Institutional Review Board Statement

Not applicable.

Informed Consent Statement

Not applicable.

Data Availability Statement

The data underlying this article will be shared upon reasonable request to the corresponding author.

Conflicts of Interest

The authors declare no conflict of interest.

Nomenclature

σcthe compressive stress of concrete
Ecthe elastic modulus of concrete
εcthe compressive strain of concrete
fcthe compressive strength of the concrete cylinder
kthe plasticity value
ηthe ratio of strain to peak strain
σtthe tensile stress of concrete
ftthe tensile strength of concrete
wthe crack width
wcthe crack width when the stress is completely released
c1, c2the constant items
dcthe compression damage factor
dtthe tension damage factor
εcplthe plastic strain
wplthe plastic crack width
bc, btthe constant items
ξnthe height of the relative boundary compression zone
h0the height of the current section from the neutral axis
εsthe rebar strain
εtuthe section strain in the tension zone
htuthe height of the current section from the neutral axis
σ0the peak stress in the elastic stage of concrete
φthe geometric parameters
bthe width of the cross section
fythe tensile design strength of reinforcement
ρthe reinforcement ratio
hthe height of the beam
Muthe ultimate bending moment
αthe influence coefficient which relates to support conditions and load forms
lthe calculated span
fthe mid-span deflection
Mthe mid-span bending moment
Bthe bending stiffness
Puthe vertical concentrated load
lthe calculation span of the simply supported beam
hthe height of the cross section
cthe thickness of the concrete protection layer
hcthe height of the prefabricated crack
ηthe impact factor of the prefabricated crack

References

  1. Giuriani, E.; Plizzari, G.A. Interrelation of splitting and flexural cracks in RC beams. J. Struct. Eng. 1998, 124, 1032–1049. [Google Scholar] [CrossRef]
  2. Ma, Y.; Peng, A.; Su, X.; Wang, L.; Zhang, J. Modeling constitutive relationship of steel bar removed from corroded PC beams after fatigue considering spatial location effect. J. Mater. Civ. Eng. 2021, 33, 04021019. [Google Scholar] [CrossRef]
  3. Ma, Y.; Guo, Z.; Wang, L.; Zhang, J. Experimental investigation of corrosion effect on bond behavior between reinforcing bar and concrete. Constr. Build. Mater. 2017, 152, 240–249. [Google Scholar] [CrossRef]
  4. Aasim, B.A.; Karimi, A.K.; Tomiyama, J.; Suda, Y. Horizontal end crack control and load-bearing capacity performance of hollow-type pretensioned girders through experimentally calibrated finite element models. Eng. Sci. Technol. Int. J. 2021, 24, 1262–1271. [Google Scholar] [CrossRef]
  5. Nasser, H.; Vandewalle, L.; Verstrynge, E. Effect of pre-existing longitudinal and transverse corrosion cracks on the flexural behaviour of corroded RC beams. Constr. Build. Mater. 2022, 319, 126141. [Google Scholar] [CrossRef]
  6. Triantafyllou, G.G.; Rousakis, T.C.; Karabinis, A.I. Analytical assessment of the bearing capacity of RC beams with corroded steel bars beyond concrete cover cracking. Compos. Part B Eng. 2017, 119, 132–140. [Google Scholar] [CrossRef]
  7. Hoseinzade, M.; Esfahani, M.; Arbab, F.; Shakiba, M.; Yekrangnia, M. Residual flexural capacity of pre-cracked RC beams exposed to chloride penetration at the sea surface temperature. Constr. Build. Mater. 2022, 343, 128126. [Google Scholar] [CrossRef]
  8. Zhang, M.; Akiyama, M.; Shintani, M.; Xin, J.; Frangopol, D.M. Probabilistic estimation of flexural loading capacity of existing RC structures based on observational corrosion-induced crack width distribution using machine learning. Struct. Saf. 2021, 91, 102098. [Google Scholar] [CrossRef]
  9. Ma, Y.; Guo, Z.; Wang, L.; Zhang, J. Probabilistic life prediction for reinforced concrete structures subjected to seasonal corrosion-fatigue damage. J. Struct. Eng. 2020, 146, 04020117. [Google Scholar] [CrossRef]
  10. Thoma, K. Finite element analysis of experimentally tested RC and PC beams using the cracked membrane model. Eng. Struct. 2018, 167, 592–607. [Google Scholar] [CrossRef]
  11. Minh, H.; Mutsuyoshi, H.; Niitani, K. Influence of grouting condition on crack and load-carrying capacity of post-tensioned concrete beam due to chloride-induced corrosion. Constr. Build. Mater. 2007, 21, 1568–1575. [Google Scholar] [CrossRef]
  12. Kumar, P.; Kodur, V. Response of prestressed concrete beams under combined effects of fire and structural loading. Eng. Struct. 2021, 246, 113025. [Google Scholar] [CrossRef]
  13. Gencturk, B.; Hossain, K.; Kapadia, A.; Labib, E.; Mo, Y. Use of digital image correlation technique in full-scale testing of prestressed concrete structures. Measurement 2014, 47, 505–515. [Google Scholar] [CrossRef]
  14. Wang, C.; Shen, Y.; Zou, Y.; Li, T.; Feng, X. Stiffness degradation characteristics destructive testing and finite-element analysis of prestressed concrete T-beam. Comput. Model. Eng. Sci. 2018, 114, 75–93. [Google Scholar] [CrossRef]
  15. Jeng, C.; Chao, M.; Chuang, H. Torsion experiment and cracking-torque formulae of hollow prestressed concrete beams. Eng. Struct. 2019, 196, 109325. [Google Scholar] [CrossRef]
  16. Zhao, T.; Zhang, P.; Guo, W.; Gong, X.; Wang, C.; Chen, Y. Controlling roof with potential rock burst risk through different pre-crack length: Mechanism and effect research. J. Cent. South Univ. 2022, 29, 3706–3719. [Google Scholar] [CrossRef]
  17. Visintin, P.; Oehlers, D.; Wu, C.; Haskett, M. A mechanics solution for hinges in RC beams with multiple cracks. Eng. Struct. 2012, 36, 61–69. [Google Scholar] [CrossRef]
  18. Lucas, W.; Oehlers, D.; Ali, M. Formulation of a shear resistance mechanism for inclined cracks in RC beams. J. Struct. Eng. 2011, 137, 1480–1488. [Google Scholar] [CrossRef]
  19. Xie, J.; Li, J.; Lu, Z.; Liu, D.; Huang, P. Effects of pre-existing damage and cyclic overloading on the flexural behaviour of RC beams strengthened with prestressed CFRP plates. Eng. Struct. 2021, 247, 113078. [Google Scholar] [CrossRef]
  20. Blomfors, M.; Berrocal, C.G.; Lundgren, K.; Zandi, K. Incorporation of pre-existing cracks in finite element analyses of reinforced concrete beams without transverse reinforcement. Eng. Struct. 2021, 229, 116101. [Google Scholar] [CrossRef]
  21. Hamrat, M.; Bouziadi, F.; Boulekbache, B.; Daouadji, T.; Chergui, S.; Labed, A.; Amziane, S. Experimental and numerical investigation on the deflection behavior of pre-cracked and repaired reinforced concrete beams with fiber-reinforced polymer. Constr. Build. Mater. 2020, 249, 118745. [Google Scholar] [CrossRef]
  22. Pimanmas, A.; Maekawa, K. Finite element analysis and behaviour of pre-cracked reinforced concrete members in shear. Mag. Concr. Res. 2001, 53, 263–282. [Google Scholar] [CrossRef]
  23. Ngidi, S.D.; Dundu, M. Composite action of pre-cracked reinforced concrete beams repaired with adhesive bonded steel plates. Structures 2018, 14, 400–408. [Google Scholar] [CrossRef]
  24. Nie, J.; Cai, C. Deflection of cracked RC beams under sustained loading. J. Struct. Eng. 2000, 126, 708–716. [Google Scholar] [CrossRef]
  25. Capozucca, R. A reflection on the application of vibration tests for the assessment of cracking in PRC/RC beams. Eng. Struct. 2013, 48, 508–518. [Google Scholar] [CrossRef]
  26. Kaklauskas, G.; Ghaboussi, J. Stress-strain relations for cracked tensile concrete from RC beam tests. J. Struct. Eng. 2001, 127, 64–73. [Google Scholar] [CrossRef]
  27. Fayyad, T.; Lees, J. Integrated fracture-based model formulation for RC crack analysis. J. Struct. Eng. 2018, 144, 04018083. [Google Scholar] [CrossRef] [Green Version]
  28. Davoudi, R.; Miller Gregory, R.; Kutz, J. Structural load estimation using machine vision and surface crack patterns for shear-critical RC beams and slabs. J. Comput. Civ. Eng. 2018, 32, 04018024. [Google Scholar] [CrossRef]
  29. Pimanmas, A.; Tisavipat, J. Effect of existing cracks on shear failure behaviour of reinforced concrete members. Mag. Concr. Res. 2005, 57, 485–495. [Google Scholar] [CrossRef]
  30. Faron, A.; Rombach, G. Simulation of crack growth in reinforced concrete beams using extended finite element method. Eng. Fail. Anal. 2020, 116, 104698. [Google Scholar] [CrossRef]
  31. Cervenka, V.; Rimkus, A.; Gribniak, V.; Cervenka, J. Simulation of the crack width in reinforced concrete beams based on concrete fracture. Theor. Appl. Fract. Mech. 2022, 121, 103428. [Google Scholar] [CrossRef]
  32. Jiki, P. Buckling analysis of pre-cracked beam-columns by Liapunov’s second method. Eur. J. Mech. A/Solids 2007, 26, 503–518. [Google Scholar] [CrossRef]
  33. Ma, Y.; He, Y.; Wang, G.; Wang, L.; Zhang, J.; Lee, D. Corrosion fatigue crack growth prediction of bridge suspender wires using Bayesian gaussian process. Int. J. Fatigue 2023, 168, 107377. [Google Scholar] [CrossRef]
  34. Ismail, Z.; Kuan, K.; Yee, K.; Chao, O. Examining the trend in loss of flexural stiffness of simply supported RC beams with various crack severity using model updating. Measurement 2014, 50, 43–49. [Google Scholar] [CrossRef]
  35. Castel, A.; Gilbert, R.; Ranzi, G. Instantaneous stiffness of cracked reinforced concrete including steel-concrete interface damage and long-term effects. J. Struct. Eng. 2014, 140, 04014021. [Google Scholar] [CrossRef]
  36. Yu, K.; Zhang, C.; Shooshtarian, M.; Zhao, W.; Shu, J. Automated finite element modeling and analysis of cracked reinforced concrete beams from three dimensional point cloud. Structural concrete. J. FIB 2021, 22, 3213–3227. [Google Scholar] [CrossRef]
  37. Qu, Y.; Li, X.; Kong, X.; Zhang, W.; Wang, X. Numerical simulation on dynamic behavior of reinforced concrete beam with initial cracks subjected to air blast loading. Eng. Struct. 2016, 128, 96–110. [Google Scholar] [CrossRef] [Green Version]
  38. Ma, Y.; Peng, A.; Wang, L.; Dai, L.; Zhang, J. Structural performance degradation of cable-stayed bridges subjected to cable damage: Model test and theoretical prediction. Struct. Infrastruct. Eng. 2021, in press. [Google Scholar] [CrossRef]
  39. Zheng, S.; Liu, Y.; Yoda, T.; Lin, W. Parametric study on shear capacity of circular-hole and long-hole perfobond shear connector. J. Constr. Steel Res. 2016, 117, 64–80. [Google Scholar] [CrossRef]
  40. GB 50010-2010; Code for Design of Concrete Structures. China Architecture and Building Press: Beijing, China, 2015. (In Chinese)
  41. JTG 3362-2018; Specifications for Design of Highway Reinforced Concrete and Prestressed Concrete Bridge and Culverts. China Communications Press: Beijing, China, 2018. (In Chinese)
  42. Ma, Y.; Wang, G.; Su, X.; Wang, L.; Zhang, J. Experimental and modelling of the flexural performance degradation of corroded RC beams under fatigue load. Constr. Build. Mater. 2018, 191, 994–1003. [Google Scholar] [CrossRef]
Figure 1. Section-size layout and reinforcement diagram of test beam (unit: mm).
Applsci 13 04775 g001
Figure 2. Arrangement of measuring points (unit: mm).
Applsci 13 04775 g002
Figure 3. Layout diagram of reinforcement strain gauge in the test beam.
Applsci 13 04775 g003
Figure 4. Loading test device.
Applsci 13 04775 g004
Figure 5. Crack-development distribution of test beams under hydraulic graded loading. (a) WS beam; (b) ZSS1 beam; (c) ZSS2 beam; (d) ZSS3 beam; (e) DSS1 beam; (f) DSS2 beam; (g) DSS3 beam.
Applsci 13 04775 g005aApplsci 13 04775 g005bApplsci 13 04775 g005c
Figure 6. The failure mode of test beams. (a) Roof concrete crushing; (b) Main crack in mid-span.
Applsci 13 04775 g006
Figure 7. Load-deflection curves for pre-cracking at mid-span. (a) l/4 measuring point; (b) 3l/4 measuring point; (c) Mid-span measurement point.
Applsci 13 04775 g007
Figure 8. Load-deflection curves for pre-cracking at l/4 position. (a) l/4 measuring point; (b) 3l/4 measuring point; (c) Mid-span measurement point.
Applsci 13 04775 g008
Figure 9. Stress distribution of tensile reinforcement at the main crack in mid-span. (a) Pre-cracked test beam at mid-span; (b) Pre-cracked test beam at l/4 position.
Applsci 13 04775 g009
Figure 10. Strain distribution at mid-span section. (a) WS beam; (b) ZSS1 beam; (c) ZSS2 beam; (d) DSS2 beam; (e) DSS3 beam.
Applsci 13 04775 g010
Figure 11. Cracking load of test beams.
Applsci 13 04775 g011
Figure 12. Ultimate load of test beam.
Applsci 13 04775 g012
Figure 13. Finite element model of pre-cracked T-beam. (a) Concrete T-beam network division; (b) Steel cage.
Applsci 13 04775 g013
Figure 14. Constitutive relation curve of concrete. (a) Compressive stress–strain; (b) Tensile stress-crack width.
Applsci 13 04775 g014
Figure 15. Comparison of load–deflection curves. (a) l/2 position of WS beam; (b) l/4 position of WS beam; (c) l/2 position of DSS1 beam; (d) l/4 position of DSS1 beam; (e) l/2 position of ZSS1 beam; (f) l/4 position of ZSS1 beam.
Applsci 13 04775 g015
Figure 16. Stress of concrete in plastic stage.
Applsci 13 04775 g016
Figure 17. Schematic diagram of the assumed plane section.
Applsci 13 04775 g017
Figure 18. Schematic diagram of the cross section of pre-cracked beam.
Applsci 13 04775 g018
Figure 19. Comparison between calculations and measured results.
Applsci 13 04775 g019
Table 1. Test-condition settings of T-beam for pre-cracking test.
Number of Test BeamLocation of CrackDepth of Crack/mmDiameter of Steel Bar at Crack/mm
WS---
ZSS1mid-span2012
ZSS2mid-span6012
ZSS3mid-span6010
DSS1l/4 position2012
DSS2l/4 position6012
DSS3l/4 position6010
Disclaimer/Publisher’s Note: The statements, opinions and data contained in all publications are solely those of the individual author(s) and contributor(s) and not of MDPI and/or the editor(s). MDPI and/or the editor(s) disclaim responsibility for any injury to people or property resulting from any ideas, methods, instructions or products referred to in the content.