Communication

High-Frequency Magnetic Field Energy Imaging of Magnetic Recording Head by Alternating Magnetic Force Microscopy (A-MFM) with Superparamagnetic Tip

1
Graduate School of Engineering Science, Akita University, Akita 010-8502, Japan
2
Institute of Physics CAS, 18200 Prague, Czech Republic
*
Authors to whom correspondence should be addressed.
Appl. Sci. 2023, 13(8), 4843; https://doi.org/10.3390/app13084843
Submission received: 7 March 2023 / Revised: 1 April 2023 / Accepted: 7 April 2023 / Published: 12 April 2023

Abstract

:
Recent progress in the development of high-frequency (HF) magnetic materials and devices requires the HF imaging of magnetic field and magnetic field response with high spatial resolution. In this work, we proposed HF Alternating Magnetic Force Microscopy (A-MFM) with a superparamagnetic tip to image magnetic field energy near the sample surface. Magnetic field with a frequency from 100 kHz to 1 GHz was emanated by a writing head used for perpendicular magnetic recording. Applied HF magnetic field is amplitude modulated, and magnetic energy determines the frequency modulation of cantilever oscillation in the framework of A-MFM. The frequency modulated oscillation was caused by low frequency alternating magnetic force, which was generated by the interaction between the amplitude modulated AC magnetic field and superparamagnetic tip.

1. Introduction

Our previously developed alternating magnetic force microscopy (A-MFM) is high-resolution magnetic force microscopy which enables to detect DC and AC magnetic field near sample surface by using frequency modulation phenomenon of cantilever oscillation caused by periodical change of effective spring constant of cantilever [1,2,3,4,5,6]. To improve the spatial resolution of A-MFM imaging for AC magnetic field, magnetic energy imaging method has been developed by using high permeability superparamagnetic (SP) tip [4,5]. Here the thermally averaged magnetic moment m of the SP tip is proportional to the applied magnetic field H ( m   ( = χ H ) ) and follows H reversibly without hysteresis. Tip coating contains large volume percent of superparamagnetic (SP) nanoparticles isolated by non-magnetic matrix [6]. The method is effective to improve spatial resolution because magnetic energy is a short-range interaction if compared with magnetic field.
However, A-MFM has been previously used only at low frequencies, because frequency modulation occurs in a limited frequency interval. To circumvent this limitation, here we propose the low frequency amplitude modulation of high-frequency (HF) current. The SP tip is expected to have a particular advantage for detecting HF magnetic field, because SP materials have better magnetic response in HF magnetic field region, comparing with that of ferromagnetic tips [7]. In SP materials, ferromagnetic resonance occurs in a broad frequency region because nanoparticles contain significant amount of surface atoms with distorted coordination [8], compared to the bulk. Next reason is that each nanoparticle inside SP tip coating is affected by nonuniform magnetic field from thermally agitated neighboring nanoparticles, which affects resonance frequency [9,10]. This reason is especially important in our case because of the significantly high content of superparamagnetic particles inside the matrix [6]. The total magnetic response is a superposition of all nanoparticle contributions. In the SP materials, the blocking resonance frequency can exceed the ferromagnetic resonance frequency, which is caused by the intrinsic magnetocrystalline anisotropy. So, with the particle size decrease, SP susceptibility may be kept in GHz range [7,8,9,10,11].
HF-imaging is required to characterize HF magnetic materials and devices, such as perpendicular magnetic recording (PMR) systems. They operate in high frequencies up to GHz range to enable fast data processing [12], as well as to decrease written track width [13] for bit miniaturization. The writing currents also need to be low enough to decrease power consumption, so, PMR heads were recently augmented by heat-assisted (HAMR) [14] and microwave-assisted (MAMR) [15,16] technologies. Thus, magnetic fields induced by the modern PMR writing heads, are highly localized spatially, and become weaker apart from the head main pole. Thus, the imaging of spatial magnetic field distribution near magnetic pole requires methods with high resolution and sensitivity. For magneto-optical Kerr microscopy [17], as well as for magnetoresistive scanning [18,19], the spatial resolution is limited by optical wavelength or sensor dimension, respectively. Electron holography [20,21] and x-ray magnetic circular dichroism (XMCD) [22] require complex instrumentation and provide spatial resolution of 100 nm and higher, while analysis of pole footprint on magnetic media [23] is an indirect method.
Conventional magnetic force microscopy (MFM) and related methods have high potential in magnetic head imaging [24,25,26,27,28]. HF-MFM was successfully applied to PMR heads to measure stray fields emanated from magnetic pole [26,27,28]. Moreover, MFM also imaged the localized HF field up to 40 GHz, generated by spin Hall nano oscillator (SHNO) [29]. However, in HF applications it is difficult to separate magnetic and non-magnetic forces. Therefore, the MFM scan is performed significantly above sample surface at the distance comparable to pole dimension, which distorts the observed magnetic spot when compared to the topographical size of the pole.
In the present study, we examined the possibility of HF magnetic imaging by A-MFM using SP tip from the viewpoint of high-frequency magnetic response of the SP tip. The scheme is shown in Figure 1. The external AC field causes periodical change of effective spring constant of cantilever, leading to frequency modulation of cantilever oscillation, which is demodulated and then detected by lock-in amplifier. This allows to perform scan near surface and eliminate non-magnetic interactions.
The amplitude modulated AC magnetic field H   ( = H 0 ( 1 + α cos ( ω m t ) ) cos ( ω c t ) ) was induced in PMR writing head by applying amplitude modulated AC voltage. Magnetic force gradient F z ( = F z / z = 2 ( m · H ) / z 2 ) was given by the interaction between the magnetic moment of SP tip m   ( = χ H ) and the applied magnetic field H in the following equation:
F z = 2 m · H z 2 = χ   2 H 2 z 2 = χ 2 z 2 ( H 0 cos ( ω c t ) + α 2 H 0 ( cos ( ( ω c ω m ) t ) + α 2 H 0 cos ( ( ω c + ω m ) t ) ) 2
By the inner products of magnetic field terms, low frequency terms of magnetic force derivative F z ( ω m t )   ( = α χ 2 H 0 2 z 2 cos ( ω m t ) ) and F z ( 2 ω m t )   ( = α 2 4 χ 2 H 0 2 z 2 cos ( 2 ω m t ) ) were generated. The value of F z ( ω m t ) is larger than that of F z ( 2 ω m t ) because of α 1 , so only the first harmonic term has been selected in this study.
In the framework of A-MFM, we selected the low modulation frequency f m ( = ω m / 2 π ) of 89 Hz to cause the frequency modulation of cantilever oscillation:
z ( t )   ( = A sin ( ω 0 t + Δ ω ω m cos ( ω m t ) ) A sin ( ω 0 t ) + A Δ ω 2 ω m cos ( ( ω 0 + ω m ) t ) + A Δ ω 2 ω m cos ( ( ω 0 ω m ) t ) )
in the cantilever motion equation of m d 2 z ( t ) d t 2 + m γ d z ( t ) d t + ( k 0 + Δ k cos ( ω m t ) ) z ( t ) = F 0 cos ( ω 0 t ) . Here f 0 ( = ω 0 / 2 π ) is the oscillation frequency near the resonant frequency f r ( = ω r / 2 π ) of the cantilever. So, the Δ k cos ( ω m t ) = F z ( ω m t ) component of magnetic force gradient and thus, Δ ω = ω m m γ ω 0 Δ k = ω m m γ ω 0 α χ 2 H 0 2 z 2 are derived.
Then the magnetic energy imaging for high-frequency magnetic field near the sample surface becomes possible because the oscillation amplitude A is constant in frequency modulation. The difference between the present method and previously reported HF- MFM, where soft magnetic tips were used, is that in the previous works lock-in detected the cantilever oscillation at modulation angular frequency ω m comparable with the mechanically oscillated frequency ω 0 ω r [26,30,31]. In this case, it is not easy to reduce tip-sample distance during topographic and magnetic scan because the oscillation amplitude changes due to the beat vibration between ω m and ω 0 .
In addition, the SP tip can detect the wider range of magnetic field H than soft magnetic tips because the magnetization of SP tip reversibly changes between low and high H without hysteresis and does not saturate in large H .
The experiment is a step towards the use of A-MFM in HF application, which is also important in microwave applications such as MAMR, in magnetic resonance [25] and spintronics [29,32] phenomena.

2. Materials and Methods

A-MFM measurements were performed by using the L-trace II (Hitachi High tech) scanning probe system in ambient conditions. Tip-sample distance in a lift mode was ≈5 nm while oscillation amplitude was set up to 20% during the lift scan. The basic setup is described in the works [1,4,5] and the current version is shown in Figure 1. Si cantilever with spring constant of ≈40 N/m and resonant frequency of ≈300 kHz was coated by 100 nm thick Co0.43(GdOx)0.57 superparamagnetic film [5,6]. Co and Gd2O3 targets were used for DC and RF co-sputtering under an Ar atmosphere.
Amplitude modulated HF voltage V 0 ( 1 + α cos ( ω m t ) ) cos ( ω c t ) was applied to PMR magnetic head by using a HF signal generator (8657A Hewlett Packard) for varying the carrier frequency of f c ( = ω c / 2 π ) between 0.1 and 1000 MHz with an amplifier (Keysight 83020A). To generate AM input of the head, we used a low-frequency signal generator (NF Wave Factory WF1974) with the f m ( = ω m / 2 π ) frequency 89 Hz as an external signal source of the HF signal generator. The AM depth α of the HF signal generator was set up to 90%.
To detect the degree of frequency modulation Δ ω in ω = d ϕ / d t = ω 0 + Δ ω sin ( ω m t ) from the induced frequency modulated oscillation of A sin ( ω 0 t + Δ ω ω m cos ( ω m t ) ) , we firstly carried out the frequency demodulation of cantilever oscillation ( ω ω 0 = Δ ω sin ( ω m t ) ) by (Phase Locked Loop circuit) PLL and then measured Δ ω by lock-in detection with ω m .

3. Results and Discussion

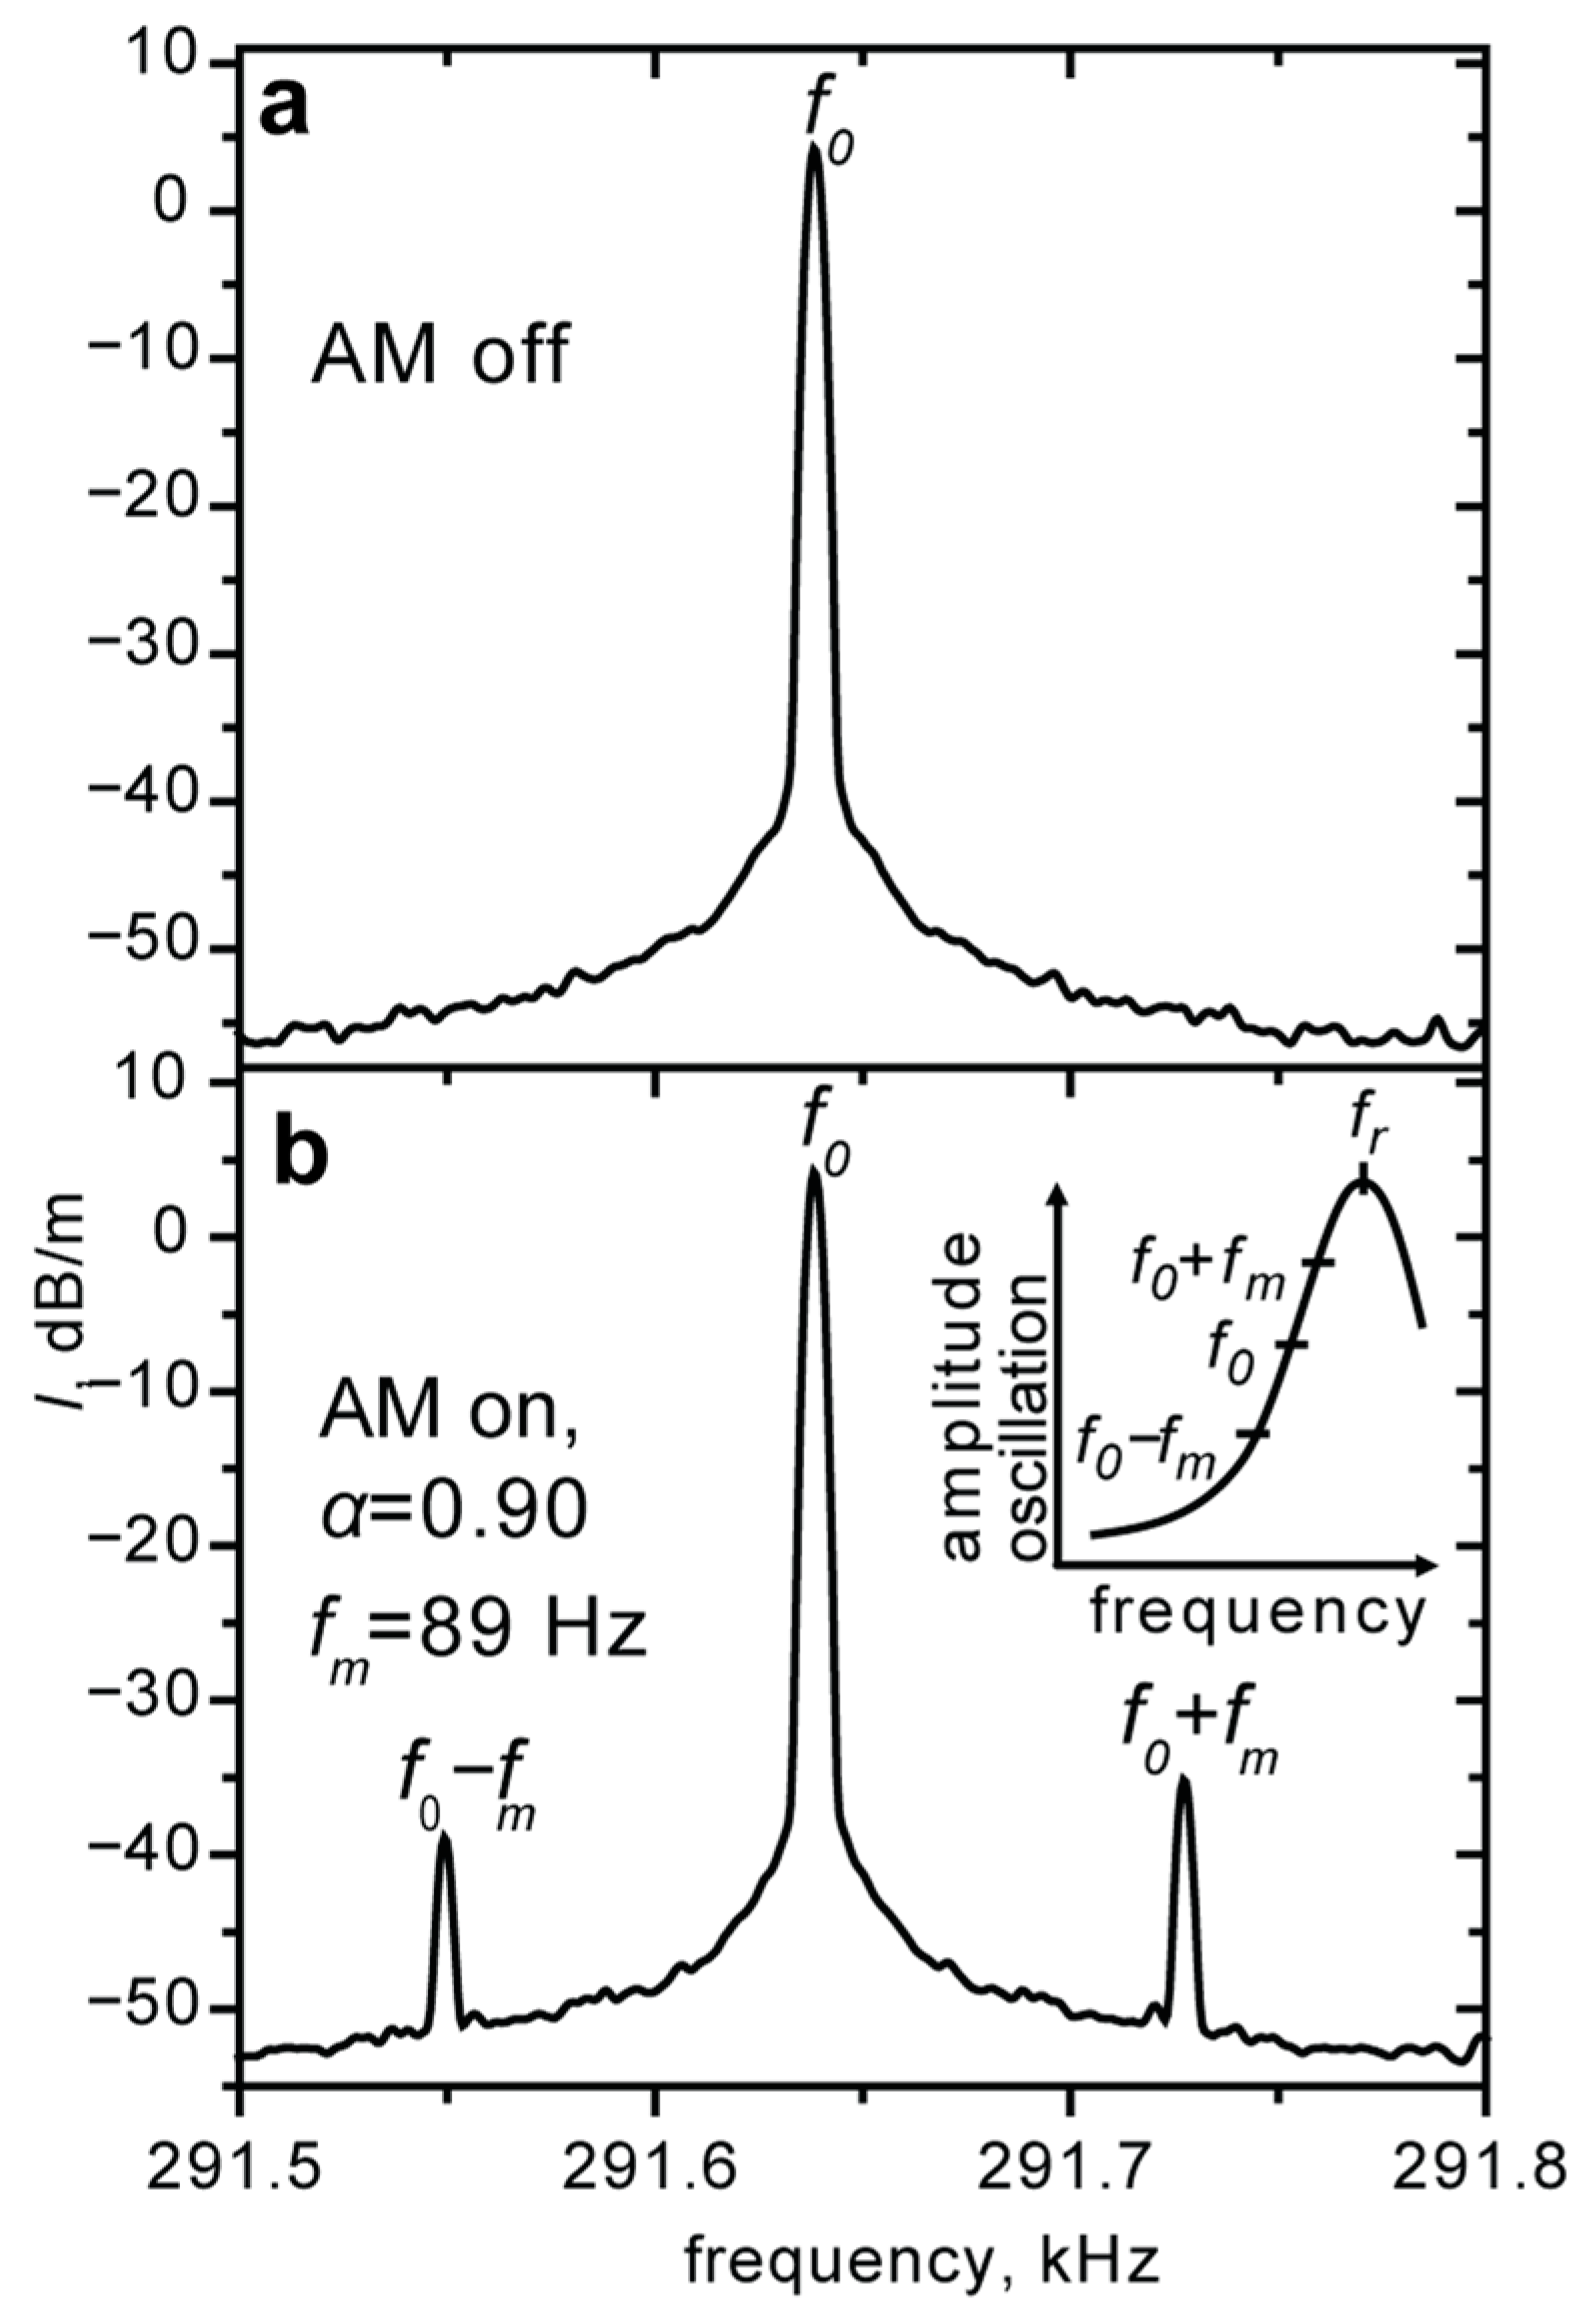
The effect of the application of amplitude modulated AC magnetic field to the SP tip is shown in the spectrum of cantilever oscillation in Figure 2. Here the carrier frequency f c is 100 MHz. In non-modulated magnetic field (Figure 2a), only a peak I ( f 0 ) is visible at f 0 , which is the oscillating frequency of the cantilever near its resonant frequency f r ( = ω r / 2 π ) . On the other hand, in amplitude-modulated magnetic field (Figure 2b), two sidebands I ( f 0 ± f m ) , which are caused by the frequency modulation of cantilever oscillation, appear at f 0 ± f m (Figure 2b). The intensity of the f 0 oscillation does not change with and without amplitude modulation.
In the figure, there is intensity difference between two sidebands. The asymmetry of sideband intensity comes from the difference of f 0 and f r . To control the tip-sample distance during the imaging, we set the f 0 as the frequency at which the change of oscillation amplitude against frequency has maximum and the order of the frequencies is f 0 f m < f 0 < f 0 + f m < f r . In this case, the intensity at f 0 f m becomes smaller than the intensity at f 0 + f m (See inset in Figure 2). In this case, there is a mixture of frequency modulation and amplitude modulation in cantilever oscillation. Contribution ratio of the sideband spectra to frequency modulation and amplitude modulation are estimated as I ( f 0 + f m ) + I ( f 0 f m ) 2  and I ( f 0 + f m ) I ( f 0 f m ) 2 , respectively. In this experiment, frequency modulation mainly occurs in the cantilever oscillation.
In the Figure 3, we can see the magnetic field energy images of PMR head from 100 kHz to 1 GHz. Here the lock-in signals ( X + i Y = R exp ( i θ ) ) were optimized by the adjustment of lock-in reference phase offset θ offset to obtain maximal out-of-plane signal value Y max = R sin ( θ + θ offset = π / 2 ) = R and to get only lock-in Y images [2]. When f c approaches to 1 GHz, the magnetic field from the head decreases mainly due to the transmission line loss of applied current in the experimental setup. So, the intensity images in Figure 3a–e were normalized by the maximum signal corresponding to the central bright spot, which imaged magnetic pole. The pole dimension in Figure 3a–e does not depend on the carrier frequency f c .
Typical line profile is shown in a Figure 3f, where we can see the large positive magnetic signal peak from the main pole, while regions of negative signal near the peak sides correspond to dark areas around it in Figure 3a–e. The phenomena are explained by the rotation of in-plane magnetization near the PMR head gap [33,34]. The phenomenon is similar to the case of the magnetic energy of low frequency sinusoidal magnetic field H = H 0 cos ( ω m t ) [5]. Here the sign of magnetic signal indicates the increase or decrease in the magnetic field energy, which is proportional to H 2 , in the period of 1 / f m .
Figure 3g is the schematic image of main pole area. Here we assumed that the head magnetization rotated in the (XZ) plane, which is normal to head surface (the XY plane). On the head surface, the applied amplitude modulated magnetic field H generates the magnetic charge density σ m z , from the normal component of main-pole magnetization M z ( = M · n ) . Here we assume the magnetic hard axis is parallel to the z direction. In the M-H curve in the hard axis direction, normal component of magnetization M z is proportional to the applied magnetic field H . Then σ m z is given by the expression σ m z = M z = M 0 ( 1 + α cos ( ω m t ) ) cos ( ω c t ) ) .
On the other hand, the magnetic charge density on the cross-sectional surface of the main pole σ m x was generated by the parallel component of main-pole magnetization M x . In magnetic rotation process in soft ferromagnet, the absolute value of magnetization is not changed, then M x is obtained as following:
M x = M 2 M z 2 = M 2 M 0 2 ( 1 + α cos ( ω m t ) ) 2 cos 2 ( ω c t )
Magnetic field energy at the main pole surface and main pole edge is proportional to ( σ m z ) 2 and ( σ m x ) 2 , respectively. Then, the following relationships are obtained:
( σ m z ) 2 = M 0 2 ( 1 + α cos ( ω m t ) ) 2 cos 2 ( ω c t )
( σ m x ) 2 = M 2 M 0 2 ( 1 + α cos ( ω m t ) ) 2 cos 2 ( ω c t )
The ω m frequency components from the above equation are expressed as following:
( σ m z ) 2 [ ω m t ] = α M 0 2 cos ( ω m t )
( σ m x ) 2 [ ω m t ] = α M 0 2 cos ( ω m t ) = α M 0 2 cos ( ω m t + π )
Thus, ( σ m z ) 2 and ( σ m x ) 2 have opposite polarity. When the perpendicular component of the main pole magnetization increases, the parallel one, which generates magnetic charge at the cross-sectional surface of main pole, decreases. Thus, when the H 2 increases at the main pole location, the H 2 decreases near the pole edge. The source and the drain areas of magnetic field energy change alternately during the rotation of main pole magnetization.
With the increasing carrier frequency f c approaching the ferromagnetic resonance frequency of main pole materials, magnetic rotation process seems to change from in-plane motion to precessional motion. In the precessional motion, precession angle changes with low modulation frequency f m . When the magnetization M parallel to the precession axis increases, the magnetization M normal to the precession axis decreases. So M 2 ( = ( σ m z ) 2 ) and M 2 ( = ( σ m x ) 2 ) have opposite polarity in the similar way to in-plane magnetic rotation.
When α = 0 in the previous work [5], ( σ m z ) 2 [ 2 ω c t ] = ( M 0 2 2 ) cos ( 2 ω c t ) and ( σ m x ) 2 [ 2 ω c t ] = ( M 0 2 2 ) cos ( 2 ω c t ) for low ω c are obtained.
To evaluate the spatial resolution of the present method, the magnetic size of the pole was compared with the topographic one, which is marked with blue lines in Figure 3a for comparison. Its size fits that of bright magnetic spot, which means that the magnetic pole is imaged close to surface and with sufficient resolution. Full width at half maximum (FWHM) stays at the level of ≈120 nm, which is larger than in the previous works [4,5] because the size of the used head is larger than that of the previous one.
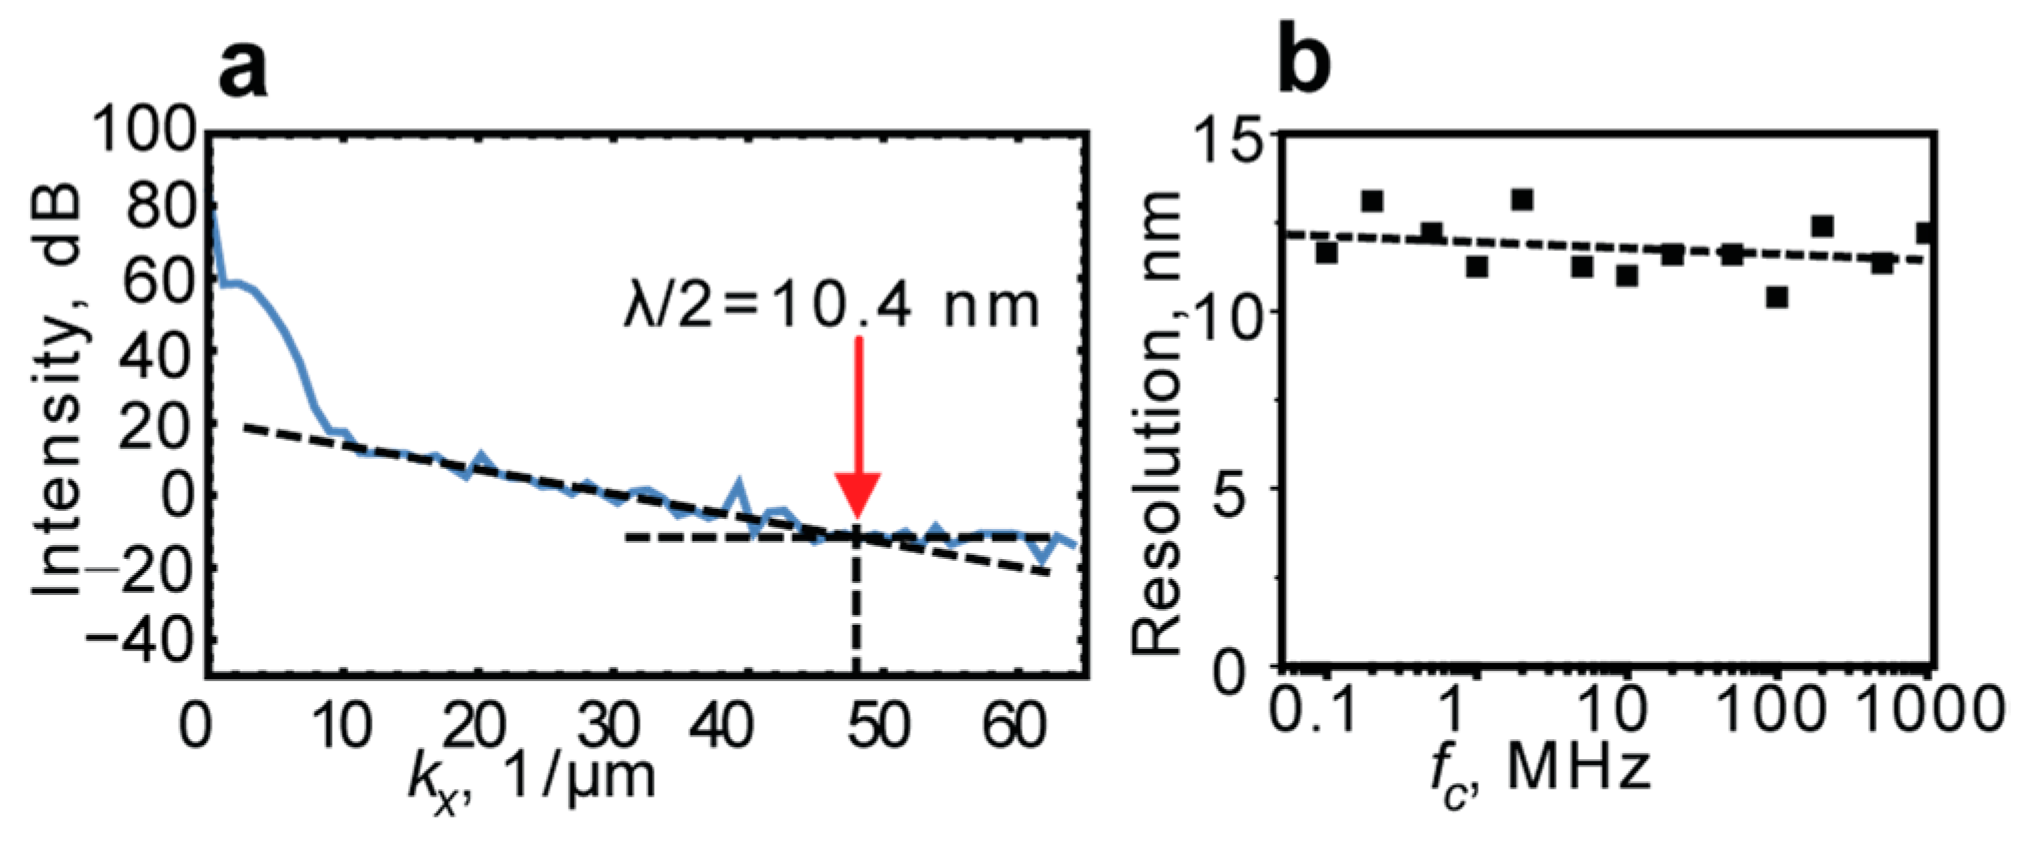
The spatial resolution has been determined from power spectrum as the half of critical wavelength (Figure 4a), which is inverse to the critical spatial frequency kx at which the signal turns to noise level [2,3,4,5]. In a Figure 4b the estimated resolutions are shown against the carrier frequency f c . The resolutions are about 10–12 nm, which is similar to the previous results obtained at low frequency of magnetic field. They also have the same value in the whole frequency range 0.1–1000 MHz.
So, A-MFM demonstrates the imaging possibility of magnetic field energy in a broad frequency range without losses in image quality. We believe that the frequency limits could be extended further above 1 GHz up to the values determined by magnetic resonance of PMR head materials.

4. Conclusions

In conclusion, we demonstrated that A-MFM with superparamagnetic tips is an appropriate method to image HF magnetic fields from PMR poles in a broad frequency range. The imaging can be performed near the head surface with the selection of magnetic component by using low frequency amplitude modulation of high frequency field. The image quality is independent on the carrier frequency which might allow to increase it above 1 GHz in further experiments.

Author Contributions

Conceptualization, H.S. (Hitoshi Saito); methodology, H.S. (Hitoshi Saito); software, T.M.; validation, H.S. (Hitoshi Saito), M.V.M., H.K., P.D. and K.S.; formal analysis, M.V.M.; investigation, M.V.M., H.S. (Hiroshi Sonobe) H.K., P.D. and K.S.; resources, H.S. (Hitoshi Saito) and H.S. (Hiroshi Sonobe); data curation, M.V.M., H.K., P.D. and K.S.; writing-original draft preparation, M.V.M. and H.S. (Hitoshi Saito); writing-review and editing, M.V.M. and H.S. (Hitoshi Saito); visualization, M.V.M. and T.M.; supervision, H.S. (Hitoshi Saito); project administration, H.S. (Hitoshi Saito); funding acquisition, H.S. (Hitoshi Saito). All authors have read and agreed to the published version of the manuscript.

Funding

This work was supported by JSPS KAKENHI Grant Number JP21H01357.

Institutional Review Board Statement

Not applicable.

Informed Consent Statement

Not applicable.

Data Availability Statement

Data sharing not applicable.

Acknowledgments

The authors thank Hitachi High-Tech Corporation for useful discussion about the magnetic field energy imaging of magnetic recording heads. The A-MFM measurement system was developed by the support of JST/SENTAN.

Conflicts of Interest

The authors declare no conflict of interest.

References

  1. Saito, H.; Lu, W.; Hatakeyama, K.; Egawa, G.; Yoshimura, S. High frequency magnetic field imaging by frequency modulated magnetic force microscopy. J. Appl. Phys. 2010, 107, 09D309. [Google Scholar] [CrossRef]
  2. Makarova, M.V.; Akaishi, Y.; Ikarashi, T.; Rao, K.S.; Yoshimura, S.; Saito, H. Alternating Magnetic Force Microscopy: Effect of Si doping on the temporal performance degradation of amorphous FeCoB magnetic tips. J. Magn. Magn. Mater. 2019, 471, 209–214. [Google Scholar] [CrossRef]
  3. Makarova, M.V.; Akaishi, Y.; Suzuki, Y.; Rao, K.S.; Yoshimura, S.; Saito, H. High-resolution alternating magnetic force microscopy using an amorphous FeB-based tip driven by an inverse magnetostrictive effect: Imaging of the high-density magnetic recording media. J. Magn. Magn. Mater. 2022, 546, 168755. [Google Scholar] [CrossRef]
  4. Kumar, P.; Suzuki, Y.; Cao, Y.; Yoshimura, S.; Saito, H. High resolution magnetic field energy imaging of the magnetic recording head by A-MFM with Co-GdOx super-paramagnetic tip. Appl. Phys. Lett. 2017, 111, 183105. [Google Scholar] [CrossRef]
  5. Kumar, P.; Cao, Y.; Suzuki, Y.; Yoshimura, S.; Saito, H. Magnetic energy flow imaging of magnetic recording head with enhanced resolution and sensitivity by A-MFM using high magnetic moment superparamagnetic tip. J. Appl. Phys. 2018, 123, 214503. [Google Scholar] [CrossRef]
  6. Cao, Y.; Kumar, P.; Zhao, Y.; Suzuki, Y.; Yoshimura, S.; Saito, H. High magnetization Co-GdOx superparamagnetic granular films as magnetic coating materials for high-sensitivity alternating magnetic force microscopy tip. J. Magn. Magn. Mater. 2018, 462, 119–126. [Google Scholar] [CrossRef]
  7. Hasegawa, D.; Yang, H.; Ogawa, T.; Takahashi, M. Challenge of ultra high frequency limit of permeability for magnetic nanoparticle assembly with organic polymer—Application of superparamagnetism. J. Magn. Magn. Mater. 2009, 321, 746–749. [Google Scholar] [CrossRef]
  8. Balaev, D.A.; Stolyarc, S.V.; Knyazev, Y.V.; Yaroslavtsev, R.N.; Pankrats, A.I.; Vorotynov, A.M.; Krasikov, A.A.; Velikanov, D.A.; Bayukov, O.A.; Ladygina, V.P.; et al. Role of the surface effects and interparticle magnetic interactions in the temperature evolution of magnetic resonance spectra of ferrihydrite nanoparticle ensembles. Results Phys. 2022, 35, 105340. [Google Scholar] [CrossRef]
  9. Sadat, M.E.; Bud’ko, S.L.; Ewing, R.C.; Xu, H.; Pauletti, G.M.; Mast, D.B.; Shi, D. Effect of dipole interactions on blocking temperature and relaxation dynamics of superparamagnetic iron-oxide (Fe3O4) nanoparticle systems. Materials 2023, 16, 496. [Google Scholar] [CrossRef]
  10. Slay, D.; Cao, D.; Ferré, E.C.; Charilaou, M. Ferromagnetic resonance of superparamagnetic nanoparticles: The effect of dipole–dipole interactions. J. Appl. Phys. 2021, 130, 113902. [Google Scholar] [CrossRef]
  11. Song, N.N.; Yang, H.T.; Liu, H.L.; Ren, X.; Ding, H.F.; Zhang, X.Q.; Cheng, Z.H. Exceeding natural resonance frequency limit of monodisperse Fe3O4 nanoparticles via superparamagnetic relaxation. Sci. Rep. 2013, 3, 3161. [Google Scholar] [CrossRef] [Green Version]
  12. Liu, F.H.; Shi, S.; Wang, J.; Chen, Y.; Stoev, K.; Leal, L.; Saha, R.; Tong, H.C.; Dey, S.; Nojaba, M. Magnetic recording at a data rate of one gigabit per second. IEEE Trans. Magn. 2001, 37, 613–618. [Google Scholar] [CrossRef]
  13. Kaiser, D.; Dakroub, H.; van der Schans, A.; Haftek, E.; Li, S.; Zhu, W.; Pro, J.; Vorasarn, K.; Stankiewick, A.; Cox, R.; et al. Evaluation of high data rate disk drive recording subsystem. J. Appl. Phys. 2003, 93, 6555. [Google Scholar] [CrossRef]
  14. Hsu, W.-H.; Victora, R.H. Heat-assisted magnetic recording—Micromagnetic modeling of recording media and areal density: A review. J. Magn. Magn. Mater. 2022, 563, 169973. [Google Scholar] [CrossRef]
  15. Takagishi, M.; Narita, N.; Nakagawa, Y.; Nagasawa, T.; Osamura, R.; Maeda, T.; Yamada, K. Microwave assisted magnetic recording: Physics and application to hard disk drives. J. Magn. Magn. Mater. 2022, 563, 169859. [Google Scholar] [CrossRef]
  16. Ohkoshi, S.; Yoshikiyo, M.; Imoto, K.; Nakagawa, K.; Namai, A.; Tokoro, H.; Yahagi, Y.; Takeuchi, K.; Jia, F.; Miyashita, S.; et al. Magnetic pole flip by millimeter wave. Adv. Mater. 2020, 32, 2004897. [Google Scholar] [CrossRef]
  17. Valkass, R.A.J.; Spicer, T.M.; Burgos Parra, E.; Hicken, R.J.; Bashir, M.A.; Gubbins, M.A.; Czoschke, P.J.; Lopusnik, R. Time-resolved scanning Kerr microscopy of flux beam formation in hard disk write heads. J. Appl. Phys. 2016, 119, 233903. [Google Scholar] [CrossRef] [Green Version]
  18. Mitin, D.; Grobis, M.; Albrecht, M. Scanning magnetoresistive microscopy: An advanced characterization tool for magnetic nanosystems. Rev. Sci. Instrum. 2016, 87, 023703. [Google Scholar] [CrossRef]
  19. Czoschke, P.; Kaka, S.; Gokemeijer, N.J.; Franzen, S. Real-time direct measurement of field rise time and dynamic instability of perpendicular writers. Appl. Phys. Lett. 2010, 97, 242504. [Google Scholar] [CrossRef]
  20. Einsle, J.F.; Gatel, C.; Masseboeuf, A.; Cours, R.; Bashir, M.A.; Gubbins, M.; Bowman, R.M.; Snoeck, E. In situ electron holography of the dynamic magnetic field emanating from a hard-disk drive writer. Nano Res. 2015, 8, 1241–1249. [Google Scholar] [CrossRef] [Green Version]
  21. Goto, T.; Jeong, J.S.; Xia, W.; Akase, Z.; Shindo, D.; Hirata, K. Electron holography of magnetic field generated by a magnetic recording head. Microscopy 2013, 62, 383–389. [Google Scholar] [CrossRef] [PubMed]
  22. Suto, H.; Kikitsu, A.; Kotani, Y.; Maeda, T.; Toyoki, K.; Osawa, H.; Kikuchi, N.; Okamoto, S.; Nakamura, T. Time-resolved imaging of an operating hard-disk-drive write head using nano-beam x-ray magnetic circular dichroism. J. Appl. Phys. 2020, 128, 133903. [Google Scholar] [CrossRef]
  23. Li, S.; Lin, E.; George, Z.; Terrill, D.; Mendez, H.; Santucci, J.; Yie, D. Methods for characterizing magnetic footprints of perpendicular magnetic recording writer heads. J. Appl. Phys. 2014, 115, 17B733. [Google Scholar] [CrossRef] [PubMed] [Green Version]
  24. Tanaka, S.; Azuma, Y.; Majima, Y. Secondary resonance magnetic force microscopy. J. Appl. Phys. 2012, 111, 084312. [Google Scholar] [CrossRef]
  25. Tao, Y.; Eichler, A.; Holzherr, T.; Degen, C.L. Ultrasensitive mechanical detection of magnetic moment using a commercial disk drive write head. Nat. Comm. 2016, 7, 12714. [Google Scholar] [CrossRef] [PubMed] [Green Version]
  26. Koblischka, M.R.; Pfeifer, R.; Cazacu, A.; Lamberton, R.; Hartmann, U. HF-MFM imaging of stray fields from perpendicular write heads. J. Phys. Conf. Ser. 2010, 200, 112004. [Google Scholar] [CrossRef]
  27. Sungthong, A.; Ruksasakchai, P.; Saengkaew, K.; Cheowanish, I.; Damrongsak, B. Response of magnetic force microscopy probes under AC magnetic field. J. Phys. Conf. Ser. 2017, 901, 012092. [Google Scholar] [CrossRef]
  28. Abe, M.; Tanaka, Y. High frequency write head measurement with the phase detection magnetic force microscope. J. Appl. Phys. 2001, 89, 6766. [Google Scholar] [CrossRef]
  29. Banuazizi, S.A.H.; Houshang, A.; Awad, A.A.; Mohammadi, J.; Åkerman, J.; Belova, L.M. Magnetic force microscopy of an operational spin nano-oscillator. Microsyst. Nanoeng. 2022, 8, 65. [Google Scholar] [CrossRef] [PubMed]
  30. Koblischka, M.R.; Wei, J.D.; Hartmann, U. Optimization of the HF-MFM technique. J. Phys. Conf. Ser. 2007, 61, 591. [Google Scholar] [CrossRef] [Green Version]
  31. Li, S.; Stokes, S.; Liu, Y.; Foss-Schroder, S.; Zhu, W.; Palmer, D. Dual vibrational high frequency magnetic force microscopy. J. Appl. Phys. 2002, 91, 7346. [Google Scholar] [CrossRef]
  32. Bodenstedt, S.; Jakobi, I.; Michl, J.; Gerhardt, I.; Neumann, P.; Wrachtrup, J. Nanoscale spin manipulation with pulsed magnetic gradient fields from a hard disc drive writer. Nano Lett. 2018, 18, 5389–5395. [Google Scholar] [CrossRef] [PubMed]
  33. Takano, K. Magnetization dynamics of perpendicular writers. J. Magn. Magn. Mater. 2005, 287, 346–351. [Google Scholar] [CrossRef]
  34. Heidmann, J.; Taratorin, A.M. Handbook of Magnetic Materials, 1st ed.; Buschow, K.H.J., Ed.; Elsevier: Amsterdam, The Netherlands, 2011; Volume 19, pp. 1–436. [Google Scholar]
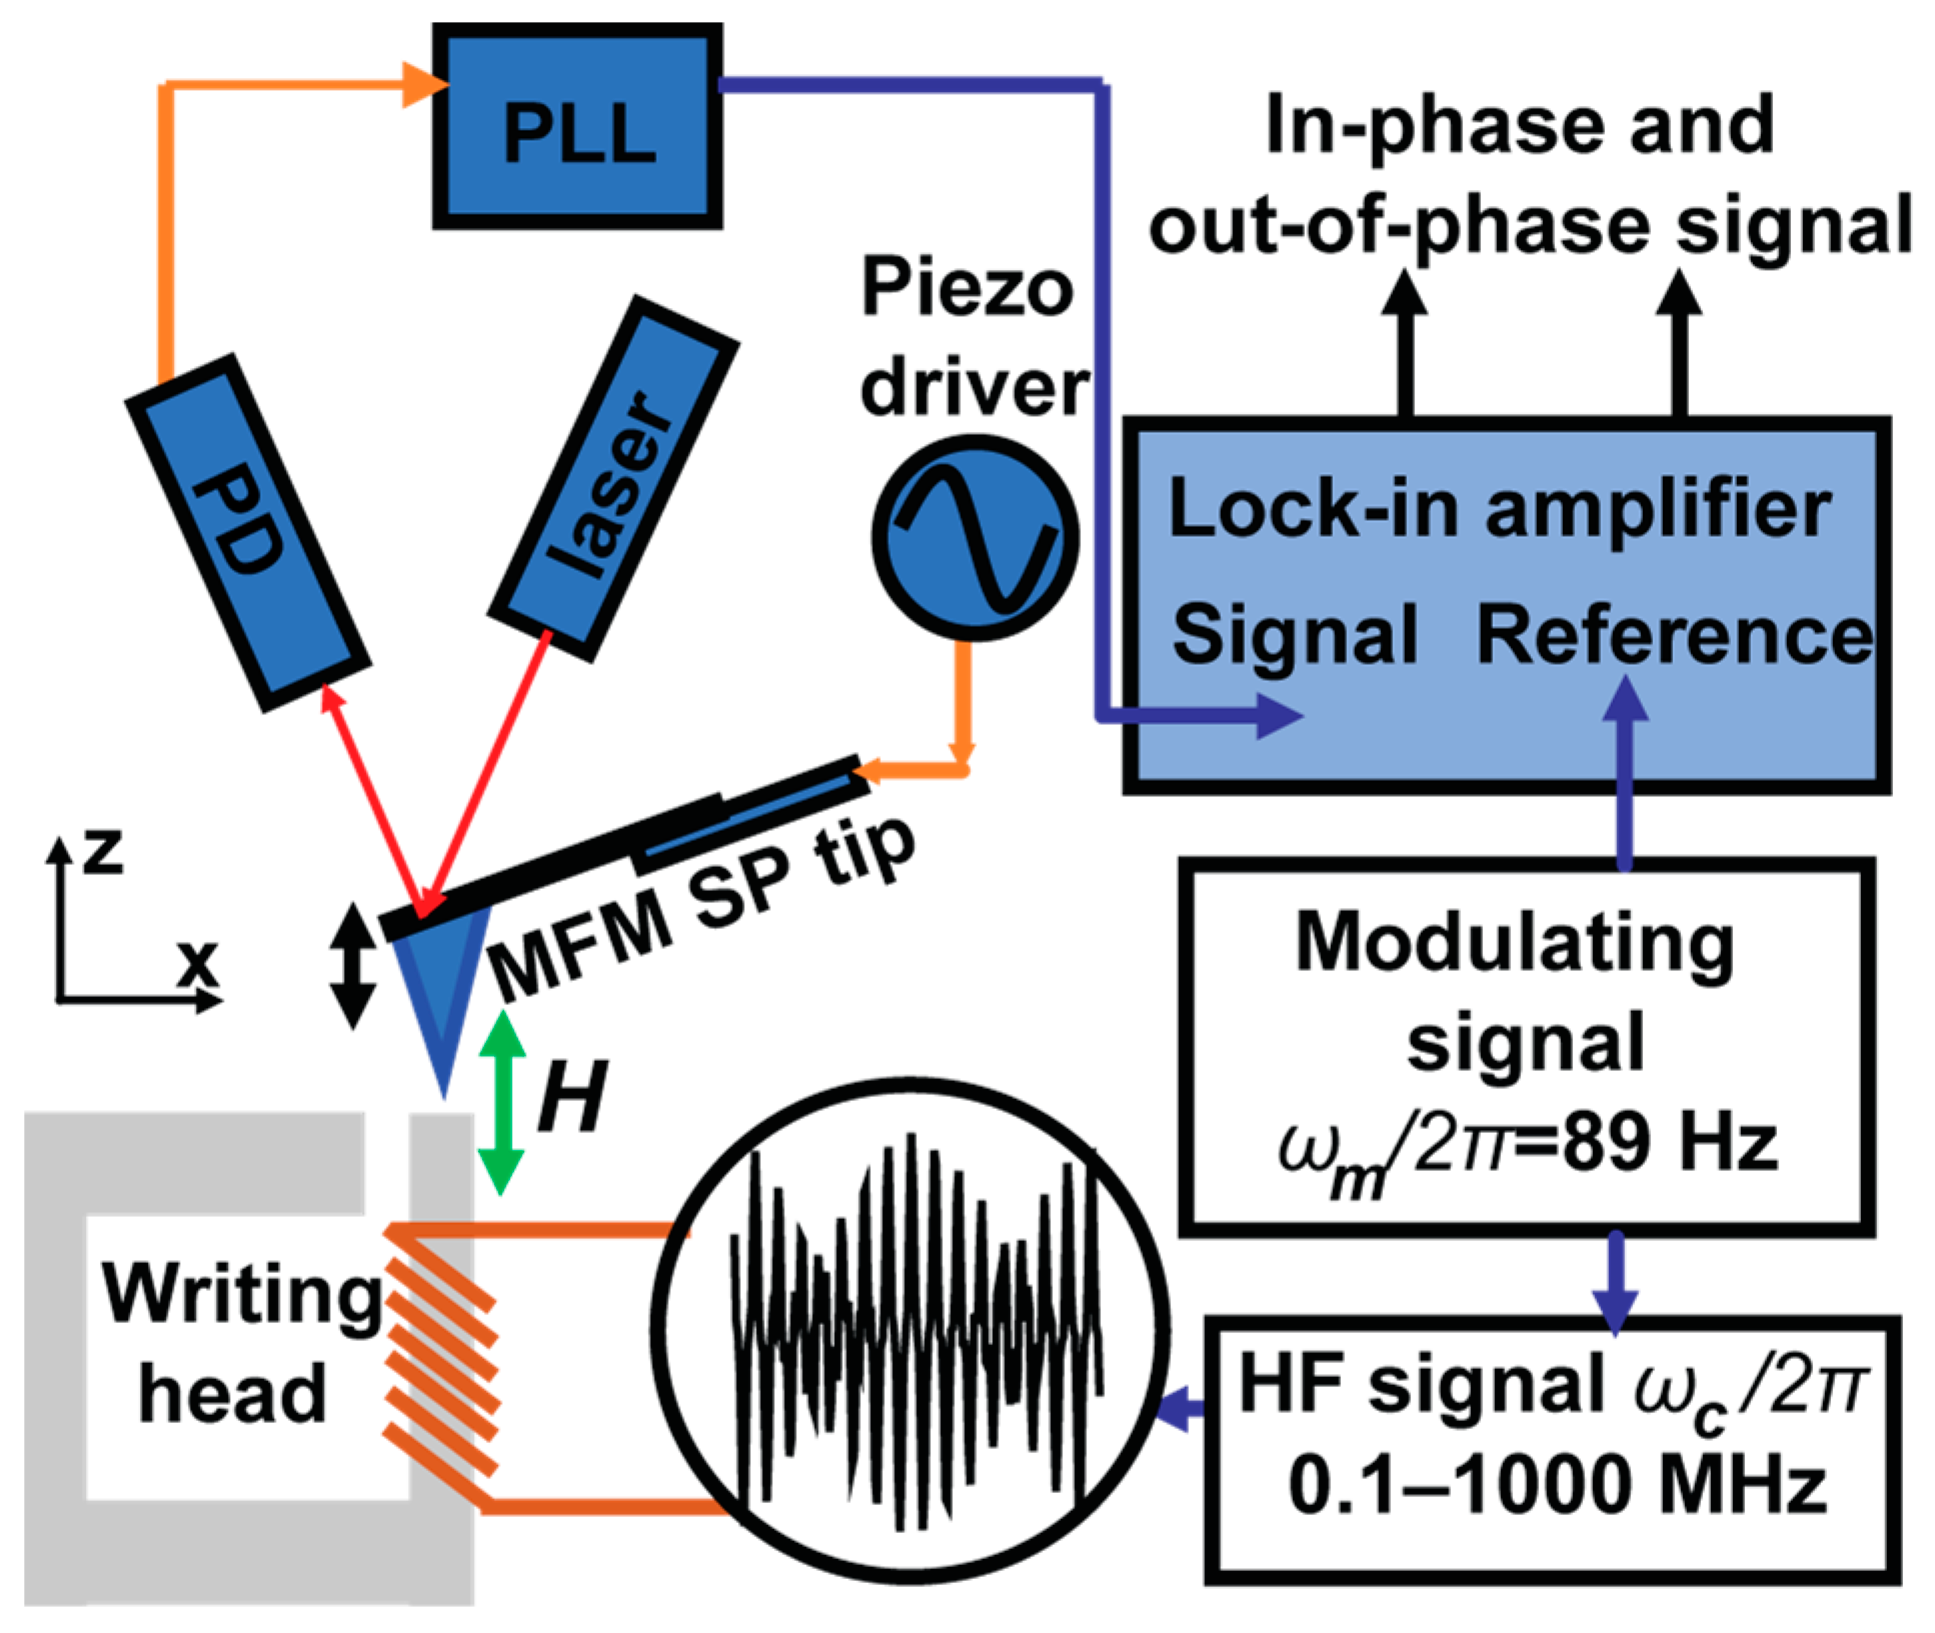
Figure 1. The schematic diagram of high frequency ω c magnetic field imaging by using amplitude modulation with f m ( = ω m / 2 π ) = 89 Hz, in HF MFM system with SP tip. The difference from the works [1,4,5] is the use of amplitude modulated HF current in the PMR head.
Applsci 13 04843 g001
Figure 2. Spectra of cantilever oscillation in the 100 MHz magnetic field generated by writing head without (a) and with (b) amplitude modulation. Inset shows the scheme of the cantilever oscillation f 0 , resonance f r and magnetic sideband f 0 ± f m   frequencies on amplitude frequency curve.
Applsci 13 04843 g002
Figure 3. Normalized A-MFM image of the out-of-plane signal near the main pole for f c = 0.1 (a), 1 (b), 10 (c), 100 (d) and 1000 (e) MHz currents with amplitude modulation at f m = 89 Hz. The horizontal dimension of the images is 1 µm. The topographical shape of the pole is marked with blue lines. (f) Line profile (white line in (d)) for f c = 100 MHz. (g) Schematic model for the XZ cross-section of the main pole with magnetization vector M, its projections, and charge density σ .
Applsci 13 04843 g003
Figure 4. Power spectrum for amplitude modulated 100 MHz signal with calculated spatial resolution (a). The frequency dependence of spatial resolution (b).
Applsci 13 04843 g004
Disclaimer/Publisher’s Note: The statements, opinions and data contained in all publications are solely those of the individual author(s) and contributor(s) and not of MDPI and/or the editor(s). MDPI and/or the editor(s) disclaim responsibility for any injury to people or property resulting from any ideas, methods, instructions or products referred to in the content.