Article

Transverse Connectivity and Durability Evaluation of Hollow Slab Bridges Using Surface Damage and Neural Networks: Field Test Investigation

1
Department of Bridge Engineering, Southeast University, Nanjing 211189, China
2
Department of Civil and Environmental Engineering, Louisiana State University, Baton Rouge, LA 70803, USA
3
Nanjing Third Yangtze River Bridge Co., Ltd., Nanjing 211808, China
*
Author to whom correspondence should be addressed.
Appl. Sci. 2023, 13(8), 4851; https://doi.org/10.3390/app13084851
Submission received: 1 March 2023 / Revised: 4 April 2023 / Accepted: 10 April 2023 / Published: 12 April 2023
(This article belongs to the Section Civil Engineering)

Abstract

:
Prefabricated concrete hollow slab bridges are widely used in short- and medium-span highway bridges in China due to the advantages of high production quality, installation convenience, and low construction cost. Field investigation shows that severe hinge joint damage occurred during the service life, and mechanical performance of the bridges also deteriorated with the weakened joints. It is important to accurately evaluate the performance of hollow slab bridges to ensure the safety of the highway system. In this paper, transverse connectivity and durability of the concrete hollow slab bridges are investigated in a field test using the surface damage and neural networks. Hollow slab bridges in the Wu-He highway system were taken as the background bridge. Surface damage was visually checked and statistically analyzed. Static load test was conducted to evaluate the transverse connectivity of the hinge joints based on the girder responses. The hollow slab bridges were then demolished, and a total of 75 concrete girder segments were cut off. Durability of the girders was evaluated based on the conditions of concrete and rebars, and the analytic hierarchy process along with the fuzzy comprehensive evaluation method was employed. Results showed that there were two main types of the defects in the hollow slab bridges, i.e., the transverse cracks on the bottom plates of the girders and the longitudinal cracks in the hinge joints. The distribution of the deflection of each girder was non-uniform due to the weakening of the transverse connectivity, and the girders in the background bridges were within the moderate deterioration condition after 25 years’ service life. An evaluation method of the hollow slab girders using the neural networks and surface damage was verified by the field test data. The maximum crack width at different locations of the bridges was used in the input layer of the neural network, and the hinge joint damage or the durability was considered as the output results. The prediction error of the method in the test set was within 15.0% for the hinge joint damage and within 40% for the durability result of the girder, indicating the feasibility of the evaluation method.

1. Introduction

Prefabricated concrete beams have been widely used in short- and medium-span highway bridges in China since the 1970s. A large portion of these beams are made up of hollow slab girders due to their advantages such as high production quality, installation convenience, high bridge clearance, and low construction cost [1]. Considering the bearing capacity and design width of the highway bridges, concrete hollow slabs are commonly arranged side by side with the span being less than 30 m. The load in the transverse direction can be transferred by tie bars [2] and hinge joints [3]. As such, an integrated beam structure is formed for the hollow slabs. However, only the hinge joints are employed in the design of the hollow slab bridges in China to reduce the cost, which leads to severe hinge joint damage during the bridge service life in the highway system [4]. The damage process generally includes two periods. In the first period, cracking occurs inside the hinge joint under the traffic loads. Longitudinal cracks on macroscale gradually form, and some cracks may extend to the bridge overlays. In the second period, concrete cracks continue to develop. Humid air and water will permeate into the joints along the cracks, leading to the concrete spalling and corrosion of the rebars [5]. With the increase of the hinge joint damage, transverse connections between the girders are weakened, and hollow slabs may behave individually under the non-uniform distributed load. The mechanical performance of the bridge will also deteriorate, and the bridge service life is shortened. To ensure the safety of the highway bridges, it is important to accurately evaluate the transverse connectivity of the hinge joints and the durability of the hollow slab girders.
Visual inspection is a common method for checking the damage condition of concrete bridges [6,7,8]. For the hollow slab bridges, the condition of the hinge joints or the girders can be qualitatively assessed by visual inspectors. When the features such as the cracks along the joint region or the water seepage at the bottom of the joints are found, the joints may be considered as severely damaged [9]. The girders are recognized as unsafe or severely deteriorated if obvious cracking and spalling or the rebar corrosion is observed [10]. However, the status judgements are subjective for some features, and the reliability of the assessment depends on the inspectors’ education level and experience [11]. In addition, a quantitative evaluation of the joints or girders cannot be realized based on the visual information. To obtain the change of the transverse connectivity after the joint damage, load tests are usually performed, and damage index of the hinge joints are proposed by the girder responses [4,12]. Modal parameters are also employed by many scholars [13,14] as the certain modal shape or shape difference index is sensitive to the joint damage. As for the durability evaluation of the concrete bridges, multiple parameters are required in the field test such as the concrete strength, corrosion degree of the rebars, and carbonation depth of concrete [15], and an analytic hierarchy process (AHP) is commonly employed considering the involved parameters.
A key component of the evaluation of bridges’ condition and their components is the establishment of a relationship between the evaluation results and bridge parameters. With the rapid development of machine learning, much effort has been invested in the application of artificial neutral networks (ANN) in bridge engineering [16,17,18,19,20]. Cattan and Mohammadi [16] found that neural networks were successfully trained and used in rating conditions of reinforced concrete bridge based on bridge type, span length, and other parameters. Weinstein et al. [17] evaluated the bridge performance using an ANN and measured strains at different locations. Liu et al. [18] used an ANN to accurately predict the grouting compactness in concrete beams with a number of detection parameters. Therefore, if the relations between the inspection results and evaluation objective (transverse connectivity of the hinge joints or durability of the hollow slab girders) can be found using an ANN, the bridge condition assessment will become more convenient with a much lower inspection cost.
This study focuses on the field test investigation of the transverse connectivity and durability evaluation of the hollow slab bridges using the surface damage and neural networks. A total of 13 hollow slab bridges in the Wu-He highway system were taken as the background bridge. Surface damage was visually checked and statistically analyzed. Static load test was conducted to evaluate the transverse connectivity of the hinge joints based on the girder responses. The hollow slab bridges were then demolished, and a total of 75 concrete girder segments were cut off. Durability of each hollow slab girder was evaluated based on the analytic hierarchy process (AHP) along with the fuzzy comprehensive evaluation (FCE) method. An artificial neutral network (ANN) method was finally employed to investigate the relationship between the surface damage and rating results. The applicability of the method was verified by the field test data of the hollow slab bridges.

2. Field Test

2.1. Background Bridges

The Wu-He highway system, which is located in Anhui province, China, was opened to traffic in 1995. A total of 90% of the bridges in this system are prefabricated concrete hollow slab bridges, and the bridge length varies from 14.2 m to 226 m. A total of 13 bridges in the system with a service life of 25 years were investigated in this study, and the bridge information is listed in Table 1. The span length varies from 13 to 22 m, and the number of hollow slab girders in the bridge varies from four to 12.
As twin decks are used in highway bridges in this system, a typical cross-section with eight girders is shown in Figure 1. The bridge width is 12.62 m. Each bridge consists of eight hollow slab girders which are labeled as G1 to G8. The hinge joints between the girders are labeled as H1 to H7. The reinforced concrete deck was cast in situ with a thickness of 0.1 m, and the bridge is simply supported by the U-shape abutment and column piers. C50 grade concrete was used for both the girders and joints.

2.2. Visual Inspection

A visual inspection was first conducted on all the hollow slab bridges. The superstructure of the bridge was inspected including the slab girder, hinge joint, and bearings. Bridge damage was classified according to different types of the defects such as concrete deterioration and rebar corrosion. The defects were marked with paint, and pictures were taken with the inspection date. The defects were also recorded at the longitudinal and transverse locations in the highway system. When the surface cracks were observed in the survey, the crack dimensions were measured with the crack width gauge and tape measures.

2.3. Load Test

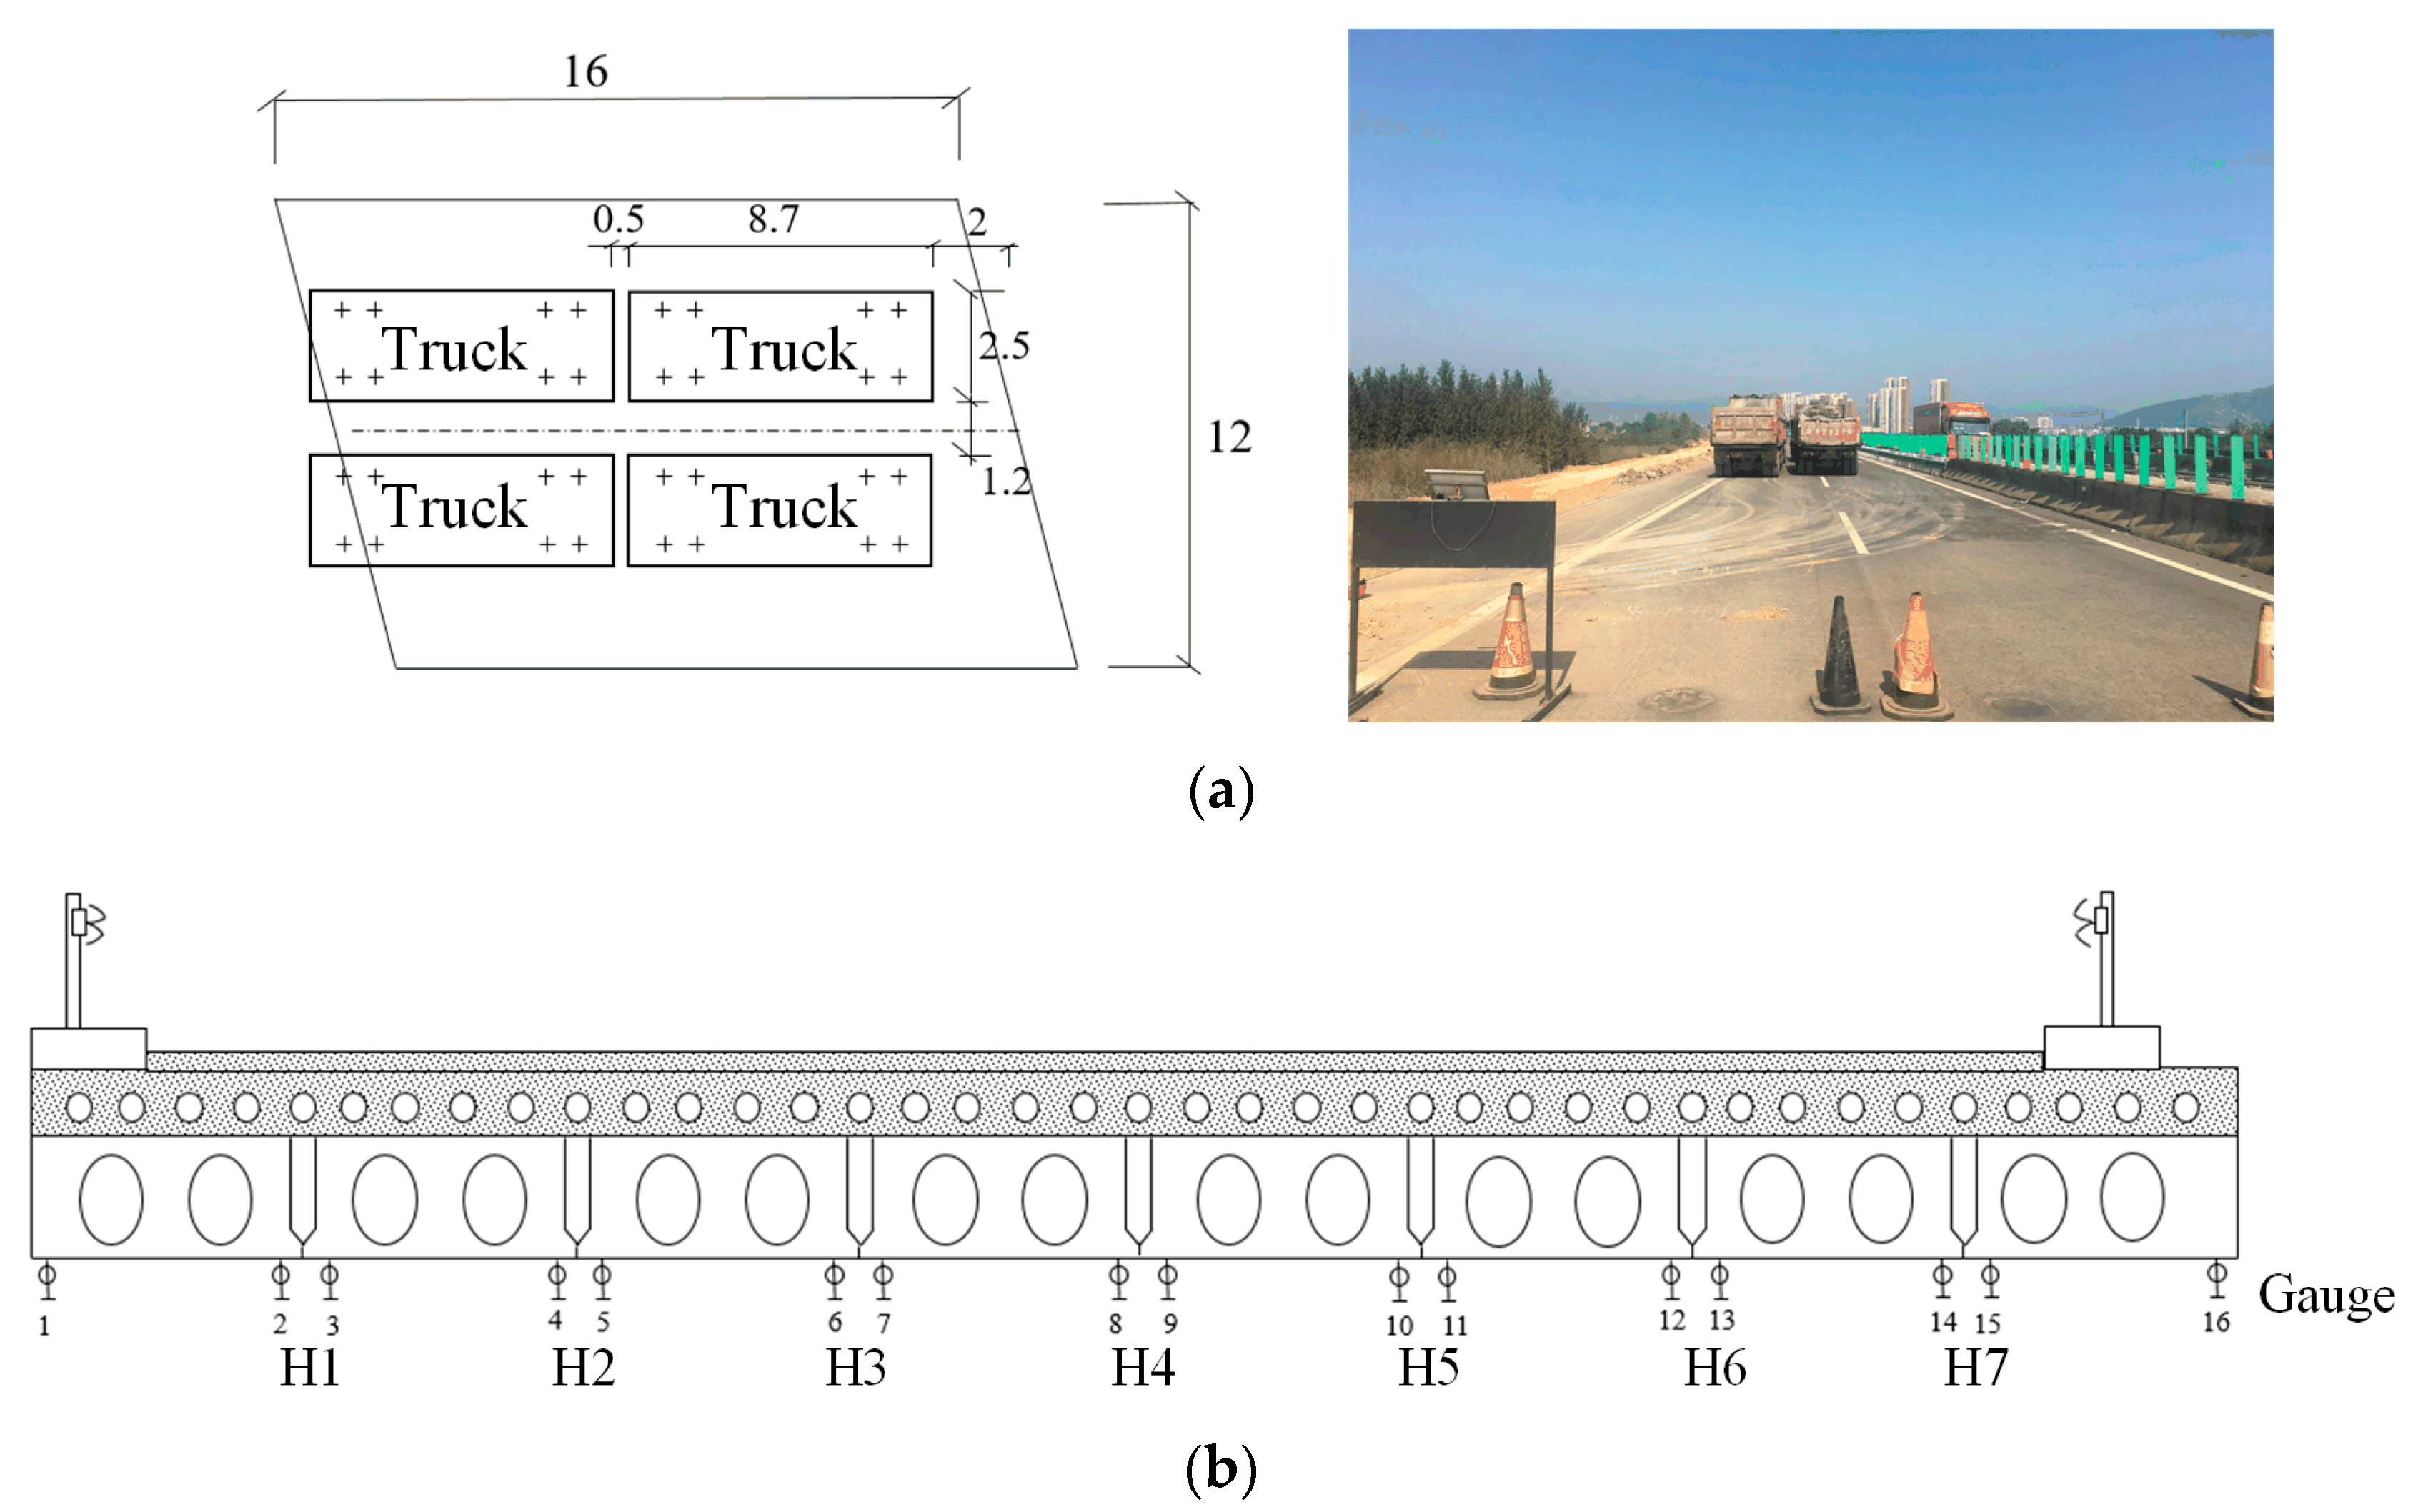
Due to the severe damage of the hinge joints, a diagnostic load test was performed on some of the hollow slab bridges to evaluate the transverse connectivity of the joints after the visual inspection. An example bridge is located at K64 + 854.8 in the Wu-He highway system. It has a span of 16 m, and the skew angle is 120 degrees. Four 30-ton trucks were placed on the bridge, and the center of the four trucks was consistent with the bridge center, as shown in Figure 2a. A customized measuring ruler was used as a deflection gauge to obtain the vertical displacement of each measuring point. Two measuring points were prepared on the left and right sides of the joint, and Figure 2b shows a total of 16 measuring points in the transverse direction of the bridge. Figure 3 shows the arrangement of deflection gauges on the real bridge and the measurement process based on the gauges and leveling instrument. The mid-span deflection of the girders is measured in following the steps: (1) place the two measuring rulers at the bottom of each girder; (2) place a leveling instrument at the shoreside and obtain the original reading from the leveling instrument before the load; (3) obtain the reading from the leveling instrument after the load. As such, the average relative displacement of the single girder or the hinge joint can be calculated under the truck load. It is noted that when the trucks were driven to the predetermined position, there was an interval of 10 min to collect the deflection data until the effect of the moving truck on the bridge disappeared.

2.4. Cutting Test of Girders

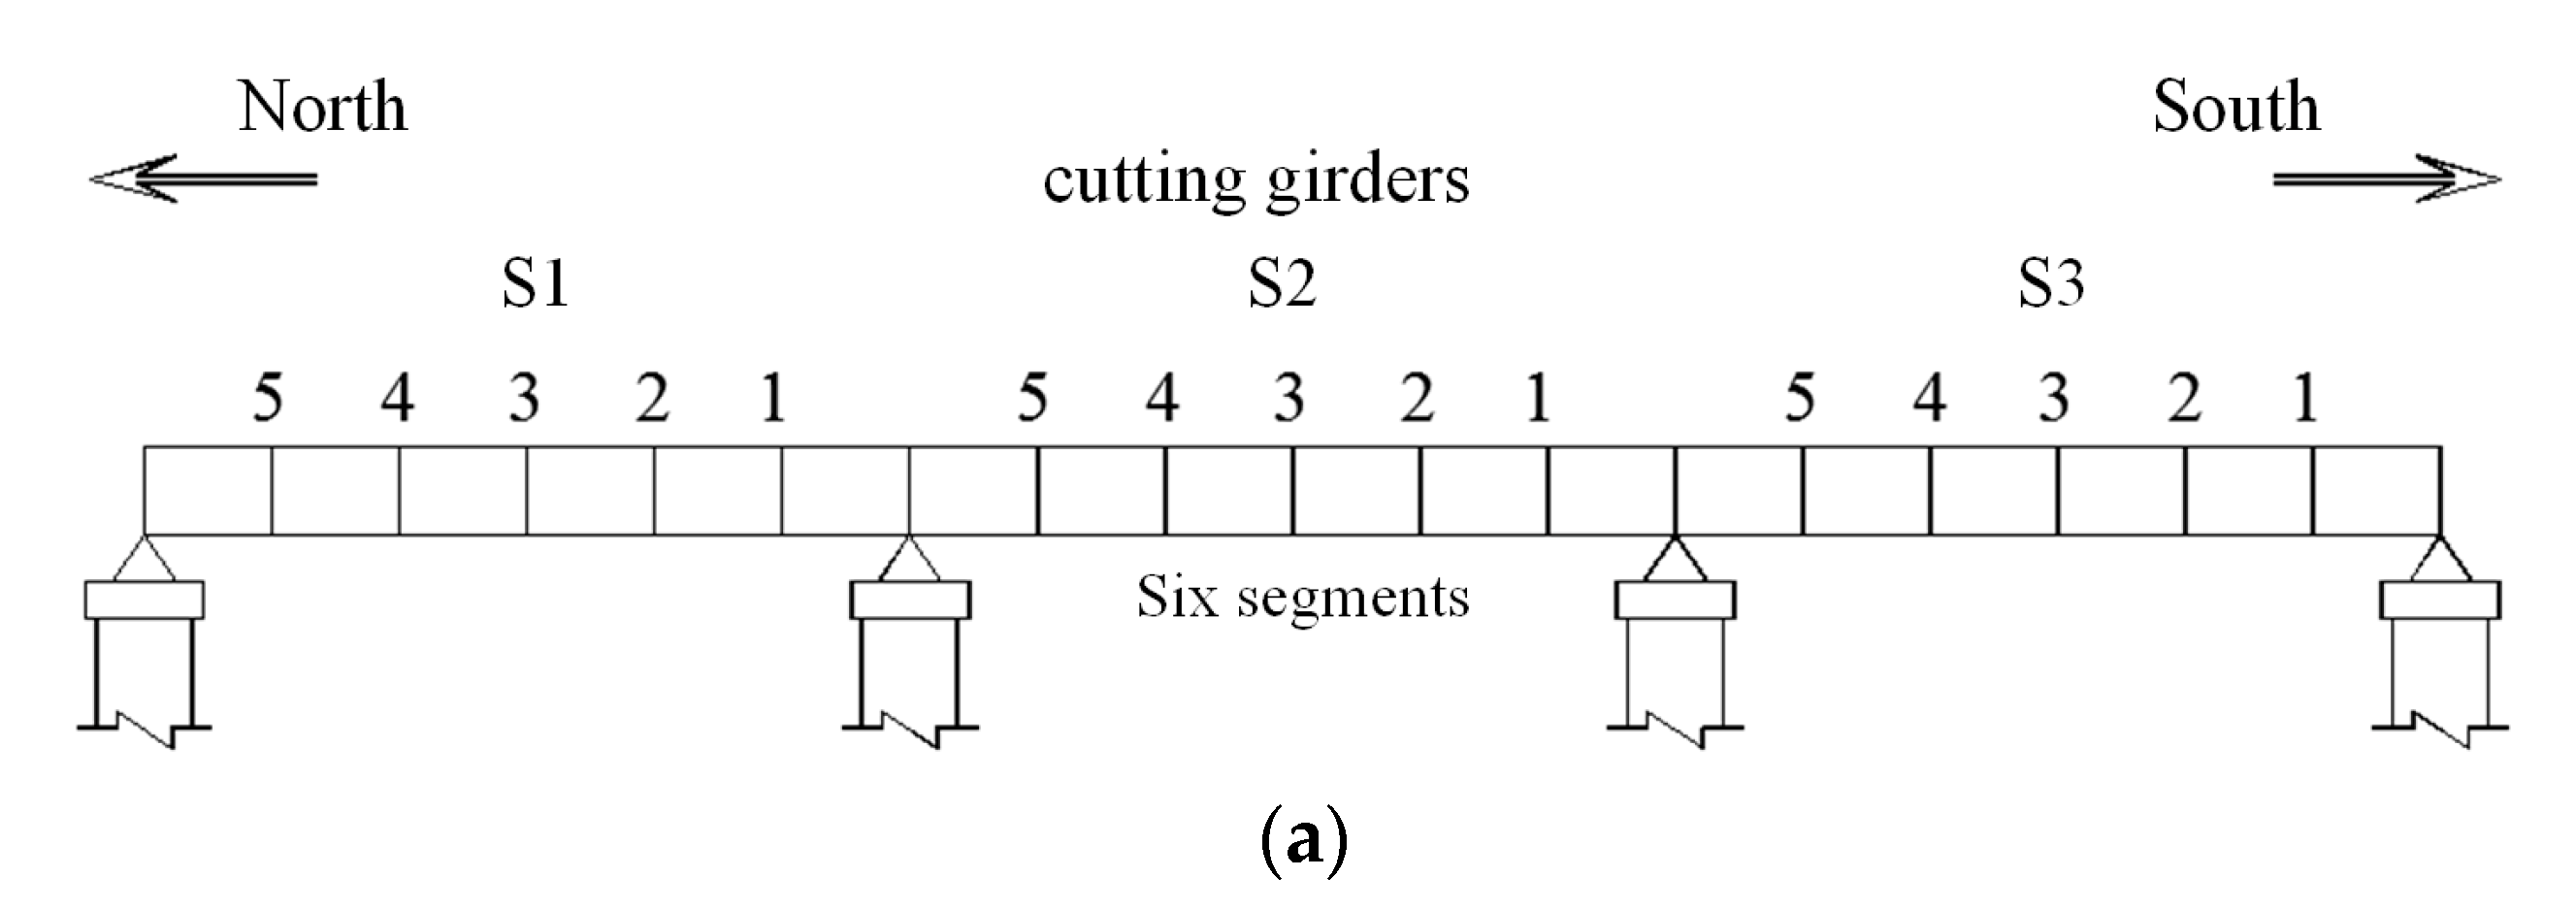
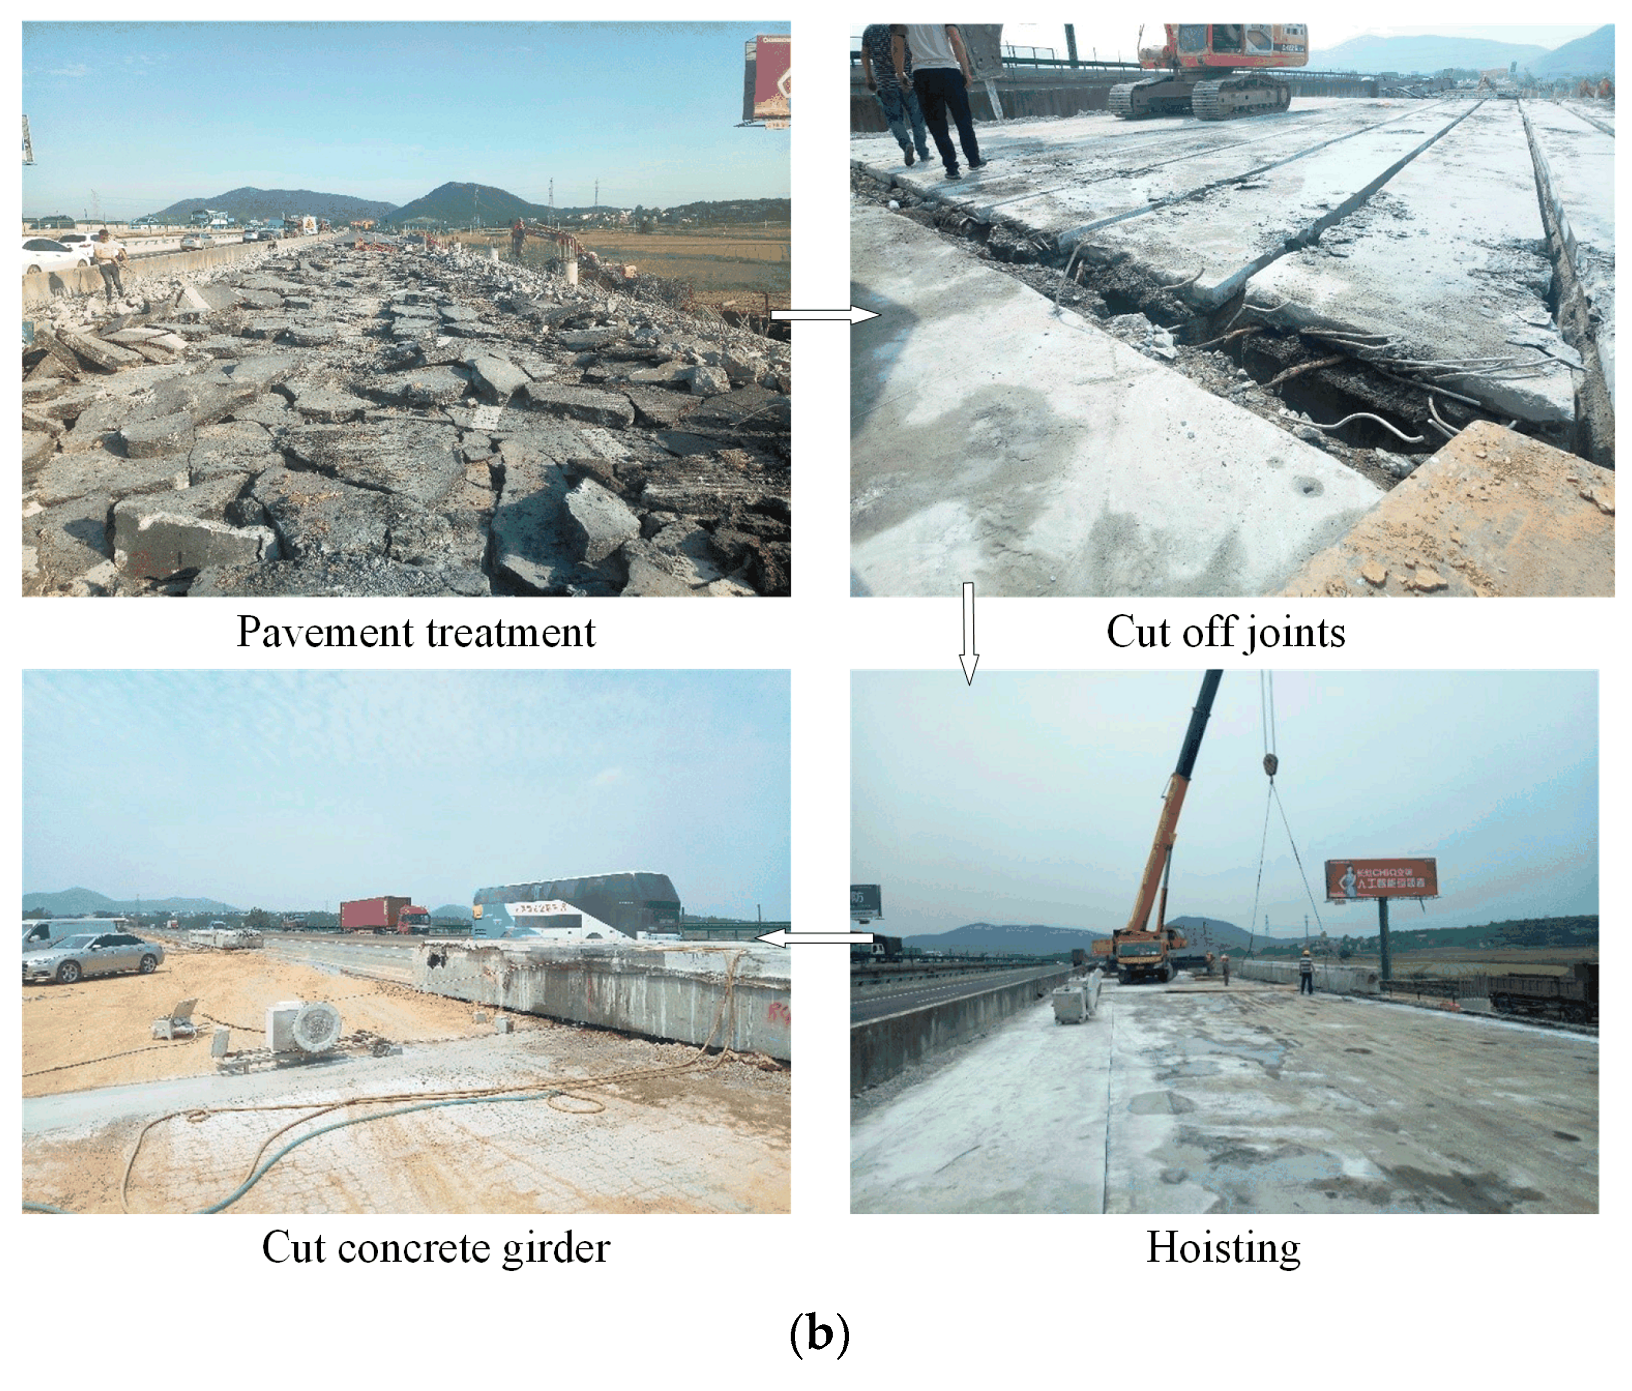
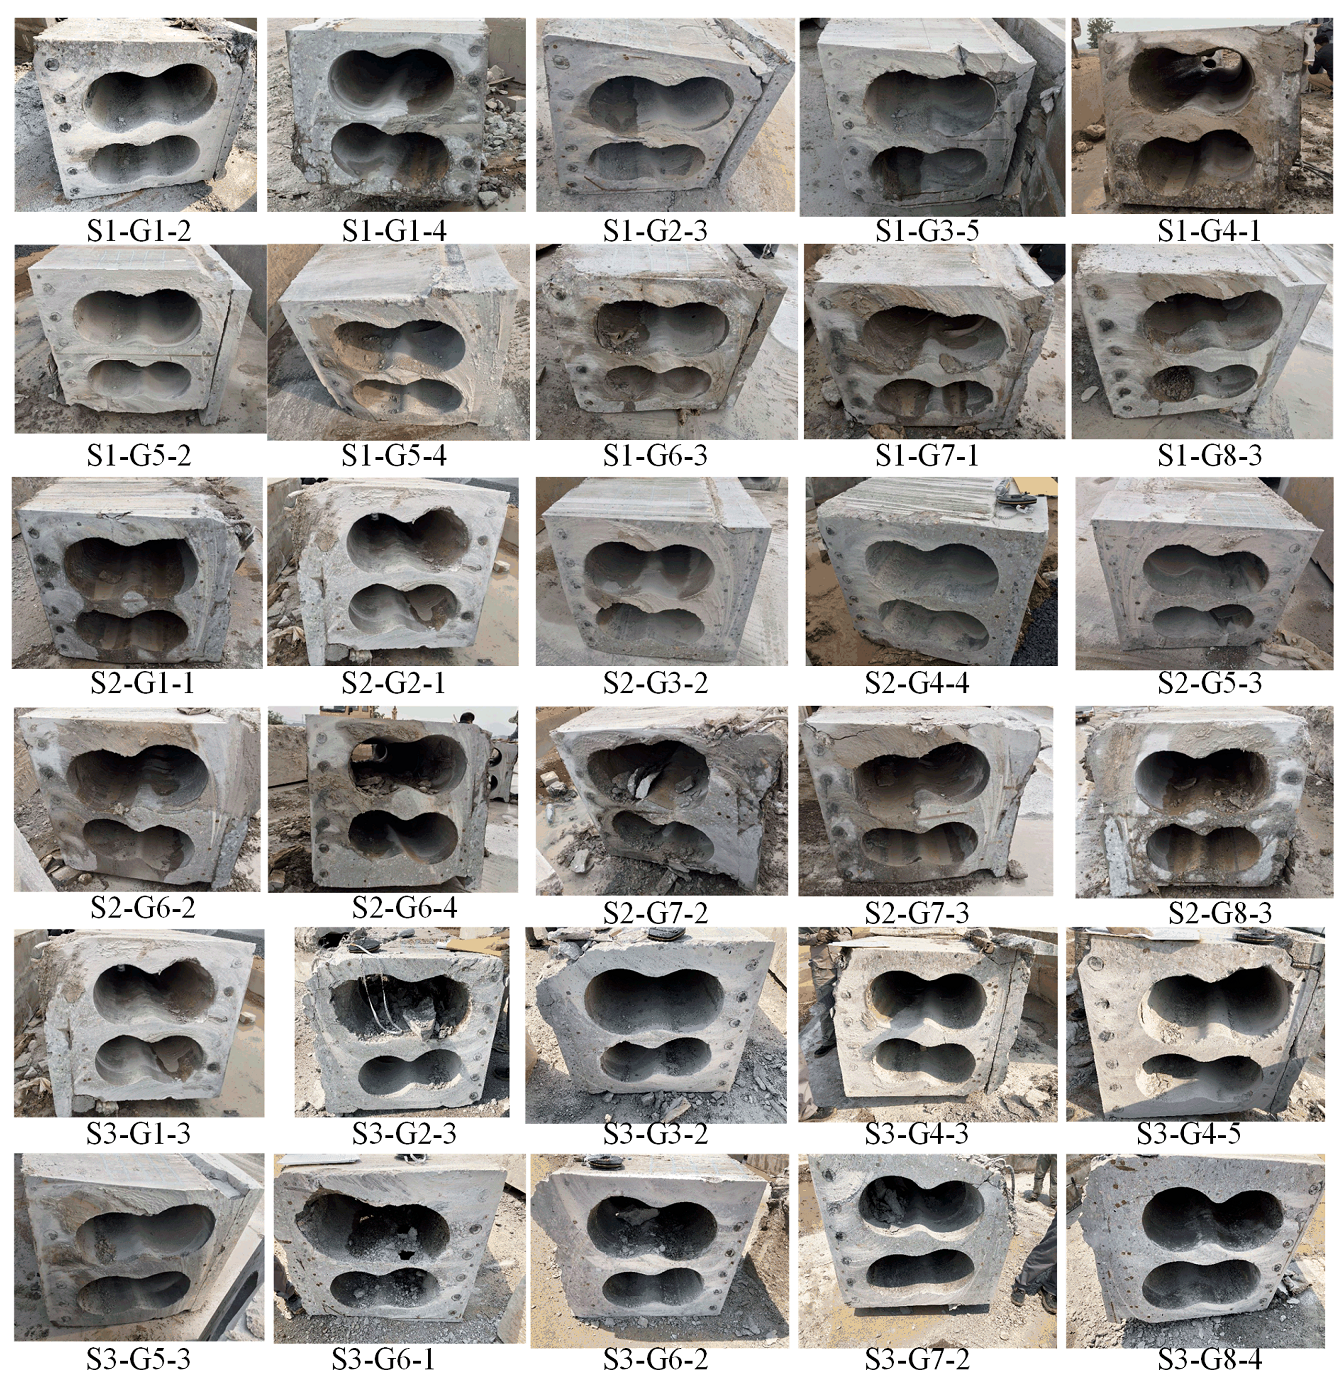
To maintain the desired engineering properties of the concrete bridges, the bridge durability, i.e., the ability to resist the abrasion, corrosion, and other deterioration actions, should be evaluated after certain years’ service. Due to the hinge joint damage, the hollow slab girders may behave individually under the traffic load, leading to the difference of the durability of each girder. Unlike the conventional core sampling and testing of concrete, the studied bridges were demolished, and each girder was cut into six segments in the field to obtain an accurate assessment of the durability of aged bridges. The pavement was first demolished to reduce the bridge weight, and the hinge and bearing joints were cut off using the vibration-free concrete saw. Each girder was then lifted by the crane, and a diamond wire saw was used to cut the concrete girder into six segments. The whole cutting process is shown in Figure 4. Three spans, S1~S3, were included in the field test. In this way, a total of 75 concrete girder segments were obtained, as shown in Figure 5. The segments were numbered by the span, girder, and the cutting orders.
After the cutting off of the concrete bridge, the service condition of the girder can be evaluated accurately. A total of six indicators were considered in the durability evaluation, i.e., surface cracks in longitudinal direction (u1), surface cracks in transverse direction (u2), compressive strength of the concrete (u3), corrosion degree of the rebars (u4), thickness of the reinforcement protective layer (u5), and grout condition in the pre-stressed ducts (u6). The surface cracks on the girders were first recorded and checked with the data in Section 2.2. The compressive strength of the concrete was obtained by the non-destructive rebound hammer test. The corrosion degree of the rebars was calculated by the measured and design value of the diameter. Grout defects in the ducts were also checked, and the thickness of the reinforcement protective layer was measured by a vernier caliper. Some of the indicators are shown in Figure 6.
According to the Chinese specification JTG H11-2015 [21], the condition of the whole bridge or bridge components can be classified into five grades, as shown in Table 2. For the specific parameters of the bridge components, the condition grade is quantified based on the evaluation criteria recommended by the specification. For the surface cracks, a complex calculation process was employed to obtain a comprehensive result. As shown in Table 3, the crack dimensions, crack location, and crack growth are included in the evaluation, and the grade of the surface crack is calculated by the values of different parameters.
The compressive strength of the concrete in the field test is defined as Sc, and the design value is Sd. The concrete strength is then evaluated by the parameter Db = Sc/Sd. The cross-sectional area of the rebars will decrease due to corrosion. The rebar diameter after service is measured, and the value is defined as dc. The design value of the rebar diameter is dd, and the corrosion degree Dc can be calculated by Equation (1):
D c = d c 2 d d 2 ,
The reinforcement protective layer effectively prevents the rebars from the corrosive solution. If nt points on the cross-sectional area of the concrete girder are selected in the measurement, the thickness of the layer for ith point is defined as ti. The characteristic value of the thickness of the protective layer can be calculated by Equation (2):
D d = t ¯ - K t i = 1 n t i 2 n t ( t ¯ ) 2 n t 1 ,
where t ¯ is the average value of t, and Kt is the factor which depends on the number of points nt following Equation (3):
K t = 1.695 10 n t 15 1.645 16 n t 24 1.595 n t 25 ,
There are a total of nd pre-stressed ducts in the cross-section of the girder, and the number of void ducts without gout is nv. The grout condition in the pre-stressed ducts is then assessed by the parameter De = (ndnv)/nd. The evaluation criteria corresponding to the parameters of the concrete and rebars are shown in Table 4. As such, six factors considered in the durability evaluation of the concrete girders can be evaluated after measurement in the field test.

3. Test Results and Analysis

3.1. Surface Damage

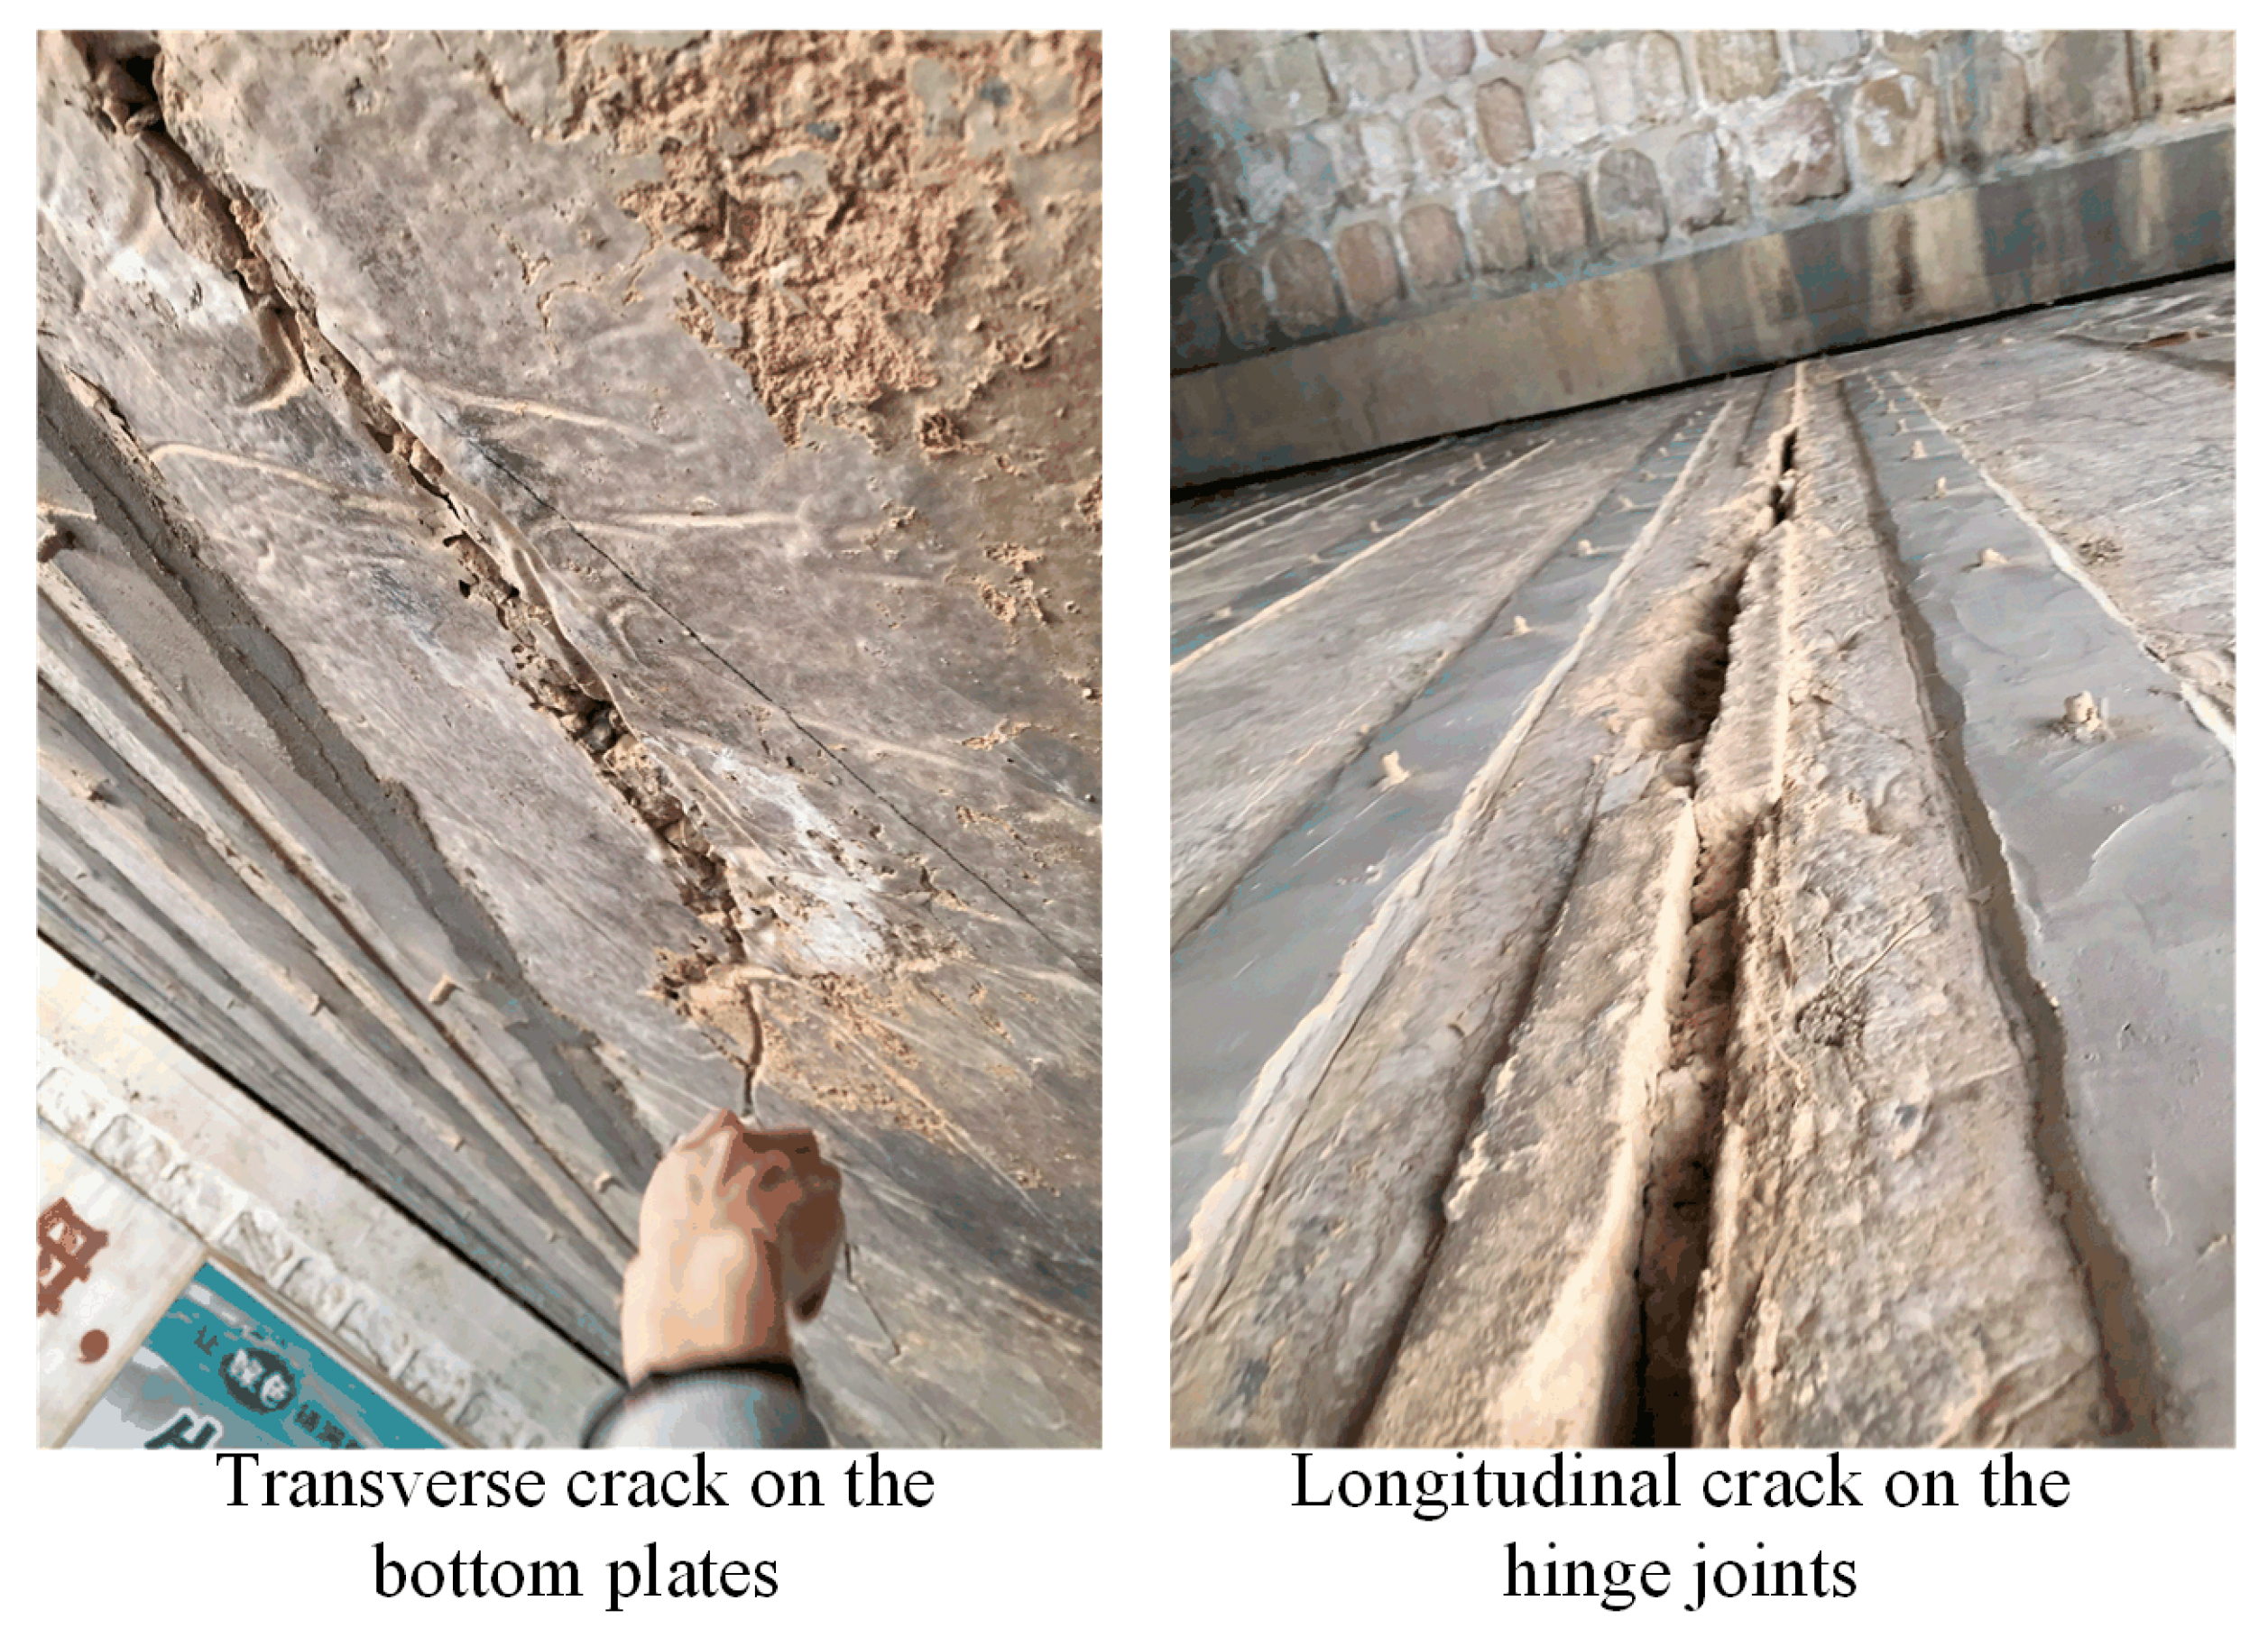
A total of 682 records of the surface damage were found on the superstructures of thirteen bridges. According to the different components on the bridges (single hollow slab girder and hinge joint), typical defects were classified as shown in Table 5. Two defects were mainly observed during the inspection, i.e., transverse cracks on the bottom plates of the single girders and longitudinal cracks on the hinge joints. They account for more than 80% of the surface damage of the single girder or the joint, and typical images of the main defects are shown in Figure 7.
In order to quantitatively evaluate the surface damage, the characteristics of the main defects were obtained including the location and length and width of the cracks. Table 6 shows the location of the cracks in the longitudinal direction. It could be found that the transverse cracking on the bottom plates of the girders mainly occurred in the mid-span of the bridges, while the distribution of the longitudinal cracks on the joints was quite uniform along the longitudinal location except the through cracks. The through cracks along the span length account for 37.1% of all the cracks, indicating the severe damage of the joints after 25 years’ service life.
The dimension distribution of two kinds of cracks is shown in Table 7. Most of the crack length and width of the transverse cracks on the bottom plates of the girders is within 0.5 m and 0.5 mm, respectively. The number of cracks decreases when the crack length increases from 0.2 to 0.5 m or when the crack width increases from 0.2 to 0.5 mm. For the longitudinal cracks on the joints, the crack length has a wide range, and the crack width is mainly less than 6 mm. Most of the cracks which extend partly on the joints were observed near the bearings.

3.2. Transverse Connectivity

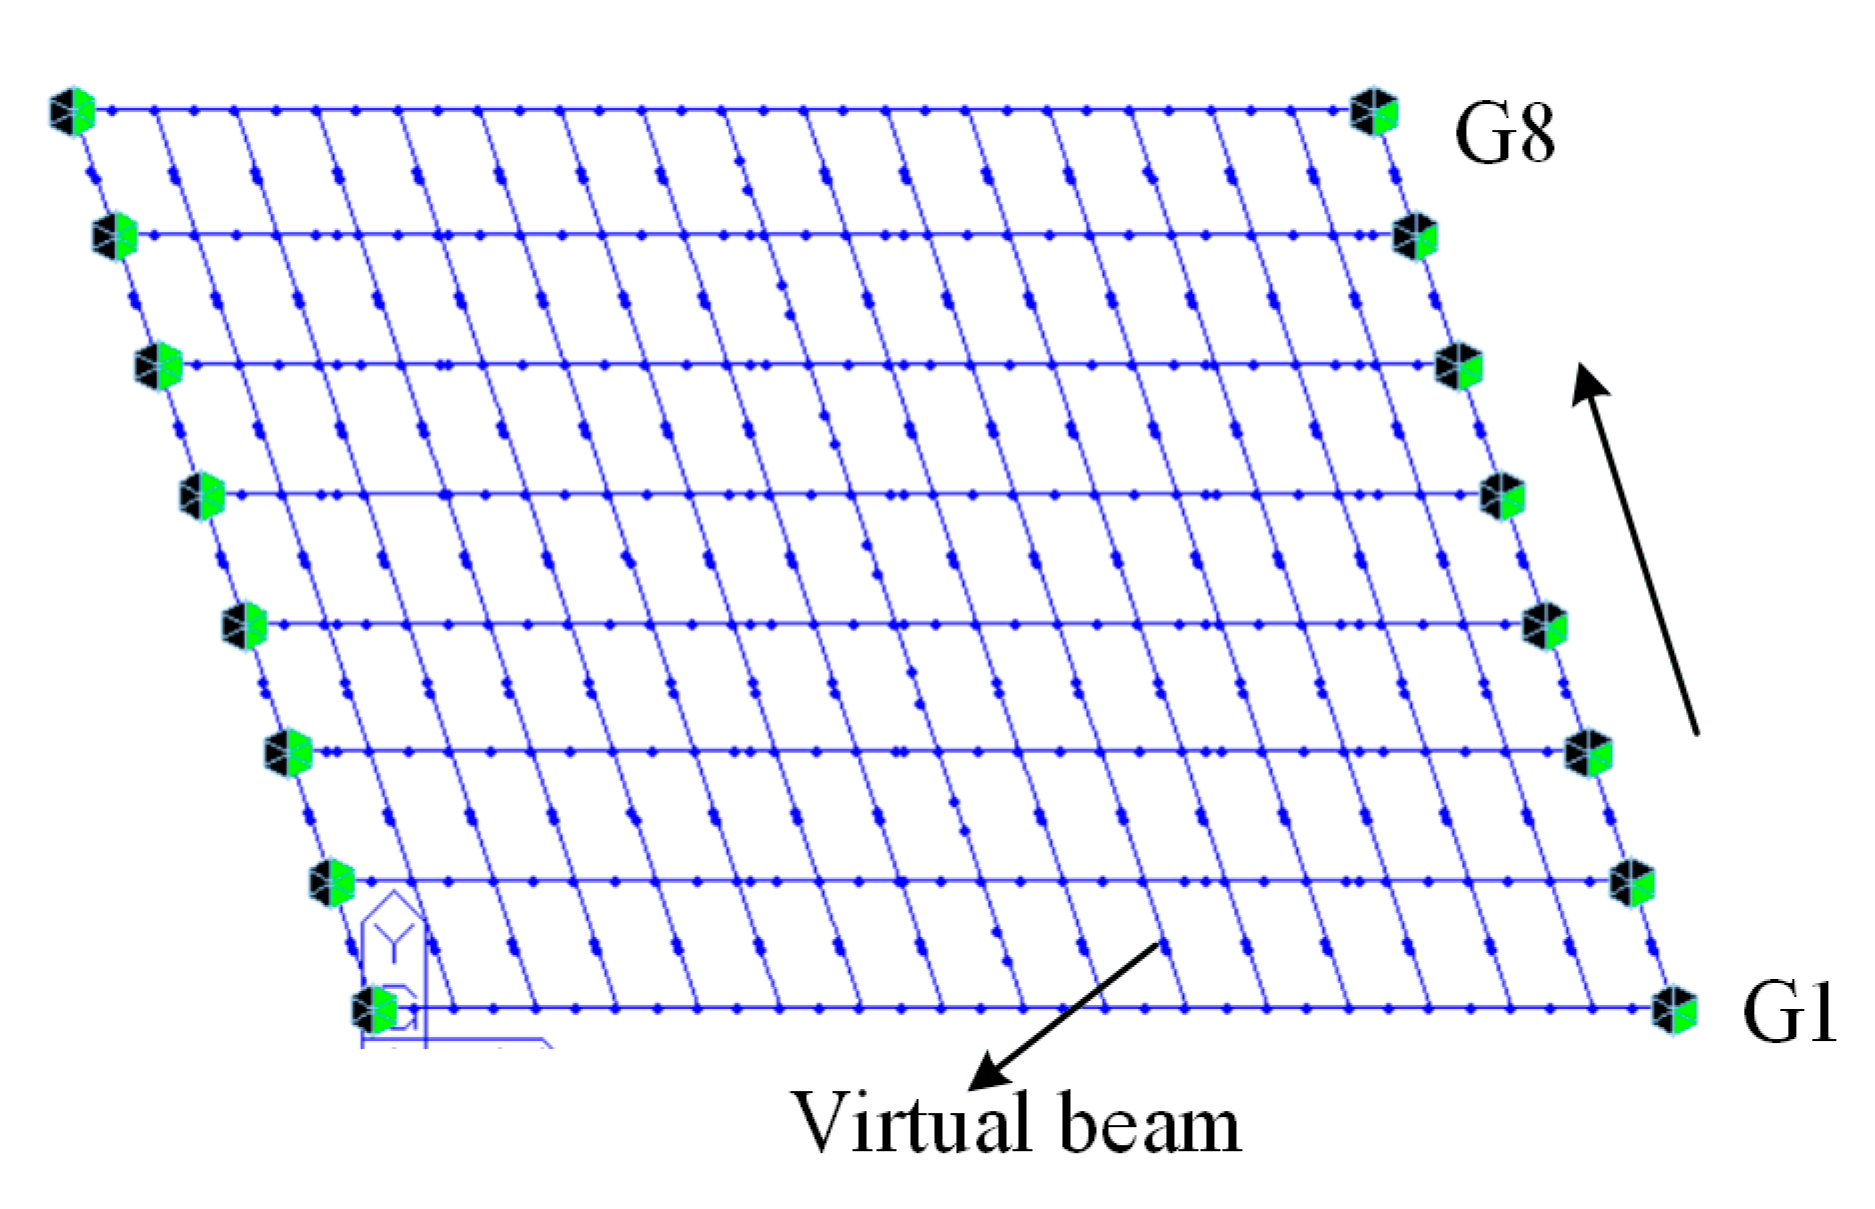
The transverse connections between the girders are weakened due to the deterioration of the joints. To make a comparison with the results in the load test, a three-dimensional FE model was established using the Midas software, as shown Figure 8. Beam element was used to model the single hollow slab girder. Virtual beams were simulated between girders to offer the transverse stiffness in the analysis. Element size was taken as 0.5 m, and there were a total of 847 elements in the grillage model. The mechanical properties of C50 grade concrete were used in the FE model. According to the Chinese code GB50010-2010 [22], the constitutive relationship of the concrete under uniaxial compression can be expressed by Equation (4):
σ f c = E c ε f c + ( E c ε c f c ) ( ε ε c ) n , ε ε c ε α ( ε ε c ) 2 ε c + ε , ε > ε c
where σ is the axial stress; fc is the peak stress; ε is the strain; εc is the strain at the peak; Ec is the elastic modulus of the concrete; and α is the empirical parameter shaping the descending branch. For the C50 grade concrete, fc = 50 Mpa, εc = 1.92 × 10⁻³, Ec = 34.5 GPa, and α = 2.48. It is noted that the mechanical properties should be obtained by the uniaxial compression test of the cylinder concrete specimens of the real bridge. However, the test specimens were not fabricated before the demolition of the bridge, and specified values are used in the FE model. Moreover, the boundary condition is consistent with the simply supported bridge. The load of one truck is simplified as six concentrated forces which corresponds to six wheels.
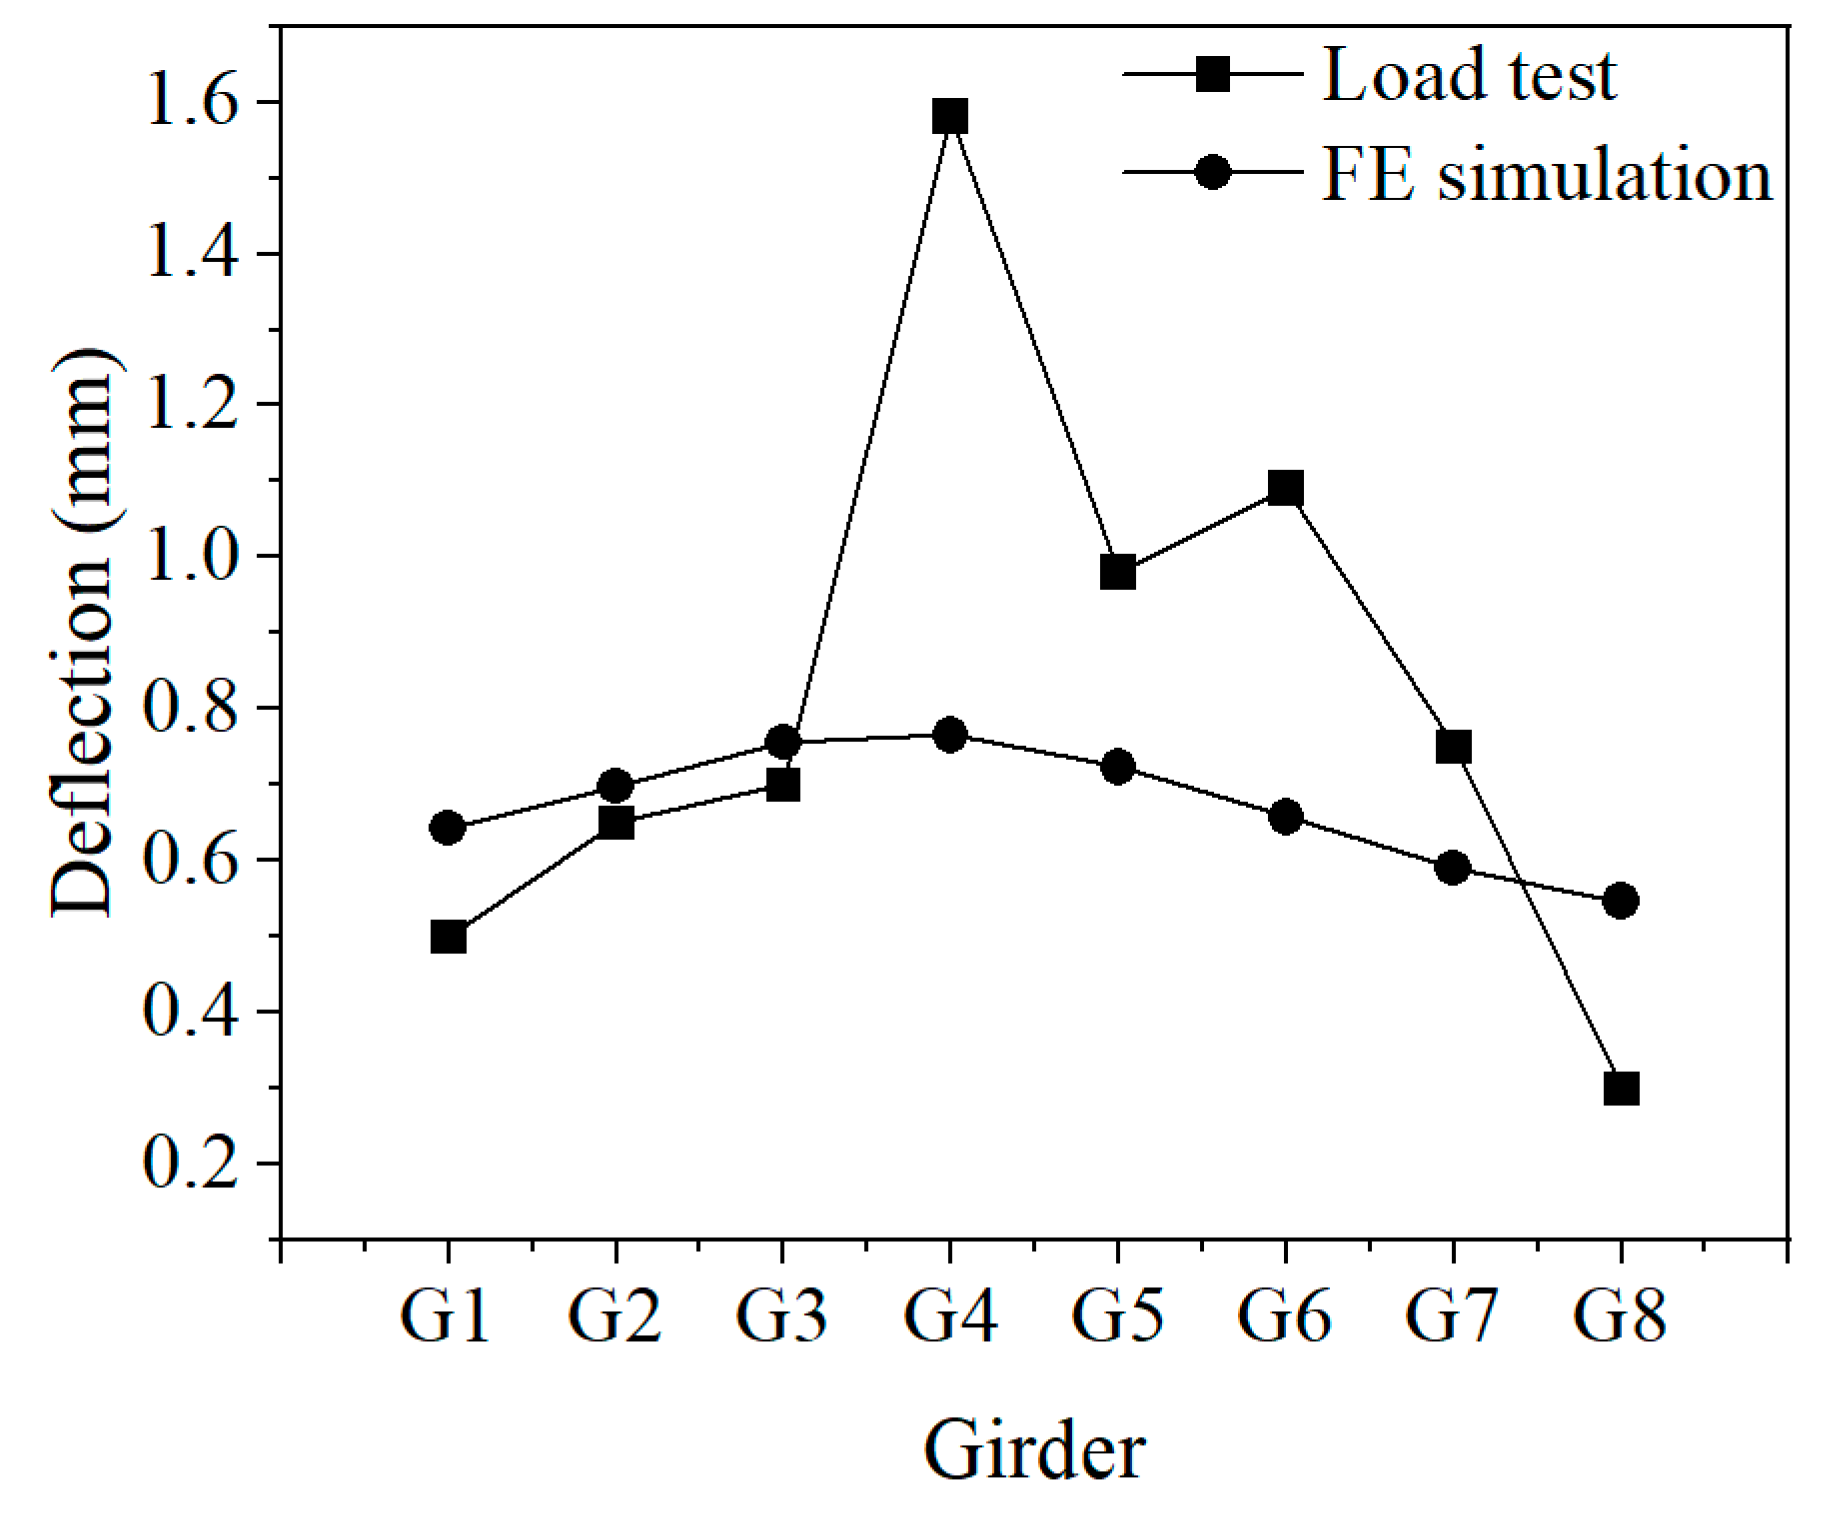
The mid-span deflection of each girder under the truck load is shown in Figure 9. The non-uniform distribution of the deflection results in the load test is obvious, which is inconsistent with the theoretical value in the FE simulation. The actual mid-span deflection of G4 girder is about twice of the theoretical value, and the deflections of G1, G2, and G3 girders are slightly smaller than the simulation results. It shows that the nearby joints of G4 girder were damaged to an extent, and the external load cannot be perfectly transferred to other girders. Similar condition occurs at the G6 girder. It can be inferred in Figure 9 that the hinge joints near the G4 and G6 girders may suffer severe damage after 25 years’ service life.
To evaluate the damage of the joint, a damage index µ was proposed based on the theoretical and measured deflections. Given two adjacent girders Gi and Gi+1, the hinge joint between the girders is defined as Hi. Two measuring points with gauges, Pi and Pi+1, are prepared on the left and right sides of the joint Hi. The relative displacement of two points γi can be calculated by Equation (5):
γ i = d i + 1 d i ,
where di is the theoretical or measured deflection at the measuring point Pi. Based on the field test, the measured relative displacement for the joint Hi is defined as γi, and the theoretical value is defined as γi’. The damage index µi corresponding to the joint Hi can be expressed by Equation (6):
µ i = γ i γ i γ i + γ i .
As the theoretical value of the relative displacement is certain, the damage index increases with the increase of the measured relative displacement. When the measured value is much larger than the theoretical value, the index value is close to 1, indicating severe damage of the joint. When the measured value is close to the theoretical value, the joint is in good condition, and the index value is close to 0. When the measured value is smaller than the theoretical value, the adjacent joint might be damaged, and the load cannot be well transferred. The joint is also in good condition, and the index value is smaller than 0. Therefore, the joint damage can be assessed by the damage index µ when the index value is larger than 0.
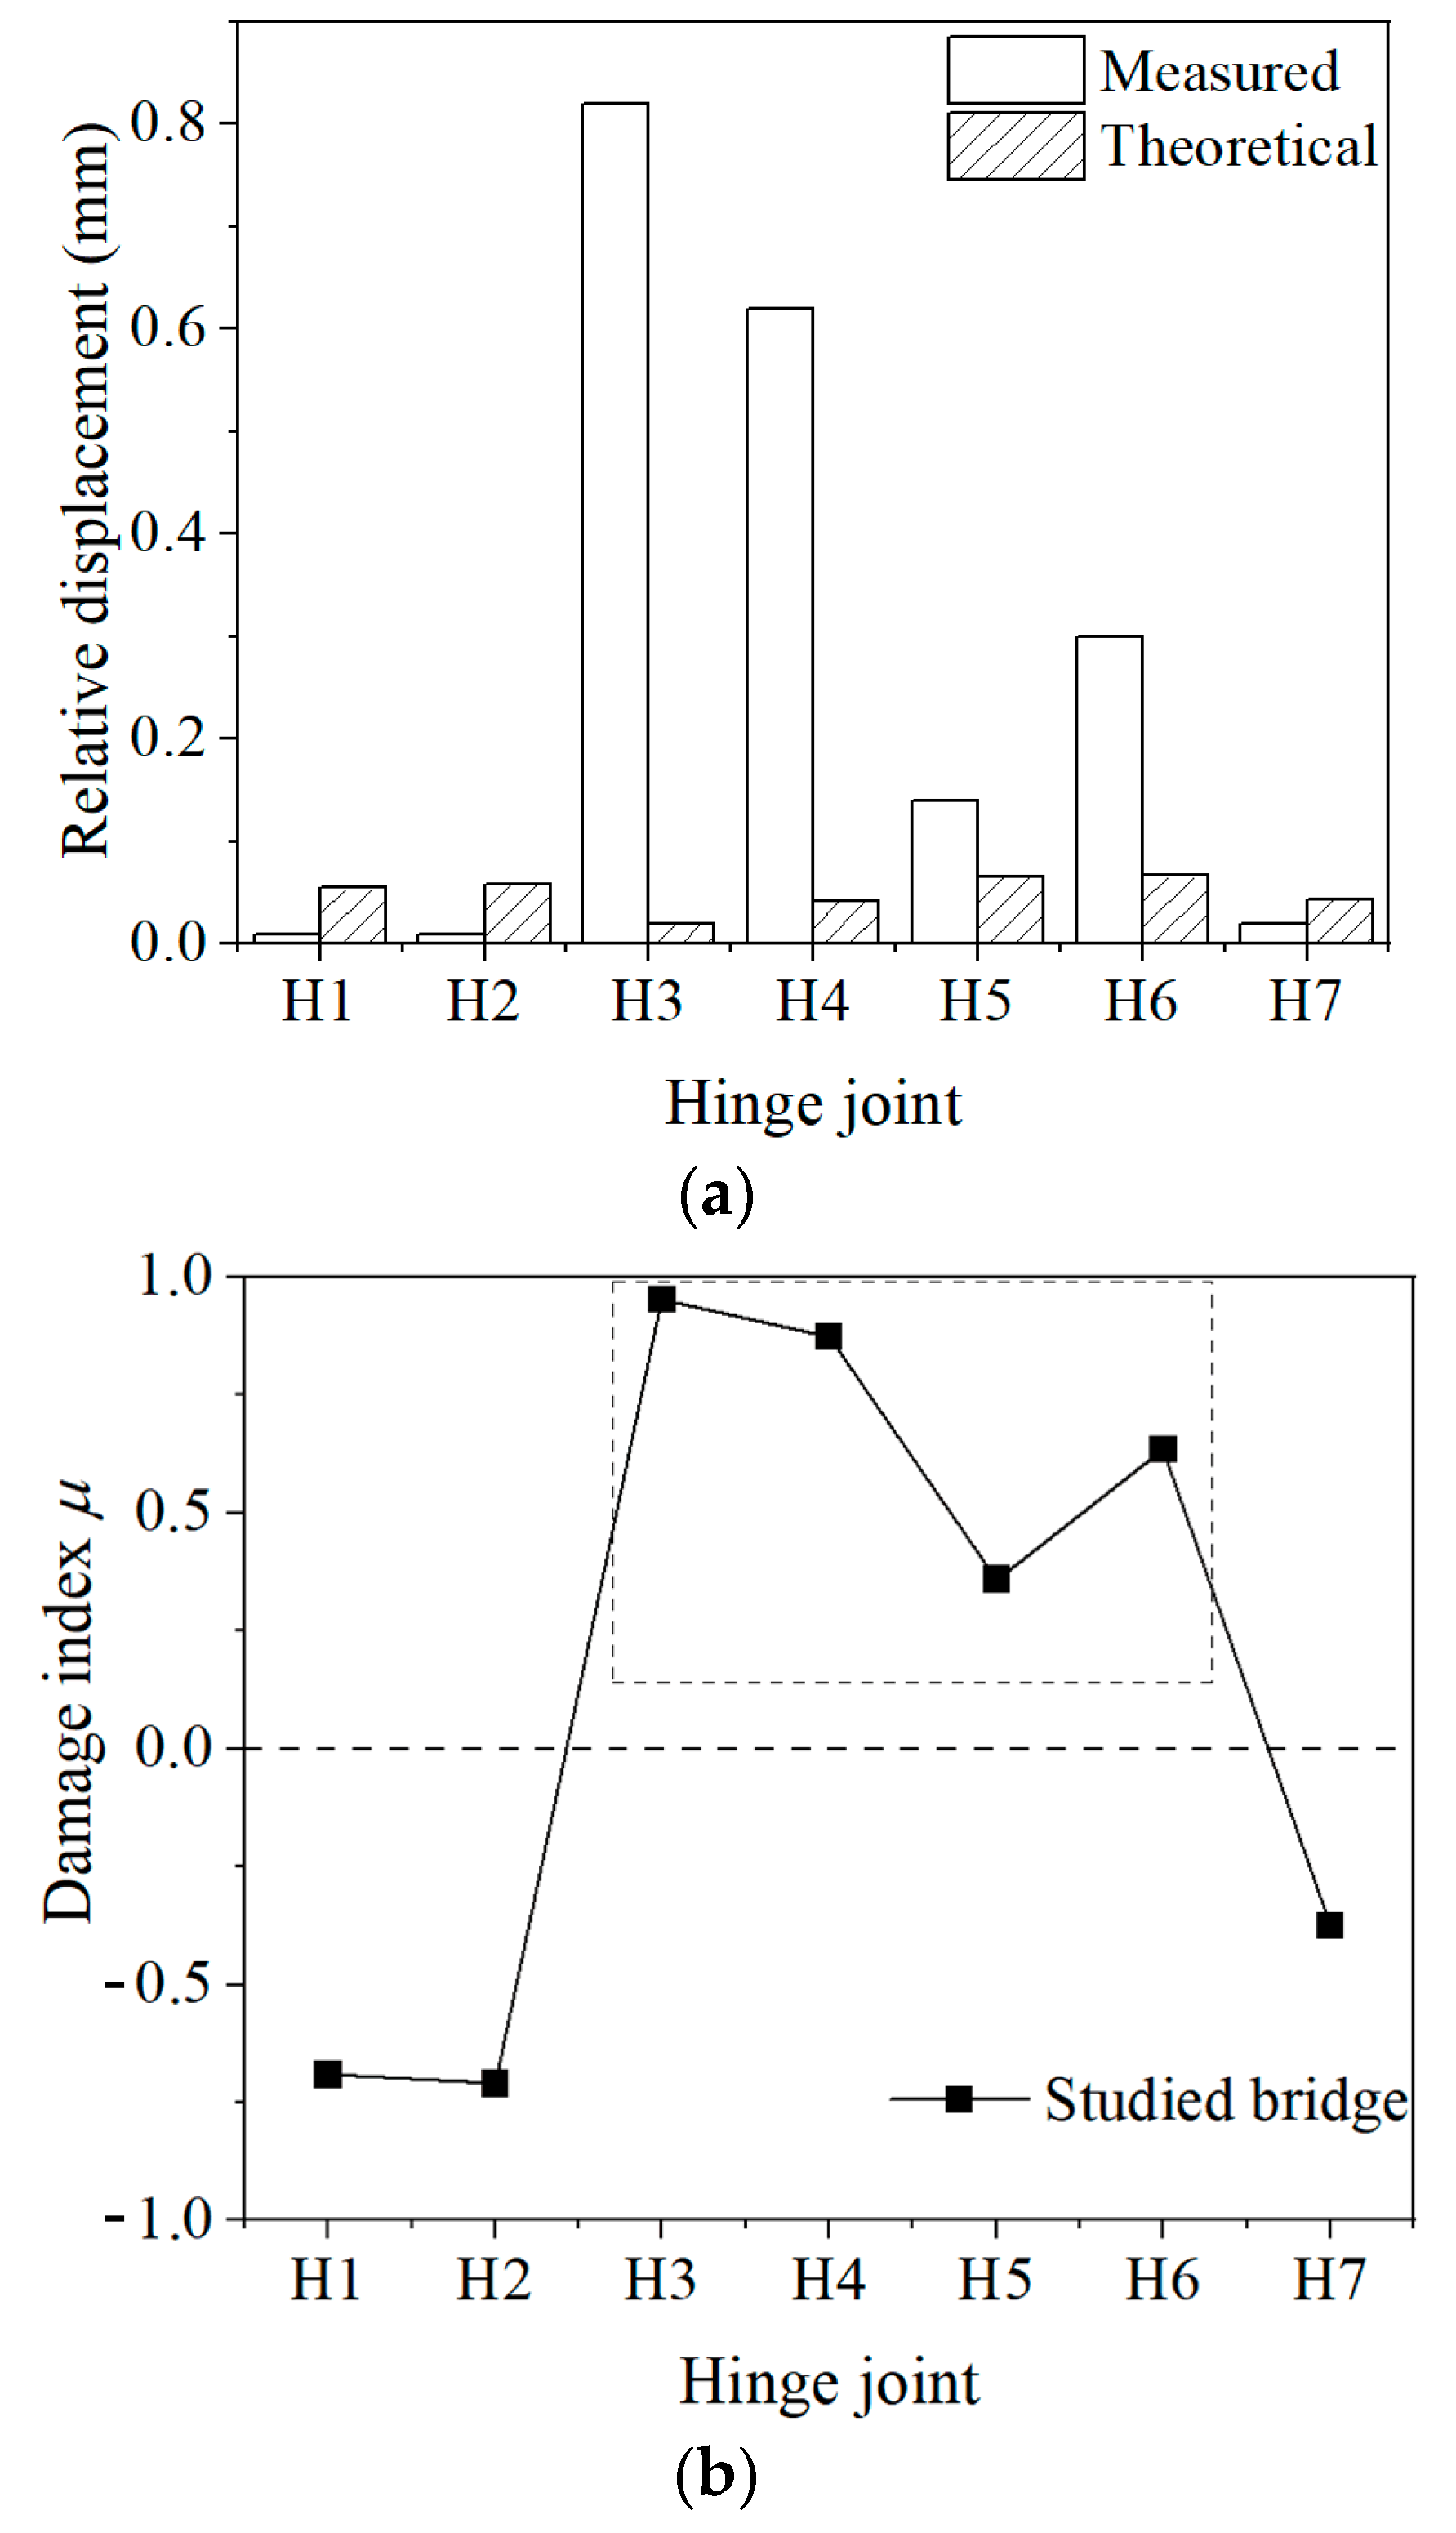
According to the measured and theoretical value in Section 3.1, the hinge joints of the studied hollow slab bridge were evaluated using the proposed damage index. Figure 10a shows the comparison of the measured and theoretical values of the relative displacement of the joints. For the H3, H4, and H6 joints, the measured relative displacement is much larger than the theoretical results, while the relative displacement of other joints is within 0.15 mm. The proposed damage index of each joint was calculated, and the values are shown in Figure 10b. It could be found that the damage index of H3~6 joints is above 0, and the H3 joint has the highest value of the index. The damage index is consistent with the findings in Figure 9 that the nearby joints of G4 and G6 girders were damaged to an extent. The surface damage of the joints is shown in Figure 11. For all the seven joints, there were through cracks only in H3 and H4 joints. The surface damage is slight for H1 and H2 joints, which verifies the joint evaluation using the proposed damage index.

3.3. Durability

The evaluation indicators can be quantitative or qualitative. As multiple indicators are involved for the concrete hollow slab girders, their contributions may differ in the durability evaluation. Moreover, due to the inherent uncertainty in human perception, a fuzzy characteristic exists in human judgment and preference which will inevitably affect the decision making process [23]. Therefore, to determine the suitable weight of each indicator, as well as to reasonably transform the human judgment into ratio scales, AHP along with the fuzzy comprehensive evaluation (FCE) method was employed in this study to evaluate the durability of the hollow slab girder. The original AHP developed by Saaty [24] uses the scale of 1–9 with language labels in the pairwise comparisons, and the weights of various competing or conflicting criteria could be derived from comparison matrices [25]. When FCE is incorporated into the AHP, a fuzzy mapping is established between the indicators and appraisal grades. Fuzzy membership function was employed, and a qualitative evaluation was realized based on the qualitative indicators.
The AHP generally includes four steps: (1) decompose the evaluation problem into a hierarchical structure including the goal, criteria, and alternatives; (2) establish the pairwise comparison matrix in each layer; (3) calculate the weights of the criteria and alternatives; (4) check the consistency. For the durability evaluation of the girders in this study, the hierarchical structure shown in Figure 12 was established considering the indicators in Section 2.4. There were four evaluation factors in the Criteria layer and one or two evaluation factors in the Alternatives layer. When the number of the evaluation factors was taken as k, the evaluation vector U = [u1 u2uk]. The scale of 1–9 was used in the importance intensity in the pairwise comparisons. A value of ‘1′ represents that two indicators are equally important while ‘9′ represents that one indicator is extremely more important than the other. Given k factors considered in Figure 12, the certain pairwise comparison matrix M can be expressed by Equation (7):
M = m 11 m 12 m 1 k m 21 m 22 m 2 k . . . . m k 1 m k 2 m 1 k ,
where m represents the importance intensity between two factors. The weight vector of k factors, W = [w1 w2wk]T, was then obtained by normalizing the column vectors of the matrix, summing up the row vectors, and averaging the final column vector. In order to check if the human judgments were internally consistent, the consistency ratio CR was calculated by Equation (8):
C R = λ max k ( k 1 ) R I ,
where λmax is the maximum eigenvalue of the matrix M; RI is the average random index which depends on the size of the matrix. The human judgment in the evaluation is acceptable when CR is smaller than 0.1.
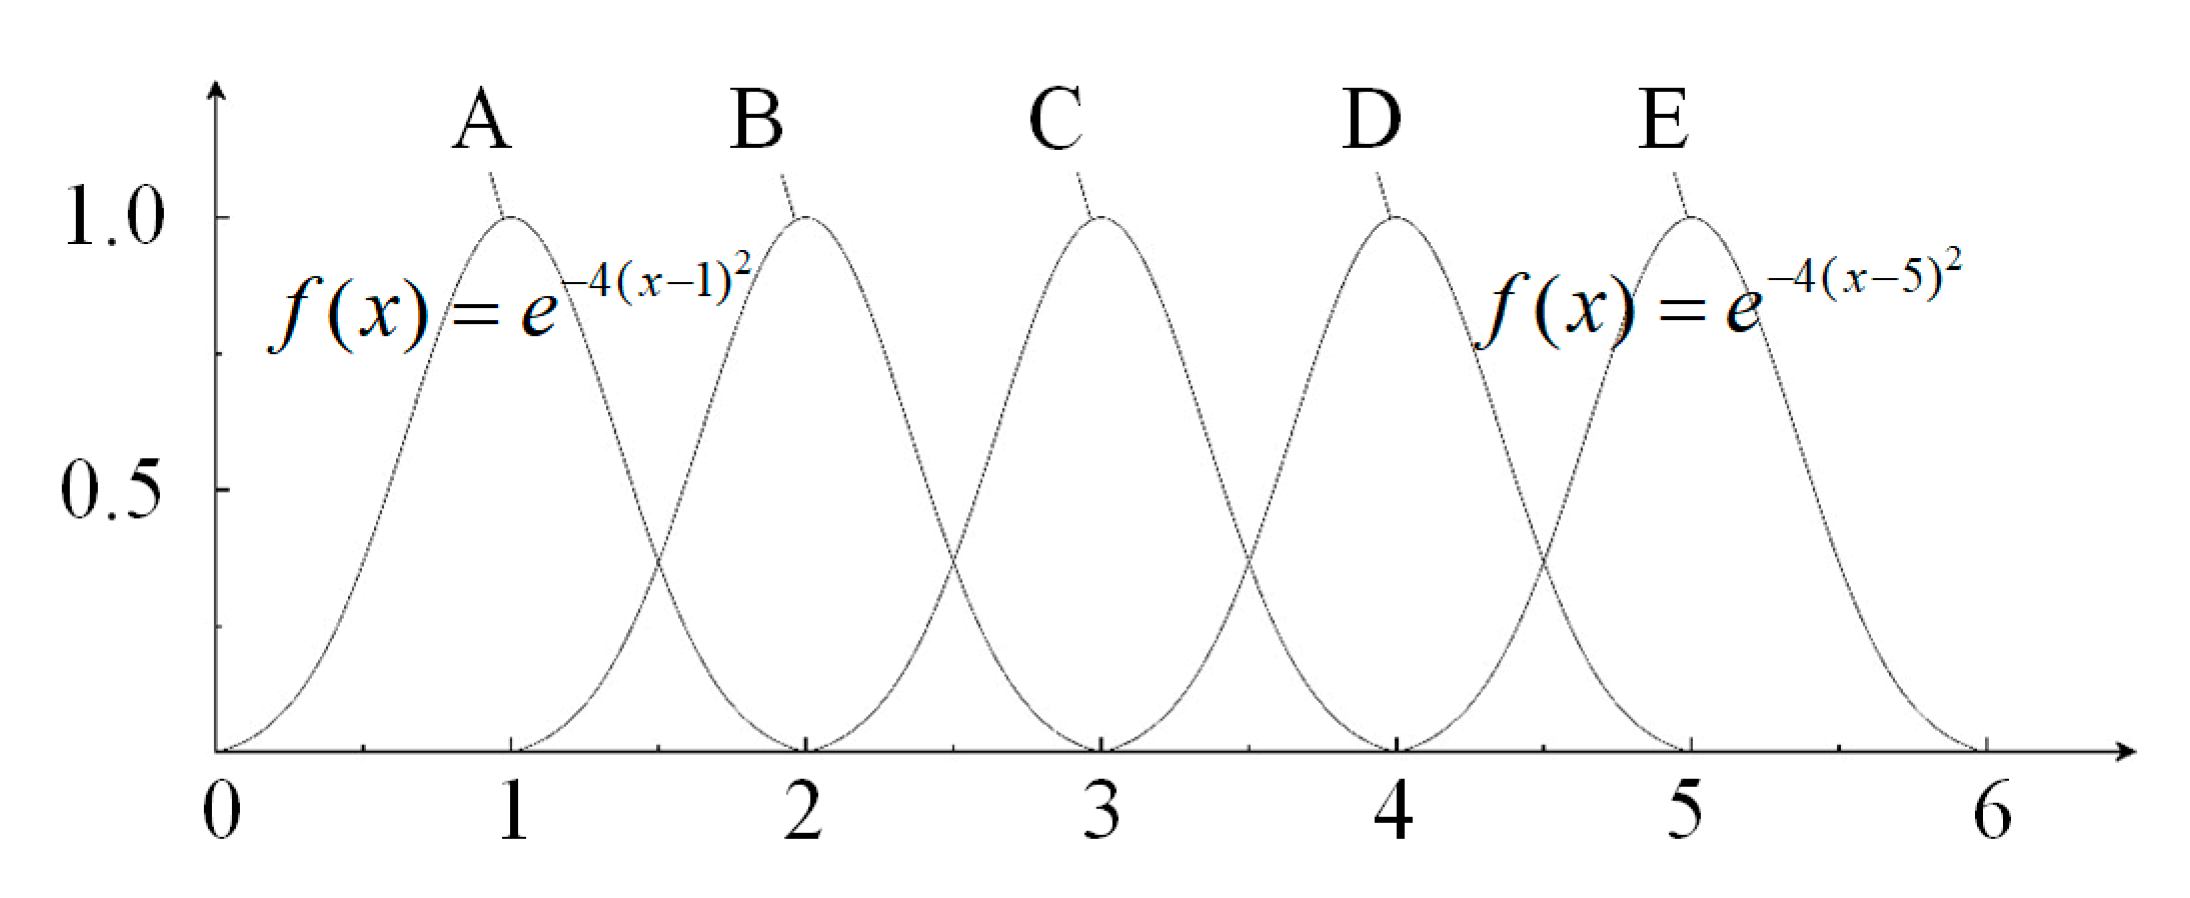
As such, the weights of the criteria (WC) and alternatives (WA1, WA2, WA3, and WA4) were obtained. The FCE is then conducted following the four steps: (1) determine the set of indicators; (2) define the set of appraisal grades; (3) form the fuzzy appraisal matrix; (4) obtain the evaluation result based on the weights and matrix. For the durability evaluation of the girders in this study, the set of indicators is consistent with the evaluation factors used in each layer in the AHP, as shown in Figure 12. Five appraisal grades shown in Table 4 are employed which range from ‘Grade A-Intact’ to ‘Grade E-In danger’, i.e., the grade vector V = [A B C D E]. A membership function shown in Figure 13 is then used to represent the fuzzy mapping from a certain indicator to the grade vector V. A row vector of fuzzy membership degree is formed for each evaluation factor, and the fuzzy appraisal matrix Z of k factors is established, as shown in Equation (9):
Z = z 11 z 12 z 15 z 21 z 22 z 25 . . . . z k 1 z k 2 z k 5 ,
The size of the matrix Z is consistent with the number of the evaluation factors and the grades. The vector of the evaluation result in the Criteria layer C was first calculated based on the weight vector of the alternatives in the AHP. The overall evaluation result of the goal layer Rd was then quantitatively calculated by Equation (10):
R d = ( W C × Z C ) × [ 1 2 3 4 5 ] T ,
The structure is in good condition when the value of Rd is close to 1.
Based on the evaluation method mentioned above, a single girder, S2-G4, is taken as an illustration example for the durability evaluation. Following the evaluation criteria, the appraisal grade of each indicator in the Alternatives layer was first obtained according to the measurements in the field test, as summarized in Table 8. The pairwise comparison matrix in each layer is shown in Figure 14, and the weight vector of the Criteria layer WC can be calculated as [0.0576 0.5132 0.3319 0.1153]. The overall evaluation results Rd of the girder segments S2-G4-1, S2-G4-2, S2-G4-3, S2-G4-4, and S2-G4-5 are 2.6406, 1.7740, 2.4977, 2.6575, and 1.5098, respectively. The maximum value of RD is 2.6575, which indicates that the S2-G4 girder is within the moderate deterioration condition.
A total of 75 hollow slab girder segments shown in Figure 4 were evaluated using the durability evaluation method. The distribution of the Rd values is shown in Figure 15. A total of 69.3% of the girder segments are within the mild deterioration condition, and 98.7% of the girder segments are within the moderate deterioration condition after 25 years’ service life. The difference of the durability performance between each span is not obvious.

4. Evaluation of Hollow Slab Girders Based on Surface Damage and Neural Networks

4.1. Evaluation Using Neural Network

It is costly and time-consuming to perform the truck load test and cutting off process in order to evaluate the hinge joint damage and the durability of the hollow slab bridges in the entire highway system. As the bending moment and stiffness of a single girder are greatly affected by its condition state and the load distribution under the joints, the cracking of the bottom plates at different locations of the bridge is a critical parameter under the external load. The surface cracks can be clearly observed in the visual inspection. If a relationship between the surface cracks and the damage index (hinge joint damage µ or the durability result Rd) can be found, the evaluation of the bridge is more convenient with a much lower inspection cost. Therefore, the artificial neural networks (ANN) method is employed to establish the correlation between the damage index and cracks. As a powerful machine-learning tool, the ANN method can fit the nonlinear mapping relations well and has been widely used in the bridge performance evaluation [18].
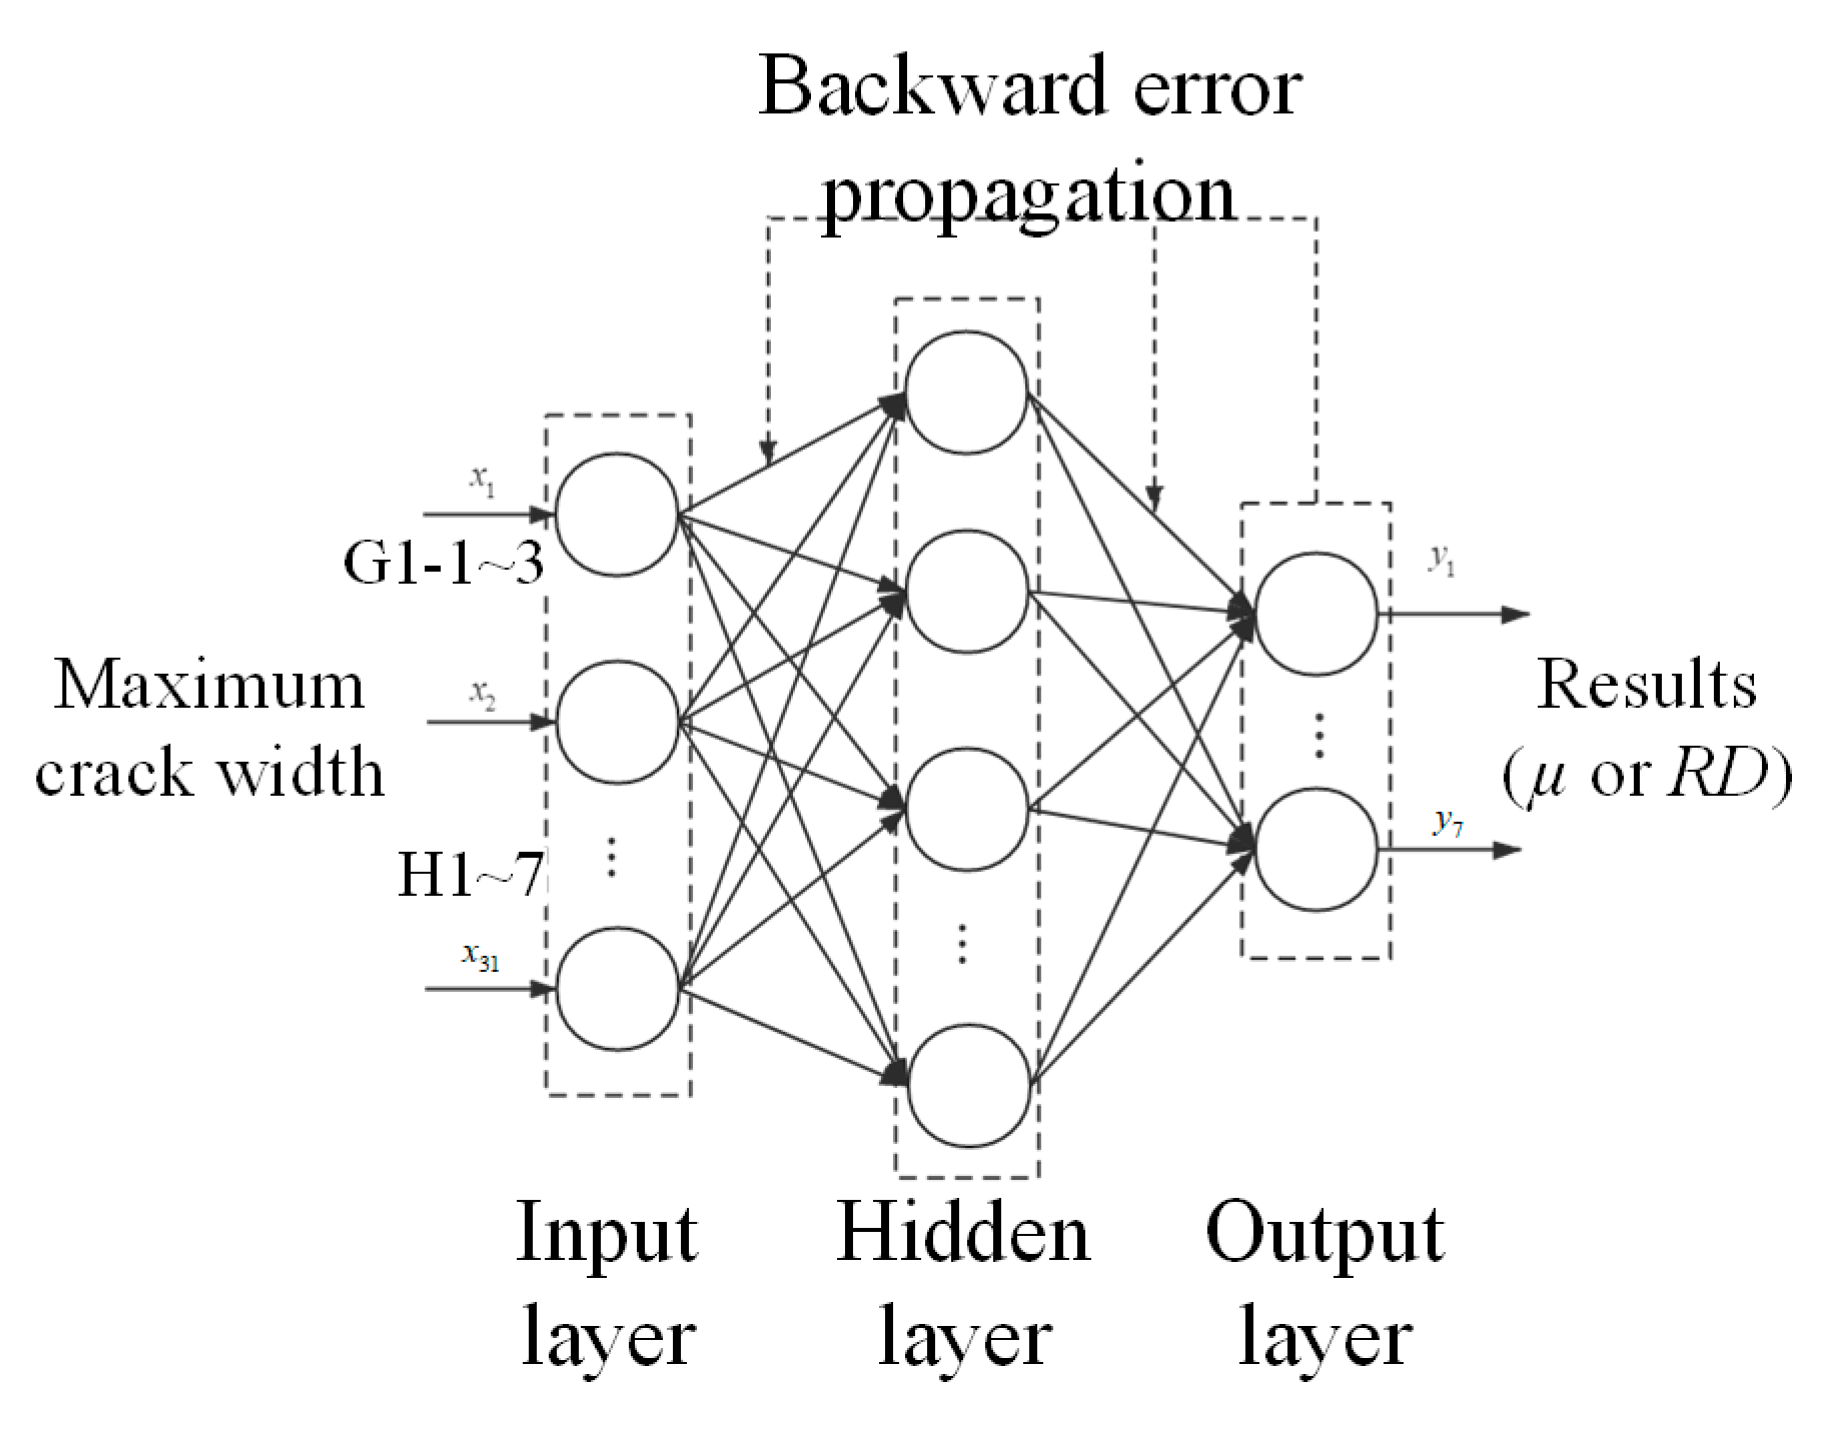
The backpropagation network used in this study is shown in Figure 16 with a single hidden layer. The network structure includes the input layer, hidden layer, and output layer. The set of raw data obtained from the visual inspections is used in the input layer. Based on the transfer function, weight of the input, and bias, an artificial neuron produces an output in the hidden layer. The desired results in the output layer are then calculated by summing up the weighted inputs in the hidden layer. As such, a feedforward calculation ends, and the prediction error of the results is obtained. The training phase then starts by adjusting the weights and biases in each layer with the backward error propagation. The training ends until the errors or the termination condition met the requirements.
Based on the statistical analysis of the surface damage in different locations and the concrete cracking under the degradation of the mechanical performance, the maximum crack width was selected as the critical parameter in the input data set, as shown in Figure 16. For a hollow slab concrete bridge in the Wu-He highway system, there are eight single girders and seven hinge joints. Each girder was equally divided into six segments in the longitudinal direction, i.e., 0–1/3 span, 1/3–2/3 span, and 2/3–1 span, and the maximum crack width on the bottom plates of three girder segments was recorded. The maximum crack width of 24 segments and seven hinge joints was recorded, and a total of 31 parameters were considered in the input layer for one bridge. As two cases were studied including the hinge joint damage and girder durability, there were seven output results for the hinge joint damage µ and eight output results for the durability evaluation result Rd. As the data in the field test are limited, an updated FE model was used to obtain the additional data set with different damage conditions. A reduction factor calculated by the maximum crack width was used in the elastic modulus to account for the decrease of the bending stiffness. The status of the virtual beams and the boundary condition were adjusted to simulate the weakening of the hinge joints. A total of 115 samples were obtained from the field test and the FE simulation which included 25 bridges. A total of 100 samples from 21 bridges were used in the training of the network, and 15 samples from four bridges were used for verification. A single hidden layer is employed as two or more hidden layers may lead to over-fitting of the data and an increase in training time. The sigmoid function was employed in the transfer function, and gradient descent algorithm is used in the training phase.
The maximum number of iterations in the training phase was set to be 500. The number of hidden neurons and the learning rate will significantly influence the training effect and the efficiency of the neural network [26,27]. Lippmann recommended that the number of hidden neurons Nh can be approximately calculated by Equation (11):
N h = N i × N o ,
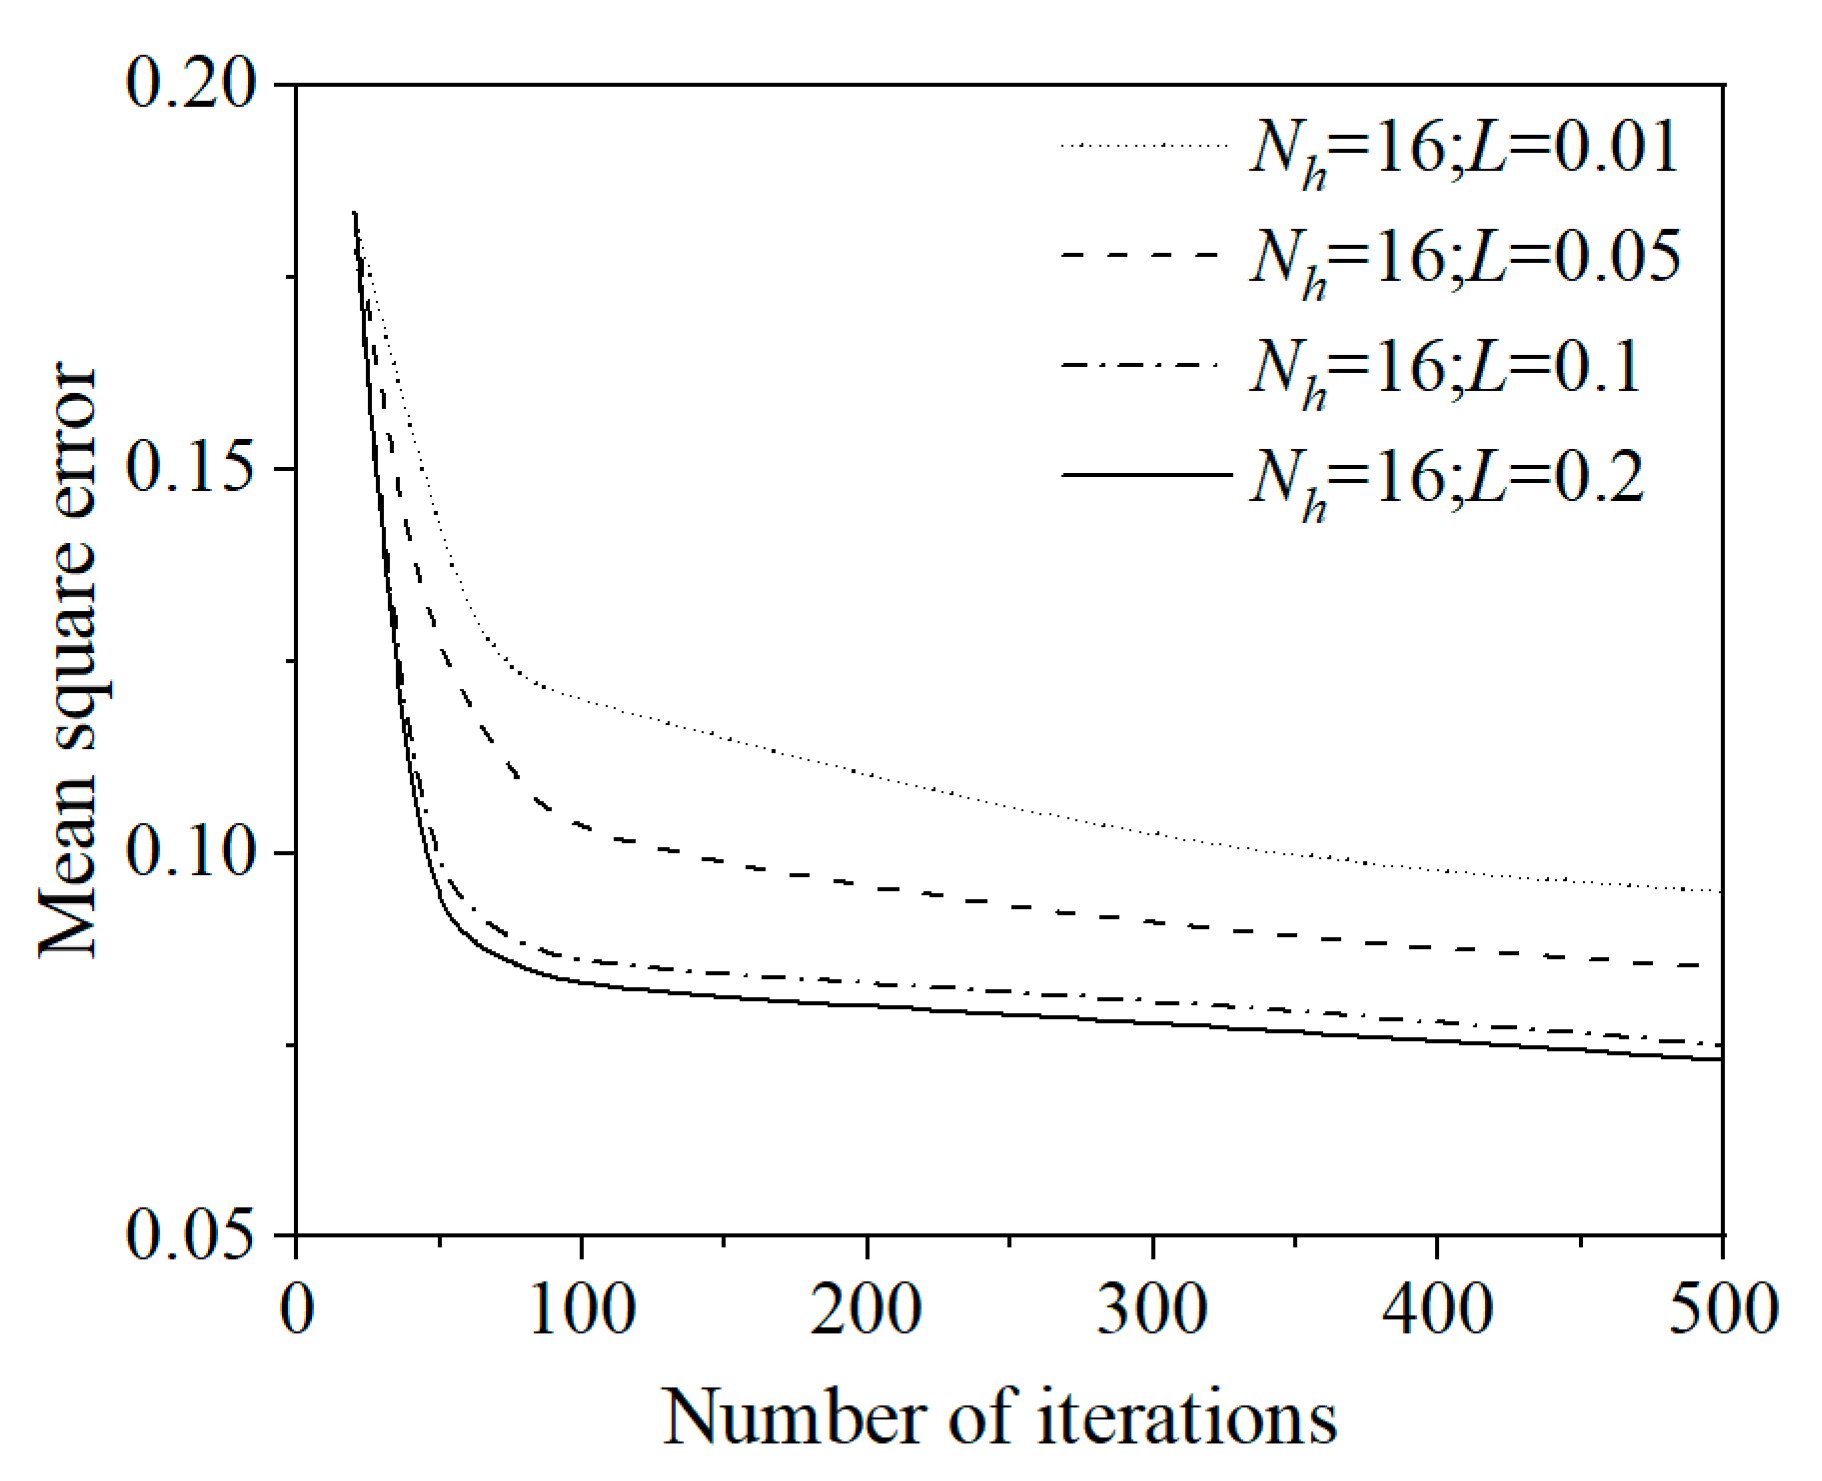
where Ni and No are the number of the neurons in the input and output layers, respectively. Thus, the range of Nh was set to be 16 in each case. The learning rate L ranged from 0.01 to 0.2 and was modified by trial and error in each case to minimize the mean square error (mse) between the outputs and target results. The relationship between mse and the number of iterations is shown in Figure 17 when the output result is the hinge damage index. It can be seen that the mse drops quickly in 50 iterations, and then the convergence is gradually reached over 100 iterations. The mse slightly decreases with the increase of the learning rate, and the value of L is set to be 0.2.

4.2. Method Verification

Fifteen samples from four real bridges in the Wu-He highway system were used in the model for verification. Test results of each sample were obtained following the process in Section 3. Figure 18 shows the comparison of the predictions and test results of one sample. It can be seen that the predicted hinge joint damage index agrees well with results in a real bridge, and the errors of all the joints are within 15.0%. The prediction error is not affected by the transverse location of the joints, and the joints with severe damage could be accurately predicted based on the crack width in the visual inspection. A much larger difference is found for the durability results of the girders, and the maximum error in the test set is 39.5%. However, the same trend can be seen for the different girders on the bridge, and the absolute error within 40% is acceptable in the practical engineering considering the appraisal grades. The average values of the prediction error of the hinge joint damage and girder durability are 7.2% and 13.5%, indicating the feasibility of evaluation of hollow slab bridges using the surface cracks and neural networks. It is noted that the efficiency of the evaluation method is dependent on the quantity of the training samples in the field test. However, the training samples are limited in the highway bridge system. Damage indicators such as the modal parameters can be employed in the method to improve the reliability of the evaluation, which will be investigated by the authors in further research. Different types of neural networks [28,29,30,31] can also be employed to improve the prediction accuracy of the evaluation.

5. Conclusions

In this paper, the transverse connectivity and durability of the concrete hollow slab bridges are investigated in the field test using the surface damage and neural networks. A total of 13 hollow slab bridges in the Wu-He highway system were taken as the background bridge. The surface damage on the bridges was first checked in the visual inspection. A static load test was conducted to evaluate the transverse connectivity of the hinge joints based on the girder responses. The hollow slab bridges were then demolished, and each girder was cut into six segments to evaluate the durability of the concrete girders. An evaluation method based on the neutral networks and surface damage was finally proposed and verified by the field test data. The following conclusions can be drawn:
  • Visual inspection showed that there were two types of the typical defects in the hollow slab bridges, i.e., the transverse cracks on the bottom plates of the girders and the longitudinal cracks in the hinge joints. The transverse cracking mainly occurred in the mid-span of the bridges, while the distribution of the longitudinal cracks on the joints was quite uniform along the longitudinal location.
  • The static load test showed that the distribution of the deflection of each girder was non-uniform due to the weakening of the transverse connectivity, and the girder deflection increased with the increase of the joint damage. A damage index was proposed based on the theoretical and measured deflections, and the joint damage can be quantitatively assessed when the index value is larger than 0. The durability of the hollow slab girders was evaluated after cutting off the concrete girders. Results showed that the girders in the background bridges were within a moderate deterioration condition after 25 years’ service life.
  • An evaluation method of hollow slab girders based on the surface damage and neural networks was proposed and verified by the field test data. The maximum crack width at different locations of the bridge was used in the input layer of the neural network, and the hinge joint damage or the durability was considered as the output results. The prediction error of the method in the test set was within 15.0% for the hinge joint damage and within 40% for the durability result of the girder, indicating the feasibility of the evaluation method.

Author Contributions

Conceptualization, C.J. and W.X.; methodology, C.J.; software, Z.W.; validation, C.J., Z.W. and J.Y.; investigation, Z.W.; resources, J.Y.; data curation, Z.W.; writing—original draft preparation, C.J.; writing—review and editing, W.X. and C.C.; supervision, W.X. and C.C. All authors have read and agreed to the published version of the manuscript.

Funding

This research was funded by the National Science Foundation of China (grant numbers 52108271, 52022021, and 51978160); Key Research and Development Program of Jiangsu Province of China (grant number BE2021089); China Postdoctoral Science Foundation (grant number 2022T150119).

Institutional Review Board Statement

Not applicable.

Informed Consent Statement

Not applicable.

Data Availability Statement

Data available on request due to privacy/ethical restrictions.

Acknowledgments

The authors would like to thank the anonymous reviewers for their constructive suggestions and comments to improve the quality of the paper.

Conflicts of Interest

The authors declare no conflict of interest.

References

  1. He, Z.-Q.; Ma, Z.J.; Chapman, C.E.; Liu, Z. Longitudinal joints with accelerated construction features in decked bulb-tee girder bridges: Strut-and-tie model and design guidelines. J. Bridge Eng. 2013, 18, 372–379. [Google Scholar] [CrossRef]
  2. Hussein, H.H.; Sargand, S.M.; Khoury, I.; Al-Jhayyish, A.K. Environment-induced behavior of transverse tie bars in adjacent prestressed box-girder bridges with partial depth shear keys. J. Perform. Constr. Facil. 2017, 31, 04017074. [Google Scholar] [CrossRef]
  3. Zhao, Y.; Cao, X.; Zhou, Y.; Wang, G.; Tian, R. Lateral load distribution for hollow slab bridge: Field test investigation. Int. J. Concr. Struct. Mater. 2020, 14, 22. [Google Scholar] [CrossRef]
  4. Wang, J.; Chen, C.; Xiang, H.; Fan, X. Performance of the transverse connectivity in simply supported girder bridges and its strengthening strategy. J. Perform. Constr. Facil. 2017, 31, 04017081. [Google Scholar] [CrossRef]
  5. Dan, D.; Zhao, Y.; Wen, X.; Jia, P. Evaluation of lateral cooperative working performance of assembled beam bridge based on the index of strain correlation coefficient. Adv. Struct. Eng. 2019, 22, 1062–1072. [Google Scholar] [CrossRef]
  6. Estes, A.C.; Frangopol, D.M. Updating bridge reliability based on bridge management systems visual inspection results. J. Bridge Eng. 2003, 8, 374–382. [Google Scholar] [CrossRef] [Green Version]
  7. Bertola, N.J.; Brühwiler, E. Risk-based methodology to assess bridge condition based on visual inspection. Struct. Infrastruct. Eng. 2023, 19, 575–588. [Google Scholar] [CrossRef]
  8. Bah, A.S.; Sanchez, T.; Zhang, Y.; Sasai, K.; Conciatori, D.; Chouinard, L.; Power, G.J.; Zufferey, N. Assessing the condition state of a concrete bridge combining visual inspection and nonlinear deterioration model. Struct. Infrastruct. Eng. 2022, 1–16. [Google Scholar] [CrossRef]
  9. Hu, H.; Wang, J.; Dong, C.-Z.; Chen, J.; Wang, T. A hybrid method for damage detection and condition assessment of hinge joints in hollow slab bridges using physical models and vision-based measurements. Mech. Syst. Signal Process. 2023, 183, 109631. [Google Scholar] [CrossRef]
  10. Abdallah, A.M.; Atadero, R.A.; Ozbek, M.E. A state-of-the-art review of bridge inspection planning: Current situation and future needs. J. Bridge Eng. 2022, 27, 03121001. [Google Scholar] [CrossRef]
  11. Rehman, S.K.U.; Ibrahim, Z.; Memon, S.A.; Jameel, M. Nondestructive test methods for concrete bridges: A review. Constr. Build. Mater. 2016, 107, 58–86. [Google Scholar] [CrossRef] [Green Version]
  12. Barbieri, D.M.; Chen, Y.; Mazzarolo, E.; Briseghella, B.; Tarantino, A.M. Longitudinal joint performance of a concrete hollow core slab bridge. Transp. Res. Rec. 2018, 2672, 196–206. [Google Scholar] [CrossRef]
  13. Zhang, J.; Yi, T.-H.; Qu, C.-X.; Li, H.-N. Determining orders of modes sensitive to hinge joint damage in assembled hollow slab bridges. J. Bridge Eng. 2022, 27, 04022001. [Google Scholar] [CrossRef]
  14. Zhan, J.; Zhang, F.; Siahkouhi, M.; Kong, X.; Xia, H. A damage identification method for connections of adjacent box-beam bridges using vehicle–bridge interaction analysis and model updating. Eng. Struct. 2021, 228, 111551. [Google Scholar] [CrossRef]
  15. Li, Q.-F.; Yu, Y.-Q. Durability Evaluation of Concrete Bridges Based on the Theory of Matter Element Extension—Entropy Weight Method—Unascertained Measure. Math. Prob. Eng. 2021, 2021, 2646723. [Google Scholar] [CrossRef]
  16. Cattan, J.; Mohammadi, J. Analysis of bridge condition rating data using neural networks. Comput.-Aided Civ. Infrastruct. Eng. 1997, 12, 419–429. [Google Scholar] [CrossRef]
  17. Weinstein, J.C.; Sanayei, M.; Brenner, B.R. Bridge damage identification using artificial neural networks. J. Bridge Eng. 2018, 23, 04018084. [Google Scholar] [CrossRef] [Green Version]
  18. Liu, H.; Liu, J.; Wang, Y.; Xia, Y.; Guo, Z. Identification of grouting compactness in bridge bellows based on the BP neural network. Structures 2021, 32, 817–826. [Google Scholar] [CrossRef]
  19. Xia, Y.; Lei, X.; Wang, P.; Sun, L. A data-driven approach for regional bridge condition assessment using inspection reports. Struct. Control Health Monit. 2022, 29, e2915. [Google Scholar] [CrossRef]
  20. Miao, P.; Yokota, H.; Zhang, Y. Deterioration prediction of existing concrete bridges using a LSTM recurrent neural network. Struct. Infrastruct. Eng. 2023, 19, 475–489. [Google Scholar] [CrossRef]
  21. JTG H11-2015; Code for Maintenance of Highway Bridges and Culverts. Ministry of Housing and Urban-Rural Development of the PRC: Beijing, China, 2015.
  22. GB 50010-2010; Code for Design of Concrete Structures. Architecture and Building Press: Beijing, China, 2010.
  23. Ahmed, F.; Kilic, K. Fuzzy Analytic Hierarchy Process: A performance analysis of various algorithms. Fuzzy Sets Syst. 2019, 362, 110–128. [Google Scholar] [CrossRef]
  24. Saaty, T.L. The Analytic Process: Planning, Priority Setting, Resources Allocation; McGraw: New York, NY, USA, 1980. [Google Scholar]
  25. Das Khan, S.; Datta, A.K.; Topdar, P.; Sagi, S.R. A cause-based defect ranking approach for existing concrete bridges using Analytic Hierarchy Process and fuzzy-TOPSIS. Struct. Infrastruct. Eng. 2022, 1–13. [Google Scholar] [CrossRef]
  26. Sadeghi, B. A BP-neural network predictor model for plastic injection molding process. J. Mater. Process. Technol. 2000, 103, 411–416. [Google Scholar] [CrossRef]
  27. Shen, W.; Li, G.; Wei, X.; Fu, Q.; Zhang, Y.; Qu, T.; Chen, C.; Wang, R. Assessment of dairy cow feed intake based on BP neural network with polynomial decay learning rate. Inf. Process. Agric. 2022, 9, 266–275. [Google Scholar] [CrossRef]
  28. Faghihinejad, F.; Mohammadi Fard, M.; Roshanghalb, A.; Beigi, P. A framework to assess the correlation between transportation infrastructure access and economics: Evidence from Iran. Math. Prob. Eng. 2022, 2022, 8781686. [Google Scholar] [CrossRef]
  29. Rajabi, M.; Habibpour, M.; Bakhtiari, S.; Rad, F.; Aghakhani, S. The development of BPR models in smart cities using loop detectors and license plate recognition technologies: A case study. J. Future Sustain. 2023, 3, 75–84. [Google Scholar] [CrossRef]
  30. Duan, P.; Soleimani, H.; Ghazanfari, A.; Dehghani, M. Distributed energy management in smart grids based on cloud-fog layer architecture considering PHEVs. IEEE Trans. Ind. Appl. 2020, 1. [Google Scholar] [CrossRef]
  31. Majdzadeh, M.A.; Ghazanfari, A.; Ara, M.M. Determinants of private investment in Iran based on Bayesian Model Averaging. Int. J. Acad. Res. Bus. Soc. Sci. 2014, 4, 229. [Google Scholar] [CrossRef]
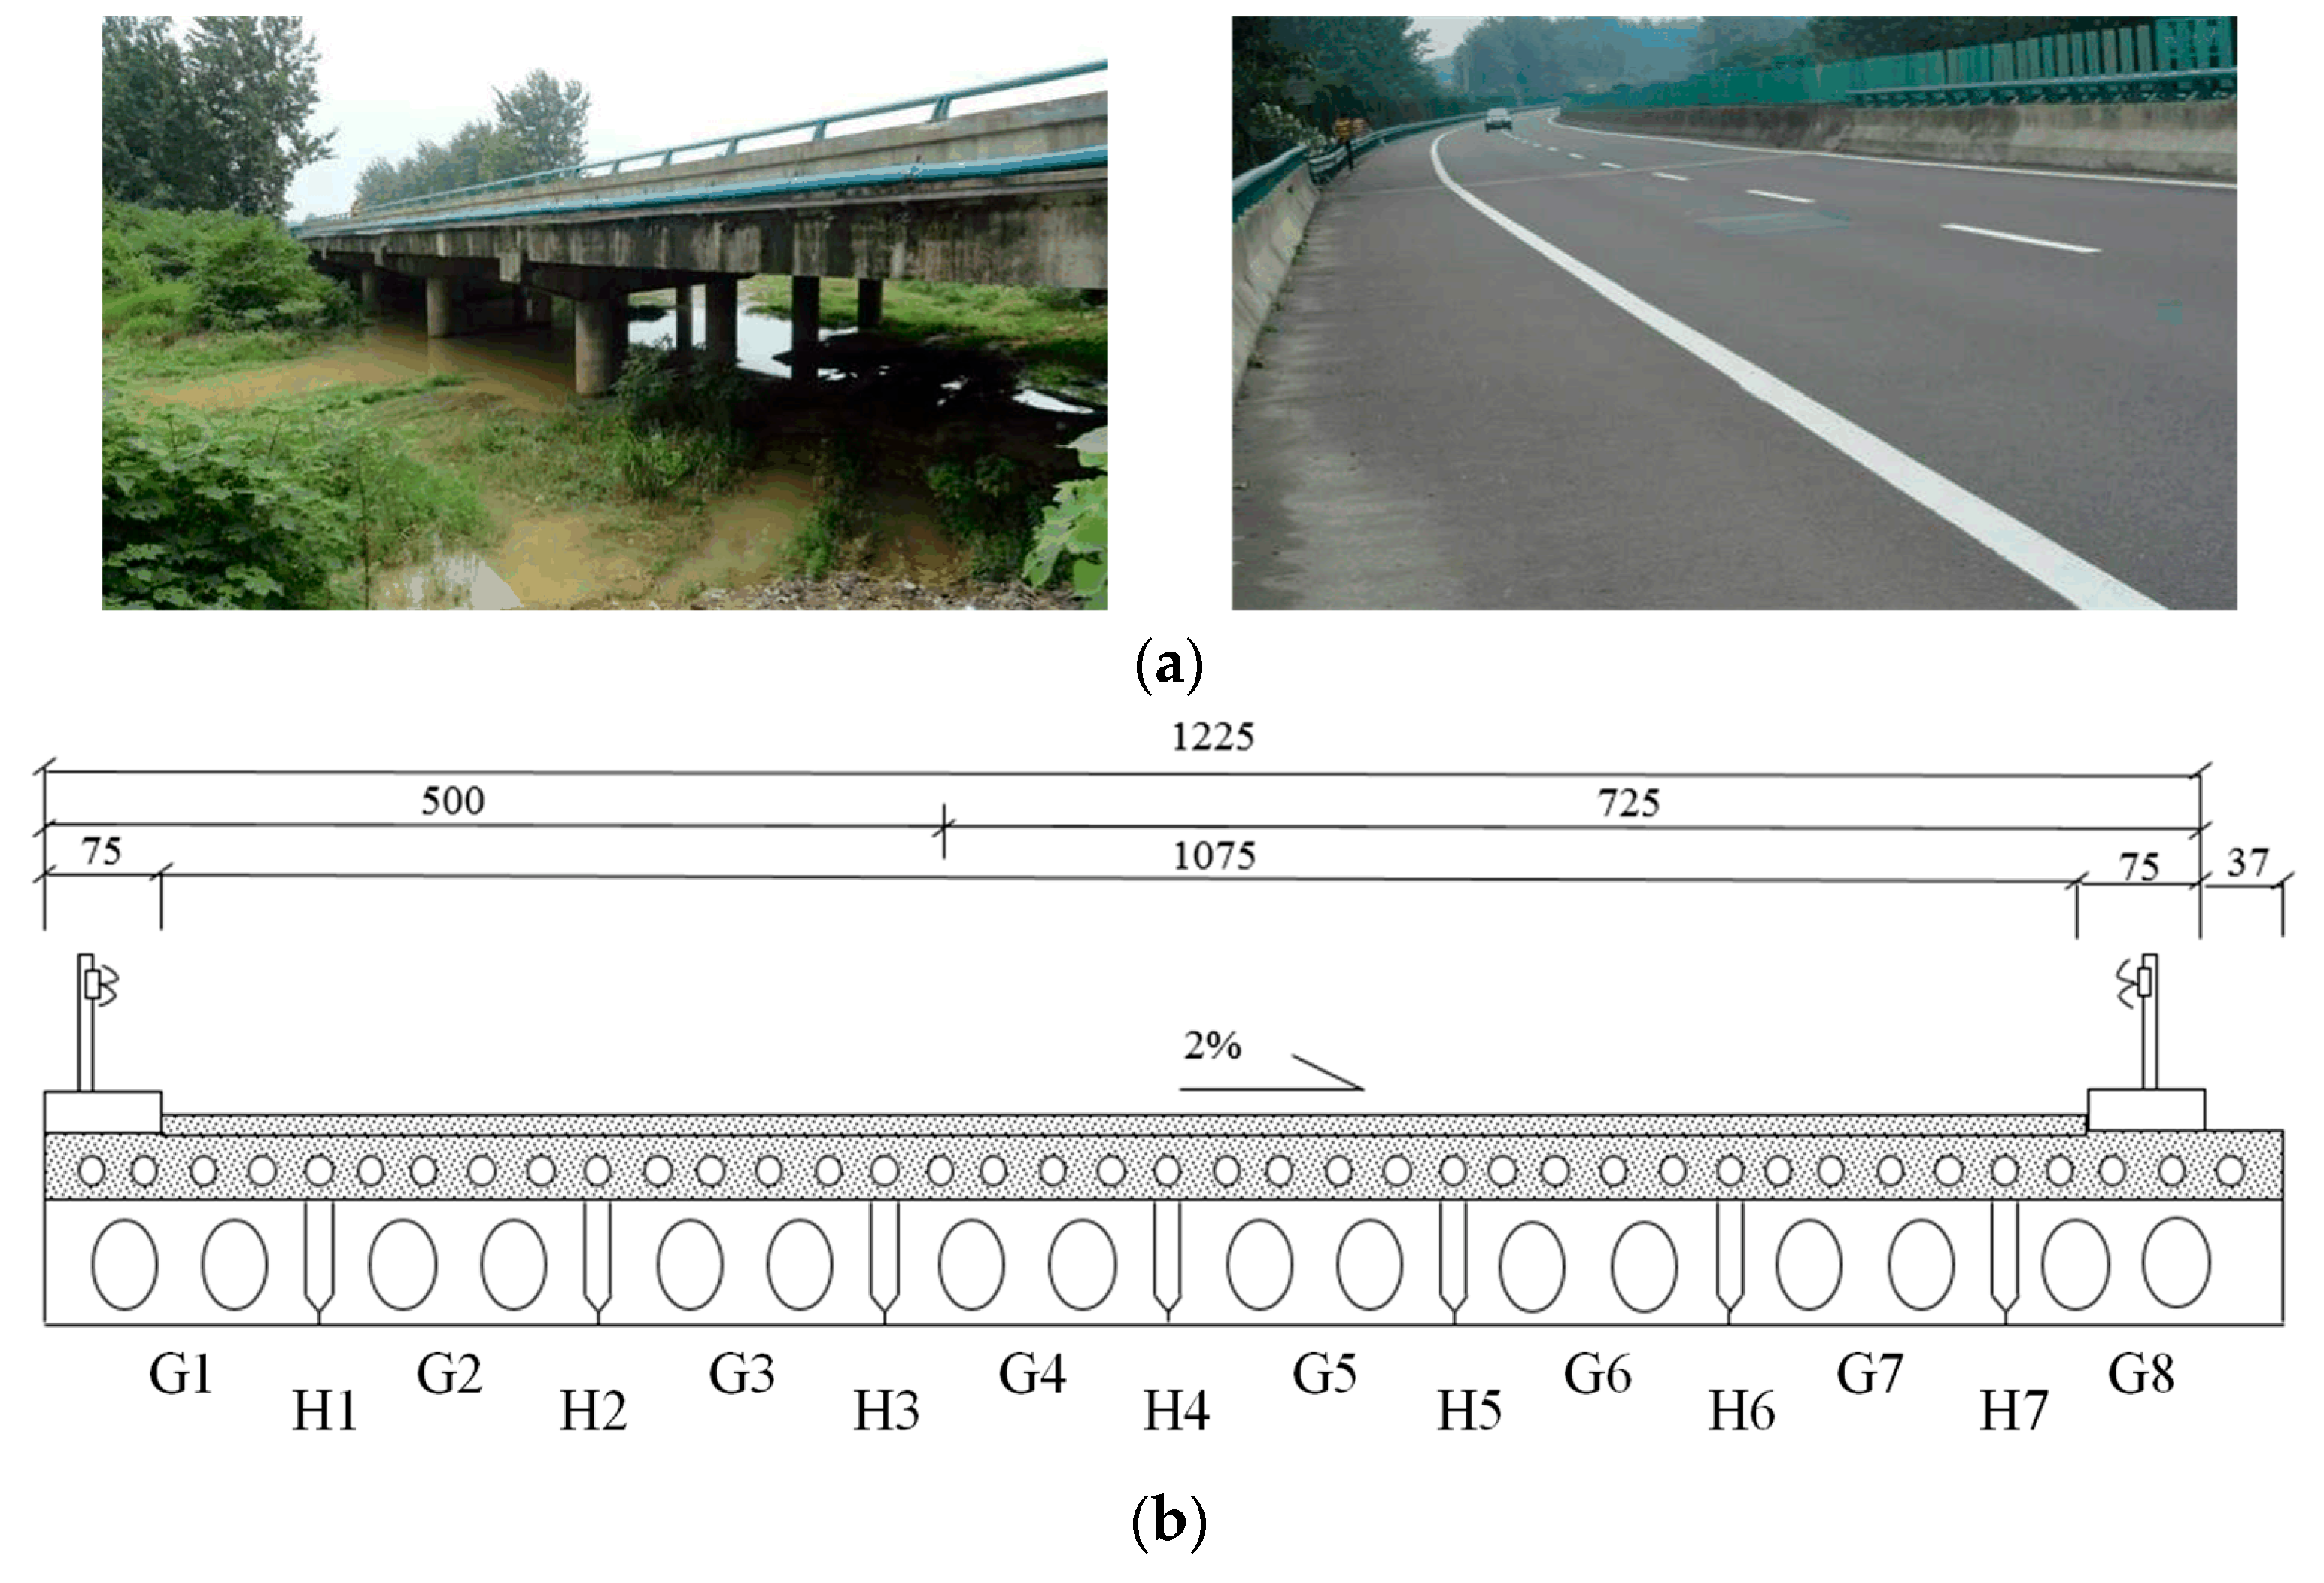
Figure 1. Hollow slab bridge in Wu-He highway system: (a) an overview; (b) cross-section.
Applsci 13 04851 g001
Figure 2. Layout of the load test: (a) truck load; (b) measuring point.
Applsci 13 04851 g002
Figure 3. Measurement based on the gauges and leveling instrument: (a) diagram; (b) installation of measuring rulers.
Applsci 13 04851 g003
Figure 4. Process of cutting the concrete girders: (a) plan for cutting girders; (b) cutting test.
Applsci 13 04851 g004aApplsci 13 04851 g004b
Figure 5. Girder segments.
Applsci 13 04851 g005
Figure 6. Diagram of indicators u2, u4, and u6.
Applsci 13 04851 g006
Figure 7. Main defects in the visual inspection.
Applsci 13 04851 g007
Figure 8. FE model.
Figure 8. FE model.
Applsci 13 04851 g008
Figure 9. Mid-span deflection of each girder.
Applsci 13 04851 g009
Figure 10. Hinge joint: (a) relative displacement; (b) damage index µ.
Applsci 13 04851 g010
Figure 11. Surface damage of the joints.
Applsci 13 04851 g011
Figure 12. Hierarchical structure of the durability evaluation.
Applsci 13 04851 g012
Figure 13. Membership function in the fuzzy mapping.
Applsci 13 04851 g013
Figure 14. Pairwise comparison matrix.
Applsci 13 04851 g014
Figure 15. Durability of the hollow slab girder segments.
Applsci 13 04851 g015
Figure 16. Backpropagation network.
Applsci 13 04851 g016
Figure 17. Mse of the training set in the training phase.
Applsci 13 04851 g017
Figure 18. Predictions and test results: (a) hinge joint damage; (b) durability of the girder.
Applsci 13 04851 g018
Table 1. Information of the investigated hollow slab bridges.
No.Span
Arrangement
Girder
Number
No.Span
Arrangement
Girder
Number
12 × 16 m683 × 20 m10
22 × 16 m492 × 16 m8
32 × 16 m4101 × 16 m13
44 × 16 m8111 × 16 m8
53 × 13 m81210 × 22 m12
63 × 16 m8132 × 16 m8
72 × 13 m8
Table 2. Classification of bridge condition state.
GradeDescription
AIntact or good condition
BMild deterioration
CModerate deterioration
DSevere deterioration
EIn danger
Table 3. Evaluation criteria of the surface cracks.
ParameterCriteria Description GradeValue
Crack width
(mm)
≤0.051D1
0.05 to 0.12
0.1 to 0.153
>0.154
Crack length
(m)
≤0.11D2
0.1 to 0.22
0.2 to 0.33
0.3 to 0.44
0.4 to 0.55
0.5 to 0.66
>0.67
Crack locationAuxiliary components0D3
Secondary components1
Main components2
Crack growth rateNone−1D4
Small0
Large+1
Da = (D1 + D2 + D3 + D4)/140 to 0.2A
0.2 to 0.4B
0.4 to 0.6C
0.6 to 0.8D
0.8 to 1.0E
Table 4. Evaluation criteria based on the different parameters.
ParameterGrade
ABCDE
Db≥0.950.90 to 0.950.80 to 0.900.70 to 0.80<0.70
Dc≥0.980.95 to 0.980.90 to 0.950.80 to 0.90<0.80
Dd≥0.950.85 to 0.950.70 to 0.850.55 to 0.70<0.55
De≥0.800.60 to 0.800.40 to 0.600.20 to 0.40<0.20
Table 5. Surface damage at different components.
ComponentDefectNumberTotalProportion (%)
Single girderTransverse crack on the bottom plates31336885.1
Rebar corrosion277.3
Concrete spalling184.9
Longitudinal crack on the bottom plates102.7
Hinge jointLongitudinal crack25631481.5
Rebar corrosion309.6
Transverse crack216.7
Seepage72.2
Total 682682
Table 6. Location distribution of the main defects.
Transverse Cracks on the
Bottom Plates
Longitudinal Cracks on the Hinge Joints
Longitudinal LocationNumberProportion (%)NumberProportion (%)
0–1/8 span175.43112.1
1/8 span–3/8 span6119.52610.2
3/8 span–5/8 span22070.34718.4
5/8 span–7/8 span103.23614.1
7/8 span–1 span51.6218.2
Through crack00.09537.1
Total313 256100
Table 7. Dimension of the cracks.
Transverse Cracks on the Bottom PlatesLongitudinal Cracks on the Hinge Joints
Length/cmNumberProportion (%)Length/cmNumberProportion (%)
0–93511.20–104718.4
10–1911737.410–503011.7
20–297724.650–100176.6
30–394815.3100–150218.2
40–493210.2Through9537.1
>5041.3150–10004618.0
Total313100Total256100
Width/mmNumberProportion (%)Width/mmNumberProportion (%)
0–0.1227.00–29637.5
0.1–0.215950.82–48633.6
0.2–0.37624.34–63413.3
0.3–0.4206.46–8145.5
0.4–0.5175.48–10124.7
>0.5196.1>10145.5
Total313100Total256100
Table 8. Appraisal grade of the indicators in S2-G4.
IndicatorGirder Segment
S2-G4-1S2-G4-2S2-G4-3S2-G4-4S2-G4-5
Transverse crackACBDC
Longitudinal crackAAAAA
Concrete strengthDBCCA
Corrosion degree of rebarsAABBB
Reinforcement protective layer thicknessBCCDC
Grout conditionAAAAA
Disclaimer/Publisher’s Note: The statements, opinions and data contained in all publications are solely those of the individual author(s) and contributor(s) and not of MDPI and/or the editor(s). MDPI and/or the editor(s) disclaim responsibility for any injury to people or property resulting from any ideas, methods, instructions or products referred to in the content.