
Transverse Connectivity and Durability Evaluation of Hollow Slab Bridges Using Surface Damage and Neural Networks: Field Test Investigation


Abstract
:1. Introduction
2. Field Test
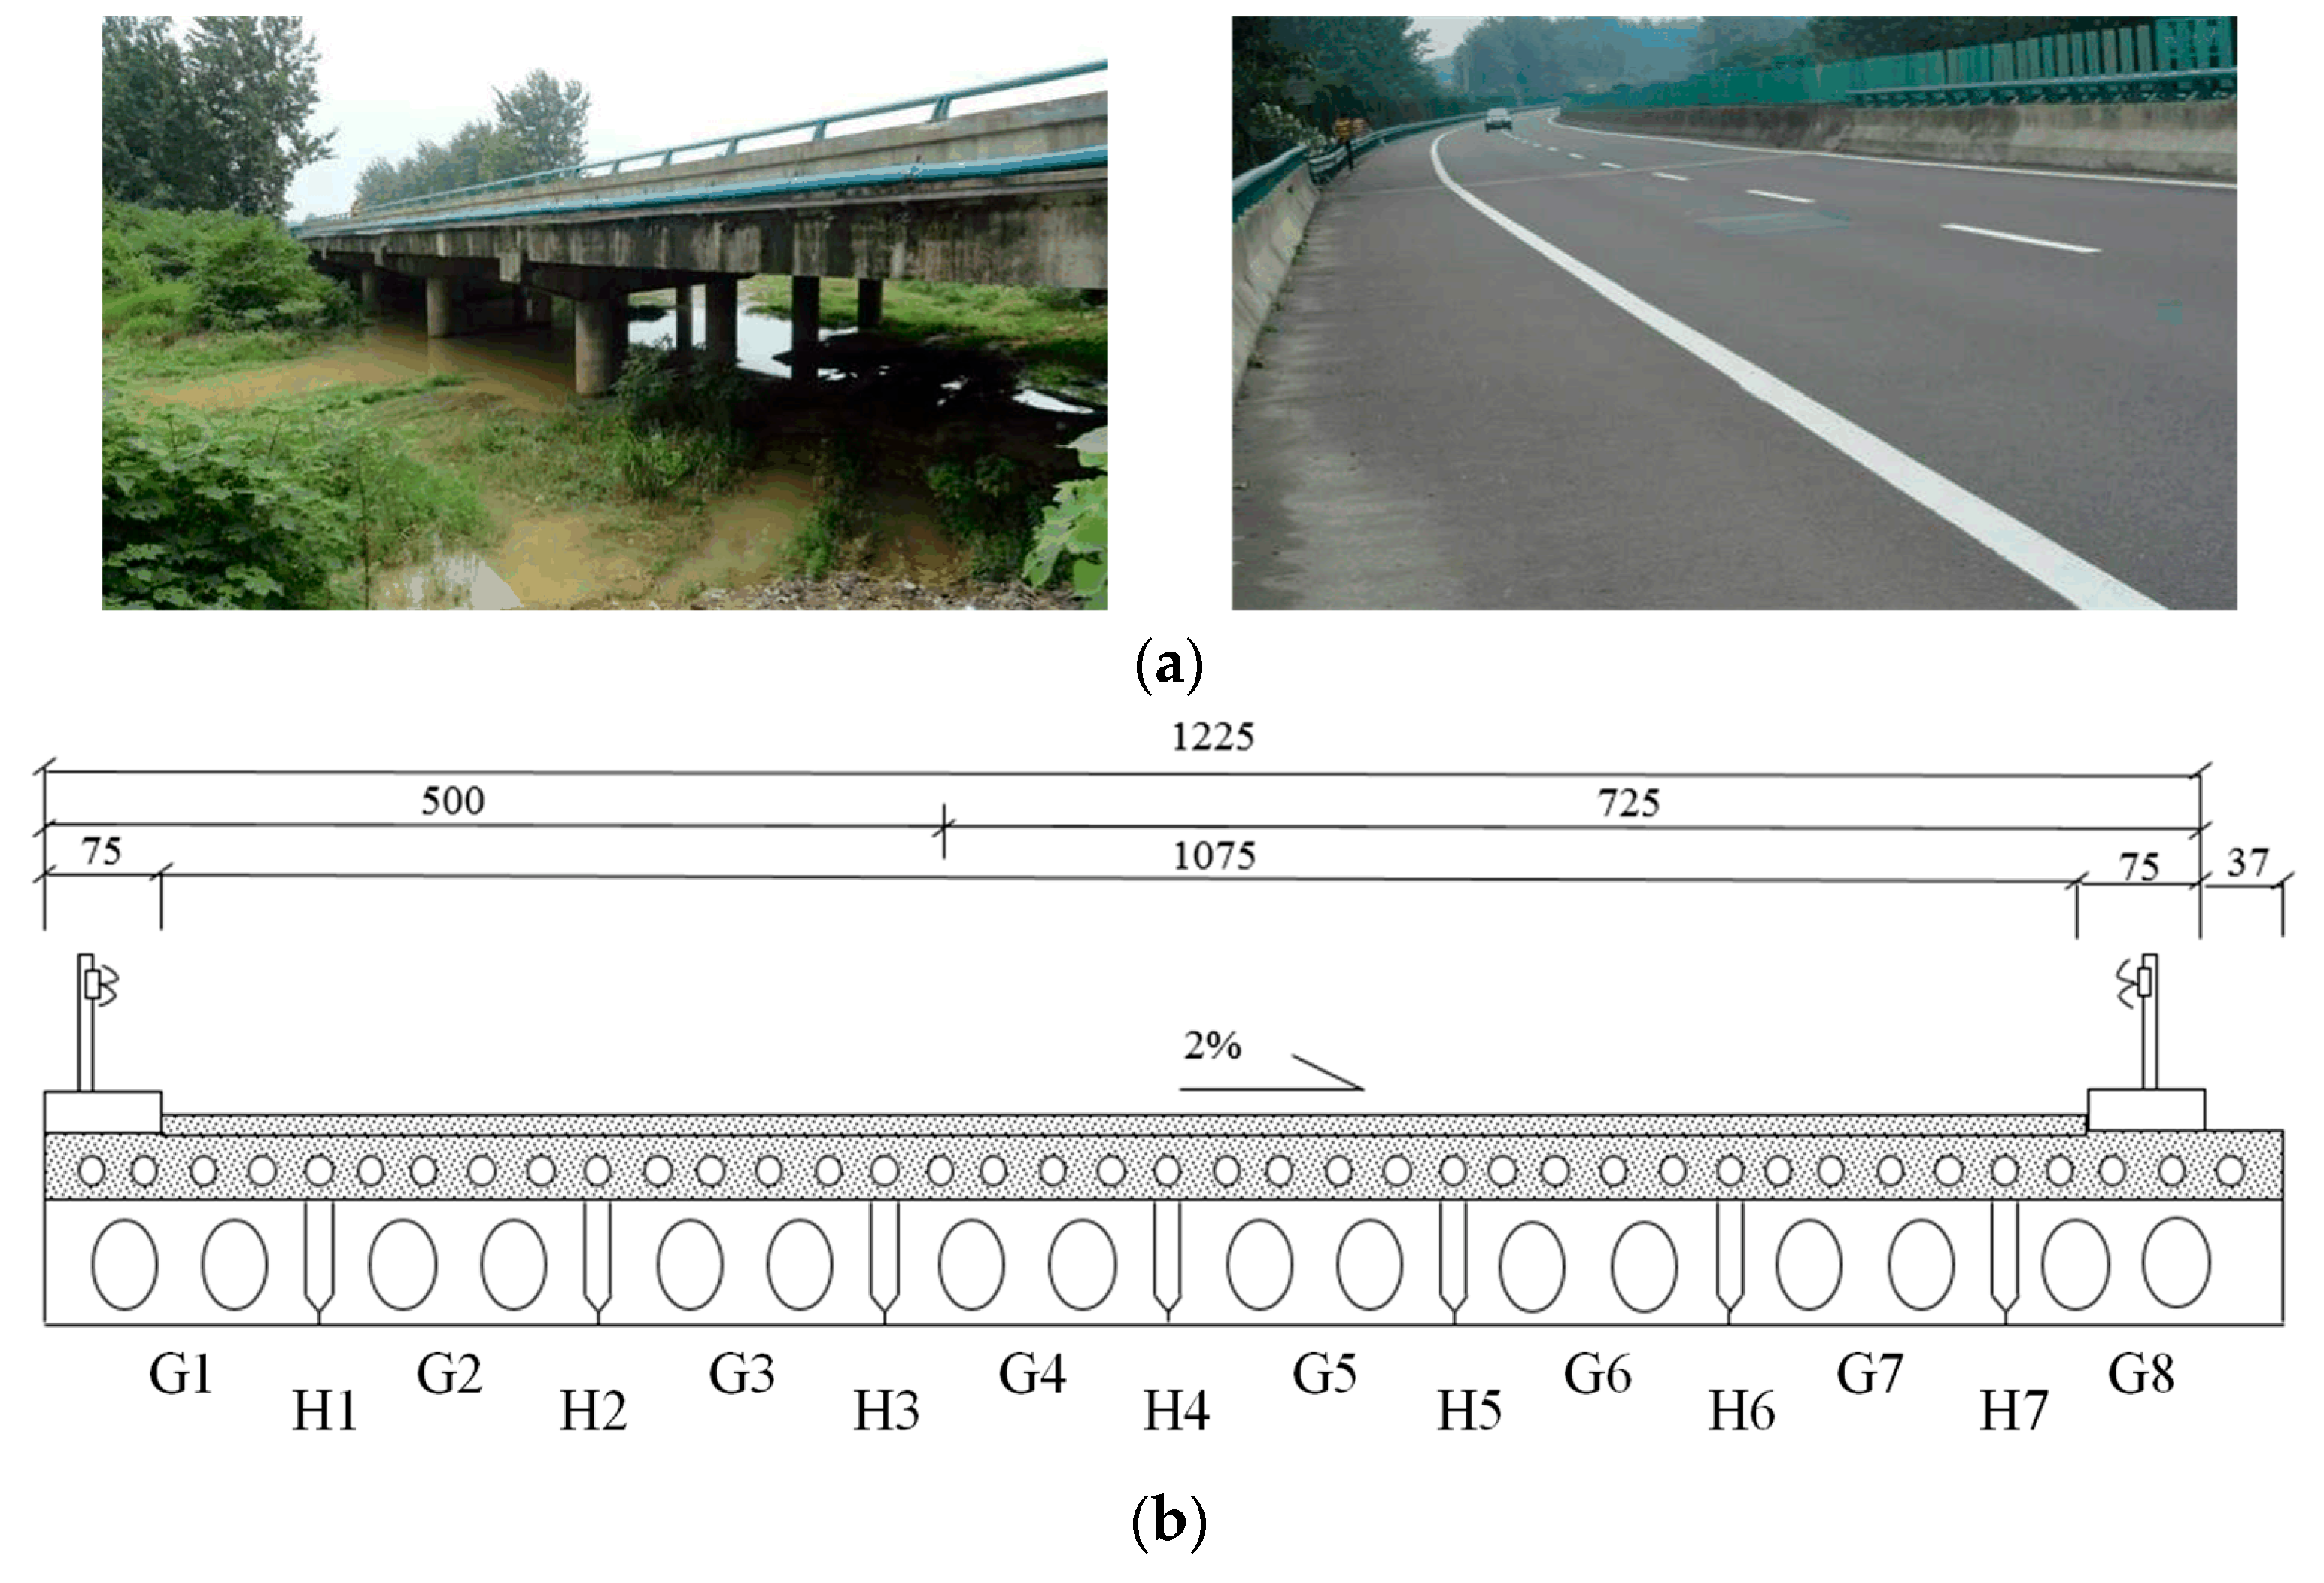
2.1. Background Bridges
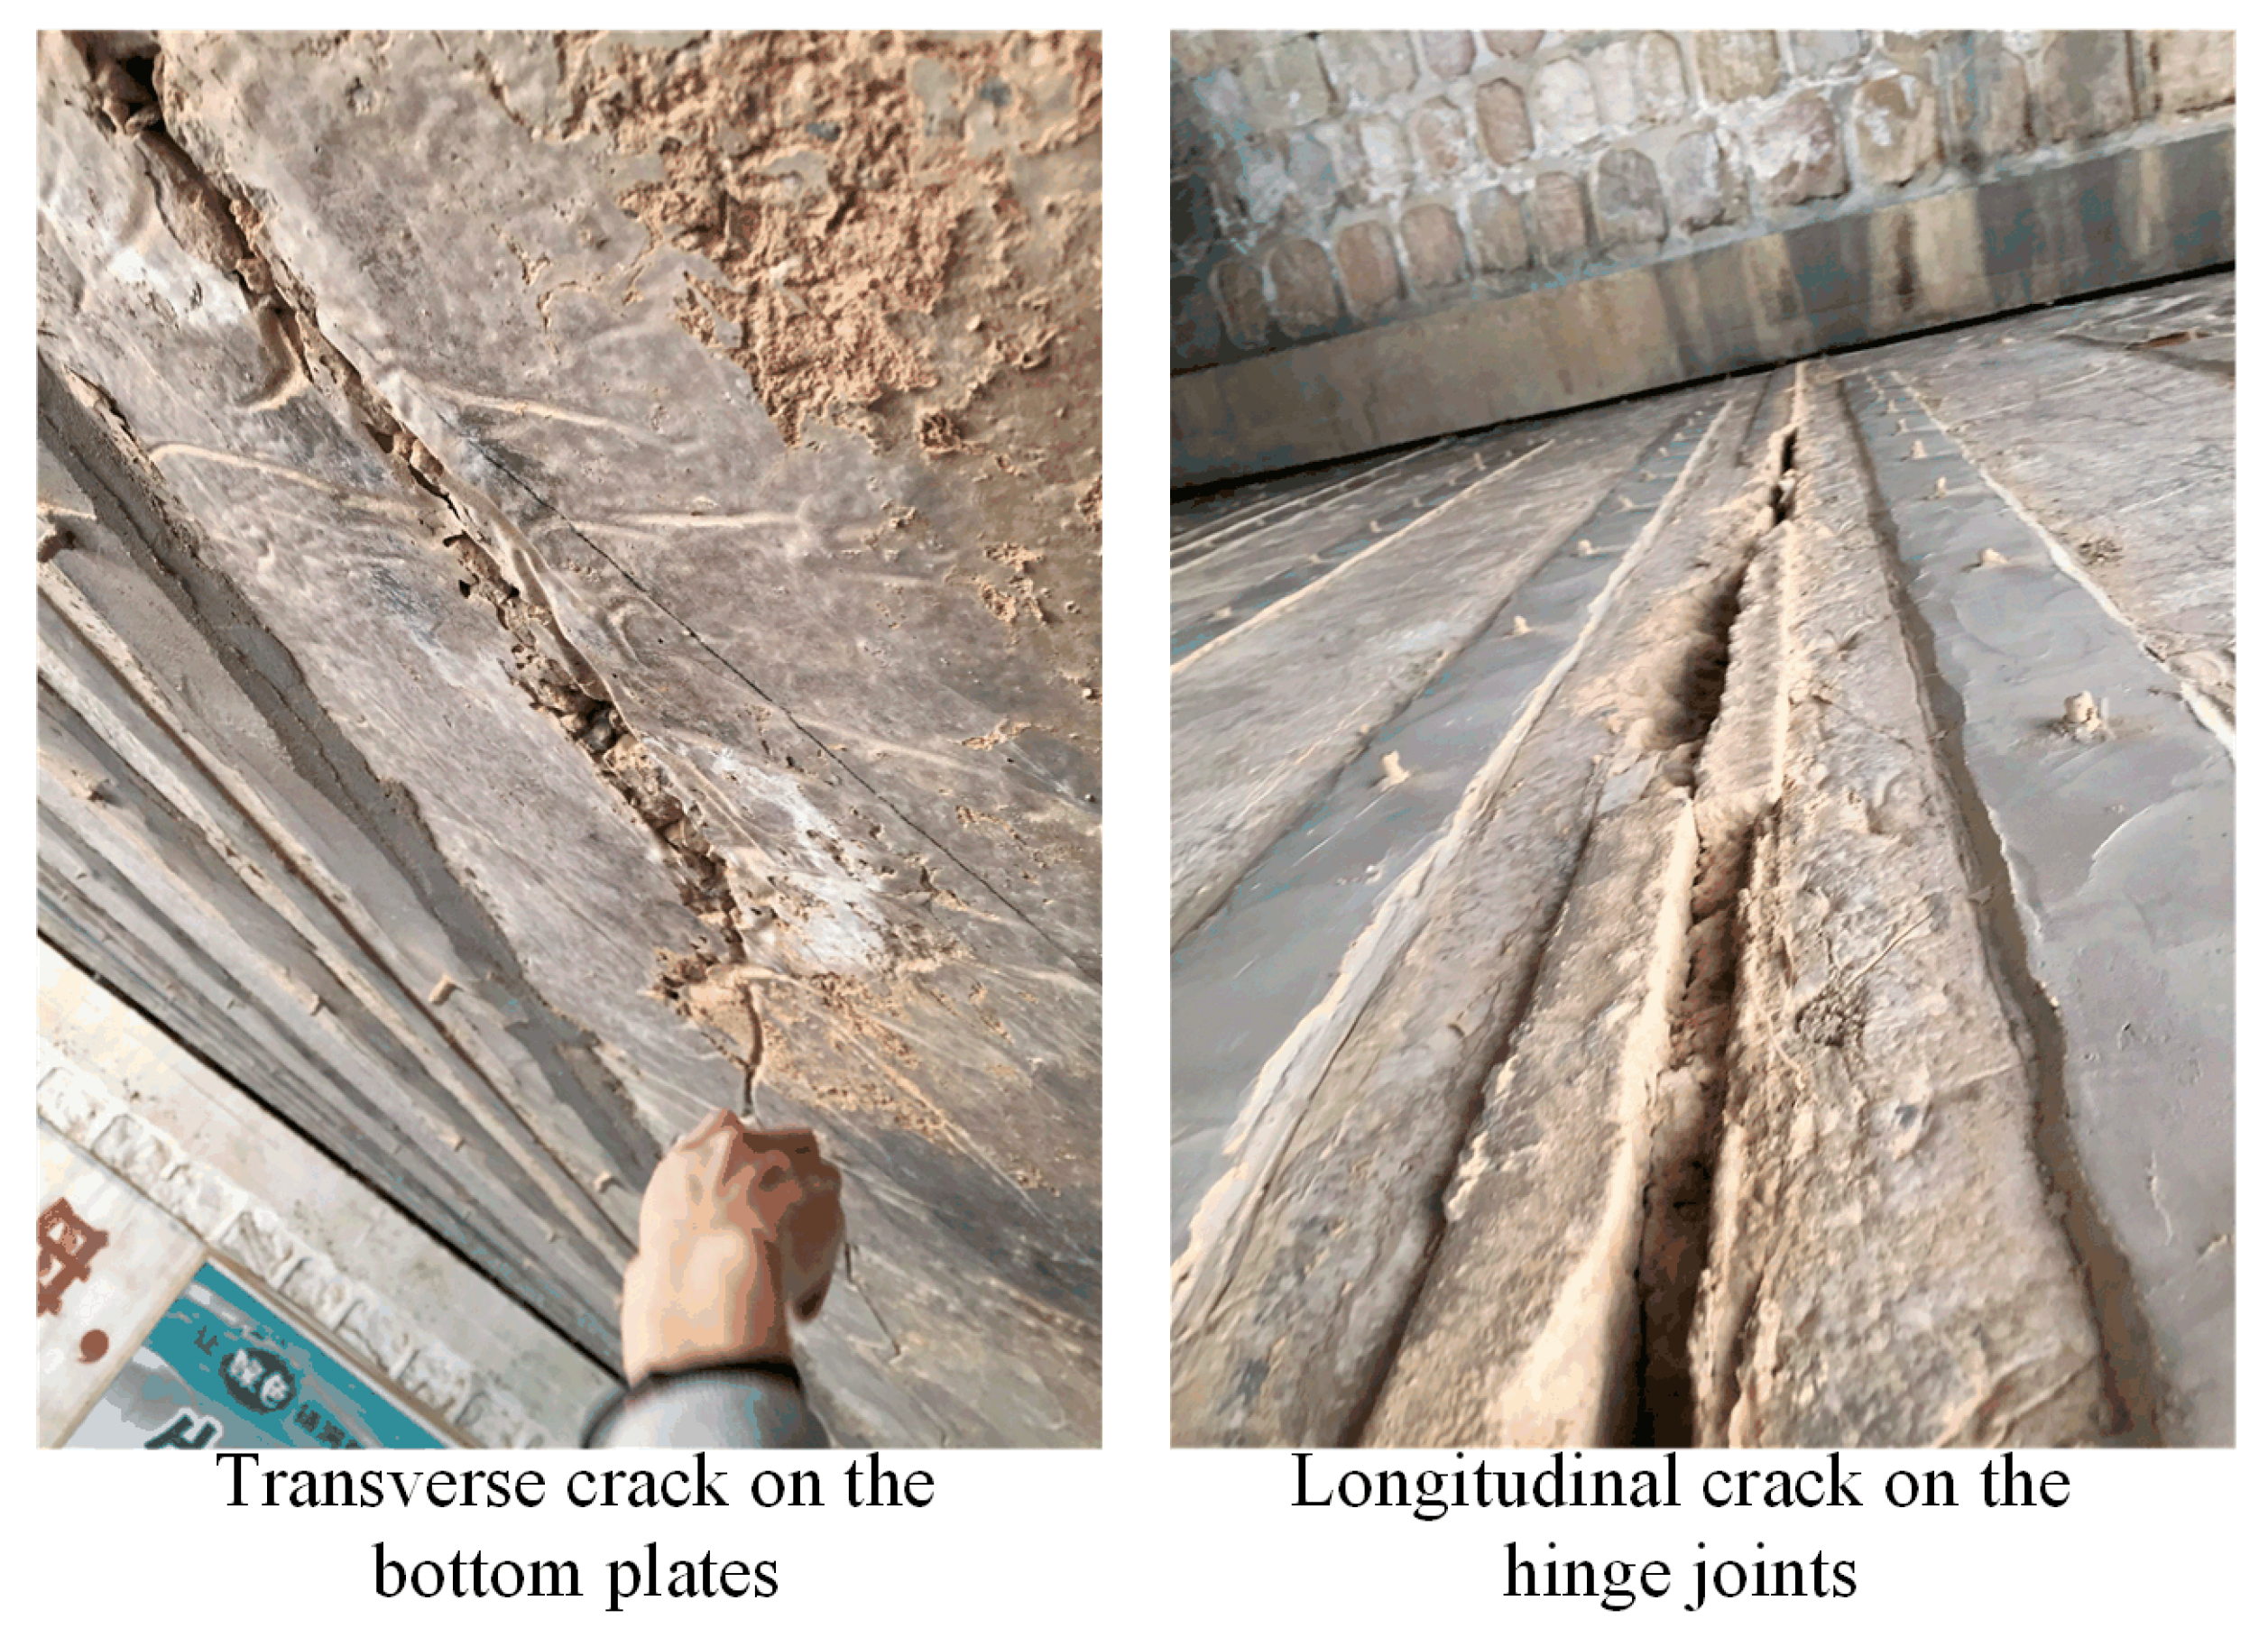
2.2. Visual Inspection
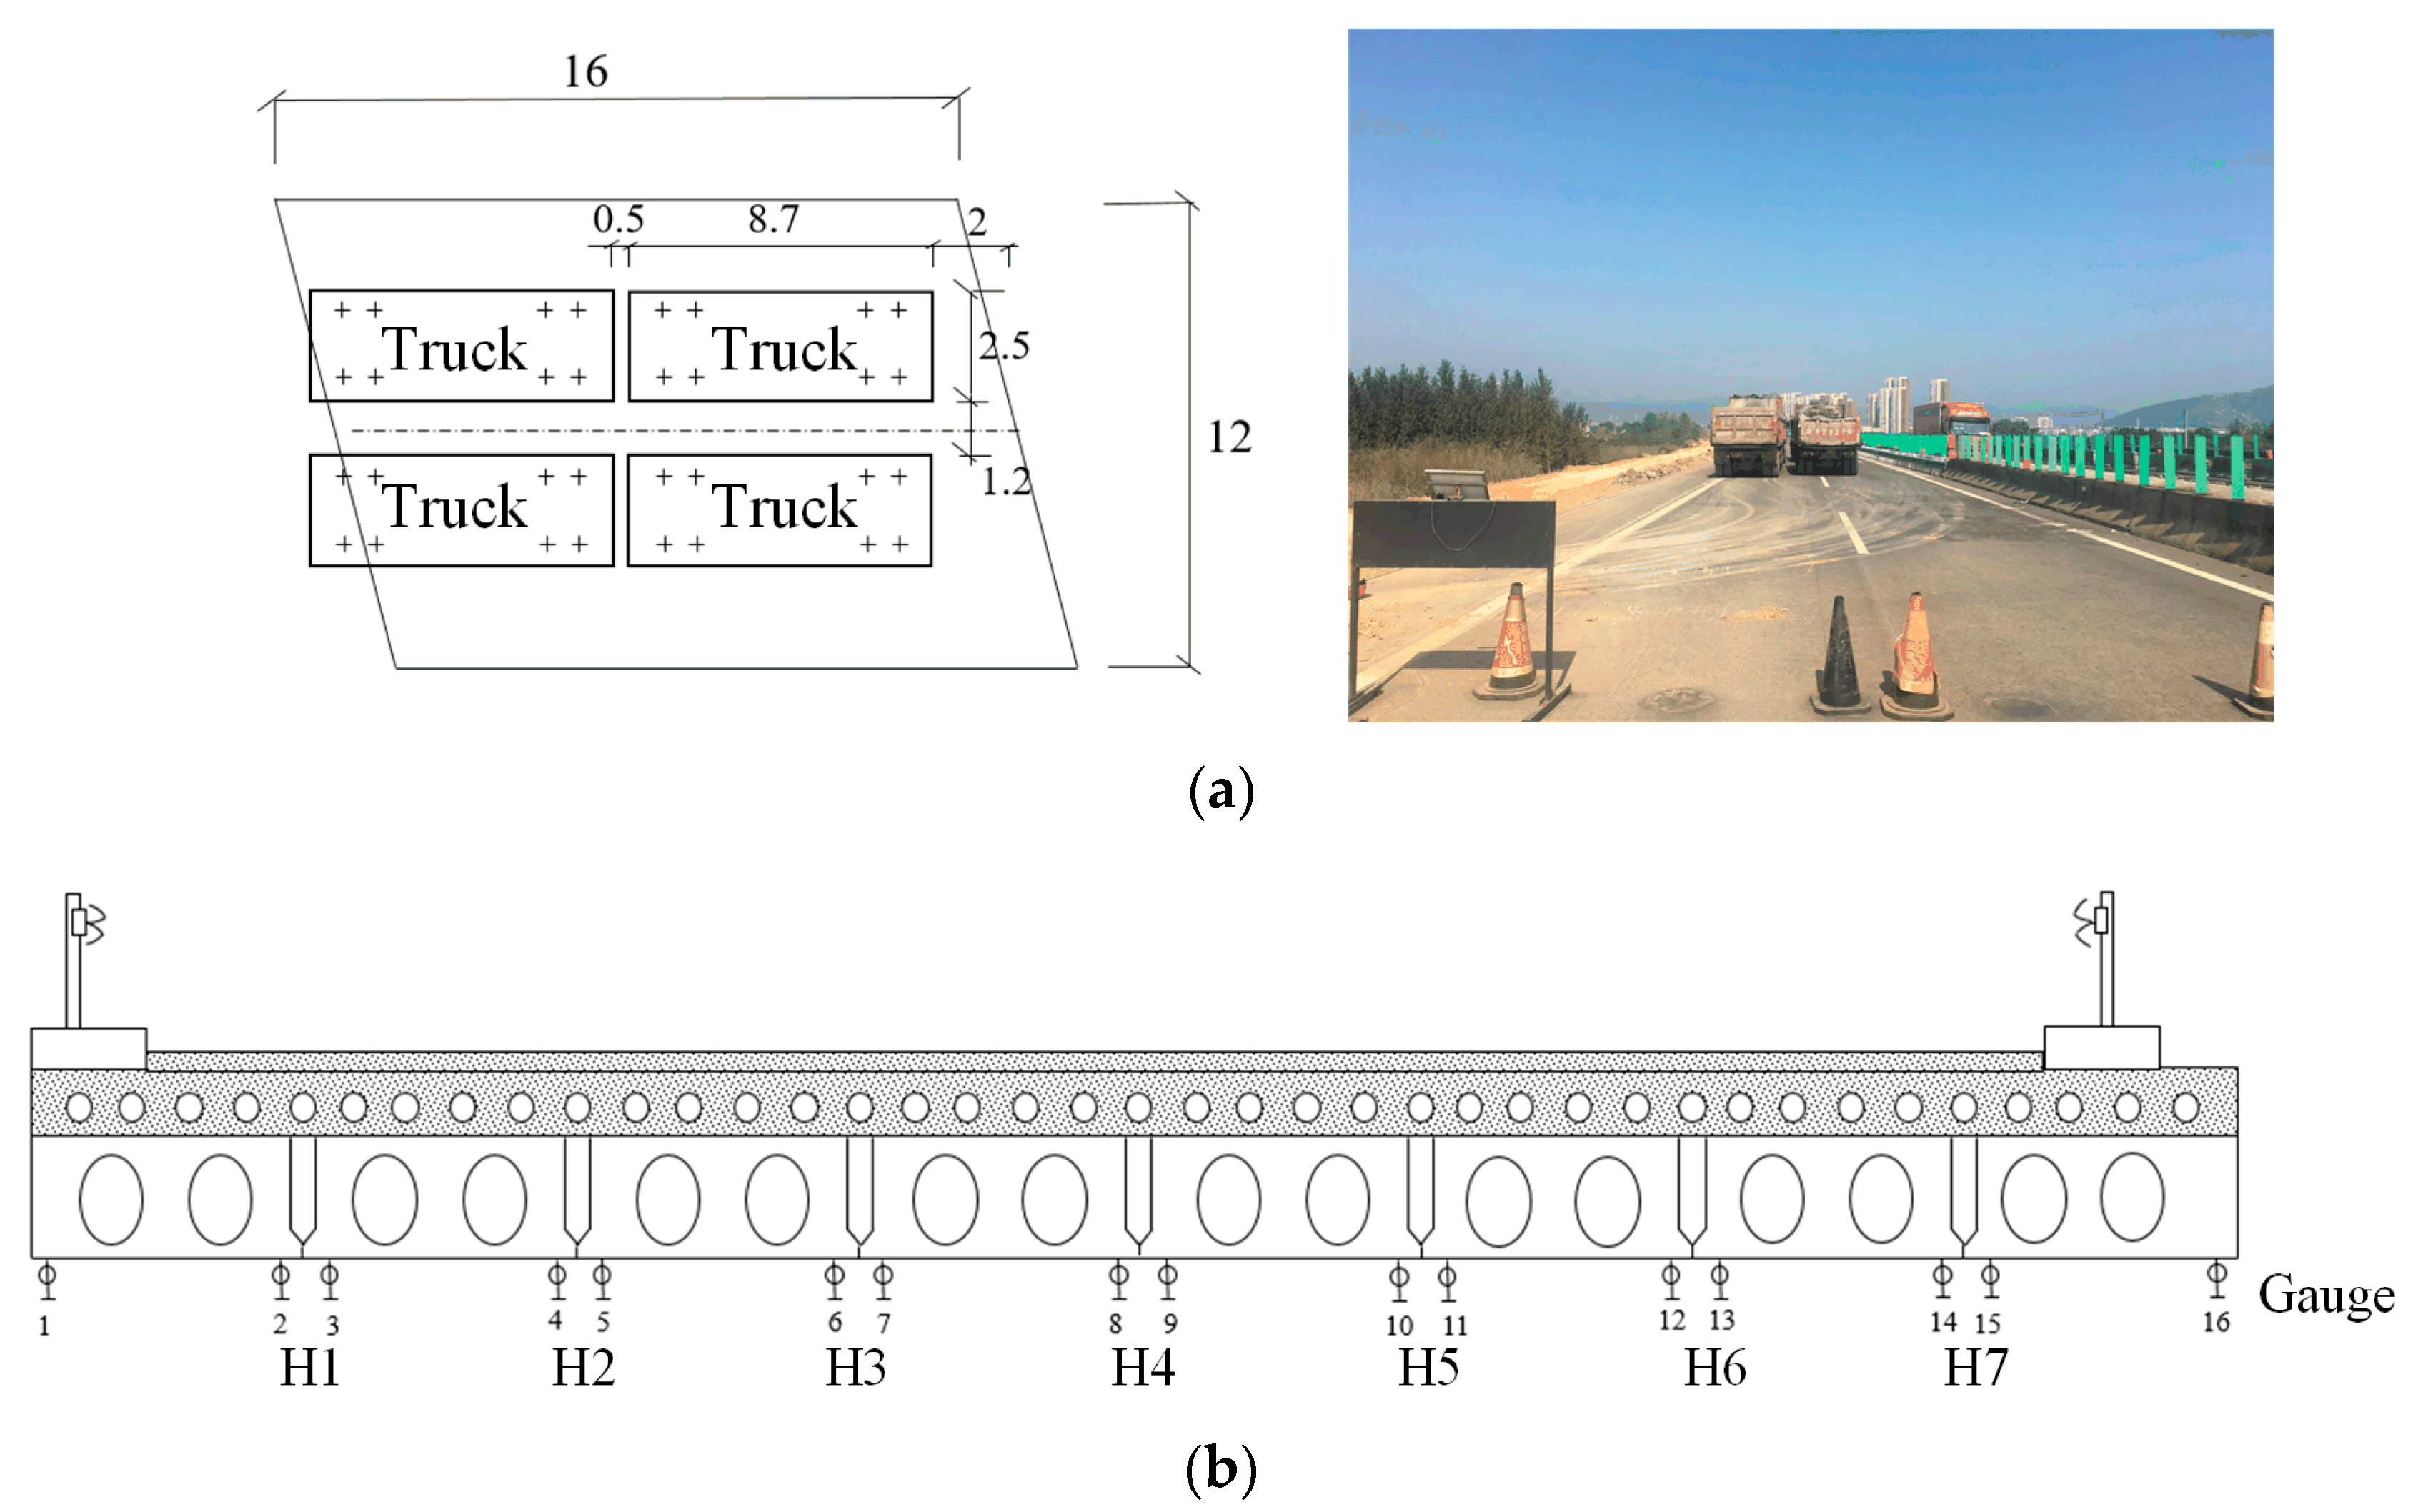
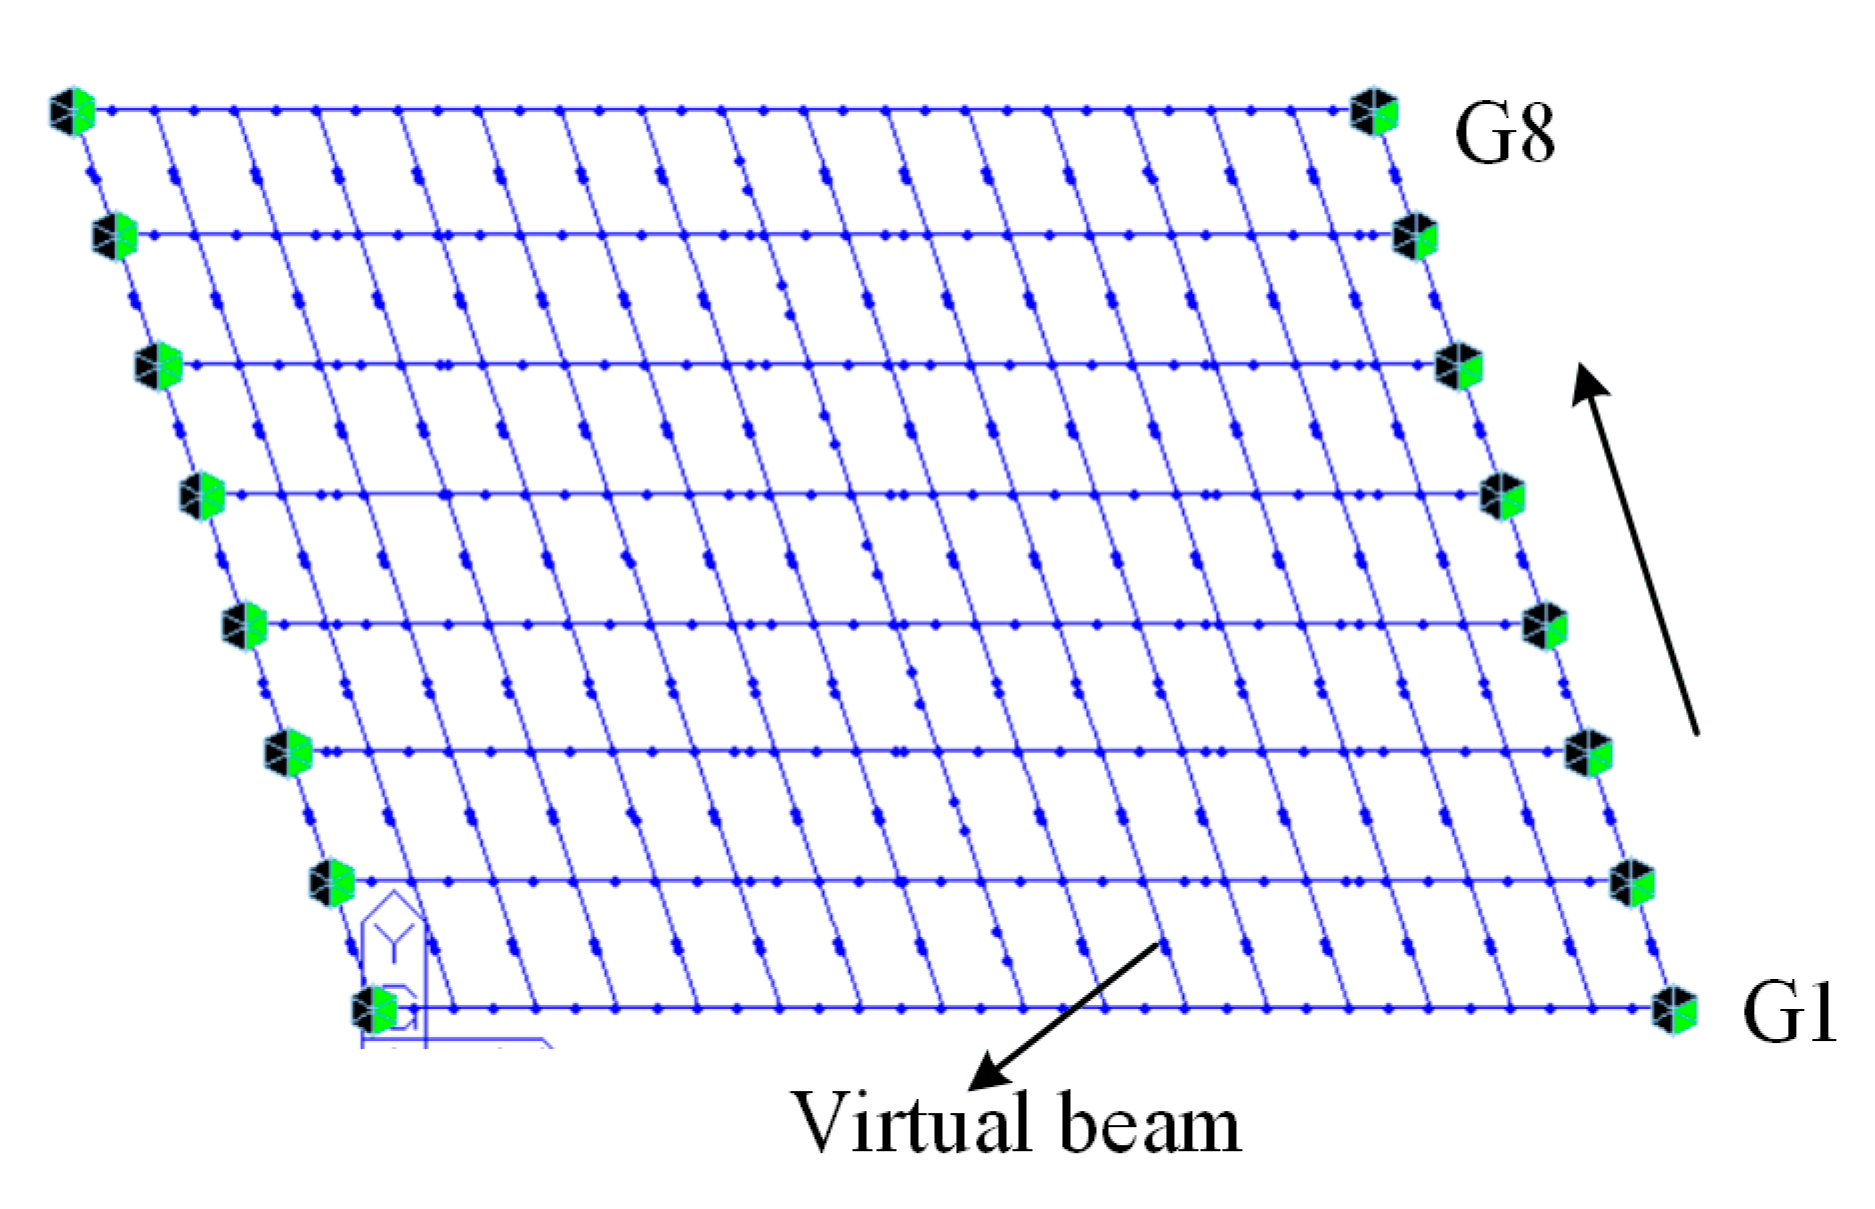
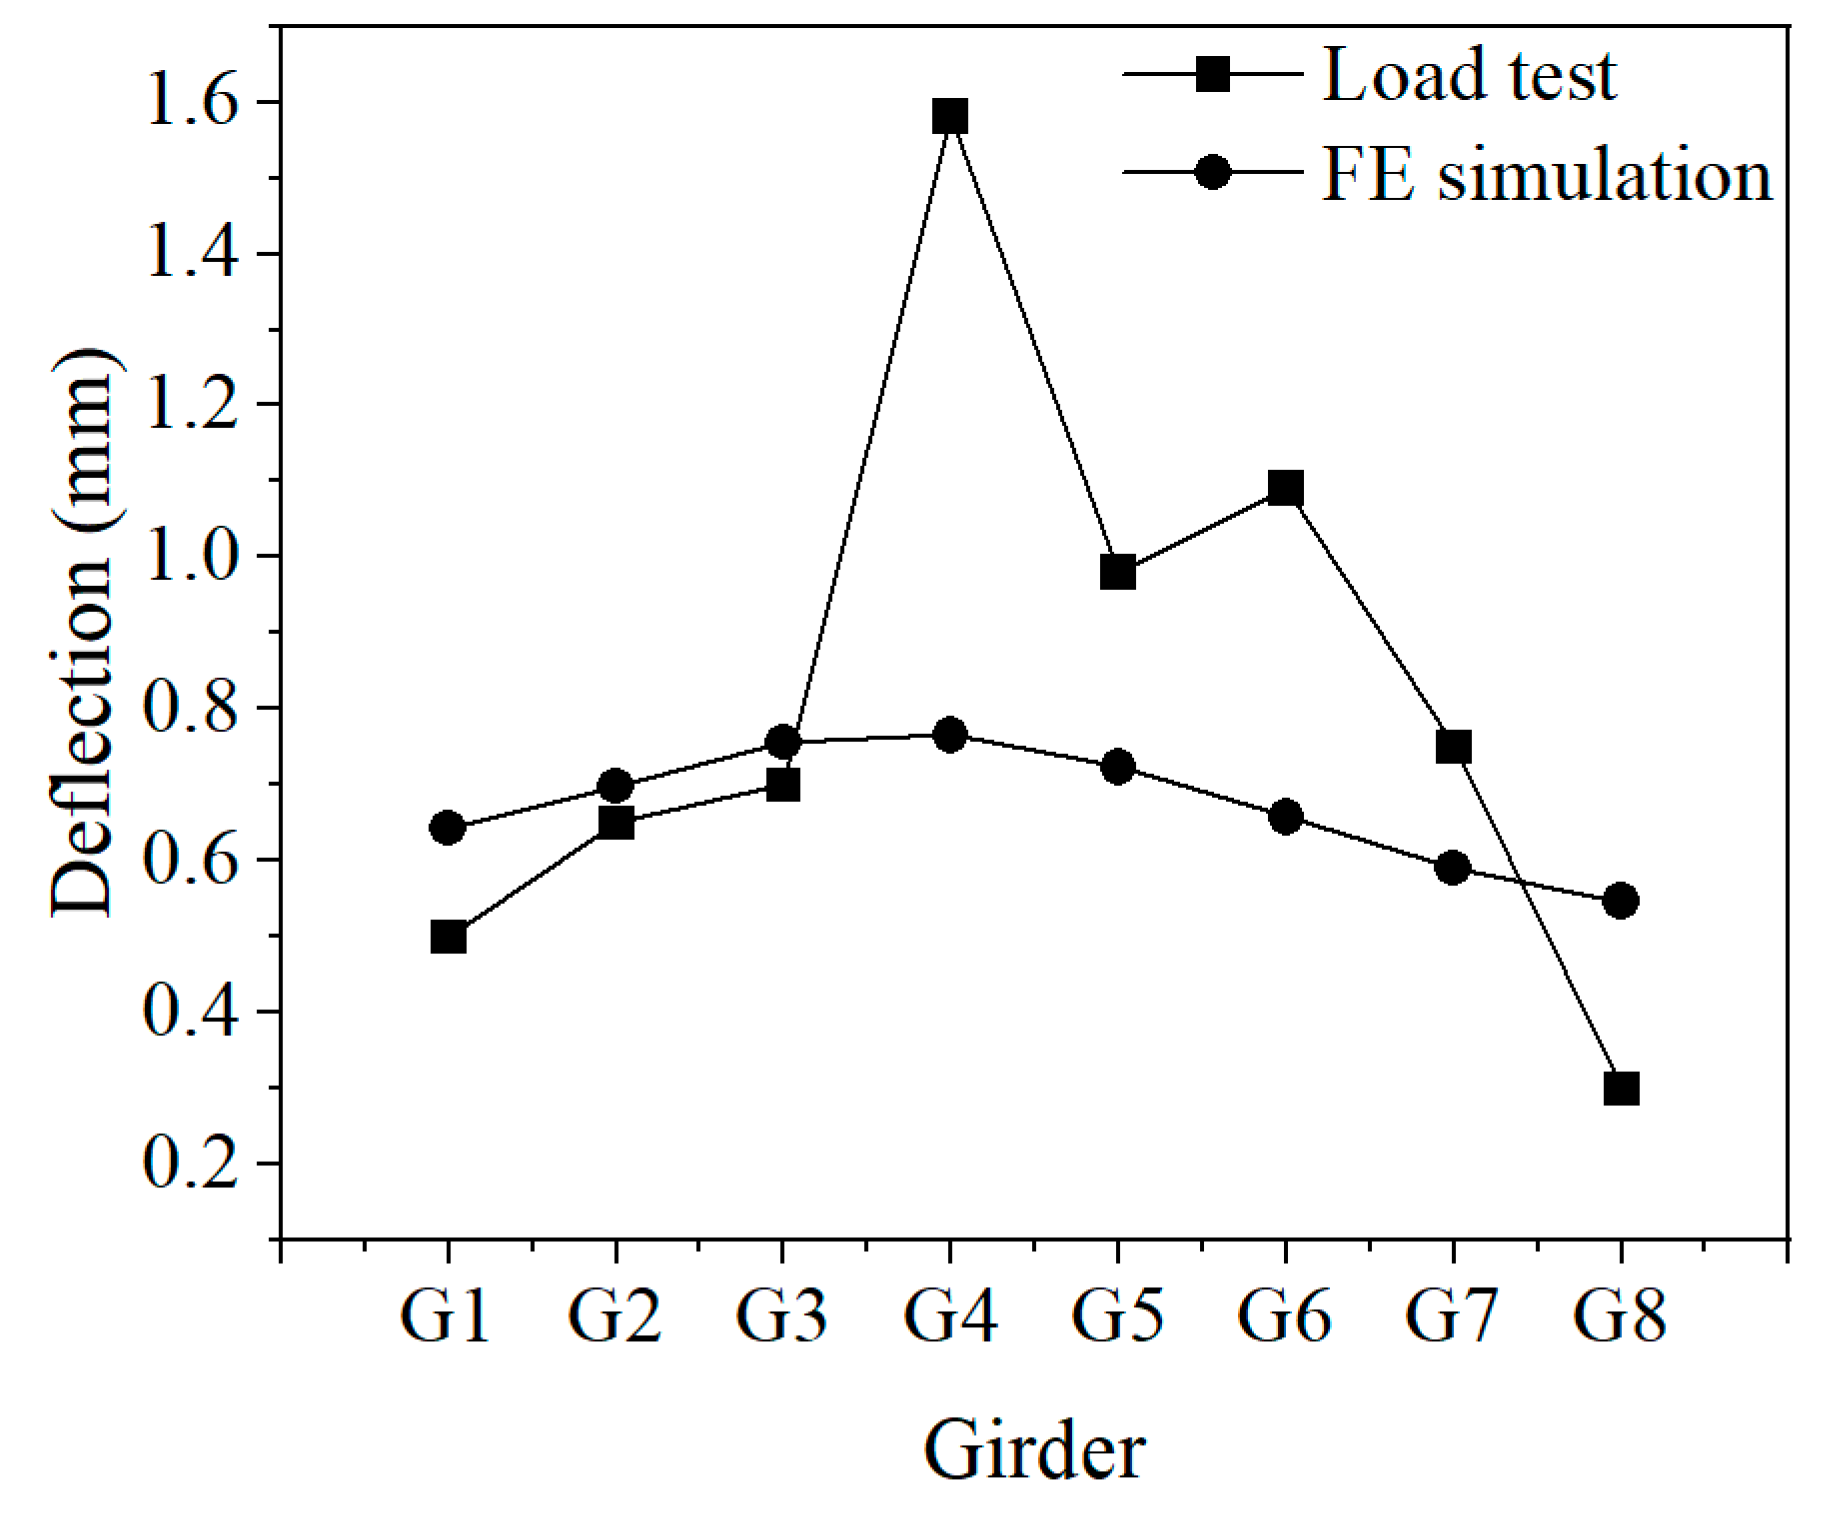
2.3. Load Test
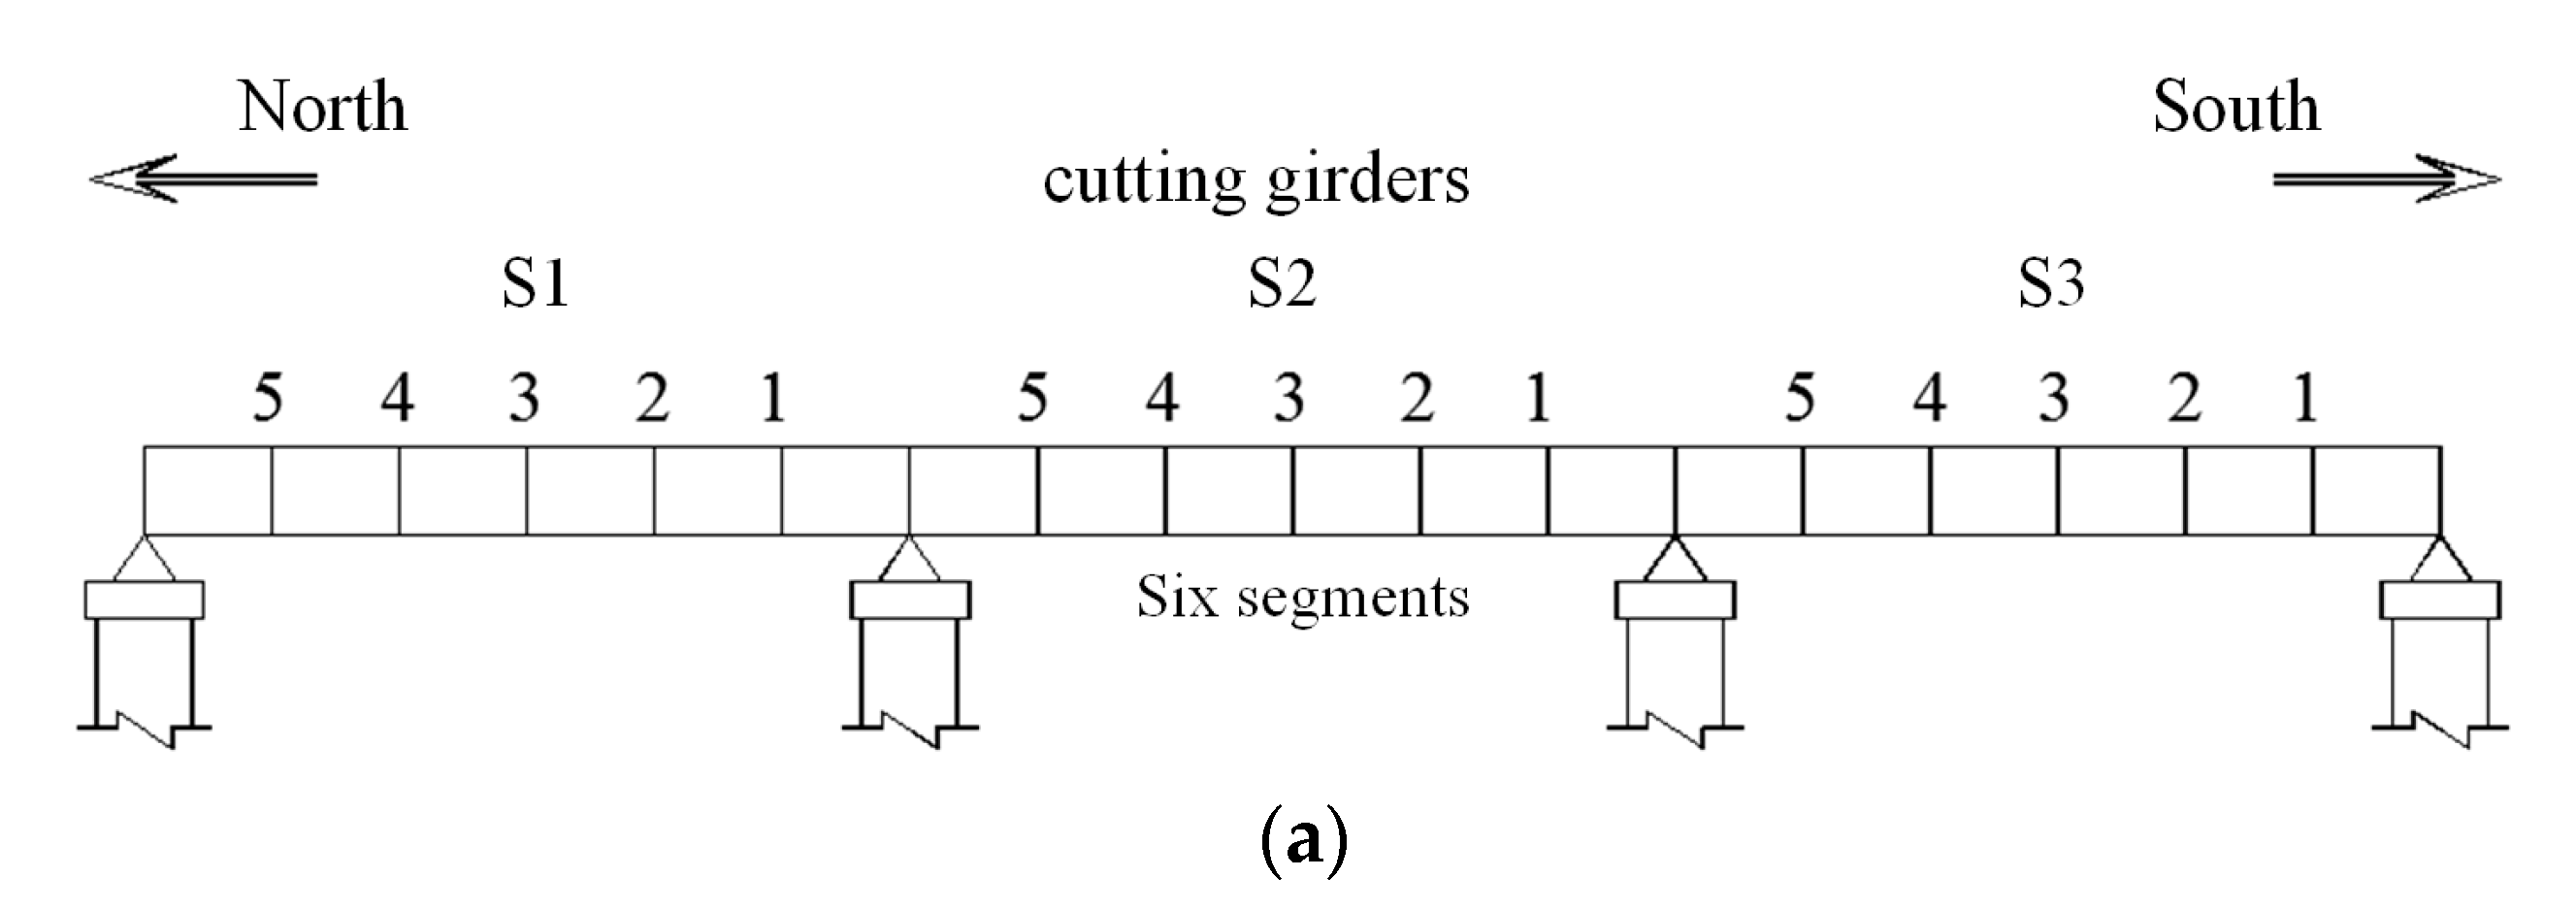
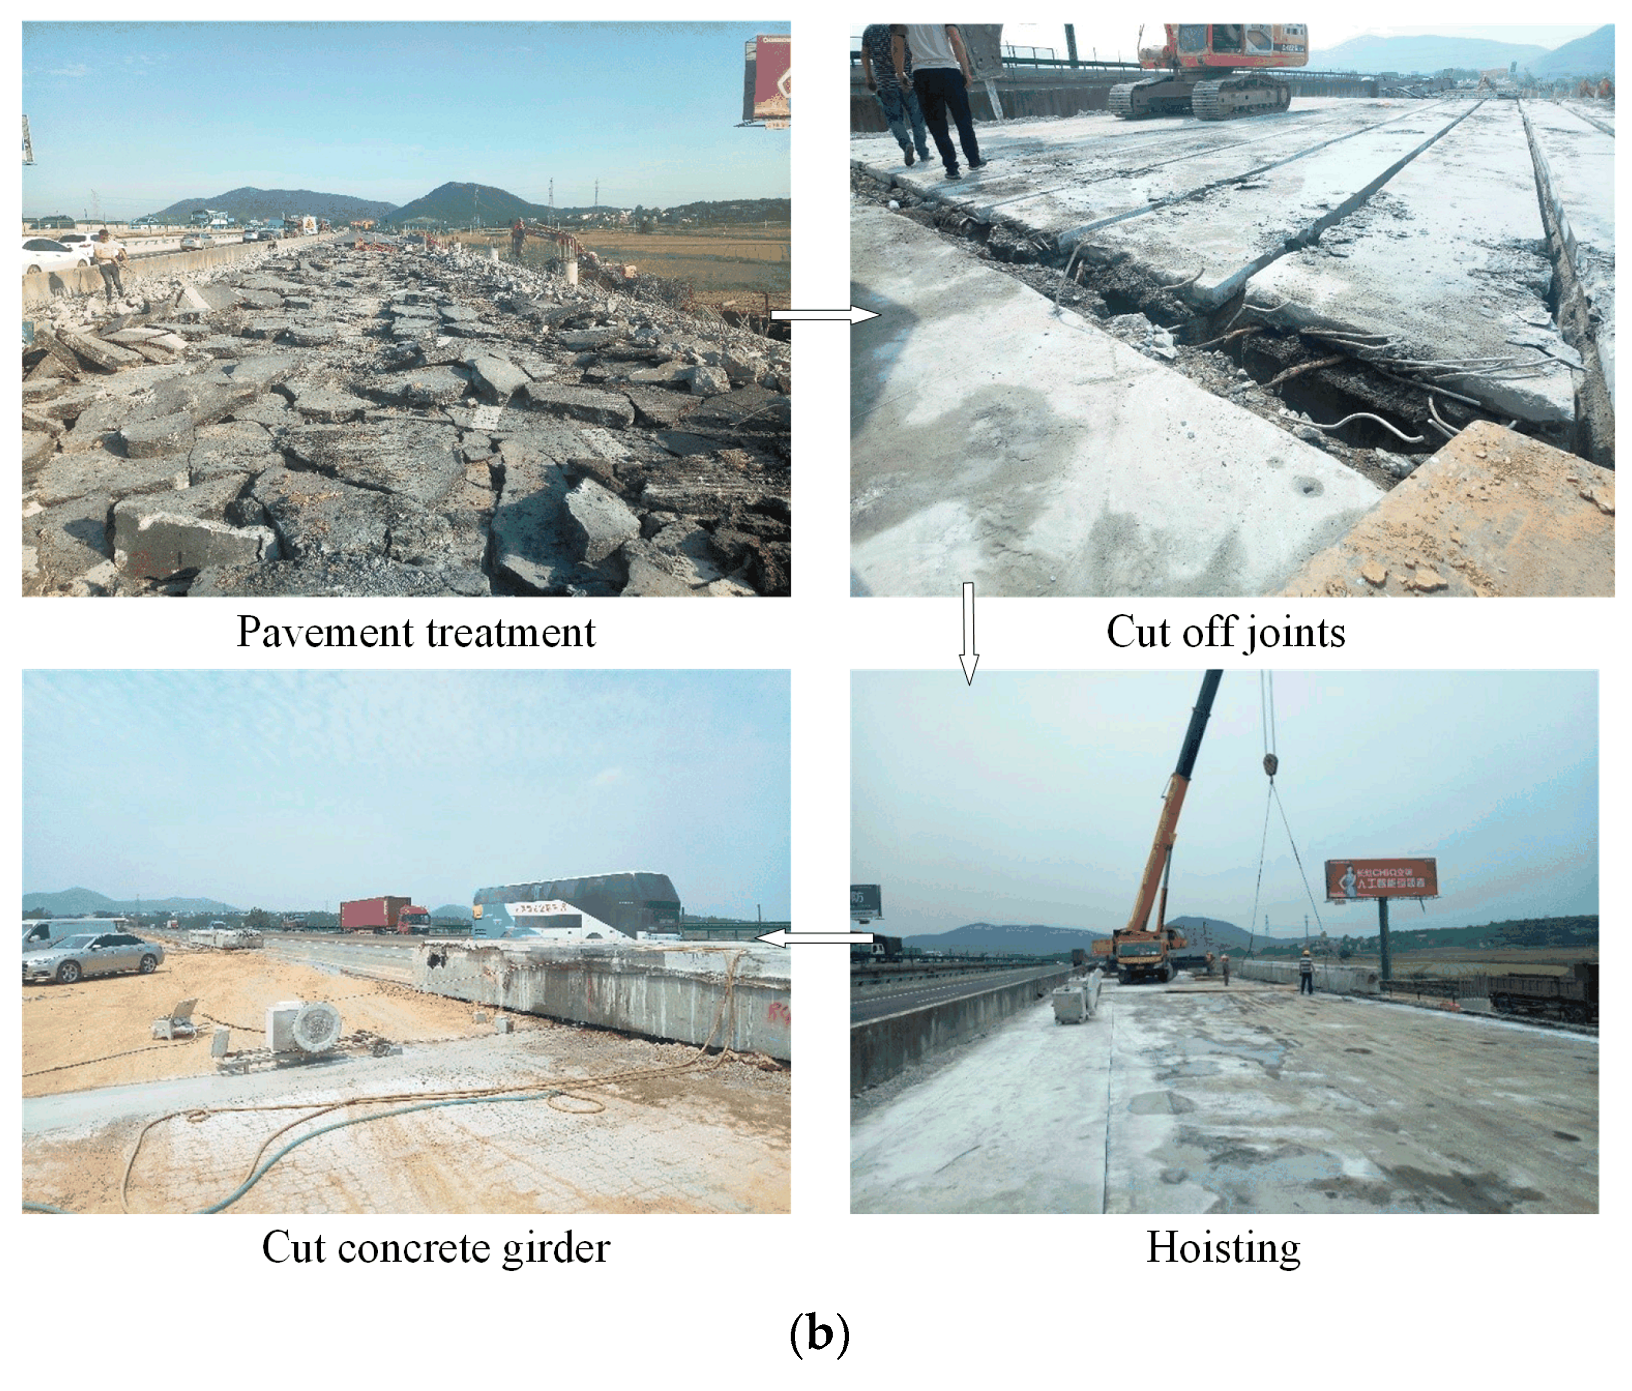
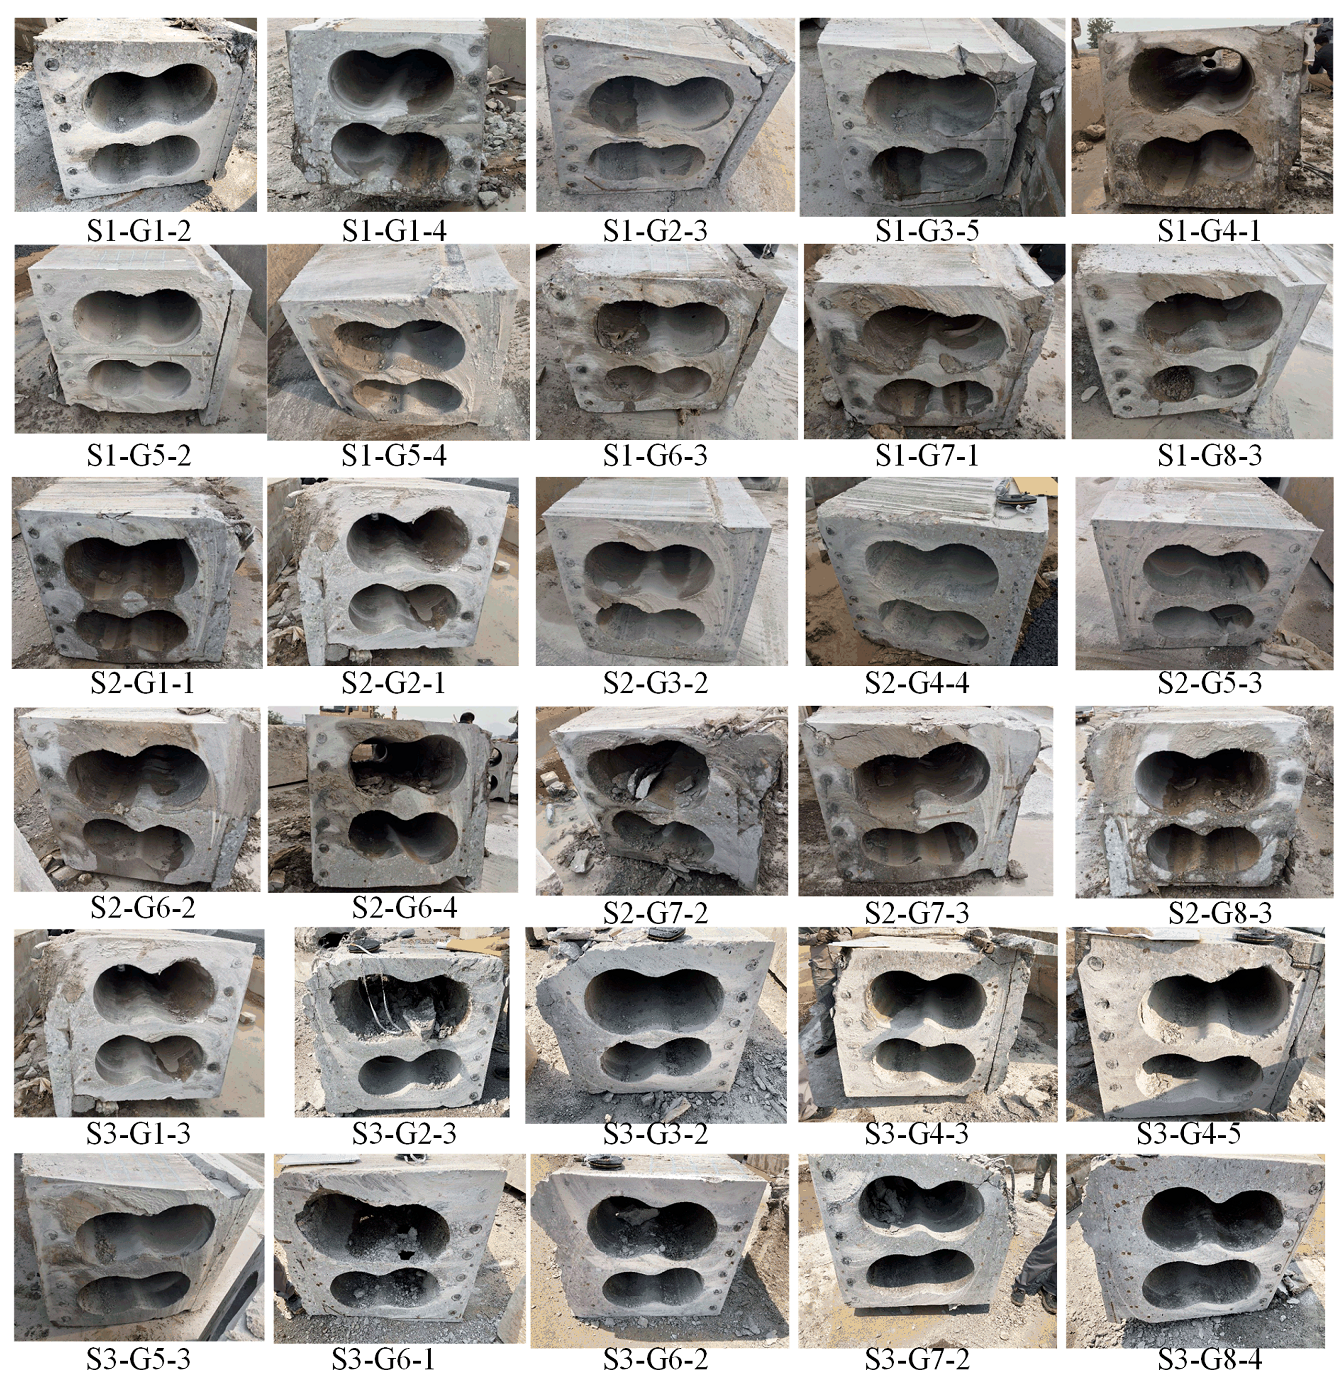
2.4. Cutting Test of Girders
3. Test Results and Analysis
3.1. Surface Damage
3.2. Transverse Connectivity
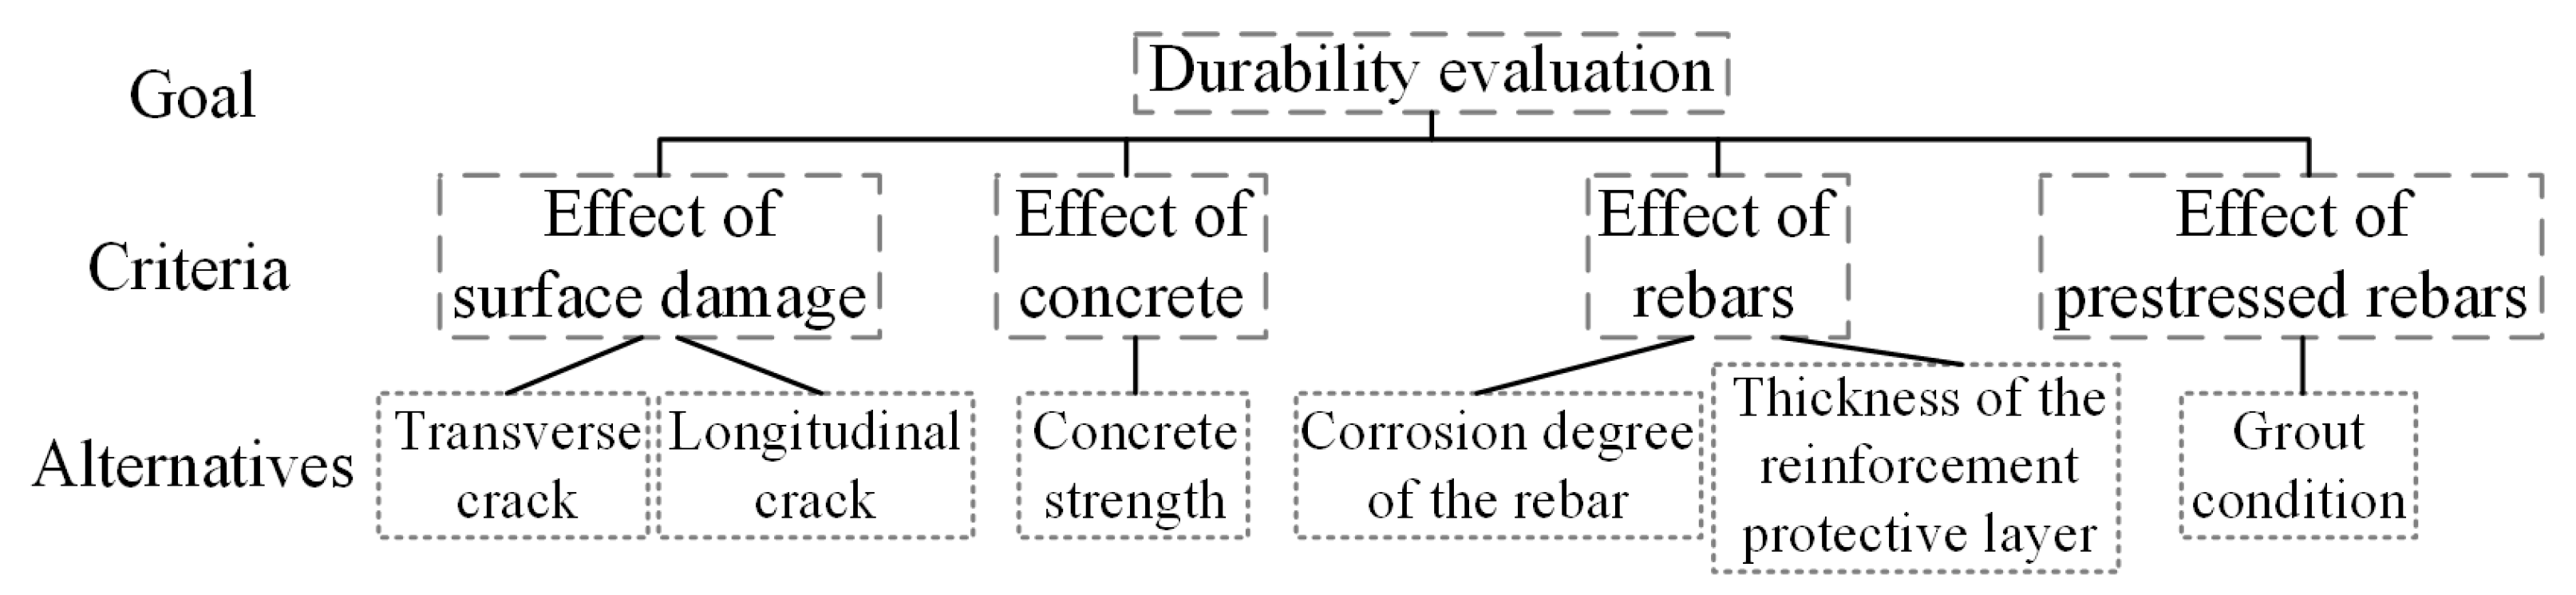
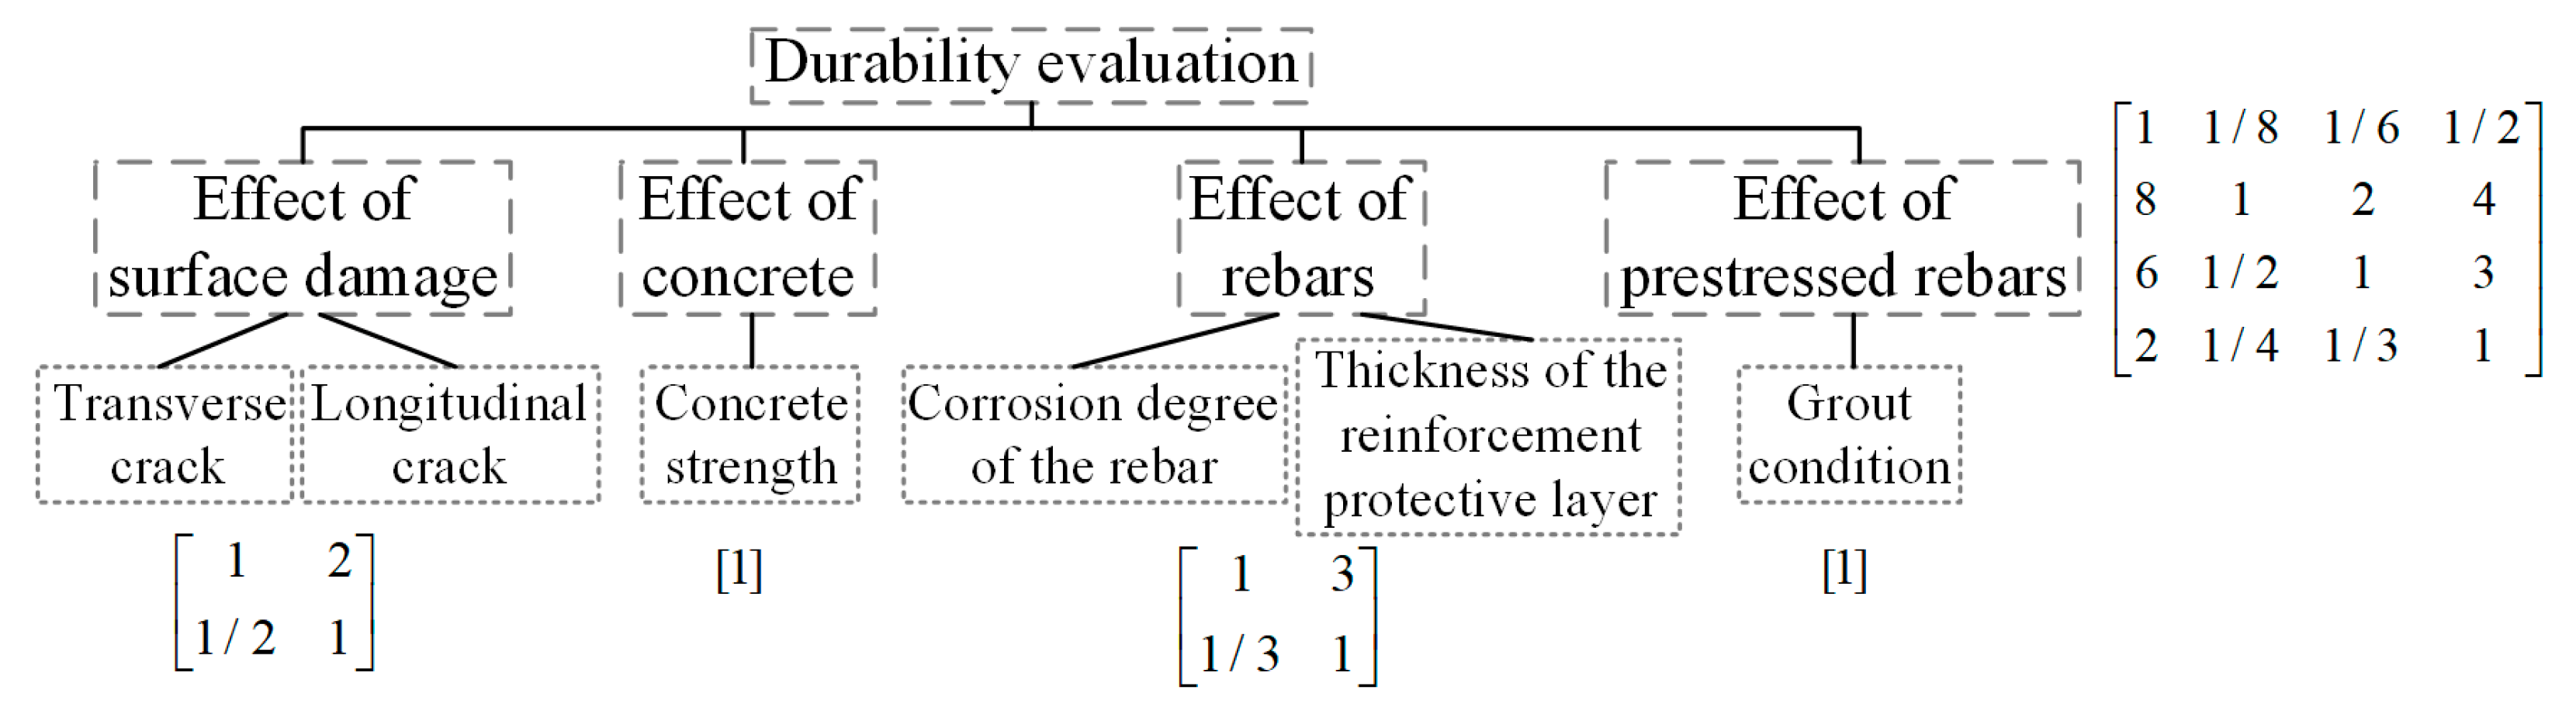
3.3. Durability
4. Evaluation of Hollow Slab Girders Based on Surface Damage and Neural Networks
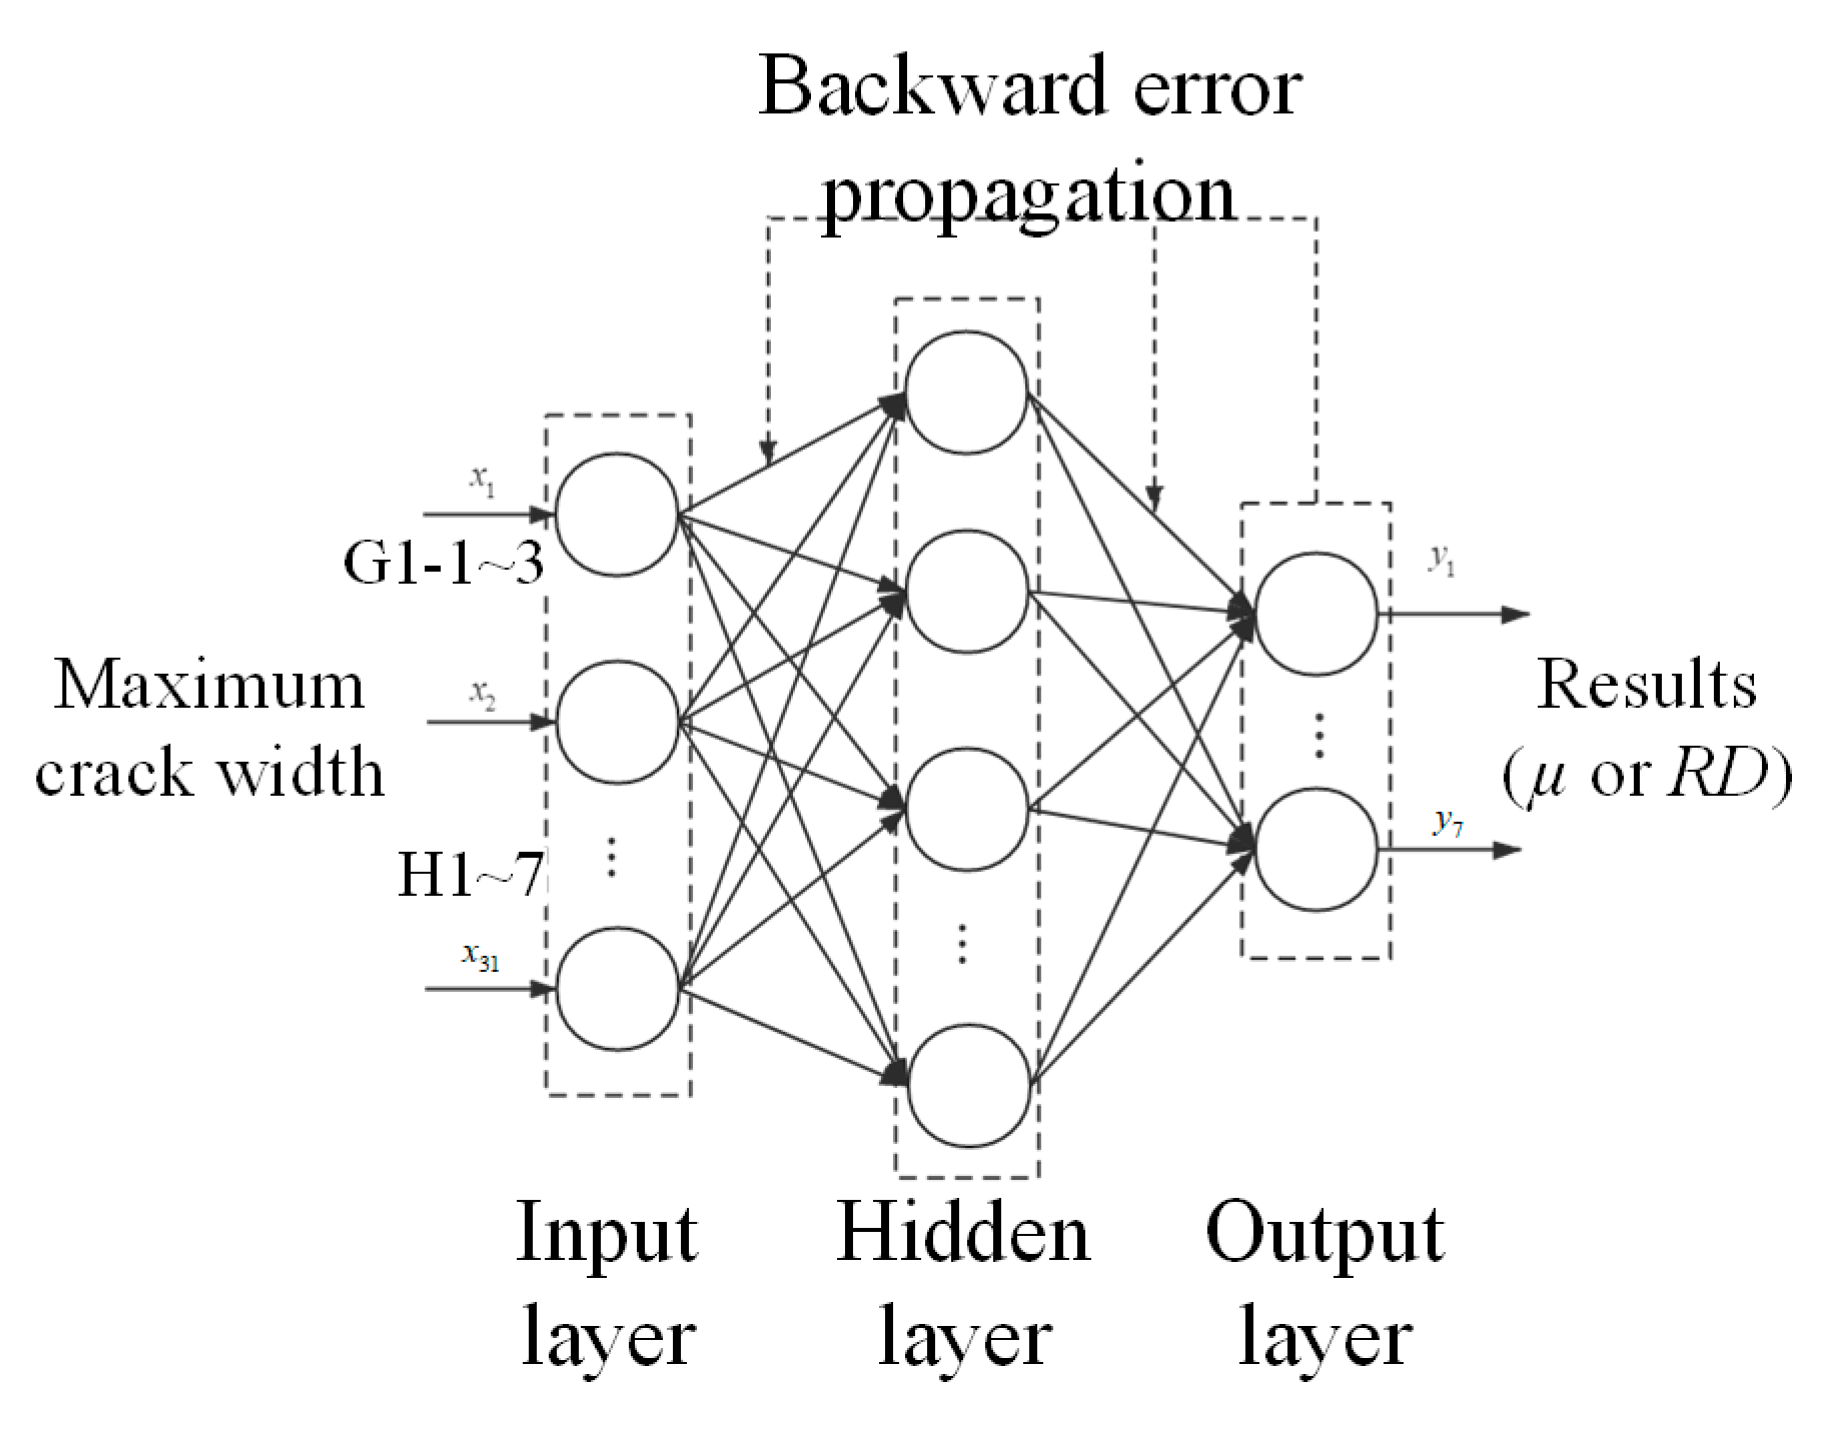
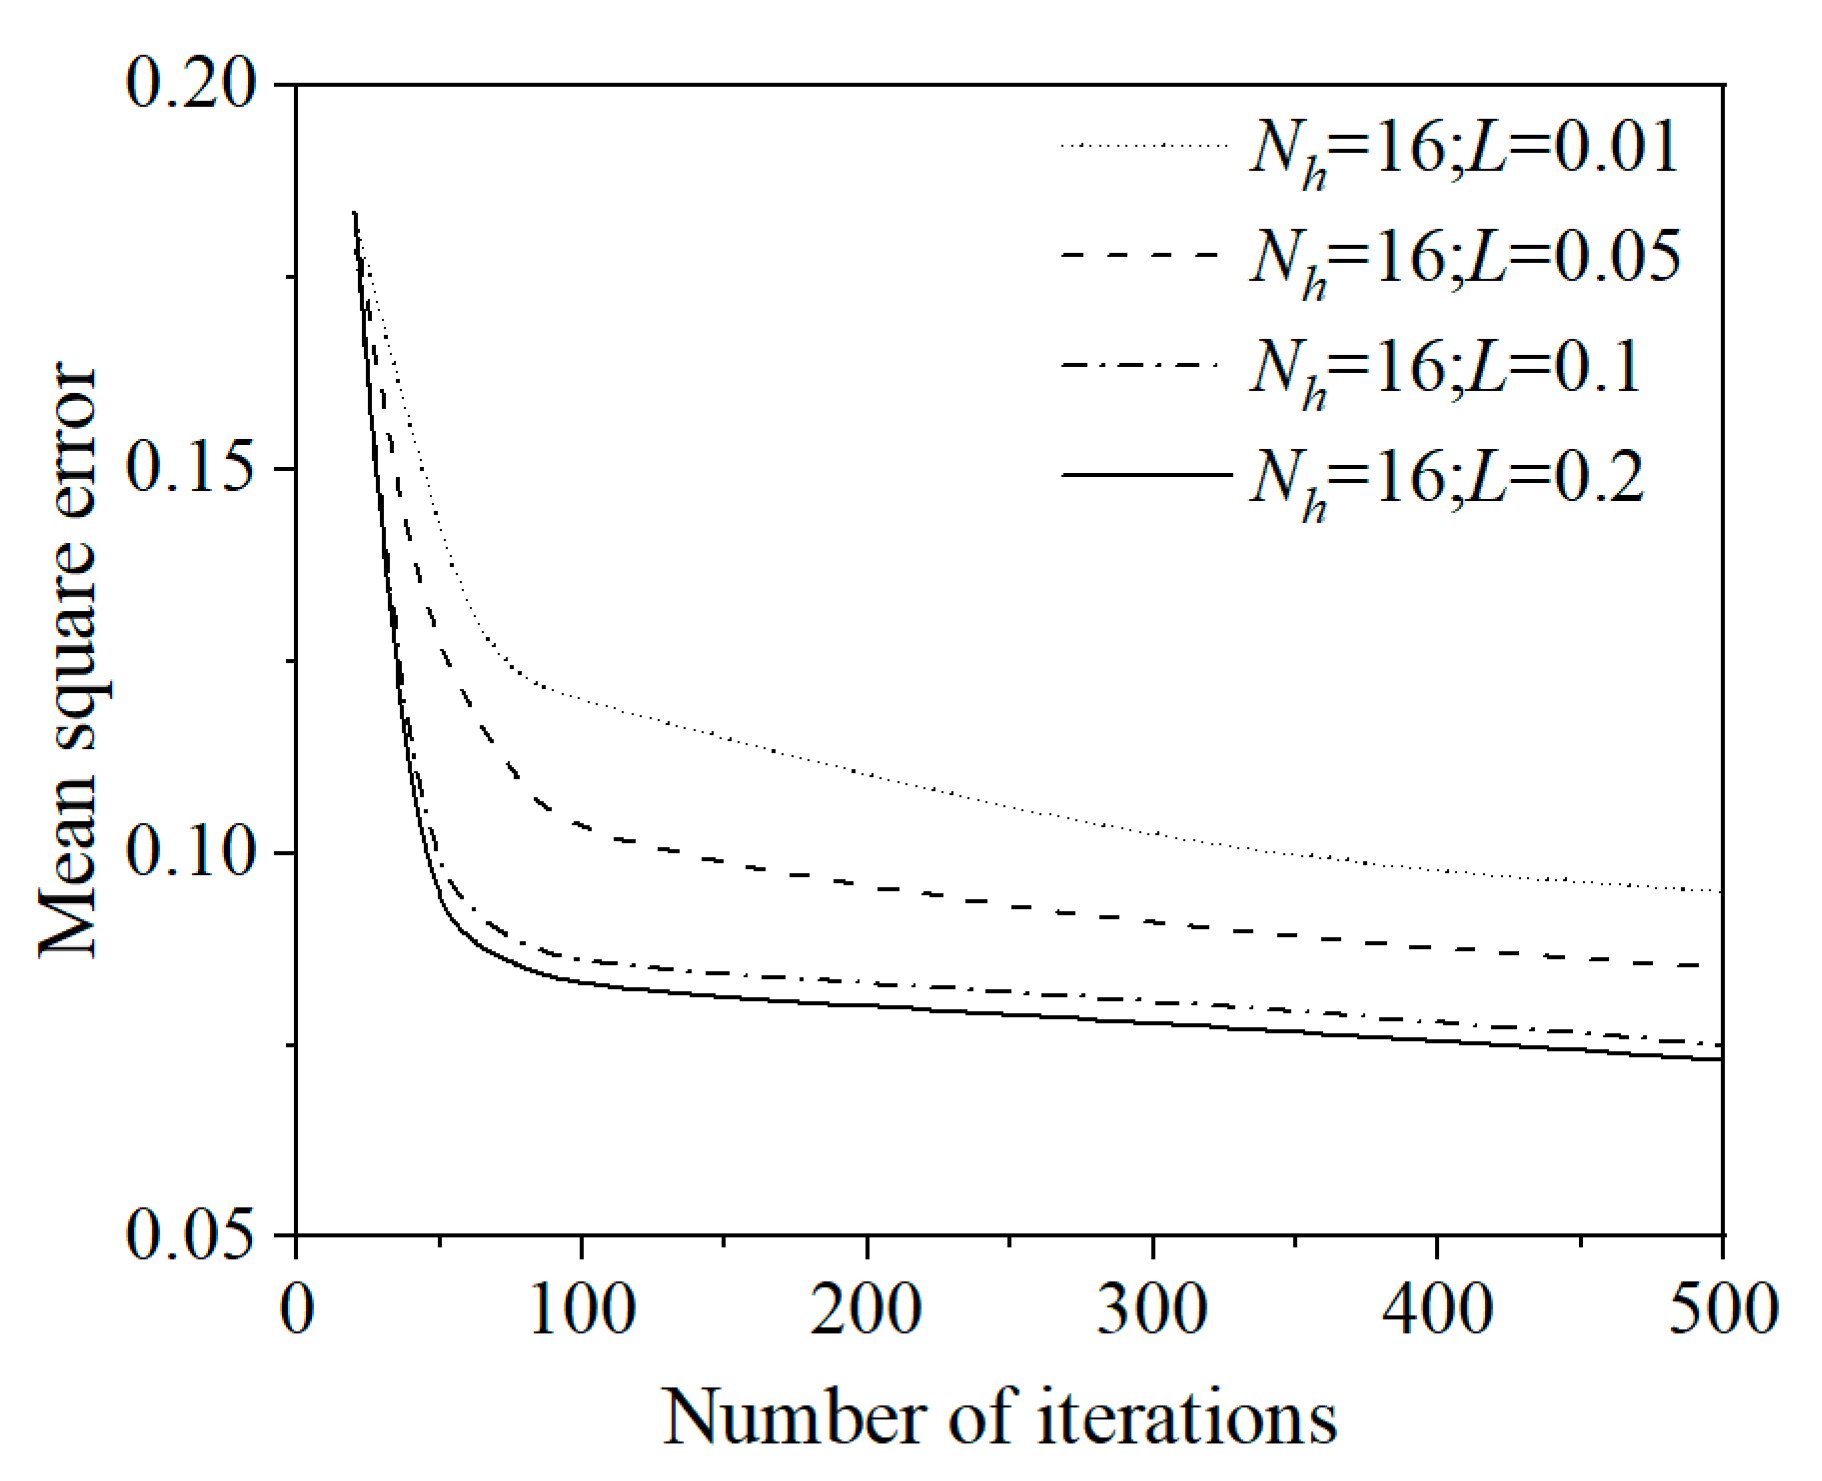
4.1. Evaluation Using Neural Network
4.2. Method Verification
5. Conclusions
- Visual inspection showed that there were two types of the typical defects in the hollow slab bridges, i.e., the transverse cracks on the bottom plates of the girders and the longitudinal cracks in the hinge joints. The transverse cracking mainly occurred in the mid-span of the bridges, while the distribution of the longitudinal cracks on the joints was quite uniform along the longitudinal location.
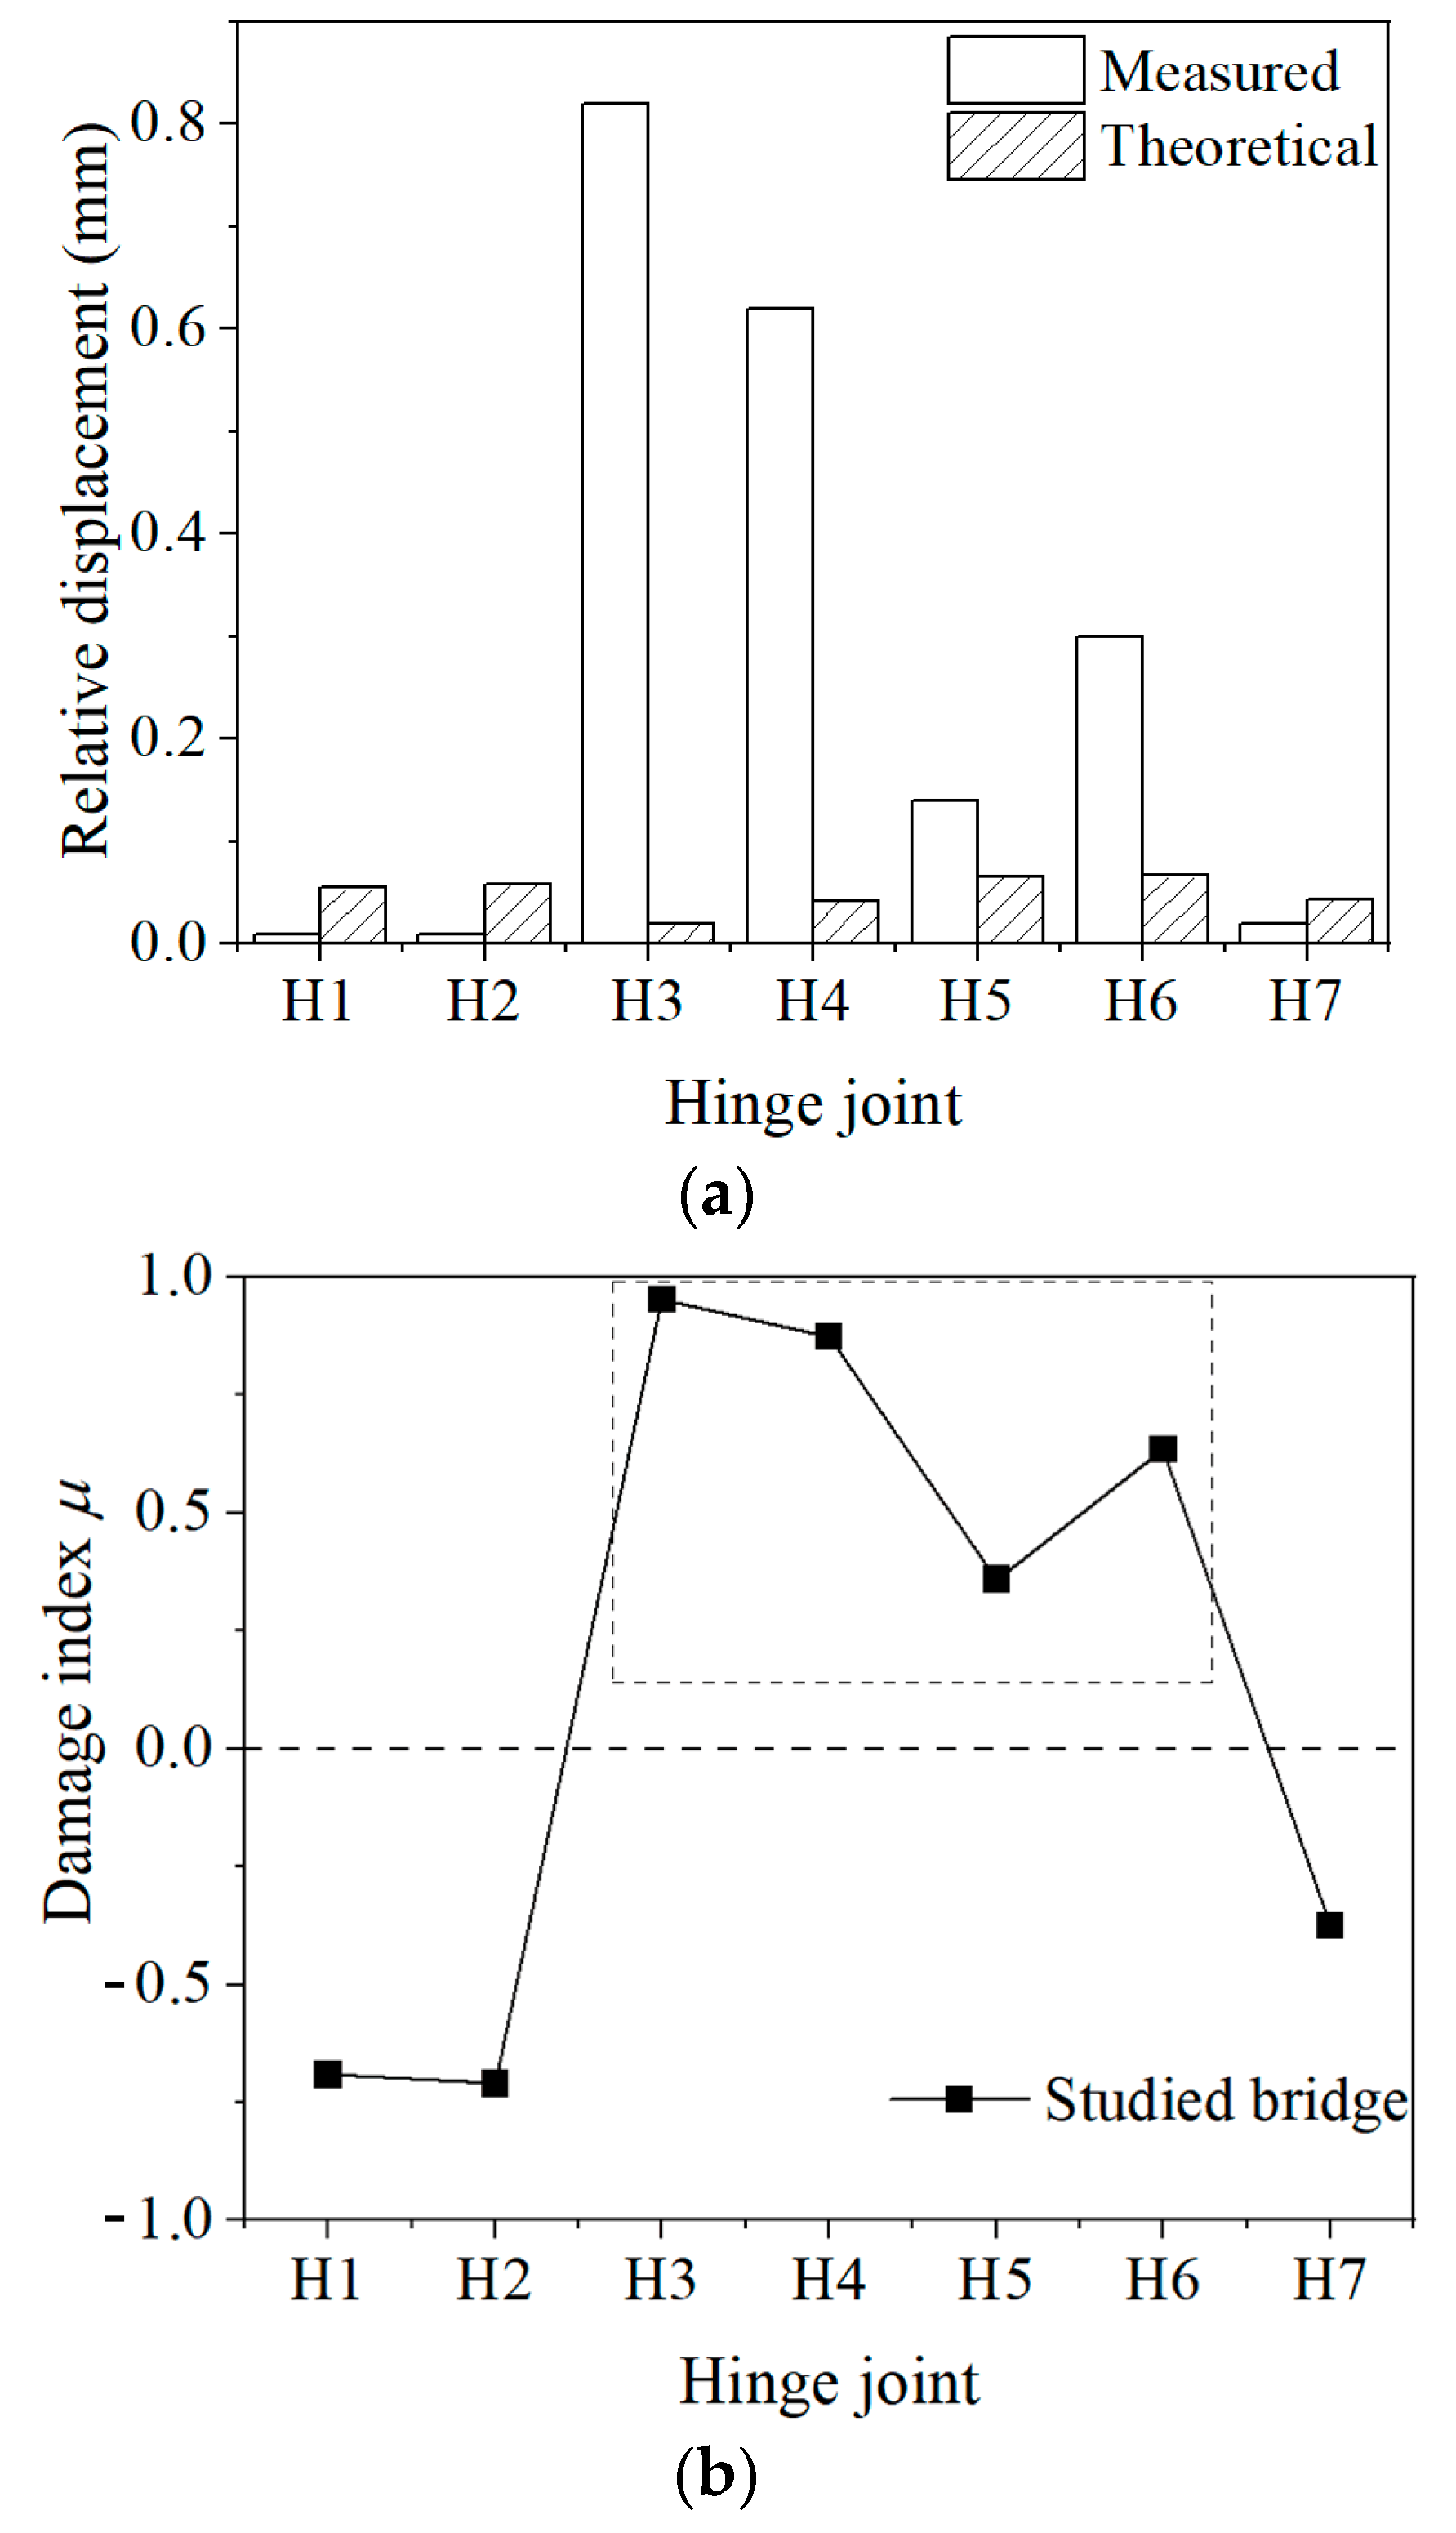
- The static load test showed that the distribution of the deflection of each girder was non-uniform due to the weakening of the transverse connectivity, and the girder deflection increased with the increase of the joint damage. A damage index was proposed based on the theoretical and measured deflections, and the joint damage can be quantitatively assessed when the index value is larger than 0. The durability of the hollow slab girders was evaluated after cutting off the concrete girders. Results showed that the girders in the background bridges were within a moderate deterioration condition after 25 years’ service life.
- An evaluation method of hollow slab girders based on the surface damage and neural networks was proposed and verified by the field test data. The maximum crack width at different locations of the bridge was used in the input layer of the neural network, and the hinge joint damage or the durability was considered as the output results. The prediction error of the method in the test set was within 15.0% for the hinge joint damage and within 40% for the durability result of the girder, indicating the feasibility of the evaluation method.
Author Contributions
Funding
Institutional Review Board Statement
Informed Consent Statement
Data Availability Statement
Acknowledgments
Conflicts of Interest
References
- He, Z.-Q.; Ma, Z.J.; Chapman, C.E.; Liu, Z. Longitudinal joints with accelerated construction features in decked bulb-tee girder bridges: Strut-and-tie model and design guidelines. J. Bridge Eng. 2013, 18, 372–379. [Google Scholar] [CrossRef]
- Hussein, H.H.; Sargand, S.M.; Khoury, I.; Al-Jhayyish, A.K. Environment-induced behavior of transverse tie bars in adjacent prestressed box-girder bridges with partial depth shear keys. J. Perform. Constr. Facil. 2017, 31, 04017074. [Google Scholar] [CrossRef]
- Zhao, Y.; Cao, X.; Zhou, Y.; Wang, G.; Tian, R. Lateral load distribution for hollow slab bridge: Field test investigation. Int. J. Concr. Struct. Mater. 2020, 14, 22. [Google Scholar] [CrossRef]
- Wang, J.; Chen, C.; Xiang, H.; Fan, X. Performance of the transverse connectivity in simply supported girder bridges and its strengthening strategy. J. Perform. Constr. Facil. 2017, 31, 04017081. [Google Scholar] [CrossRef]
- Dan, D.; Zhao, Y.; Wen, X.; Jia, P. Evaluation of lateral cooperative working performance of assembled beam bridge based on the index of strain correlation coefficient. Adv. Struct. Eng. 2019, 22, 1062–1072. [Google Scholar] [CrossRef]
- Estes, A.C.; Frangopol, D.M. Updating bridge reliability based on bridge management systems visual inspection results. J. Bridge Eng. 2003, 8, 374–382. [Google Scholar] [CrossRef] [Green Version]
- Bertola, N.J.; Brühwiler, E. Risk-based methodology to assess bridge condition based on visual inspection. Struct. Infrastruct. Eng. 2023, 19, 575–588. [Google Scholar] [CrossRef]
- Bah, A.S.; Sanchez, T.; Zhang, Y.; Sasai, K.; Conciatori, D.; Chouinard, L.; Power, G.J.; Zufferey, N. Assessing the condition state of a concrete bridge combining visual inspection and nonlinear deterioration model. Struct. Infrastruct. Eng. 2022, 1–16. [Google Scholar] [CrossRef]
- Hu, H.; Wang, J.; Dong, C.-Z.; Chen, J.; Wang, T. A hybrid method for damage detection and condition assessment of hinge joints in hollow slab bridges using physical models and vision-based measurements. Mech. Syst. Signal Process. 2023, 183, 109631. [Google Scholar] [CrossRef]
- Abdallah, A.M.; Atadero, R.A.; Ozbek, M.E. A state-of-the-art review of bridge inspection planning: Current situation and future needs. J. Bridge Eng. 2022, 27, 03121001. [Google Scholar] [CrossRef]
- Rehman, S.K.U.; Ibrahim, Z.; Memon, S.A.; Jameel, M. Nondestructive test methods for concrete bridges: A review. Constr. Build. Mater. 2016, 107, 58–86. [Google Scholar] [CrossRef] [Green Version]
- Barbieri, D.M.; Chen, Y.; Mazzarolo, E.; Briseghella, B.; Tarantino, A.M. Longitudinal joint performance of a concrete hollow core slab bridge. Transp. Res. Rec. 2018, 2672, 196–206. [Google Scholar] [CrossRef]
- Zhang, J.; Yi, T.-H.; Qu, C.-X.; Li, H.-N. Determining orders of modes sensitive to hinge joint damage in assembled hollow slab bridges. J. Bridge Eng. 2022, 27, 04022001. [Google Scholar] [CrossRef]
- Zhan, J.; Zhang, F.; Siahkouhi, M.; Kong, X.; Xia, H. A damage identification method for connections of adjacent box-beam bridges using vehicle–bridge interaction analysis and model updating. Eng. Struct. 2021, 228, 111551. [Google Scholar] [CrossRef]
- Li, Q.-F.; Yu, Y.-Q. Durability Evaluation of Concrete Bridges Based on the Theory of Matter Element Extension—Entropy Weight Method—Unascertained Measure. Math. Prob. Eng. 2021, 2021, 2646723. [Google Scholar] [CrossRef]
- Cattan, J.; Mohammadi, J. Analysis of bridge condition rating data using neural networks. Comput.-Aided Civ. Infrastruct. Eng. 1997, 12, 419–429. [Google Scholar] [CrossRef]
- Weinstein, J.C.; Sanayei, M.; Brenner, B.R. Bridge damage identification using artificial neural networks. J. Bridge Eng. 2018, 23, 04018084. [Google Scholar] [CrossRef] [Green Version]
- Liu, H.; Liu, J.; Wang, Y.; Xia, Y.; Guo, Z. Identification of grouting compactness in bridge bellows based on the BP neural network. Structures 2021, 32, 817–826. [Google Scholar] [CrossRef]
- Xia, Y.; Lei, X.; Wang, P.; Sun, L. A data-driven approach for regional bridge condition assessment using inspection reports. Struct. Control Health Monit. 2022, 29, e2915. [Google Scholar] [CrossRef]
- Miao, P.; Yokota, H.; Zhang, Y. Deterioration prediction of existing concrete bridges using a LSTM recurrent neural network. Struct. Infrastruct. Eng. 2023, 19, 475–489. [Google Scholar] [CrossRef]
- JTG H11-2015; Code for Maintenance of Highway Bridges and Culverts. Ministry of Housing and Urban-Rural Development of the PRC: Beijing, China, 2015.
- GB 50010-2010; Code for Design of Concrete Structures. Architecture and Building Press: Beijing, China, 2010.
- Ahmed, F.; Kilic, K. Fuzzy Analytic Hierarchy Process: A performance analysis of various algorithms. Fuzzy Sets Syst. 2019, 362, 110–128. [Google Scholar] [CrossRef]
- Saaty, T.L. The Analytic Process: Planning, Priority Setting, Resources Allocation; McGraw: New York, NY, USA, 1980. [Google Scholar]
- Das Khan, S.; Datta, A.K.; Topdar, P.; Sagi, S.R. A cause-based defect ranking approach for existing concrete bridges using Analytic Hierarchy Process and fuzzy-TOPSIS. Struct. Infrastruct. Eng. 2022, 1–13. [Google Scholar] [CrossRef]
- Sadeghi, B. A BP-neural network predictor model for plastic injection molding process. J. Mater. Process. Technol. 2000, 103, 411–416. [Google Scholar] [CrossRef]
- Shen, W.; Li, G.; Wei, X.; Fu, Q.; Zhang, Y.; Qu, T.; Chen, C.; Wang, R. Assessment of dairy cow feed intake based on BP neural network with polynomial decay learning rate. Inf. Process. Agric. 2022, 9, 266–275. [Google Scholar] [CrossRef]
- Faghihinejad, F.; Mohammadi Fard, M.; Roshanghalb, A.; Beigi, P. A framework to assess the correlation between transportation infrastructure access and economics: Evidence from Iran. Math. Prob. Eng. 2022, 2022, 8781686. [Google Scholar] [CrossRef]
- Rajabi, M.; Habibpour, M.; Bakhtiari, S.; Rad, F.; Aghakhani, S. The development of BPR models in smart cities using loop detectors and license plate recognition technologies: A case study. J. Future Sustain. 2023, 3, 75–84. [Google Scholar] [CrossRef]
- Duan, P.; Soleimani, H.; Ghazanfari, A.; Dehghani, M. Distributed energy management in smart grids based on cloud-fog layer architecture considering PHEVs. IEEE Trans. Ind. Appl. 2020, 1. [Google Scholar] [CrossRef]
- Majdzadeh, M.A.; Ghazanfari, A.; Ara, M.M. Determinants of private investment in Iran based on Bayesian Model Averaging. Int. J. Acad. Res. Bus. Soc. Sci. 2014, 4, 229. [Google Scholar] [CrossRef]


| No. | Span Arrangement | Girder Number | No. | Span Arrangement | Girder Number |
|---|---|---|---|---|---|
| 1 | 2 × 16 m | 6 | 8 | 3 × 20 m | 10 |
| 2 | 2 × 16 m | 4 | 9 | 2 × 16 m | 8 |
| 3 | 2 × 16 m | 4 | 10 | 1 × 16 m | 13 |
| 4 | 4 × 16 m | 8 | 11 | 1 × 16 m | 8 |
| 5 | 3 × 13 m | 8 | 12 | 10 × 22 m | 12 |
| 6 | 3 × 16 m | 8 | 13 | 2 × 16 m | 8 |
| 7 | 2 × 13 m | 8 |
| Grade | Description |
|---|---|
| A | Intact or good condition |
| B | Mild deterioration |
| C | Moderate deterioration |
| D | Severe deterioration |
| E | In danger |
| Parameter | Criteria Description | Grade | Value |
|---|---|---|---|
| Crack width (mm) | ≤0.05 | 1 | D1 |
| 0.05 to 0.1 | 2 | ||
| 0.1 to 0.15 | 3 | ||
| >0.15 | 4 | ||
| Crack length (m) | ≤0.1 | 1 | D2 |
| 0.1 to 0.2 | 2 | ||
| 0.2 to 0.3 | 3 | ||
| 0.3 to 0.4 | 4 | ||
| 0.4 to 0.5 | 5 | ||
| 0.5 to 0.6 | 6 | ||
| >0.6 | 7 | ||
| Crack location | Auxiliary components | 0 | D3 |
| Secondary components | 1 | ||
| Main components | 2 | ||
| Crack growth rate | None | −1 | D4 |
| Small | 0 | ||
| Large | +1 | ||
| Da = (D1 + D2 + D3 + D4)/14 | 0 to 0.2 | A | |
| 0.2 to 0.4 | B | ||
| 0.4 to 0.6 | C | ||
| 0.6 to 0.8 | D | ||
| 0.8 to 1.0 | E |
| Parameter | Grade | ||||
|---|---|---|---|---|---|
| A | B | C | D | E | |
| Db | ≥0.95 | 0.90 to 0.95 | 0.80 to 0.90 | 0.70 to 0.80 | <0.70 |
| Dc | ≥0.98 | 0.95 to 0.98 | 0.90 to 0.95 | 0.80 to 0.90 | <0.80 |
| Dd | ≥0.95 | 0.85 to 0.95 | 0.70 to 0.85 | 0.55 to 0.70 | <0.55 |
| De | ≥0.80 | 0.60 to 0.80 | 0.40 to 0.60 | 0.20 to 0.40 | <0.20 |
| Component | Defect | Number | Total | Proportion (%) |
|---|---|---|---|---|
| Single girder | Transverse crack on the bottom plates | 313 | 368 | 85.1 |
| Rebar corrosion | 27 | 7.3 | ||
| Concrete spalling | 18 | 4.9 | ||
| Longitudinal crack on the bottom plates | 10 | 2.7 | ||
| Hinge joint | Longitudinal crack | 256 | 314 | 81.5 |
| Rebar corrosion | 30 | 9.6 | ||
| Transverse crack | 21 | 6.7 | ||
| Seepage | 7 | 2.2 | ||
| Total | 682 | 682 |
| Transverse Cracks on the Bottom Plates | Longitudinal Cracks on the Hinge Joints | |||
|---|---|---|---|---|
| Longitudinal Location | Number | Proportion (%) | Number | Proportion (%) |
| 0–1/8 span | 17 | 5.4 | 31 | 12.1 |
| 1/8 span–3/8 span | 61 | 19.5 | 26 | 10.2 |
| 3/8 span–5/8 span | 220 | 70.3 | 47 | 18.4 |
| 5/8 span–7/8 span | 10 | 3.2 | 36 | 14.1 |
| 7/8 span–1 span | 5 | 1.6 | 21 | 8.2 |
| Through crack | 0 | 0.0 | 95 | 37.1 |
| Total | 313 | 256 | 100 | |
| Transverse Cracks on the Bottom Plates | Longitudinal Cracks on the Hinge Joints | ||||
|---|---|---|---|---|---|
| Length/cm | Number | Proportion (%) | Length/cm | Number | Proportion (%) |
| 0–9 | 35 | 11.2 | 0–10 | 47 | 18.4 |
| 10–19 | 117 | 37.4 | 10–50 | 30 | 11.7 |
| 20–29 | 77 | 24.6 | 50–100 | 17 | 6.6 |
| 30–39 | 48 | 15.3 | 100–150 | 21 | 8.2 |
| 40–49 | 32 | 10.2 | Through | 95 | 37.1 |
| >50 | 4 | 1.3 | 150–1000 | 46 | 18.0 |
| Total | 313 | 100 | Total | 256 | 100 |
| Width/mm | Number | Proportion (%) | Width/mm | Number | Proportion (%) |
| 0–0.1 | 22 | 7.0 | 0–2 | 96 | 37.5 |
| 0.1–0.2 | 159 | 50.8 | 2–4 | 86 | 33.6 |
| 0.2–0.3 | 76 | 24.3 | 4–6 | 34 | 13.3 |
| 0.3–0.4 | 20 | 6.4 | 6–8 | 14 | 5.5 |
| 0.4–0.5 | 17 | 5.4 | 8–10 | 12 | 4.7 |
| >0.5 | 19 | 6.1 | >10 | 14 | 5.5 |
| Total | 313 | 100 | Total | 256 | 100 |
| Indicator | Girder Segment | ||||
|---|---|---|---|---|---|
| S2-G4-1 | S2-G4-2 | S2-G4-3 | S2-G4-4 | S2-G4-5 | |
| Transverse crack | A | C | B | D | C |
| Longitudinal crack | A | A | A | A | A |
| Concrete strength | D | B | C | C | A |
| Corrosion degree of rebars | A | A | B | B | B |
| Reinforcement protective layer thickness | B | C | C | D | C |
| Grout condition | A | A | A | A | A |
Disclaimer/Publisher’s Note: The statements, opinions and data contained in all publications are solely those of the individual author(s) and contributor(s) and not of MDPI and/or the editor(s). MDPI and/or the editor(s) disclaim responsibility for any injury to people or property resulting from any ideas, methods, instructions or products referred to in the content. |
© 2023 by the authors. Licensee MDPI, Basel, Switzerland. This article is an open access article distributed under the terms and conditions of the Creative Commons Attribution (CC BY) license (https://creativecommons.org/licenses/by/4.0/).
Share and Cite
Jiang, C.; Xiong, W.; Wang, Z.; Cai, C.; Yang, J. Transverse Connectivity and Durability Evaluation of Hollow Slab Bridges Using Surface Damage and Neural Networks: Field Test Investigation. Appl. Sci. 2023, 13, 4851. https://doi.org/10.3390/app13084851
Jiang C, Xiong W, Wang Z, Cai C, Yang J. Transverse Connectivity and Durability Evaluation of Hollow Slab Bridges Using Surface Damage and Neural Networks: Field Test Investigation. Applied Sciences. 2023; 13(8):4851. https://doi.org/10.3390/app13084851
Chicago/Turabian StyleJiang, Chao, Wen Xiong, Zichen Wang, Chunsheng Cai, and Juan Yang. 2023. "Transverse Connectivity and Durability Evaluation of Hollow Slab Bridges Using Surface Damage and Neural Networks: Field Test Investigation" Applied Sciences 13, no. 8: 4851. https://doi.org/10.3390/app13084851