Article

On the Use of Microstructure Characteristics to Predict Metal Matrix Composites’ Macroscopic Mechanical Behavior

by
Ioannis Markopoulos
,
Leonidas-Alexandros Kouris
* and
Avraam Konstantinidis
Laboratory of Engineering Mechanics, School of Civil Engineering, Faculty of Engineering, Aristotle University of Thessaloniki, 54124 Thessaloniki, Greece
*
Author to whom correspondence should be addressed.
Appl. Sci. 2023, 13(8), 4989; https://doi.org/10.3390/app13084989
Submission received: 15 March 2023 / Revised: 13 April 2023 / Accepted: 13 April 2023 / Published: 16 April 2023
(This article belongs to the Special Issue Modeling and Simulation of Composite Materials and Structures)

Abstract

:
In recent decades, the construction of statistically similar representative volume elements (SSRVEs) of materials for use in numerical analyses has been accomplished utilizing various methods, tools, and frameworks. Such a framework is introduced in this work, where the creation of 3D SSRVEs of metal matrix composites was investigated to assess their mechanical properties with reference to the material’s microstructure. The material studied was a composite based on AA7075 alloy reinforced with carbon fibers, with volume fractions of 0%, 4%, 8%, and 12%. The statistics of the alloy’s microstructure were extracted by segmenting an SEM image and fitting the precipitate particles’ sizes with respect to a lognormal distribution. The open-source software DREAM.3D was used to construct 3D ensembles and the Abaqus FEA software was employed for the mechanical testing simulations. By plotting the tensile stress–strain curves for the composites, it was found that the elastic modulus increased with the fibers’ volume fraction, obeying the rule of mixtures for discontinuous fibrous composites. The fiber efficiency factors were also calculated. The yield stresses of the composites were found and compared to the ones expected according to the shear-lag model, indicating major differences.

1. Introduction

When designing heterogeneous materials, it is of great importance to take the microscale geometric arrangement of their constituents into consideration, in order to make confident assumptions about their macroscopic mechanical performance. During the last few decades, the practice of building digital 3D representative volume elements (RVEs) has been employed for the consideration of the microstructure of polycrystals (alloys [1,2,3,4,5,6,7,8,9] and ceramics [10]), polymer matrix composites [11,12,13,14], metal matrix composites [15,16,17,18,19], and ceramic matrix composites [20,21,22,23].
In many instances, and especially for metals and alloys, experimental methods are used to obtain information on the microstructure of the material, primarily electron backscattering diffraction (EBSD) and scanning electron microscopy (SEM). However, the use of pure experimental data regarding the geometry of the specimens may result in severe numerical drawbacks during the simulation of the RVEs. This occurs as these data exhibit geometrical complexity and, consequently, an extremely high number of degrees of freedom (DOFs) [24]. Therefore, the construction of RVEs is commonly accomplished by resorting to alternative methods, such as Voronoi diagrams [3,15,16,17,25,26,27] or by applying statistical simulations (e.g., Monte Carlo) [11,14].
The utilization of simpler RVEs in terms of geometry, which, despite their simplicity, represent the material’s microstructure and respond adequately to simulations in terms of the material’s macroscopic properties, is also desirable [24]. These elements, often referred to as statistically similar RVEs (SSRVEs), are obtained by minimizing the differences in statistical and mechanical behavior compared to the actual microstructure [24,28]. This optimization process is executed to ensure statistical similarity, as well as to render the SSRVEs and the real microstructure comparable, in terms of mechanical properties. The performance of SSRVEs may vary depending on the statistics used and on the parameterization of the microstructure. It is also important for the efficient construction of SSRVEs to retrieve the statistics in a reasonable time frame and provide sufficient and valid information about the actual microstructure [28]. One way to construct SSRVEs is to segment images obtained by a microscopy technique (e.g., SEM, TEM, tomography) based on the brightness of its segments. These segments depict different phases of the material and segmentation is used to obtain information about the statistics of each phase [24,29].
The objective of this study is to establish a framework for constructing 3D digital volumes that simulate, based on microstructure statistics, a complex material. These volumes can be used to perform simulations of mechanical loading to evaluate their macroscopic mechanical properties. The framework is designed by employing experimental data of the microstructure of its individual phases and their mechanical properties. Having developed such a framework, one can design novel materials and predict their mechanical performance at the macroscale by combining different constituents (matrix and reinforcing phases) and by altering the parameters that describe the microstructure, such as volume fractions, size distributions, particle geometry, and inter-phase interactions. The benefit of replacing experimental mechanical testing (e.g., tension, compression, hardness measurements) with simulation analyses lies in the significant cost reduction in the material design process.
The present study was performed, as a first step, on a metal matrix composite (MMC), namely the aluminum alloy composite AA7075 with a T700S-type carbon fiber reinforcing phase. This alloy was chosen as it is one of the most studied alloys, with applications in fields where high mechanical stresses are applied (e.g., aerospace, aeronautics, machinery, pressure vessels) [4,30,31,32,33]. Moreover, its microstructure is relatively simple in terms of the number of phases present and the shape of the particles. A clear understanding of the alloy’s microstructure is essential for predicting its mechanical behavior. For the material under study, the volume fractions and the distribution of precipitate particles significantly affect its mechanical properties. Variations in tensile strength and hardness of AA7075 have been observed with fluctuations in the alloy microstructure, as a consequence of variations in solution heat treatment times and temperatures [34,35]. As far as the microstructure of an MMC with respect to the reinforcing phase is concerned, the variations in mechanical properties depend on numerous factors, such as the shape, size, and, in the case of fibrous composites, orientation of the reinforcing particles [36,37,38].

2. Materials and Methods

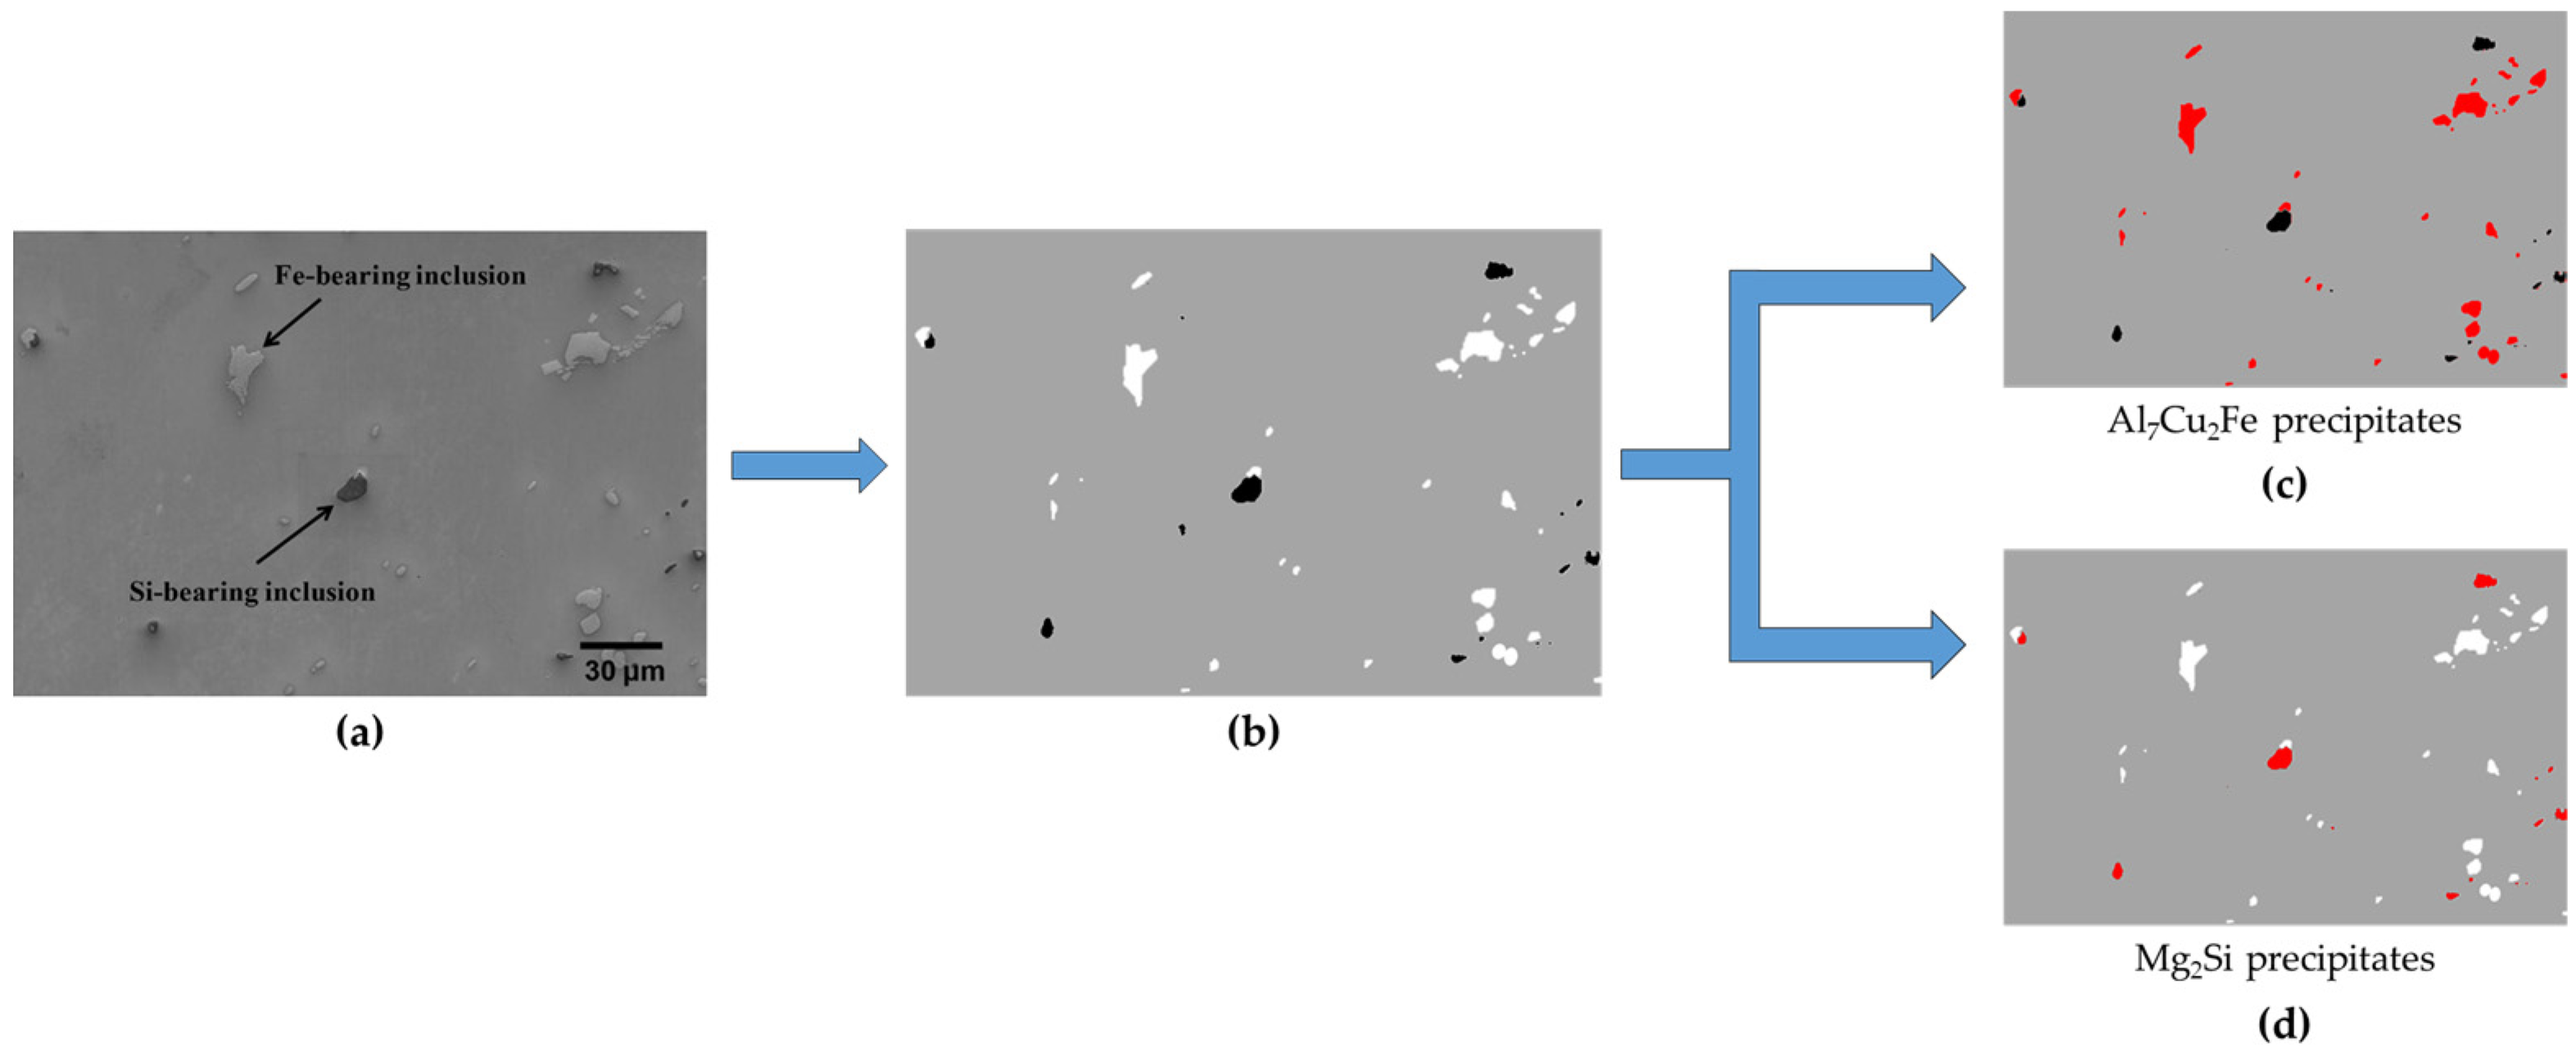
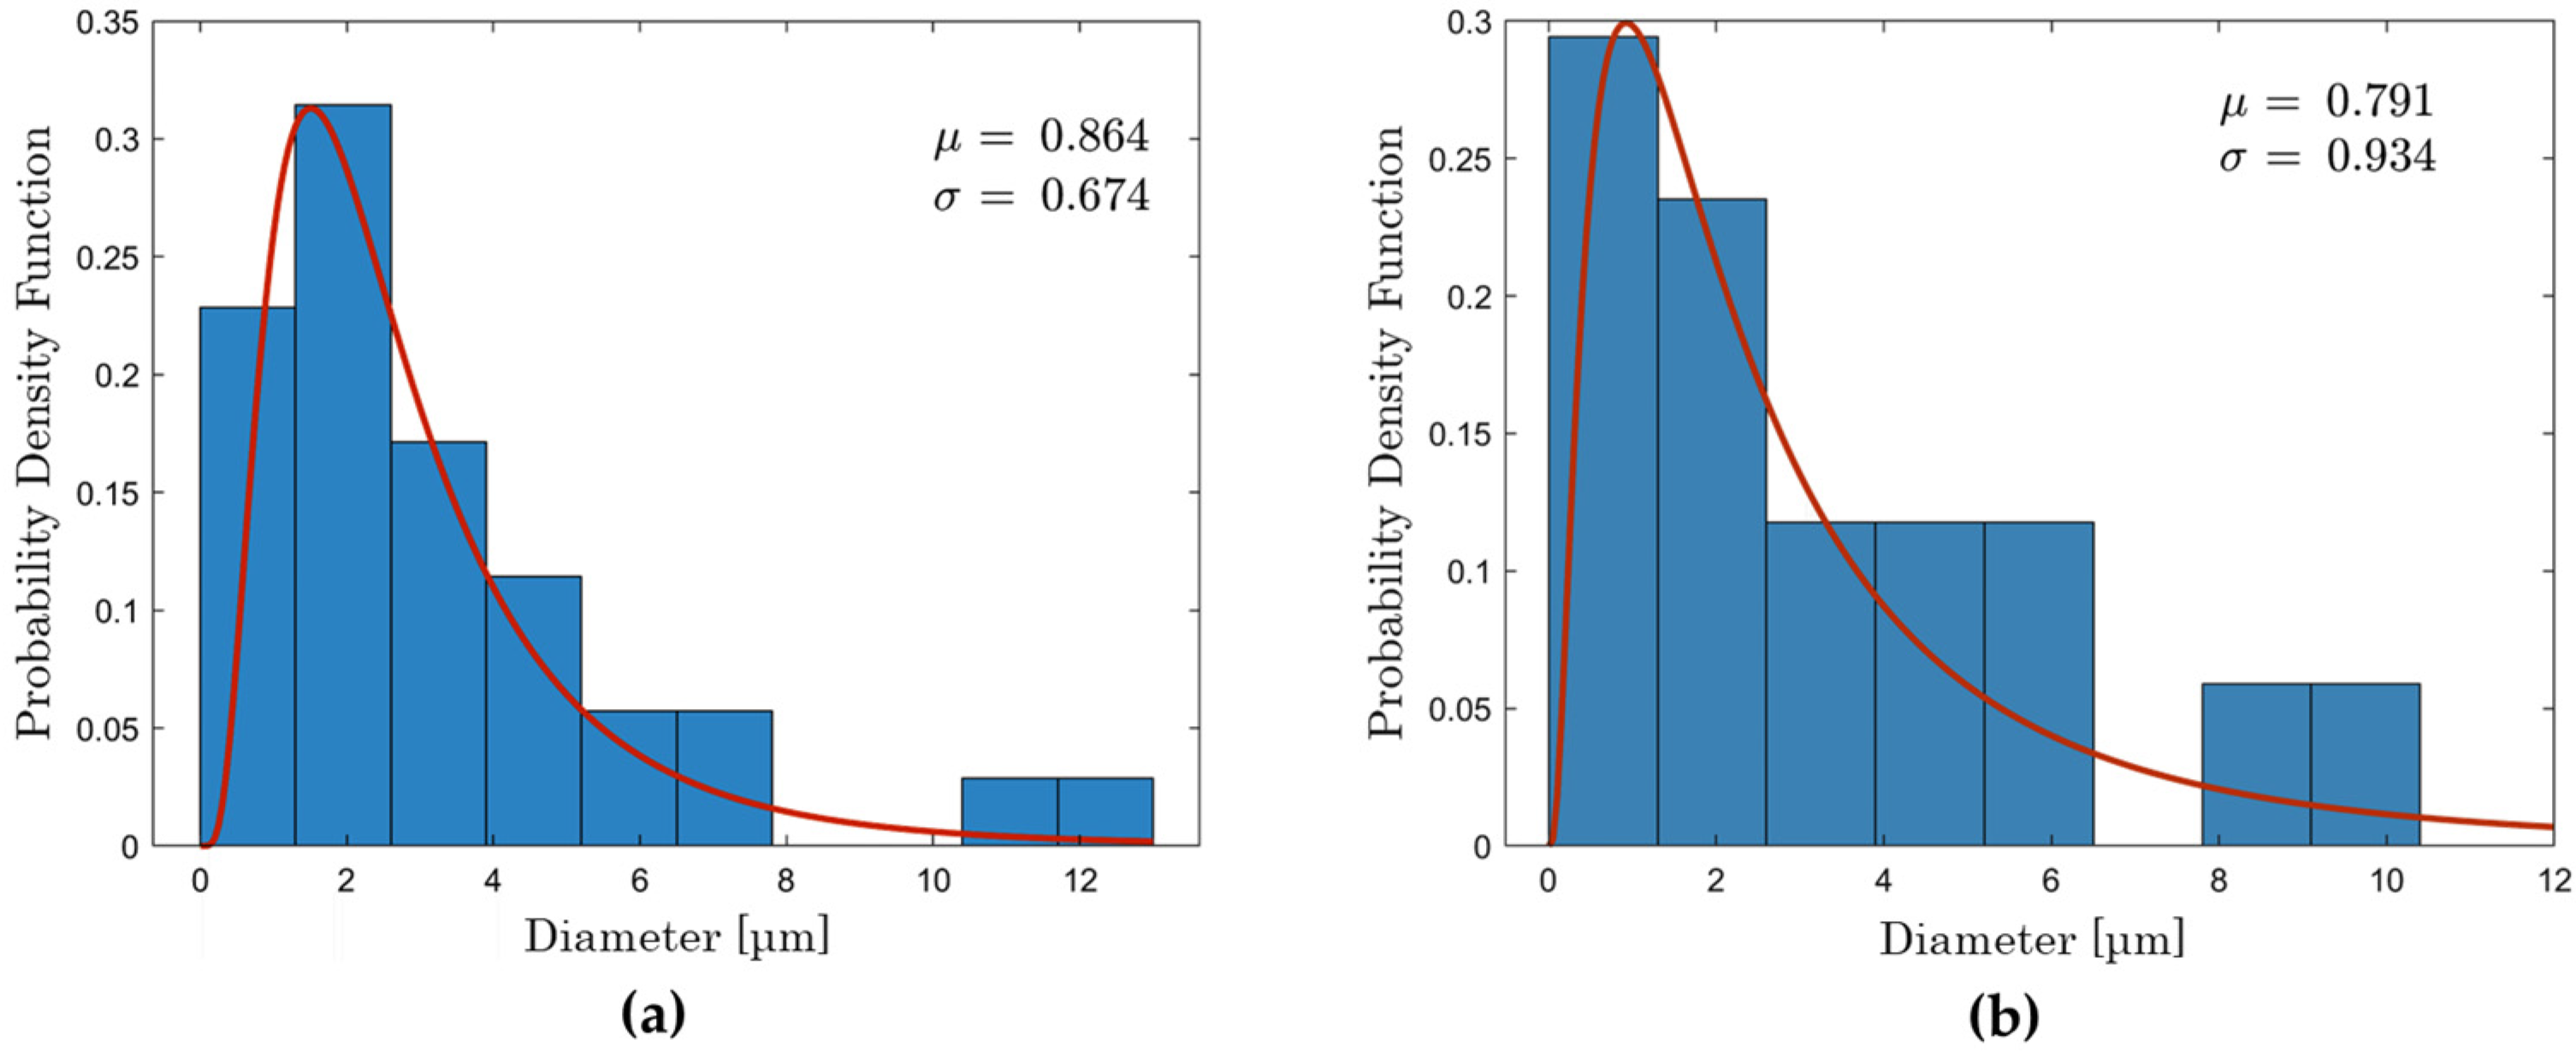
2.1. Material Statistics

In order to develop a computational framework to numerically generate material volumes with identical microstructural properties, a reference material with a simple and very well-specified microstructure was needed. Additionally, for each distinct phase, there should exist available data regarding their mechanical properties, e.g., elastic constants and stress–strain curves of the constituents. In this work, the AA7075 aluminum alloy was selected, as its microstructure has been thoroughly studied in previous works [34,39,40,41,42]. As the AA7075 alloy contains various alloying elements, mainly Zn, Mg, Fe, and Cu, the phases occurring after the precipitation hardening process may also vary [41,42]. Nonetheless, in its simplest form, the alloy can be considered to contain three main phases: one matrix α-phase, consisting predominantly of Al (~94% at.), in which η- and η′-phase (MgZn2 or of similar chemical type) nanosized particles are dispersed; two precipitate phases, one of which is Fe-bearing (Al7Cu2Fe) and the other is Si-bearing (Mg2Si). The volume fractions of the two precipitate phases are 1.29% and 0.34% for Al7Cu2Fe and Mg2Si, respectively [39,43].
For the proposed framework, the objective was to employ image data of the material’s microstructure, obtained by imaging techniques, such as SEM, TEM, or tomography. With proper processing, it is possible to calculate volume fractions as well as size distributions of the different phases. The latter may be used to statistically describe the equivalent sphere diameter (ESD) of each precipitate phase, which denotes the diameter of a sphere with a volume equivalent to those of the randomly shaped precipitates.
The first step was to utilize an SEM image of AA7075 alloy as a starting point, shown in Figure 1a. This image was segmented into three parts, as can be seen in Figure 1b, so that each grayscale color may represent the three different phases of the alloy. Next, by utilizing ImageJ software, each of the two segmented parts referring to the precipitates with a circularity between 0.20 and 1 was selected, and the particle areas were collected (Figure 1c,d).
From the ImageJ analysis, results were obtained for both the surface area fraction of each phase and the distribution of their sizes. The as-measured surface area fractions of the precipitate phases ( f A l 7 C u 2 F e and f M g 2 S i , respectively) are presented in Table 1 and compared with the volume fractions from the literature, to determine whether the image satisfactorily reflects the microstructure statistics. Relatively small differences are observed, probably due to the assumption that the surface fractions also correspond to the actual volume fractions of the bulk material.
A significant error of 59% appears for the volume fraction of the Mg2Si phase, due to the small number of available particles to be measured, compared to the Al7Cu2Fe phase. This error is non-negligible considering the phase fraction per se; however, it is negligible considering the material in its entirety, as the volume fraction of this phase is about 0.3%. For the purposes of this work, this difference is not expected to seriously affect the results.
The analysis also provided the areas ( A ) of all particles, in units of μm2, which were converted into diameter values ( d A = 4 A / π ) assuming that the particles were spherical in shape. Next, the particles’ diameter distribution was fitted with a lognormal distribution, as this distribution is often used in materials science, especially for the interpretation of grain size distribution in a polycrystalline material [44,45]. It has also been applied though for precipitates’ size distribution interpretation [46].
The probability density function (PDF) of a lognormal distribution is given by:
f ( x ) = 1 2 π σ L N exp [ 1 2 ( ln x μ L N σ L N ) 2 ] , 0 < x <
where μ L N is the mean value and σ L N is the standard deviation, which, as a function of the respective values of the normal distribution ( μ N , σ N ), are given by [47]:
σ L N = ln [ ( σ N μ N ) 2 + 1 ]
μ L N = l n μ N 1 2 σ L N 2
In total, 35 and 17 precipitate particles of the Al7Cu2Fe and Mg2Si phases, respectively, were retrieved from Figure 1. In order to build the PDF of the precipitates’ diameter, the values of μ N and σ N were calculated with respect to these measurements, as shown Figure 2. It is important to note that several diameters with lower values were eliminated in order to achieve better fitting, without anticipating that this removal would have a significant impact on the outcomes.

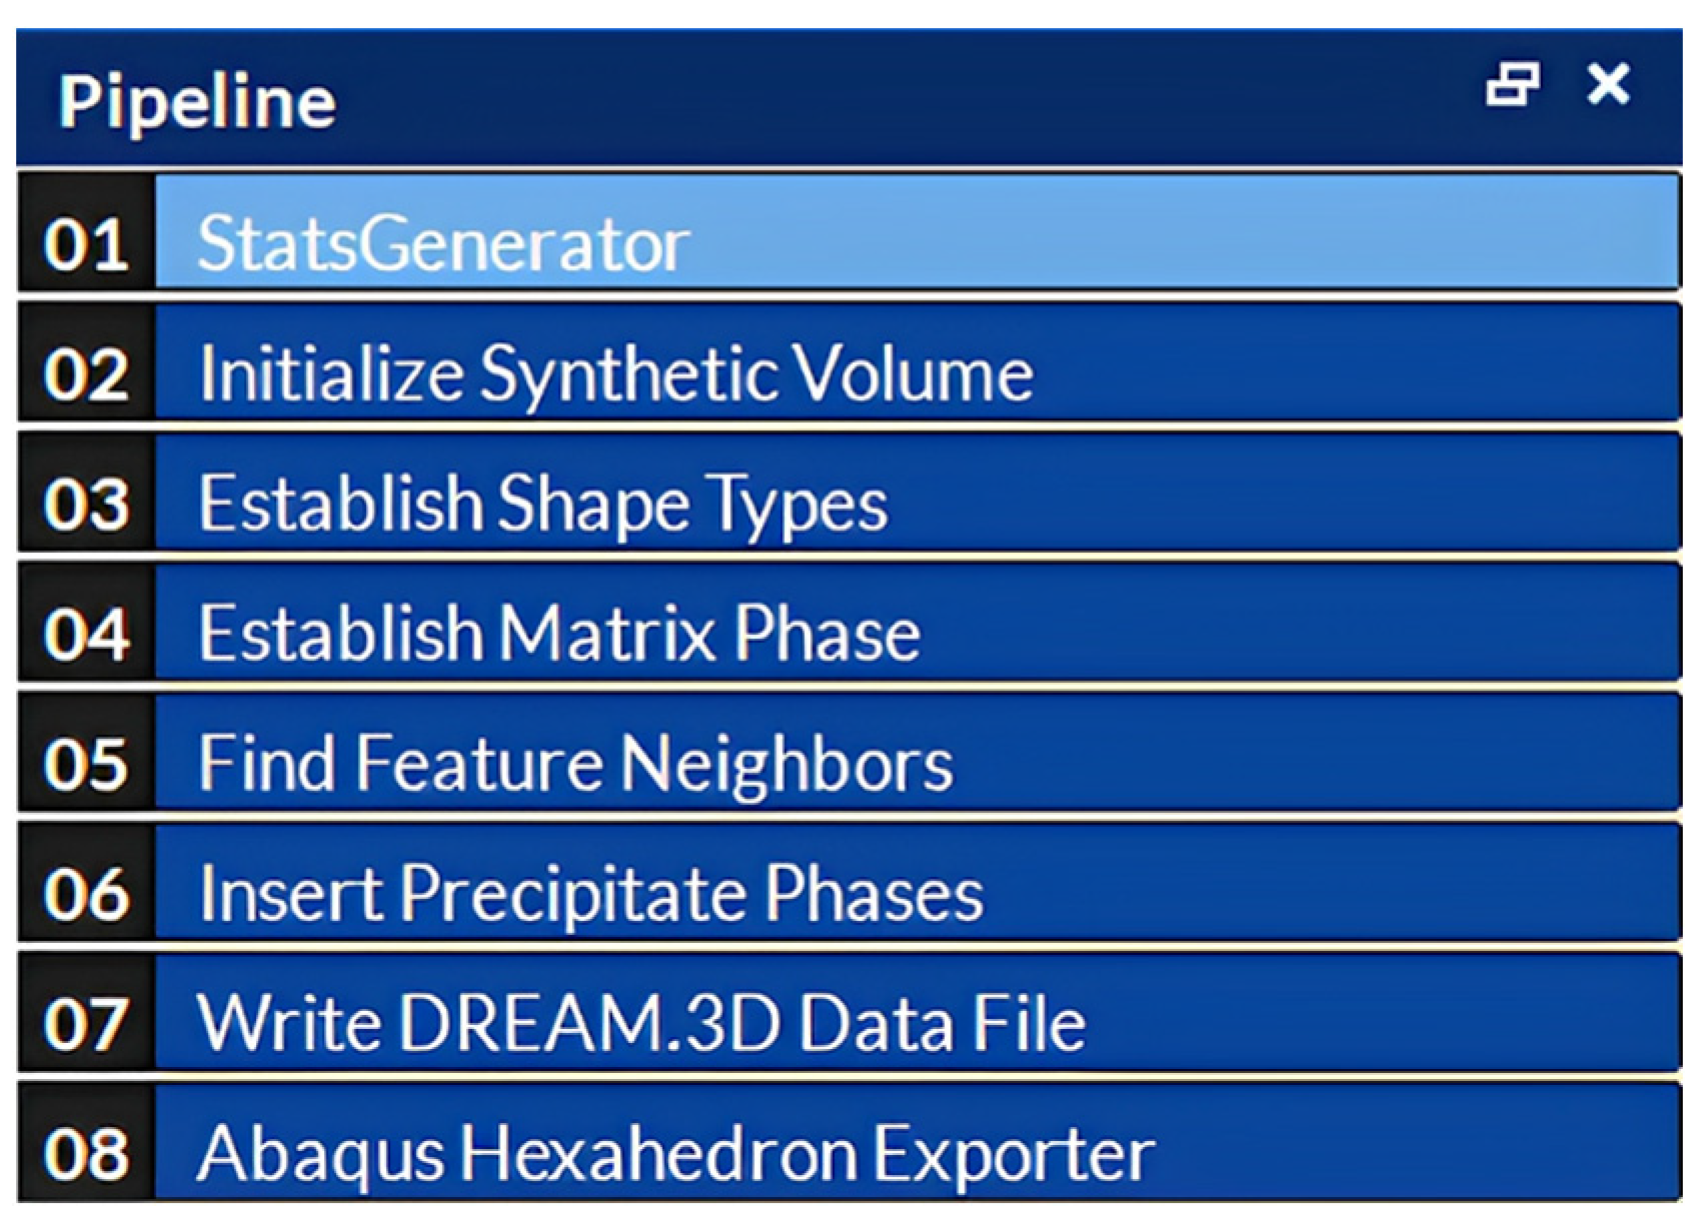
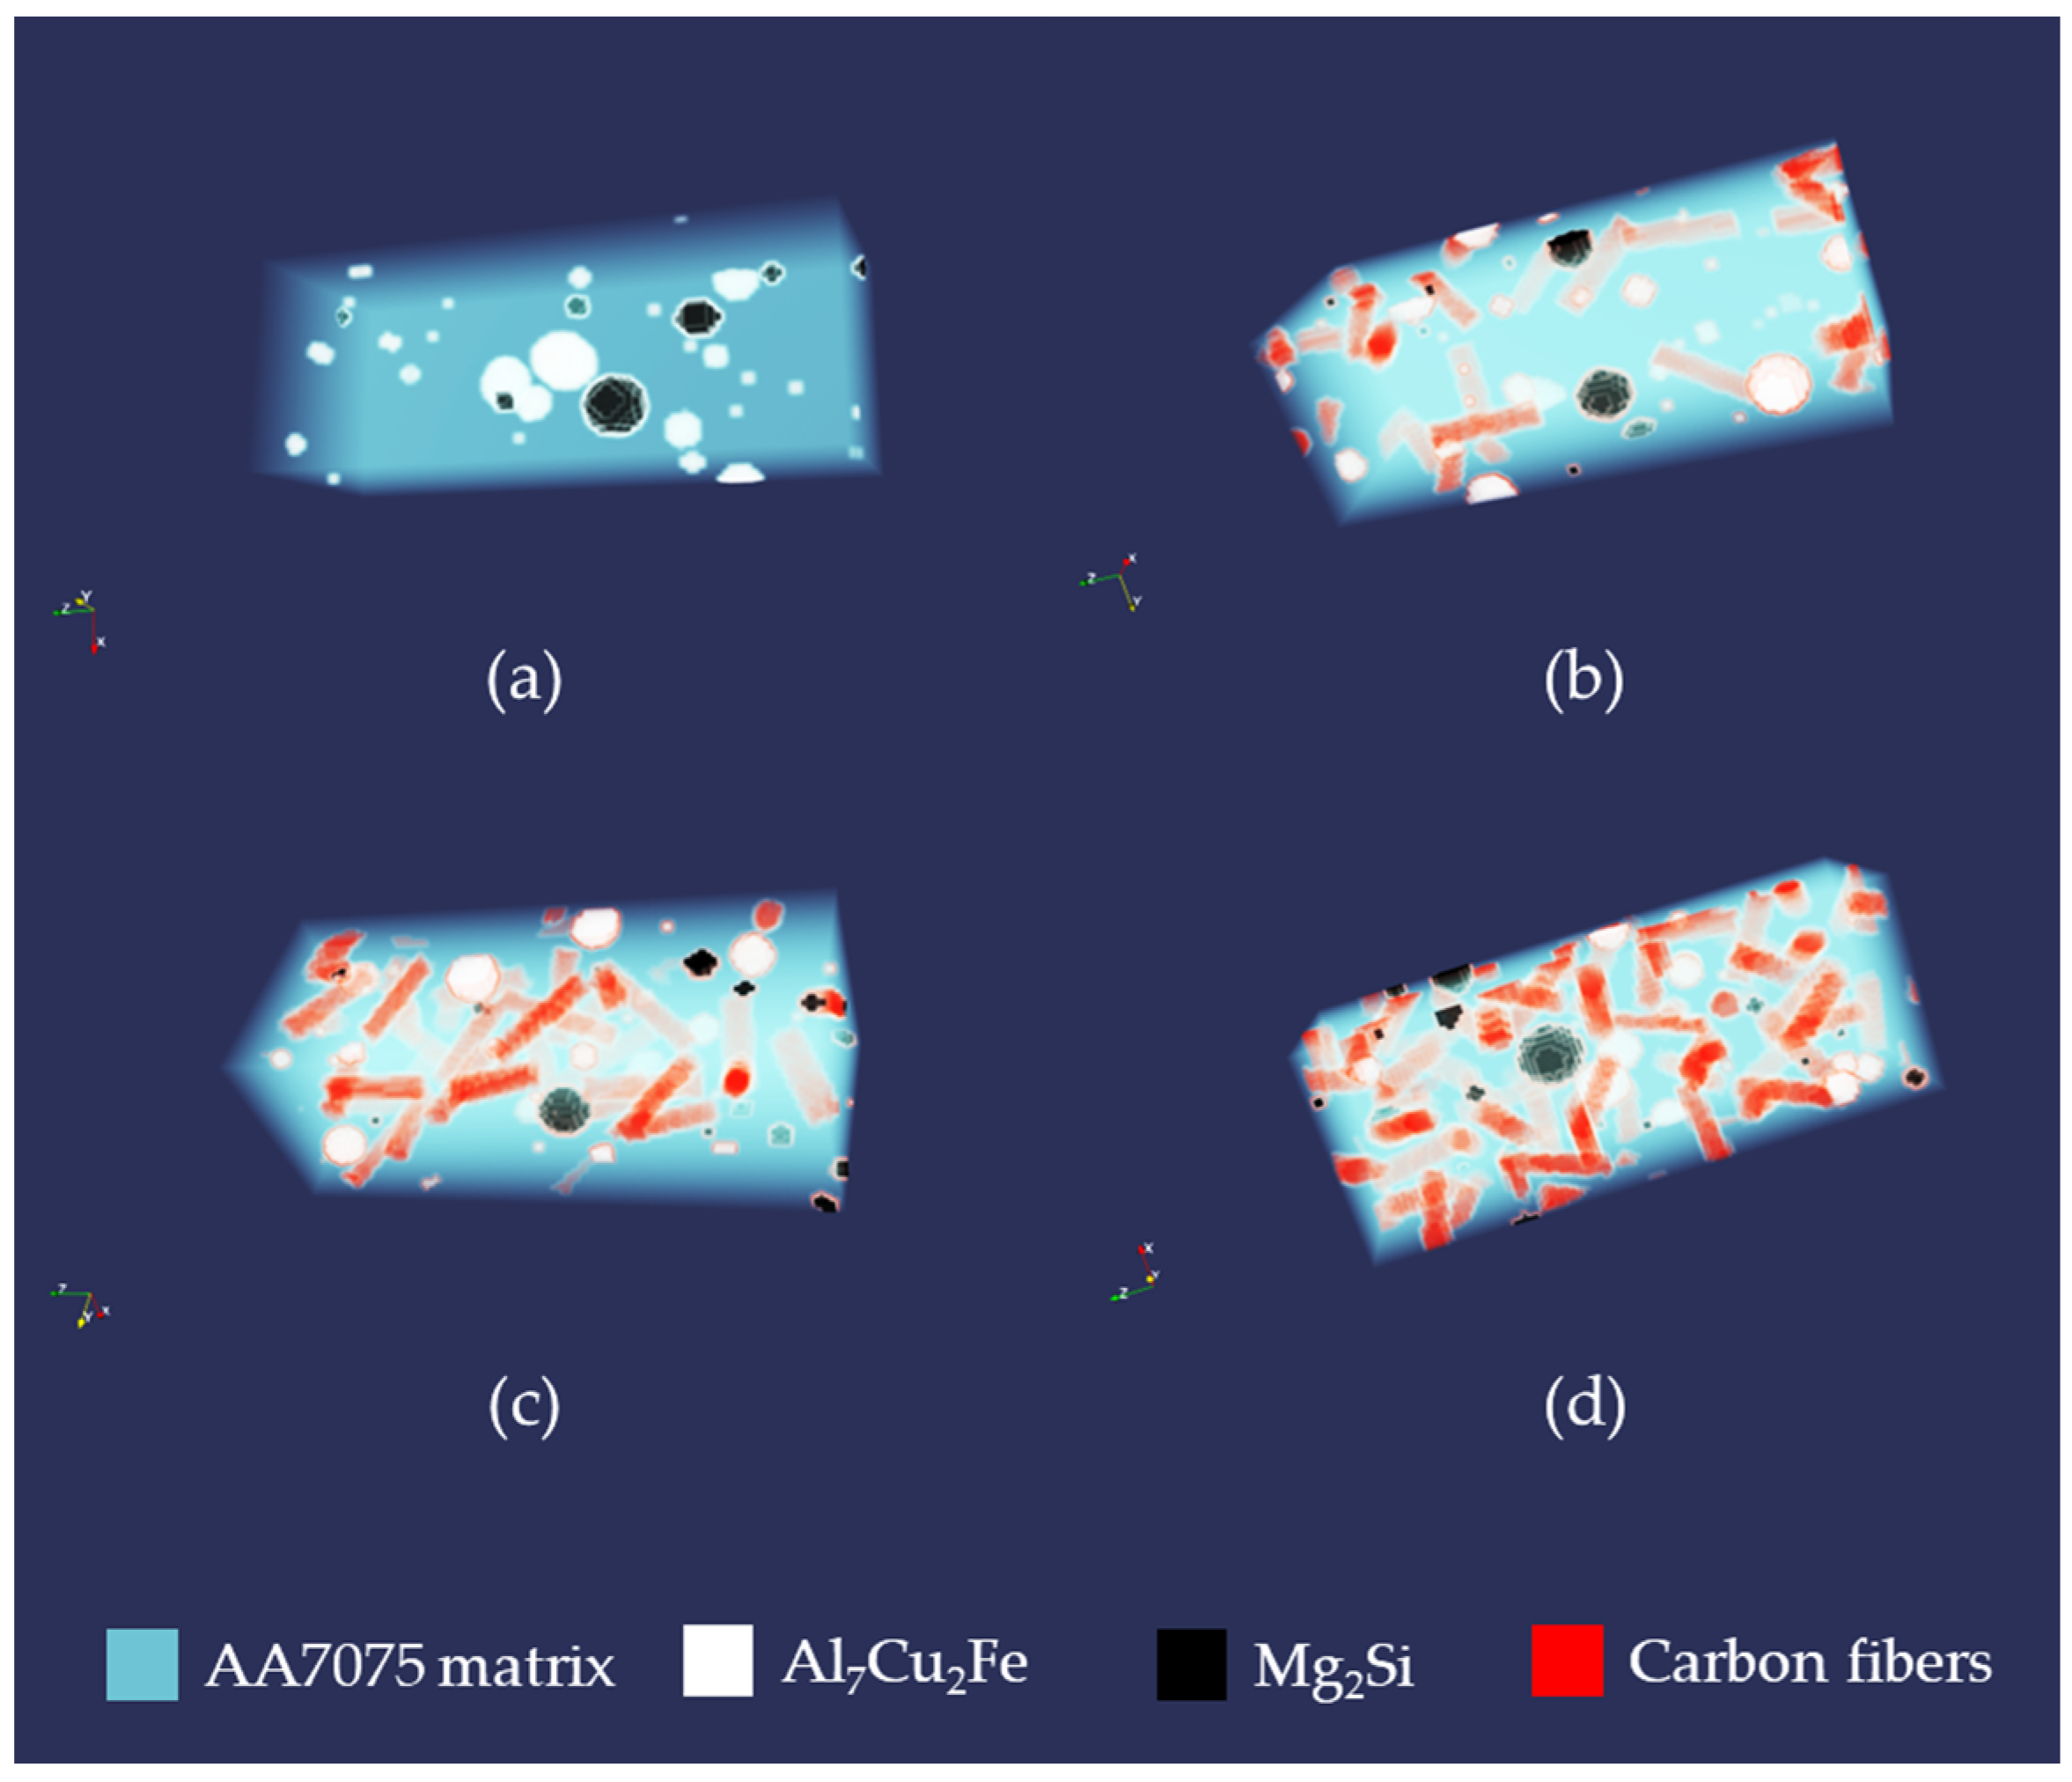
2.2. 3D Elements Building

The DREAM.3D open software package by BlueQuartz [48] was used for the development of the 3D ensemble objects (SSRVE), which represent the AA7075 alloy microstructure. Although this package is primarily utilized synergistically with EBSD data, it is possible to manufacture less detailed objects, which may serve as input for finite elements software, such as Abaqus [49]. In detail, the pipeline executed is shown in Figure 3. The “StatsGenerator” filter in the beginning of the pipeline is where the data retrieved from the previous step were inserted, i.e., the value pair ( μ L N , σ L N ) = (0.864, 0.674) for the Al7Cu2Fe phase and the value pair ( μ L N , σ L N ) = (0.791, 0.934) for the Mg2Si phase, considering that the mean values are in μm. Additionally, the volume fractions obtained were also inserted, equal to 1.19% for Al7Cu2Fe and 0.54% for Mg2Si.
As far as the volumes for the composite materials are concerned, for the definition of the carbon fibers (CFs) dispersed within the alloy matrix, no similar statistical parameters’ estimation procedure was followed. Instead, the desired fiber geometry was accomplished by selecting the pair ( μ L N , σ L N ) = (1.95, 0.01), to create fibers of 7 μm in diameter and 30 μm in length. The aforementioned diameter value was chosen according to the T700S fiber filament diameter and the aforementioned length according to the average length of the fibers manufactured by Wu et al. [38]. With the “Initialize Synthetic Volume” filter, an ensemble of 40 μm × 40 μm × 100 μm was selected. Next, with the “Establish Shape Types” filter, an ellipsoidal shape for the precipitates and a cylindrical one for the CF were chosen.
By adjusting the fraction ratios of the CF, in addition to the pure AA7075 alloy, SSRVEs for AA7075/CF MMCs with volume fractions equal to 4%, 8%, and 12% were created, again in accordance with Wu et al. [38]. The created ensembles for the alloy and the MMCs were observed with Paraview 5.10.1 (Figure 4). By modifying the CF dimensions ratio, ensembles with different aspect ratios were generated, namely with the same diameter as previously and lengths of 15, 30, and 45 μm. This modification was conducted for 8% MMCs and the corresponding ensembles are shown in Figure 5.

2.3. Finite Element Analysis Simulations

Abaqus FEA input files were generated as a result of the DREAM.3D pipeline execution. The element type created for all input files was the general-purpose C3D8 with 8 integration points and each ensemble consisted of 160,000 such elements, given that the chosen dimensions were 40 × 40 × 100. In order to perform tensile test simulations on the created SSRVEs, a designation of the mechanical properties of each phase was necessary. For the three AA7075 phases, the stress–strain curves obtained by Singh et al. [40] were employed. In that work, micropillar compression experiments were conducted for each phase. In the present work, the mechanical properties of each phase were obtained from the corresponding stress–strain curves (elastic modulus, yield stress, strain hardening modulus). For CF, the mechanical properties were taken from [50,51]. For all materials, a Poisson’s ratio of 0.3 was assumed. The mechanical properties used in the simulations are presented in Table 2. It is worth noting that the Al7Cu2Fe precipitate phase and the CF have brittle mechanical behavior, in contrast to the alloy matrix and the Mg2Si precipitate phase. This is an important note for the framework performance because, for large deformations, the FEA model may malfunction and eventually crash.
Both elastic and plastic behaviors were evaluated. For the elastic region, an isotropic linear model was selected, as very low deformations were to be applied. No dependency on temperature or other variables was incorporated. For the plastic region, an isotropic hardening law was selected, again not including any additional dependencies. Regarding contact properties between the phases, the default contact property model was selected, which assumes zero friction and no thermal interactions.
For the pure alloy samples, an elongation up to 3.0% was applied. For the 30:7 MMC samples with f equal to 4%, 8%, and 12%, elongations up to 2.0%, 1.6%, and 1.4%, respectively, were applied. This difference was due to simulation errors occurring with increasing CF content, possibly, as was mentioned, due to their brittle behavior. For 8% MMC samples with different CF aspect ratios, an elongation up to 1.2% was applied. Four samples were used for each type of MMC. By dividing each loading simulation in 8 different steps and by plotting the corresponding reaction force of each step as a function of elongation, corresponding stress–strain curves were obtained. The computational times of the simulations were typically between 2 and 4 h.

3. Results

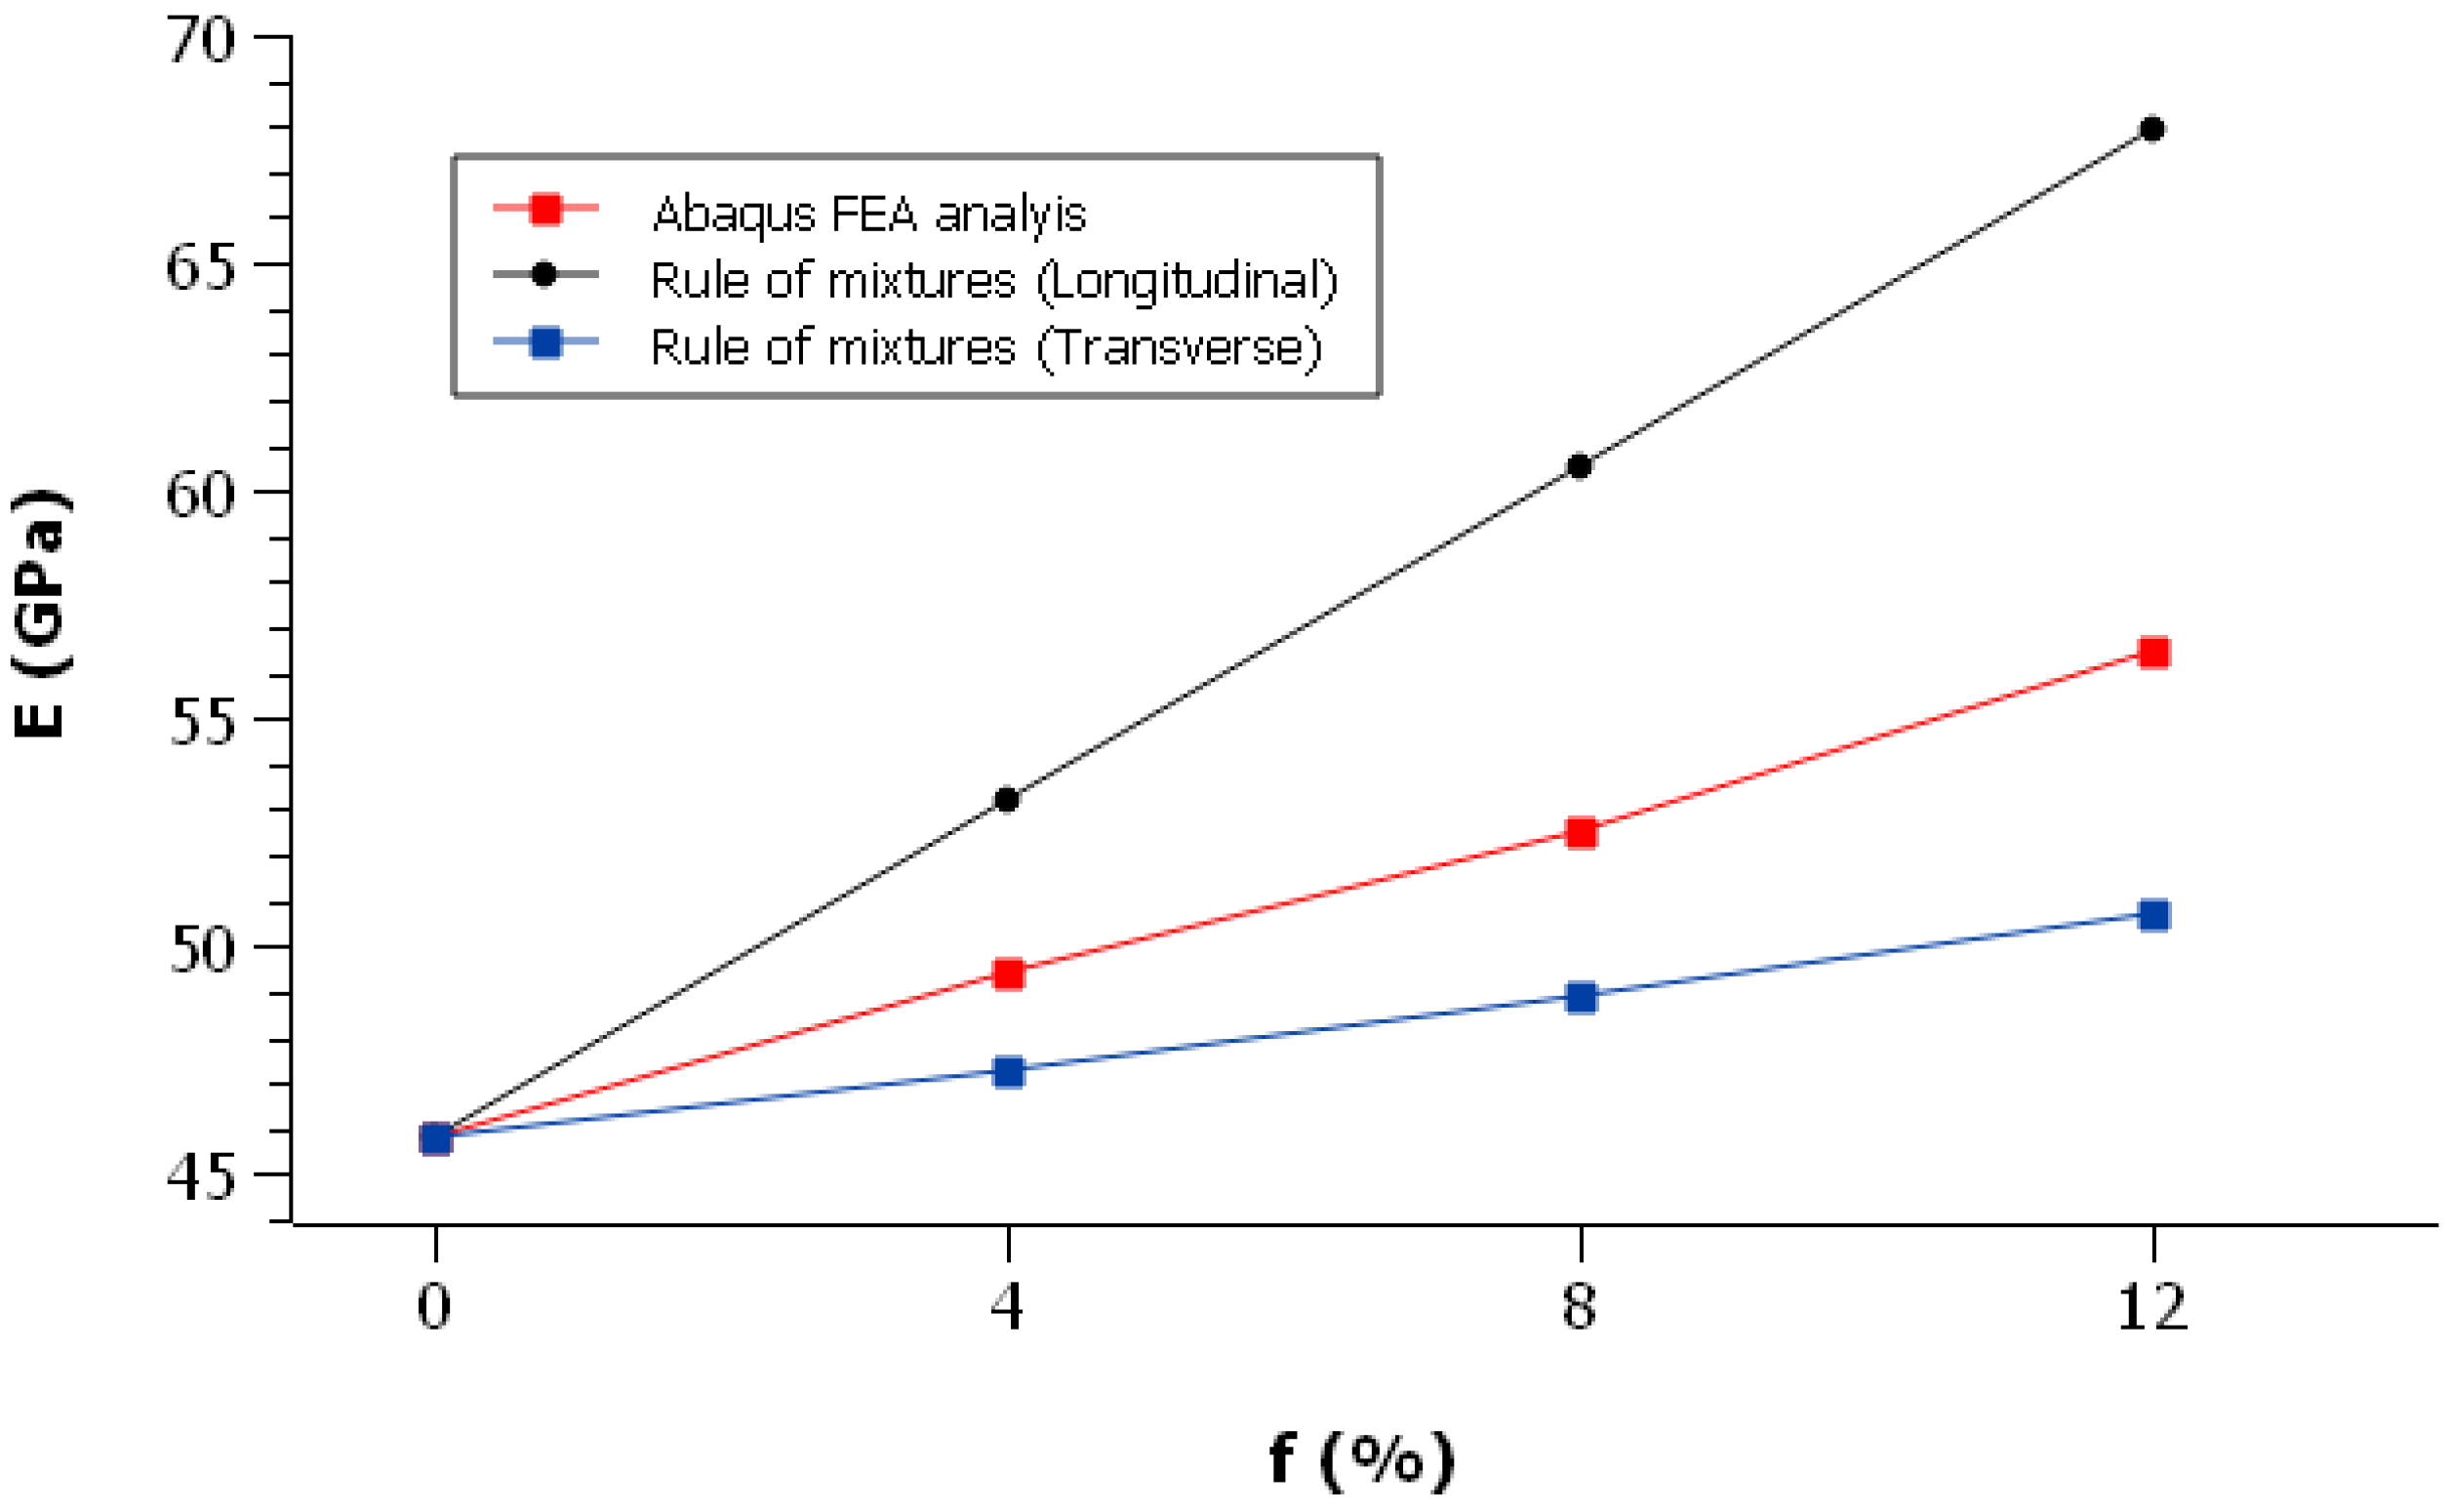
3.1. Elastic Moduli Dependence on CF Content

In continuous fiber composites, the contribution of the reinforcing phase is initially reflected on the change in the elastic modulus, which varies linearly with respect to the corresponding moduli of the alloy and the reinforcement, according to the rule of mixtures. This rule also serves as the theoretical foundation according to which the drawn results are evaluated. In composites with unidirectional fibers, the elastic modulus varies with the stress direction. Thus, for a stress applied in the direction of the fibers, the modulus of elasticity of the composite ( E c t ) is expressed as:
E c t = E m ( 1 f ) + E f f
where f stands for the fiber volume fraction and E m , E f stand for the elastic moduli of the alloy and the fibers, respectively. For stress applied normal to the direction of the fibers, E c t is expressed as:
1 E c t = 1 f E m + f E f
Figure 6a depicts the tensile stress application along and perpendicularly to the direction of the fibers. Figure 6b shows a fibrous composite with discontinuous fibers and a random directional distribution. In this configuration, a linear relationship holds again, taking into account a fiber efficiency parameter, Κ , according to the relation:
E c t = E m ( 1 f ) + Κ E f f
Parameter Κ (Krenchel parameter) is less than 1, usually between 0.1 and 0.6. Its value strongly depends on the geometry and orientation of the amplifying phase [52].
A typical 160,000-element ensemble with features representing the precipitates and the CF is shown in Figure 7 for an MMC with f = 12% as an example. The tensile stress simulation of the same sample results in the deformed shape shown in Figure 8, with regard to the total strain (Figure 8a) and von Mises stress averaging at 75% (Figure 8b).
Figure 9 shows the stress–strain curves of the four types of MMCs tested, for elongations of up to 1.4%. In total, 16 simulations (four for each volume fraction f ) were carried out. It is noted that with increasing CF volume fraction, the elastic modulus also increases. Comparing the results of the simulation with those of [38], it is concluded that there is no close match for room temperature; a higher elastic modulus value for pure AA7075 is found and almost the same value is found for the three MMCs with f = 4%, 8%, and 12%. Nevertheless, the present results match more closely with those of [38] for 100 ℃, as well as those by Quadros et al. [53], who found that with increasing CF content, the elastic modulus increases almost linearly.
The elastic moduli that correspond to the curves of Figure 9 are shown in Figure 10. On the same plot, the values expected from uniaxial tensile stress in the longitudinal and transverse direction for the continuous-fiber-reinforced composite are presented, as described by Equations (4) and (5). In these equations, E m was considered to be equal to 45.8 GPa, which is the slope of the elastic part of the pure alloy curve in Figure 9. Theoretically, the conducted results should be between the curves corresponding to these two equations and, more specifically, match Equation (6), as the MMCs are considered discontinuous, with their length-to-diameter ratio being less than 100 [37,54]. Indeed, this trend is followed and, using Equation (6), the values of K are estimated as 0.59, 0.56, and 0.59 for 4%, 8%, and 12% MMCs, respectively.

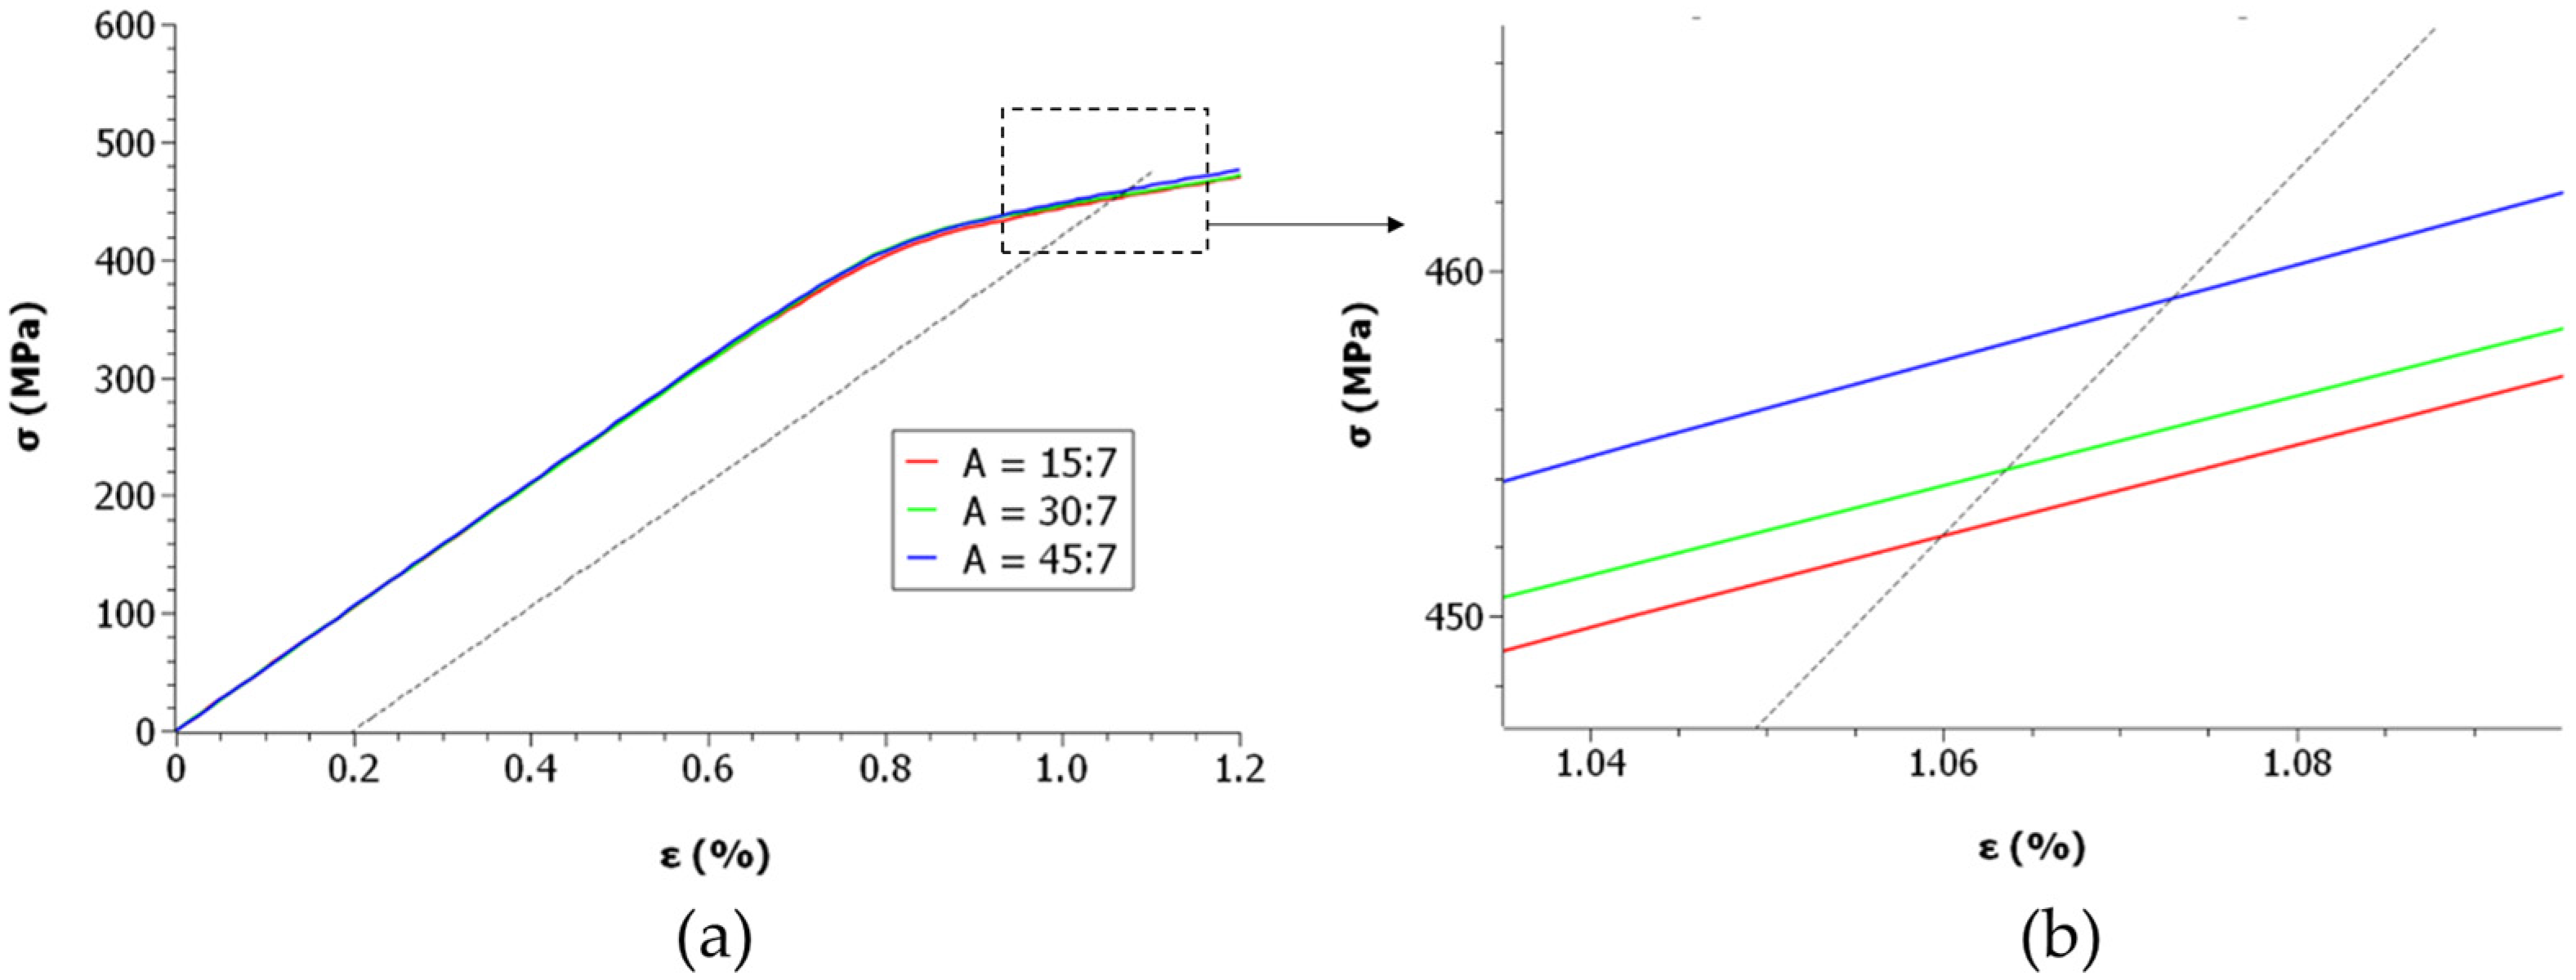
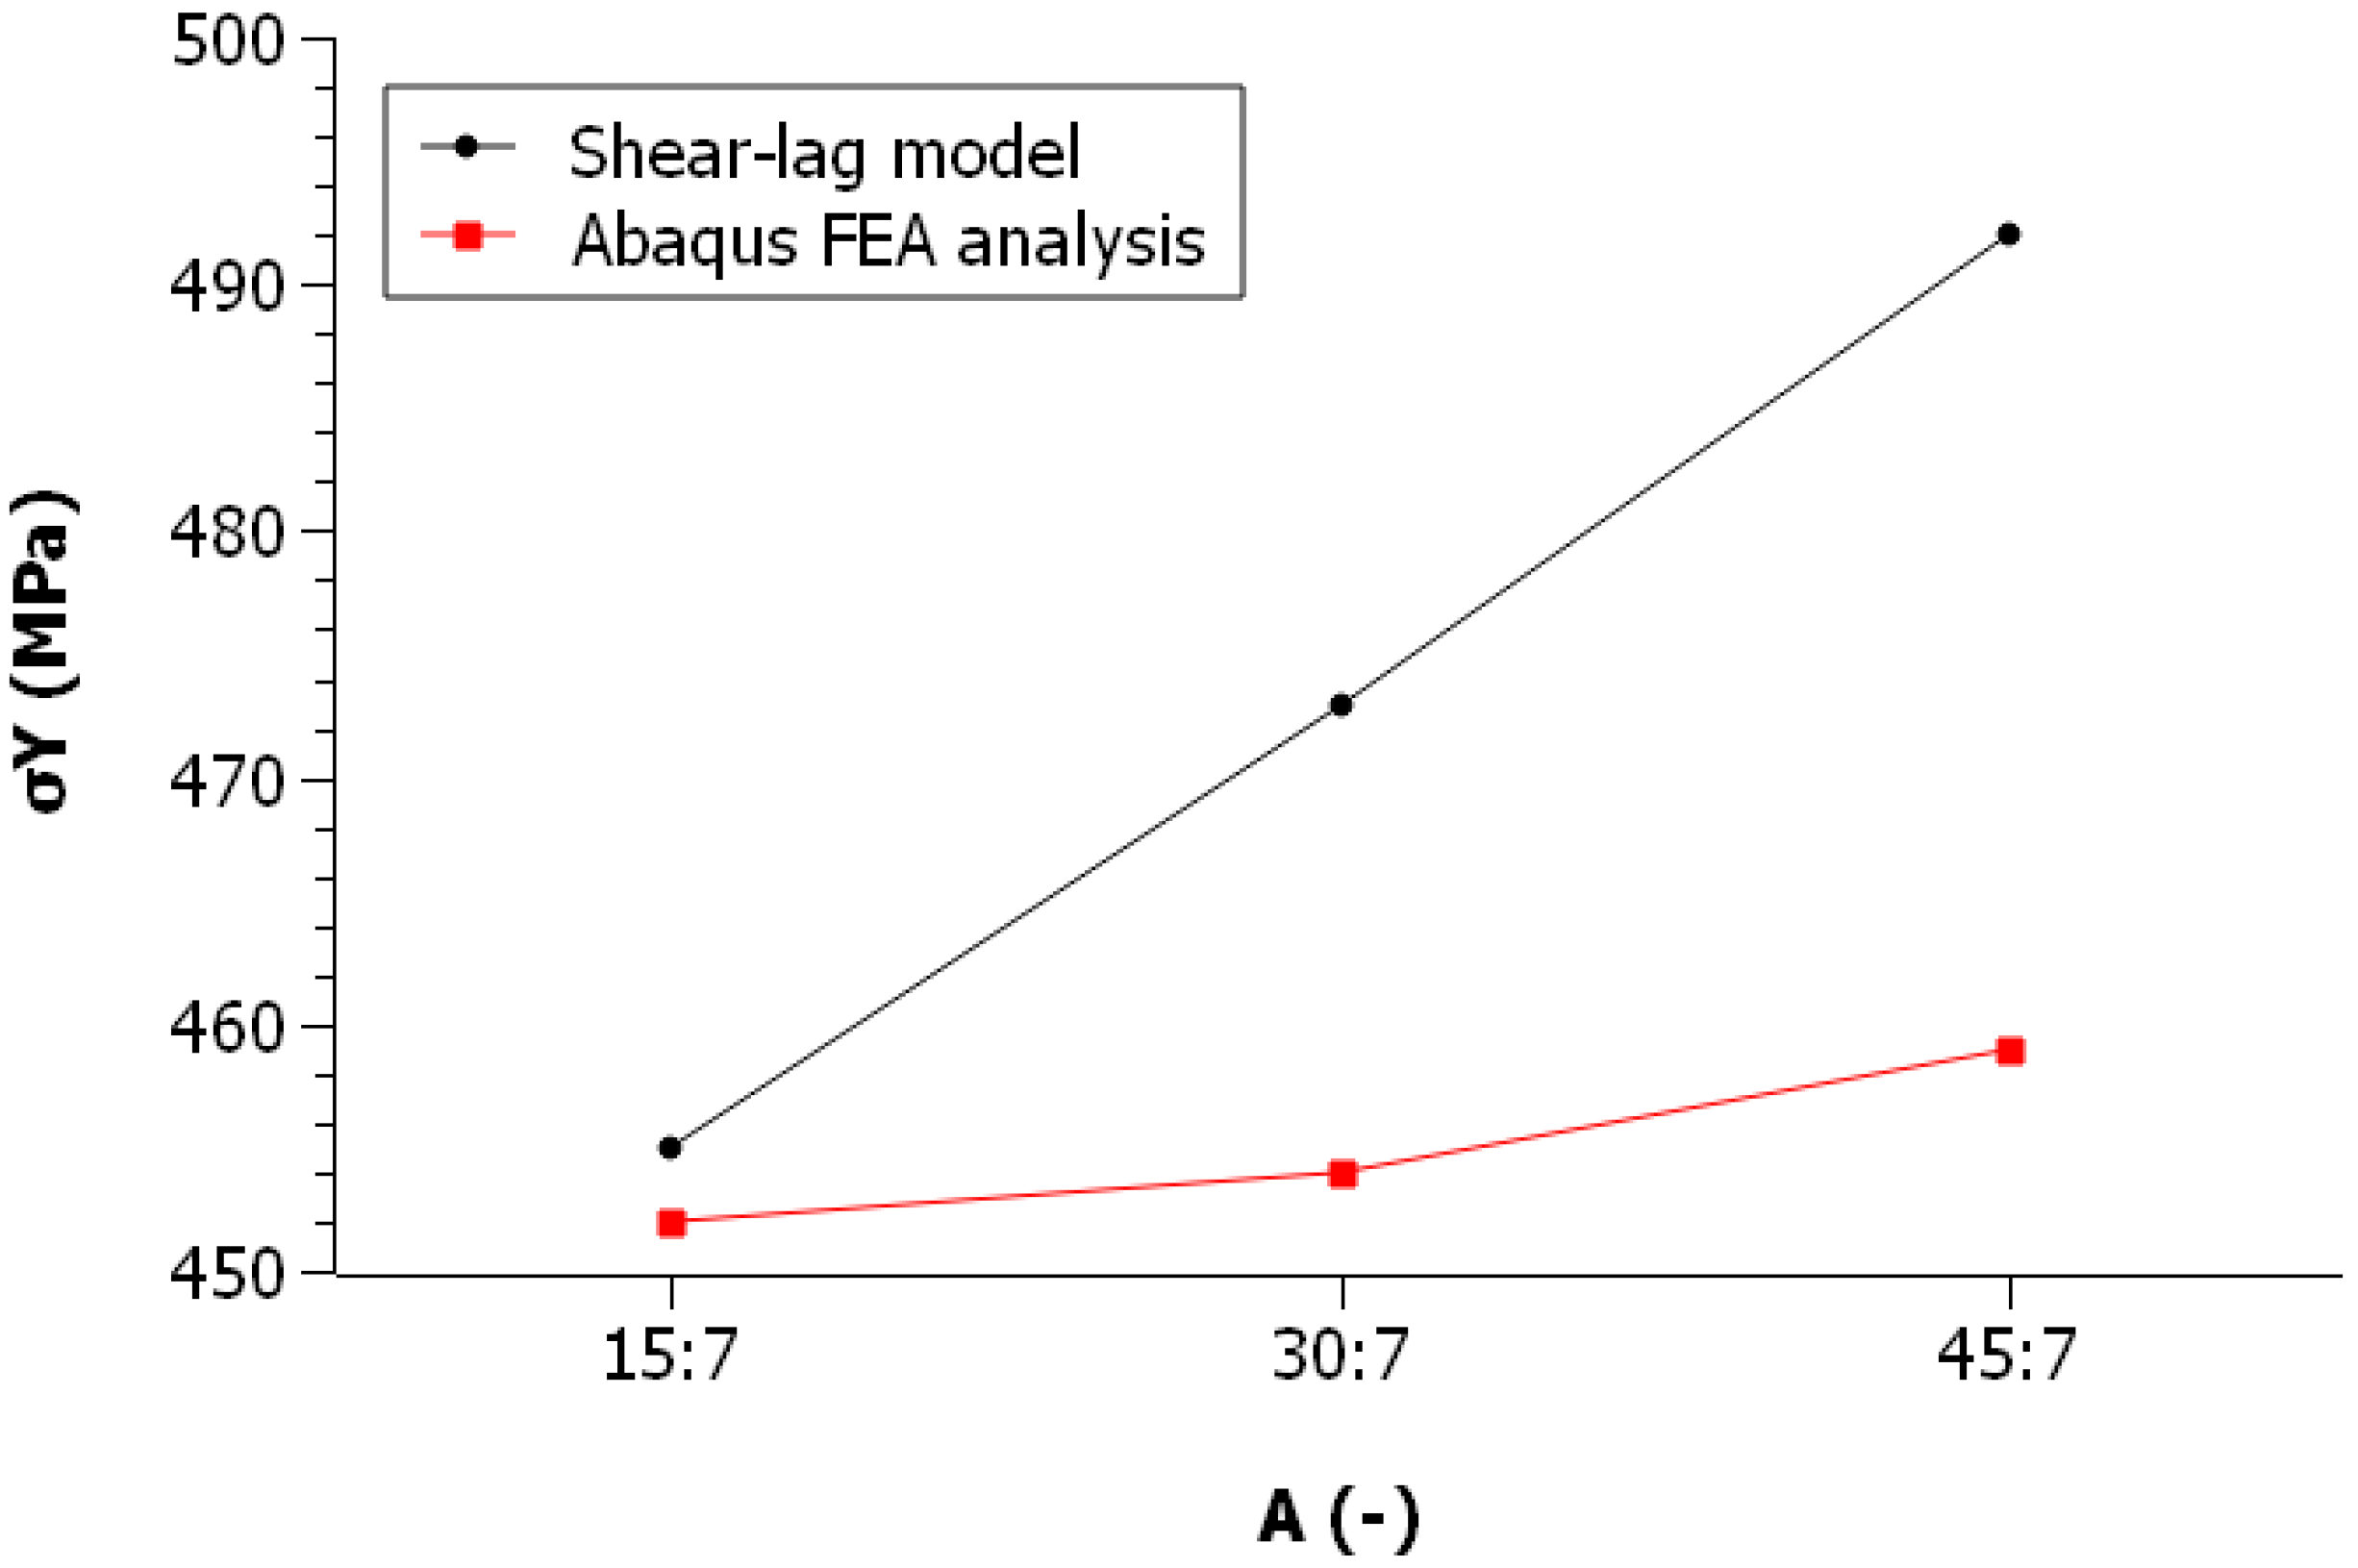
3.2. Yield Stress Dependence on CF Content and Aspect Ratio

In MMC mechanics, there are numerous mechanisms via which an increase in yield stress may take place, including load transfer, dislocation strengthening due to thermal expansion mismatch, thermal residual stress, grain refinement, and Orowan strengthening [37,38,55]. In this work, the assessment of the influence of the most important factor, the load transfer mechanism, was attempted. This mechanism has been described by several models, the most common of which is the shear-lag model, according to which it is presumed that there is a perfect connection between the matrix and the fiber ends as well as a single orientation. In this case, the increase in yield stress is given by:
Δ σ = σ M [ 1 + ( L + t ) A 4 L ] f + σ M ( 1 f ) σ M = σ M f A + 1 4
where L is the fiber length in the stress direction, t the fiber size perpendicular to the stress direction, A the aspect ratio ( L / t ), and σ M the alloy yield stress [38].
At first, the 0.2% offset yield stress values of the composites were calculated from the corresponding curves of Figure 9, equal to 428, 451, 473, and 496 MPa for the 0%, 4%, 8%, and 12% MMCs, respectively. The results are displayed in Figure 11, compared with the ones predicted by Equation (7), assuming that σ Μ is equal to 428 MPa. There is a deviation from the model’s predictions, which is reasonable due to the random arrangement of CFs. The deviation increases with an increase in the volume fraction of CFs.
The next step was to examine whether the A ratio affects the yield stress of the composites, again according to the same model, and whether this can be observed through the framework. Thus, by performing tensile simulations on specimens of the same volume fraction ( f = 8%), same fiber diameter ( t = 7 μm), and different fiber lengths ( L = 15, 30, and 45, respectively), the results are plotted in Figure 12a. As can be seen, these curves show no noticeable difference, but only a minimal difference in the slope of the strain hardening curves. Zooming in on the yield stress region for ε = 0.2% (Figure 12b), it is observed that the yield stress increases slightly with increasing A . The increasing trend is expected based on the shear-lag model; however, the values expected from the model differ significantly from the ones calculated, a reasonable difference due to the random arrangement of CF in the matrix. Figure 13 shows the values of the shear stress as found from the Abaqus FEA analysis and the corresponding values as predicted by the shear-lag model. An increase in the difference with increasing CF volume fraction is observed, as in the previous case.

4. Conclusions

The present work introduced a computational framework that aims to make use of data regarding the microstructural characteristics of composite materials and the mechanical properties of each phase, in order to predict the composite’s macroscopic mechanical behavior. Overall, the framework is able to:
  • Extract statistical data describing the microstructure of AA7075 alloy and match the extracted surface fraction with the volume fraction of each phase;
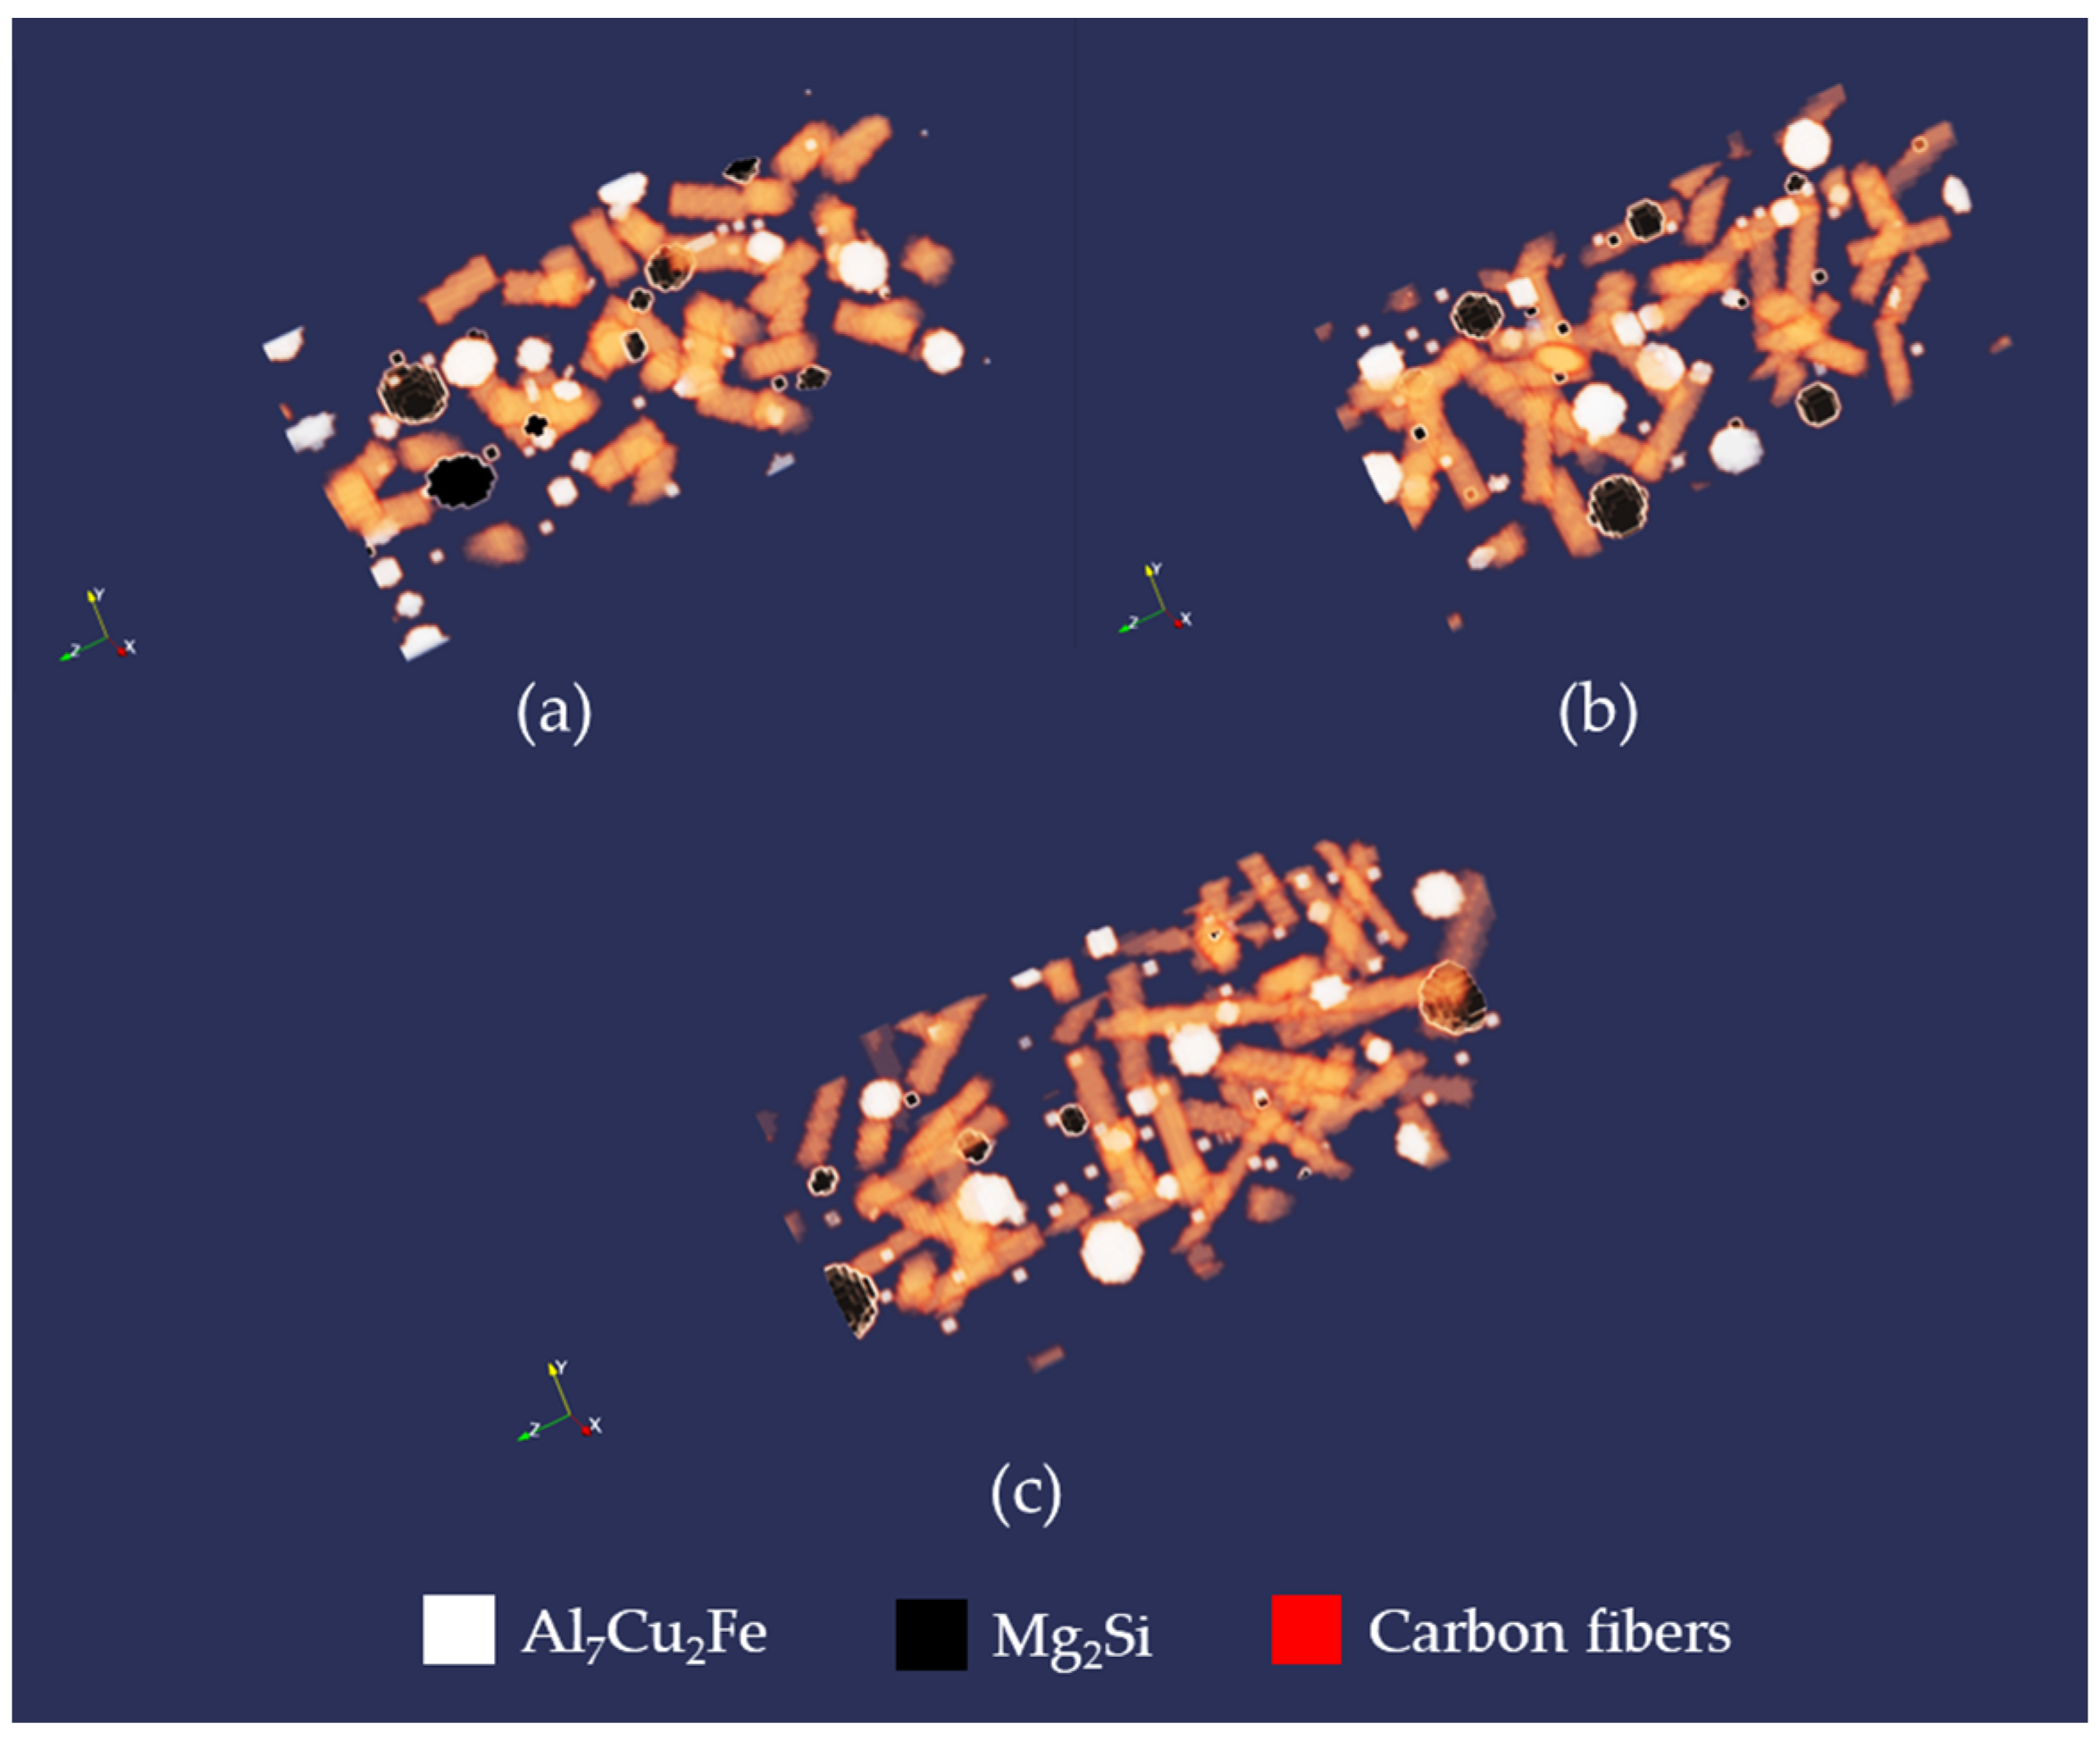
  • Build 3D SSRVEs by employing the DREAM.3D package, representing the two precipitate phases present in the alloy;
  • Insert carbon fibers with the desired volume fraction and shape morphology, to mimic the microstructure of a randomly oriented MMC with discontinuous fibers;
  • Perform tensile testing simulations with Abaqus FEA to these SSRVEs having appropriately adjusted the mechanical properties of each phase;
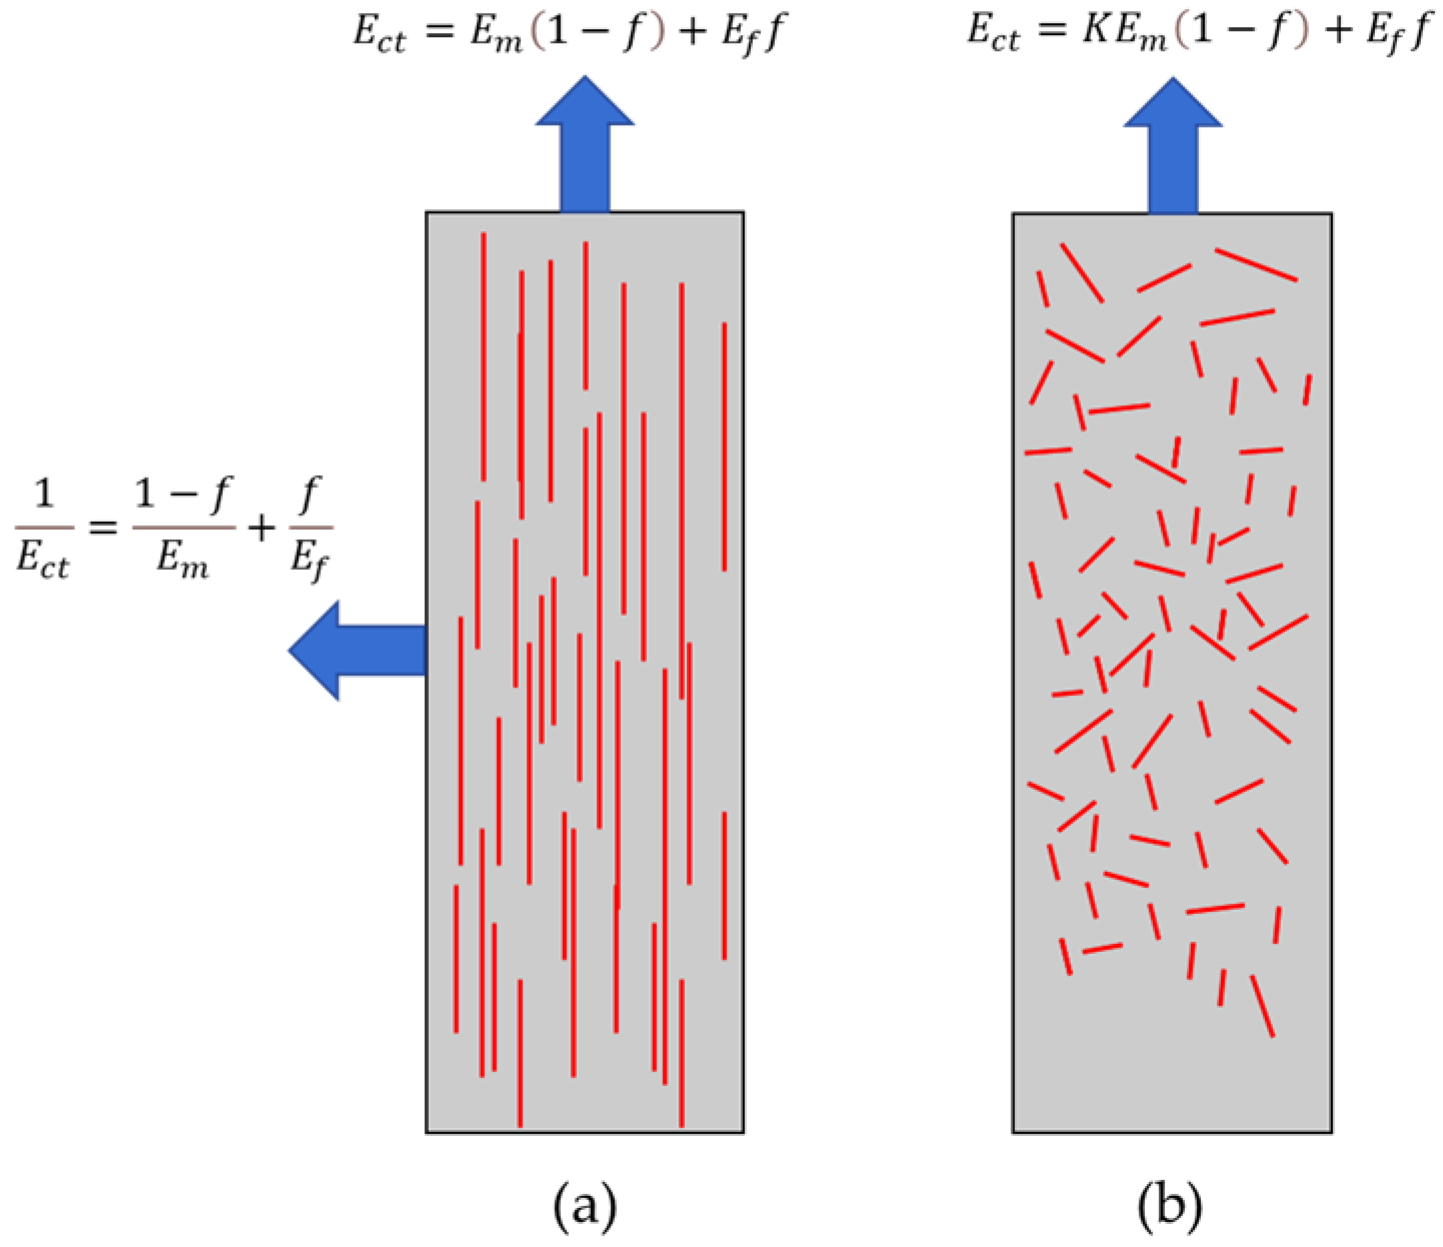
  • Assess the macroscopic mechanical behavior of MMCs with respect to the volume fraction and the aspect ratio of CF by comparing this performance with that theoretically expected from fiber composite mechanics.
Starting from the statistics retrieval stage, it becomes apparent that more than one microscopy image is required to precisely represent the statistics of the material. The procedure outlined for obtaining the statistics, namely the SEM image segmentation, the color-based thresholding of each phase, the particle discretization, and, finally, the particle size measurement, is suggestive of yielding satisfactory results, close to the expected ones, even assuming that the surface coverage fractions of the image correspond to the volume fractions of each phase. Certainly, by employing a larger number of images, more reliable data will be obtained for both the volumes and the statistics of each phase.
The process of building 3D digital data with DREAM.3D by utilizing the statistical parameters for the microstructure is highly efficient, as it was possible to convert 2D data into 3D data in a relatively fast and automated way. It was shown that inclusions of various shapes and sizes can be included within the ensemble and, thus, represent various types of particles, whether they are precipitates of alloys, which are the result of heat treatment, or whether they are reinforcing phases. Different types of reinforcing phases, either fibrous or shaped otherwise, such as particles or platelets, can also be introduced. In addition, it is also possible to simulate other types of composites, such as polymer or ceramic matrix composites or even structural materials (concrete).
Finally, it was shown that the mechanical properties of MMCs as a function of the volume fraction and aspect ratio of CFs seem to confirm, up to a certain extent, the expected mechanical behavior of real fibrous composites. In particular, the validity of the rule of mixtures for the elastic modulus was shown, as well as an indication of the validity of the shear-lag model. As the micromechanical phenomena governing fibrous composites are quite complex, no further study of them was attempted in this work but, with appropriate use of the tools described, a more thorough investigation could be attempted.

Author Contributions

Conceptualization, A.K.; methodology, A.K.; software, I.M. and L.-A.K.; validation, I.M. and L.-A.K.; writing—original draft preparation, I.M.; writing—review and editing, A.K. and L.-A.K.; visualization, I.M. All authors have read and agreed to the published version of the manuscript.

Funding

This research received no external funding.

Institutional Review Board Statement

Not applicable.

Informed Consent Statement

Not applicable.

Data Availability Statement

Not applicable.

Conflicts of Interest

The authors declare no conflict of interest.

References

  1. Chen, B.; Jansenss, K.; Dunne, F.P.E. Role of Geometrically Necessary Dislocation Density in Multiaxial and Non-Proportional Fatigue Crack Nucleation. Int. J. Fatigue 2020, 135, 105517. [Google Scholar] [CrossRef]
  2. Pinz, M.; Weber, G.; Lenthe, W.C.; Uchic, M.D.; Pollock, T.M.; Ghosh, S. Microstructure and Property Based Statistically Equivalent RVEs for Intragranular Γ−γ’ Microstructures of Ni-Based Superalloys. Acta Mater. 2018, 157, 245–258. [Google Scholar] [CrossRef]
  3. Lane, R.J.; Momen, A.M.; Kesler, M.S.; Brechtl, J.; Rios, O.; Nawaz, K.; Mirzaeifar, R. Developing an Experimental-Computational Framework to Investigate the Deformation Mechanisms and Mechanical Properties of Al-8Ce-10Mg Alloys at Micro and Macroscales. Mater. Today Commun. 2021, 28, 102674. [Google Scholar] [CrossRef]
  4. Tu, X.; Shahba, A.; Shen, J.; Ghosh, S. Microstructure and Property Based Statistically Equivalent RVEs for Polycrystalline-Polyphase Aluminum Alloys. Int. J. Plast. 2019, 115, 268–292. [Google Scholar] [CrossRef]
  5. Zhang, X.X.; Andrä, H. Crystal Plasticity Simulation of the Macroscale and Microscale Stress–Strain Relations of Additively Manufactured AlSi10Mg Alloy. Comput. Mater. Sci. 2021, 200, 110832. [Google Scholar] [CrossRef]
  6. Hajizad, O.; Kumar, A.; Petrov, R.H.; Sietsma, J.; Dollevoet, R.; Li, Z. Strain Partitioning and Damage Initiation in a Continuously Cooled Carbide Free Bainitic Steel. Comput. Mater. Sci. 2022, 202, 110965. [Google Scholar] [CrossRef]
  7. Diehl, M.; Groeber, M.; Haase, C.; Molodov, D.A.; Roters, F.; Raabe, D. Identifying Structure–Property Relationships Through DREAM.3D Representative Volume Elements and DAMASK Crystal Plasticity Simulations: An Integrated Computational Materials Engineering Approach. Jom 2017, 69, 848–855. [Google Scholar] [CrossRef]
  8. Bonifaz, E.A.; Baus, J.; Czekanski, A. Finite Element Modelling of Dual-Phase Polycrystalline Nickel-Base Alloys. Mech. Mater. 2016, 98, 134–141. [Google Scholar] [CrossRef]
  9. Bonifaz, E.A.; Alban, A.; Czekanski, A. Finite Element Analysis of Cylindrical Inclusions in Polycrystalline Nickel Alloys. J. Multiscale Model. 2018, 9, 1850003. [Google Scholar] [CrossRef]
  10. Carneiro, P.M.C.; Gamboa, P.V.; Baudín, C.; Silva, A.P. Modelling of Elastic Modulus of a Biphasic Ceramic Microstructure Using 3D Representative Volume Elements. J. Eur. Ceram. Soc. 2020, 40, 901–910. [Google Scholar] [CrossRef]
  11. Mermigkis, P.G.; Mavrantzas, V.G. Geometric Analysis of Clusters of Free Volume Accessible to Small Penetrants and Their Connectivity in Polymer Nanocomposites Containing Carbon Nanotubes. Macromolecules 2020, 53, 9563–9583. [Google Scholar] [CrossRef]
  12. Parashar, A.; Mertiny, P. Representative Volume Element to Estimate Buckling Behavior of Graphene/Polymer Nanocomposite. Nanoscale Res. Lett. 2012, 7, 1–6. [Google Scholar] [CrossRef]
  13. Hassanzadeh-Aghdam, M.K.; Ansari, R.; Darvizeh, A. Micromechanical Modeling of Thermal Expansion Coefficients for Unidirectional Glass Fiber-Reinforced Polyimide Composites Containing Silica Nanoparticles. Compos. Part A Appl. Sci. Manuf. 2017, 96, 110–121. [Google Scholar] [CrossRef]
  14. Yarali, E.; Baniassadi, M.; Baghani, M. Numerical Homogenization of Coiled Carbon Nanotube Reinforced Shape Memory Polymer Nanocomposites. Smart Mater. Struct. 2019, 28, 035026. [Google Scholar] [CrossRef]
  15. Qayyum, F.; Guk, S.; Kawalla, R.; Prahl, U. On Attempting to Create a Virtual Laboratory for Application-Oriented Microstructural Optimization of Multi-Phase Materials. Appl. Sci. 2021, 11, 1506. [Google Scholar] [CrossRef]
  16. Schneider, Y.; Weber, U.; Wasserbäch, W.; Zielke, R.; Schmauder, S.; Tillmann, W. A Numerical Method for the Generation of Hierarchical Poisson Voronoi Microstructures Applied in Micromechanical Finite Element Simulations—Part I: Method. Comput. Mech. 2020, 66, 651–667. [Google Scholar] [CrossRef]
  17. Fritzen, F.; Böhlke, T. Periodic Three-Dimensional Mesh Generation for Particle Reinforced Composites with Application to Metal Matrix Composites. Int. J. Solids Struct. 2011, 48, 706–718. [Google Scholar] [CrossRef]
  18. Sreeranganathan, A.; Gokhale, A.M.; Young, P. Realistic Micromechanical Modeling of Discontinuously Reinforced Composites. Comput. Mater. Sci. 2010, 49, 407–413. [Google Scholar] [CrossRef]
  19. Zhang, J.F.; Andrä, H.; Zhang, X.X.; Wang, Q.Z.; Xiao, B.L.; Ma, Z.Y. An Enhanced Finite Element Model Considering Multi Strengthening and Damage Mechanisms in Particle Reinforced Metal Matrix Composites. Compos. Struct. 2019, 226, 111281. [Google Scholar] [CrossRef]
  20. Sun, Z.; Zhao, J. Nano-Graphene Toughened Al2O3 Ceramic Materials: 3D Simulation of the Fracture Behaviour. Ceram. Int. 2020, 46, 28569–28577. [Google Scholar] [CrossRef]
  21. Shan, Z.; Gokhale, A.M. Representative Volume Element for Non-Uniform Micro-Structure. Comput. Mater. Sci. 2002, 24, 361–379. [Google Scholar] [CrossRef]
  22. Prosuntsov, P.V.; Taraskin, N.Y. Theoretical and Numerical Characterization of the Thermal Physical Properties of Carbon Ceramic Material. MATEC Web Conf. 2016, 72, 01092. [Google Scholar] [CrossRef]
  23. Tang, C.; Sheikh, M.A.; Hayhurst, D.R. Finite Element Modeling of Transverse Deformation in Representative Volume Elements of Ceramic Matrix Composites. J. Multiscale Model. 2010, 2, 107–126. [Google Scholar] [CrossRef]
  24. Brands, D.; Balzani, D.; Scheunemann, L.; Schröder, J.; Richter, H.; Raabe, D. Computational Modeling of Dual-Phase Steels Based on Representative Three-Dimensional Microstructures Obtained from EBSD Data. Arch. Appl. Mech. 2016, 86, 575–598. [Google Scholar] [CrossRef]
  25. Vittorietti, M.; Hidalgo, J.; López, J.G.; Sietsma, J.; Jongbloed, G. A Data-Driven Approach for Studying the Influence of Carbides on Work Hardening of Steel. Materials 2022, 15, 892. [Google Scholar] [CrossRef]
  26. Critchfield, T.R.; Johnson, O.K. Representative and Statistical Volume Elements for Grain Boundary Networks: A Stereological Approach. Acta Mater. 2020, 188, 166–180. [Google Scholar] [CrossRef]
  27. Mitić, V.V.; Paunović, V.; Janković, S.; Pavlović, V.; Antolović, I.; Rančić, D. Electronic Ceramic Structure within the Voronoi Cells Model and Microstructure Fractals Contacts Surfaces New Frontier Applications. Sci. Sinter. 2013, 45, 223–232. [Google Scholar] [CrossRef]
  28. Scheunemann, L.; Balzani, D.; Brands, D.; Schröder, J. Construction of Statistically Similar RVEs. In Analysis and Computation of Microstructure in Finite Plasticity; Conti, S., Hackl, K., Eds.; Springer International Publishing: Cham, Switzerland, 2015; pp. 219–256. ISBN 978-3-319-18242-1. [Google Scholar]
  29. Rauch, L.; Kuziak, R.; Pietrzyk, M. From High Accuracy to High Efficiency in Simulations of Processing of Dual-Phase Steels. Metall. Mater. Trans. B Process Metall. Mater. Process. Sci. 2014, 45, 497–506. [Google Scholar] [CrossRef]
  30. Sowrabh, B.S.; Gurumurthy, B.M.; Shivaprakash, Y.M.; Sharma, S.S. Reinforcements, Production Techniques and Property Analysis of AA7075 Matrix Composites-a Critical Review. Manuf. Rev. 2021, 8, 31. [Google Scholar] [CrossRef]
  31. Davis, J.R. Aluminum and Aluminum Alloys. In Alloying: Understanding the Basics; ASM International: Materials Park, OH, USA, 2001; pp. 351–416. ISBN 978-1-62708-297-6. [Google Scholar]
  32. Bhujangrao, T.; Veiga, F.; Froustey, C.; Guérard, S.; Iriondo, E.; Darnis, P.; Mata, F.G. Experimental Characterization of the AA7075 Aluminum Alloy Using Hot Shear Compression Test. Arch. Civ. Mech. Eng. 2021, 21, 45. [Google Scholar] [CrossRef]
  33. Zhu, Y.; Sun, K.; Frankel, G.S. Intermetallic Phases in Aluminum Alloys and Their Roles in Localized Corrosion. J. Electrochem. Soc. 2018, 165, C807–C820. [Google Scholar] [CrossRef]
  34. Zou, X.; Yan, H.; Chen, X.H. Evolution of Second Phases and Mechanical Properties of 7075 Al Alloy Processed by Solution Heat Treatment. Trans. Nonferrous Met. Soc. China 2017, 27, 2146–2155. (In English) [Google Scholar] [CrossRef]
  35. Aliyah, A.N.; Anawati, A. Effect of Heat Treatment on Microstructure and Mechanical Hardness of Aluminum Alloy AA7075. IOP Conf. Ser. Mater. Sci. Eng. 2019, 541, 1–6. [Google Scholar] [CrossRef]
  36. Kainer, K.U. Metal Matrix Composites: Custom-Made Materials for Automotive and Aerospace Engineering; Wiley-VCH Verlag GmbH & Co.: Weinheim, Germany, 2006; ISBN 3527313600. [Google Scholar]
  37. Seetharaman, S.; Gupta, M. Fundamentals of Metal Matrix Composites. In Encyclopedia of Materials: Composites; Elsevier: Oxford, UK, 2021; pp. 11–29. ISBN 9780128035818. [Google Scholar]
  38. Wu, J.; Zhang, C.; Meng, Q.; Liu, B.; Sun, Y.; Wen, M.; Ma, S.; He, L. Study on Tensile Properties of Carbon Fiber Reinforced AA7075 Composite at High Temperatures. Mater. Sci. Eng. A 2021, 825, 141931. [Google Scholar] [CrossRef]
  39. Singh, S.S.; Schwartzstein, C.; Williams, J.J.; Xiao, X.; De Carlo, F.; Chawla, N. 3D Microstructural Characterization and Mechanical Properties of Constituent Particles in Al 7075 Alloys Using X-Ray Synchrotron Tomography and Nanoindentation. J. Alloys Compd. 2014, 602, 163–174. [Google Scholar] [CrossRef]
  40. Singh, S.S.; Guo, E.; Xie, H.; Chawla, N. Mechanical Properties of Intermetallic Inclusions in Al 7075 Alloys by Micropillar Compression. Intermetallics 2015, 62, 69–75. [Google Scholar] [CrossRef]
  41. Torbati-Sarraf, H.; Stannard, T.J.; La Plante, E.C.; Sant, G.N.; Chawla, N. Direct Observations of Microstructure-Resolved Corrosion Initiation in AA7075-T651 at the Nanoscale Using Vertical Scanning Interferometry (VSI). Mater. Charact. 2020, 161, 110166. [Google Scholar] [CrossRef]
  42. Gharbi, O.; Kumar Kairy, S.; De Lima, P.R.; Jiang, D.; Nicklaus, J.; Birbilis, N. Microstructure and Corrosion Evolution of Additively Manufactured Aluminium Alloy AA7075 as a Function of Ageing. NPJ Mater. Degrad. 2019, 3, 40. [Google Scholar] [CrossRef]
  43. Jin, Y.; Cai, P.; Wen, W.; Nagaumi, H.; Xu, B.; Zhang, Y.; Zhai, T. The Anisotropy of Fatigue Crack Nucleation in an AA7075 T651 Al Alloy Plate. Mater. Sci. Eng. A 2015, 622, 7–15. [Google Scholar] [CrossRef]
  44. Mason, S.F. Crystal Structure Determinations; Springer: Berlin/Heidelberg, Germany, 1979; Volume 282, ISBN 9783642072710. [Google Scholar]
  45. Fátima Vaz, M.; Fortes, M.A. Grain Size Distribution: The Lognormal and the Gamma Distribution Functions. Scr. Metall. 1988, 22, 35–40. [Google Scholar] [CrossRef]
  46. Deschamps, A. Microstructure—Properties Relationships In Metal-Based Alloys. In Mechanical Properties of Complex Intermetallics; Belin-Ferré, E., Ed.; World Scientific Publishing Company: Paris, France, 2010; pp. 73–124. [Google Scholar]
  47. Chang, K.-H. Reliability Analysis. In E-Design; Elsevier: Amsterdam, The Netherlands, 2015; pp. 523–595. [Google Scholar]
  48. Groeber, M.A.; Jackson, M.A. DREAM.3D: A Digital Representation Environment for the Analysis of Microstructure in 3D. Integr. Mater. Manuf. Innov. 2014, 3, 56–72. [Google Scholar] [CrossRef]
  49. Dassault Systèmes Simulia Inc. Abaqus 6.14. Analysis User’s Manual. Available online: https://classes.engineering.wustl.edu/2009/spring/mase5513/abaqus/docs/v6.6/books/usb/default.htm?startat=pt05ch17s02abm02.html (accessed on 15 February 2023).
  50. Toray T700SC-12K Data Sheet. Available online: https://www.toraycma.com/wp-content/uploads/T700S-Technical-Data-Sheet-1.pdf.pdf (accessed on 14 February 2023).
  51. Langston, T. The Tensile Behavior of High-Strength Carbon Fibers. Microsc. Microanal. 2016, 22, 841–844. [Google Scholar] [CrossRef]
  52. Callister, W.D.; Rethwisch, D.G. Materials Science and Engineering: An Introduction, 10th ed.; Wiley: Hoboken, NJ, USA, 2018; ISBN 9781119321590. [Google Scholar]
  53. Quadros, J.D.; Suhas, P.; Vaishak, N.L. Evaluation of Mechanical Properties of Aluminium Alloy 7075 Reinforced with SiC and Al2O3 Hybrid Metal Matrix Composites. Am. J. Mater. Sci. 2017, 7, 102–107. [Google Scholar] [CrossRef]
  54. Bargmann, S.; Klusemann, B.; Markmann, J.; Schnabel, J.E.; Schneider, K.; Soyarslan, C.; Wilmers, J. Generation of 3D Representative Volume Elements for Heterogeneous Materials: A Review. Prog. Mater. Sci. 2018, 96, 322–384. [Google Scholar] [CrossRef]
  55. Sanaty-Zadeh, A. Comparison between Current Models for the Strength of Particulate-Reinforced Metal Matrix Nanocomposites with Emphasis on Consideration of Hall-Petch Effect. Mater. Sci. Eng. A 2012, 531, 112–118. [Google Scholar] [CrossRef]
Figure 1. (a) SEM imaging acquired by Singh et al. (Reprinted/adapted with permission from [40]). (b) Segmentation for the depiction of each phase. (c,d) Selection of Al7Cu2Fe and Mg2Si precipitate phases.
Applsci 13 04989 g001
Figure 2. Lognormal fitting for ESD distribution of (a) Al7Cu2Fe and (b) Mg2Si precipitate phase in a AA7075 alloy.
Applsci 13 04989 g002
Figure 3. DREAM.3D pipeline for the generation of 3D SSRVEs and corresponding Abaqus FEA input files.
Applsci 13 04989 g003
Figure 4. SSRVEs for AA7075/CF MMCs with CF aspect ratio of 30:7 and volume fraction equal to (a) 0%, (b) 4%, (c) 8%, and (d) 12%.
Applsci 13 04989 g004
Figure 5. SSRVEs for AA7075/CF MMCs with CF volume fraction of 8% and aspect ratio equal to (a) 15:7, (b) 30:7, and (c) 45:7.
Applsci 13 04989 g005
Figure 6. (a) Elastic moduli in the longitudinal and transverse fiber direction of composites with continuous fibers; (b) Elastic modulus of fibrous composite with discontinuous fibers and random directional distribution.
Applsci 13 04989 g006
Figure 7. Abaqus model of a 12% AA7075/CF MMC, with the corresponding elements representing (a) Al7Cu2Fe, (b) Mg2Si, and (c) CF phases.
Applsci 13 04989 g007
Figure 8. Deformed MMC sample after 1.4% elongation and distribution of (a) total strain and (b) von Mises stress in MPa.
Applsci 13 04989 g008
Figure 9. Stress–strain curves from tensile test simulation in Abaqus FEA for AA7075/CF MMCs with varying volume fraction.
Applsci 13 04989 g009
Figure 10. Elastic modulus dependence on CF volume fraction compared with rule of mixtures.
Applsci 13 04989 g010
Figure 11. Yield stress of AA7075/CF MMCs with different volume fractions compared with shear-lag model.
Applsci 13 04989 g011
Figure 12. (a) Stress–strain curves for 8% AA7075/CF MMCs with different aspect ratios and (b) a close-up around yield points.
Applsci 13 04989 g012
Figure 13. Yield stress of 8% AA7075/CF MMCs with different aspect ratios compared with shear-lag model.
Applsci 13 04989 g013
Table 1. Measured surface fractions of precipitates and comparison with literature volume fractions.
ImageJ Analysis
Surface Fraction
Literature Volume
Fraction [39,43]
Differences (%)
f A l 7 C u 2 F e 1.19%1.29%8
f M g 2 S i 0.54%0.34%59
f A l 7 C u 2 F e + f M g 2 S i 1.73%1.63%6
f A l 7 C u 2 F e f A l 7 C u 2 F e + f M g 2 S i 0.69%0.79%13
Table 2. Mechanical properties of AA7075 phases and CF.
Elastic Modulus (GPa)Poisson’s RatioYield Stress (MPa)Strain Hardening Modulus (MPa)
Matrix440.34000
5000.011
6000.036
Mg2Si1020.316500
19500.036
Al7Cu2Fe1320.325000
CF2300.349000
Disclaimer/Publisher’s Note: The statements, opinions and data contained in all publications are solely those of the individual author(s) and contributor(s) and not of MDPI and/or the editor(s). MDPI and/or the editor(s) disclaim responsibility for any injury to people or property resulting from any ideas, methods, instructions or products referred to in the content.

