Abstract
The evolution of fiber optic technology in the past few decades has led to significant advancements in various fields, including high-speed and long-distance communication, big data transport, optical imaging, and sensing. However, relatively few studies have examined the use of fiber optic sensors (FOSs) as point and distributed sensors in geophysics. Distributed Acoustic Sensing (DAS) is a widely used method for subsurface imaging and monitoring in wells, specifically in Vertical Seismic Profiling (VSP) surveys. This method allows for detailed analysis of subsurface structures and properties of reservoirs. Four different strategies for deploying FOS cables in DAS VSP are evaluated and compared: cementing behind casing, cable behind inflatable liner, strapping to production tubing, and wireline deployment. Cementing the fiber behind casing is considered the most effective method for coupling with the formation. However, the other methods also have their own advantages and limitations. The fiber cable behind inflatable liner, for example, allows for accessibility to the fiber without affecting the acoustic signal, while strapping the fiber to production tubing can still record DAS signals; tubing noise and signal attenuation from the annular fluid, however, can make it difficult to differentiate from the seismic signal. Nonetheless, this method has the benefit of being simpler to deploy and replace in case of failure. Wireline deployment can pick up some acoustic signals in regions where the cable touches the well wall, but in vertical sections where the cable is not in contact with the wall, the signal is attenuated. Results from pilot tests in a field in Canada are discussed and evaluated, and suggestions for improving the VSP signal are provided.
1. Introduction
Distributed Acoustic Sensing, sometimes known as DAS, is a relatively new technique for gathering seismic data that is quickly becoming more popular as a potential substitute for geophones in borehole seismic sensors. DAS acquires seismic data using fiber optic cables as sensors to measure acoustic waves. Compared to other seismic data acquisition methods, such as traditional geophones or seismometers, DAS has several advantages including providing continuous seismic data over long distances, high spatial resolution, flexibility for deployment in a wide range of environments, and a cost-effective alternative to traditional seismic data acquisition methods. Multiple recent field experiments in onshore [1] and offshore [2] wells suggest that DAS is a feasible seismic method. The DAS offers a one-of-a-kind and highly accurate means of measuring seismic activity. It possesses a high resolution in both space and time, and it is able to record a significant quantity of seismic data across a distance of several kilometers. If an optical fiber is placed inside of the well, then DAS will be able to provide continuous and dense recording from the well. This does not in any way interfere with any of the other activities that are going on in the well. A signal with a high signal-to-noise ratio (SNR) will be produced by an installation with an adequate amount of fiber coupling. In addition to this, fiber is more resistant to changes in temperature and pressure [3], which enables it to function as a sensor for a longer period of time. DAS is used in a variety of applications, including but not limited to the following: recording earthquakes [4], identifying fault zones [5], and reconstructing subsurface structures [6,7]. Because dedicated downhole deployments of DAS target shorter seismic wavelengths, they have much superior SNR and make full use of the sampling resolution and density [8]. Deep sensor deployment also helps to bypass the obstacles that are provided by the dissipative and complex character of the near-surface or the overburden, both of which are problematic for the signal processing that is captured at or near the surface [9,10].
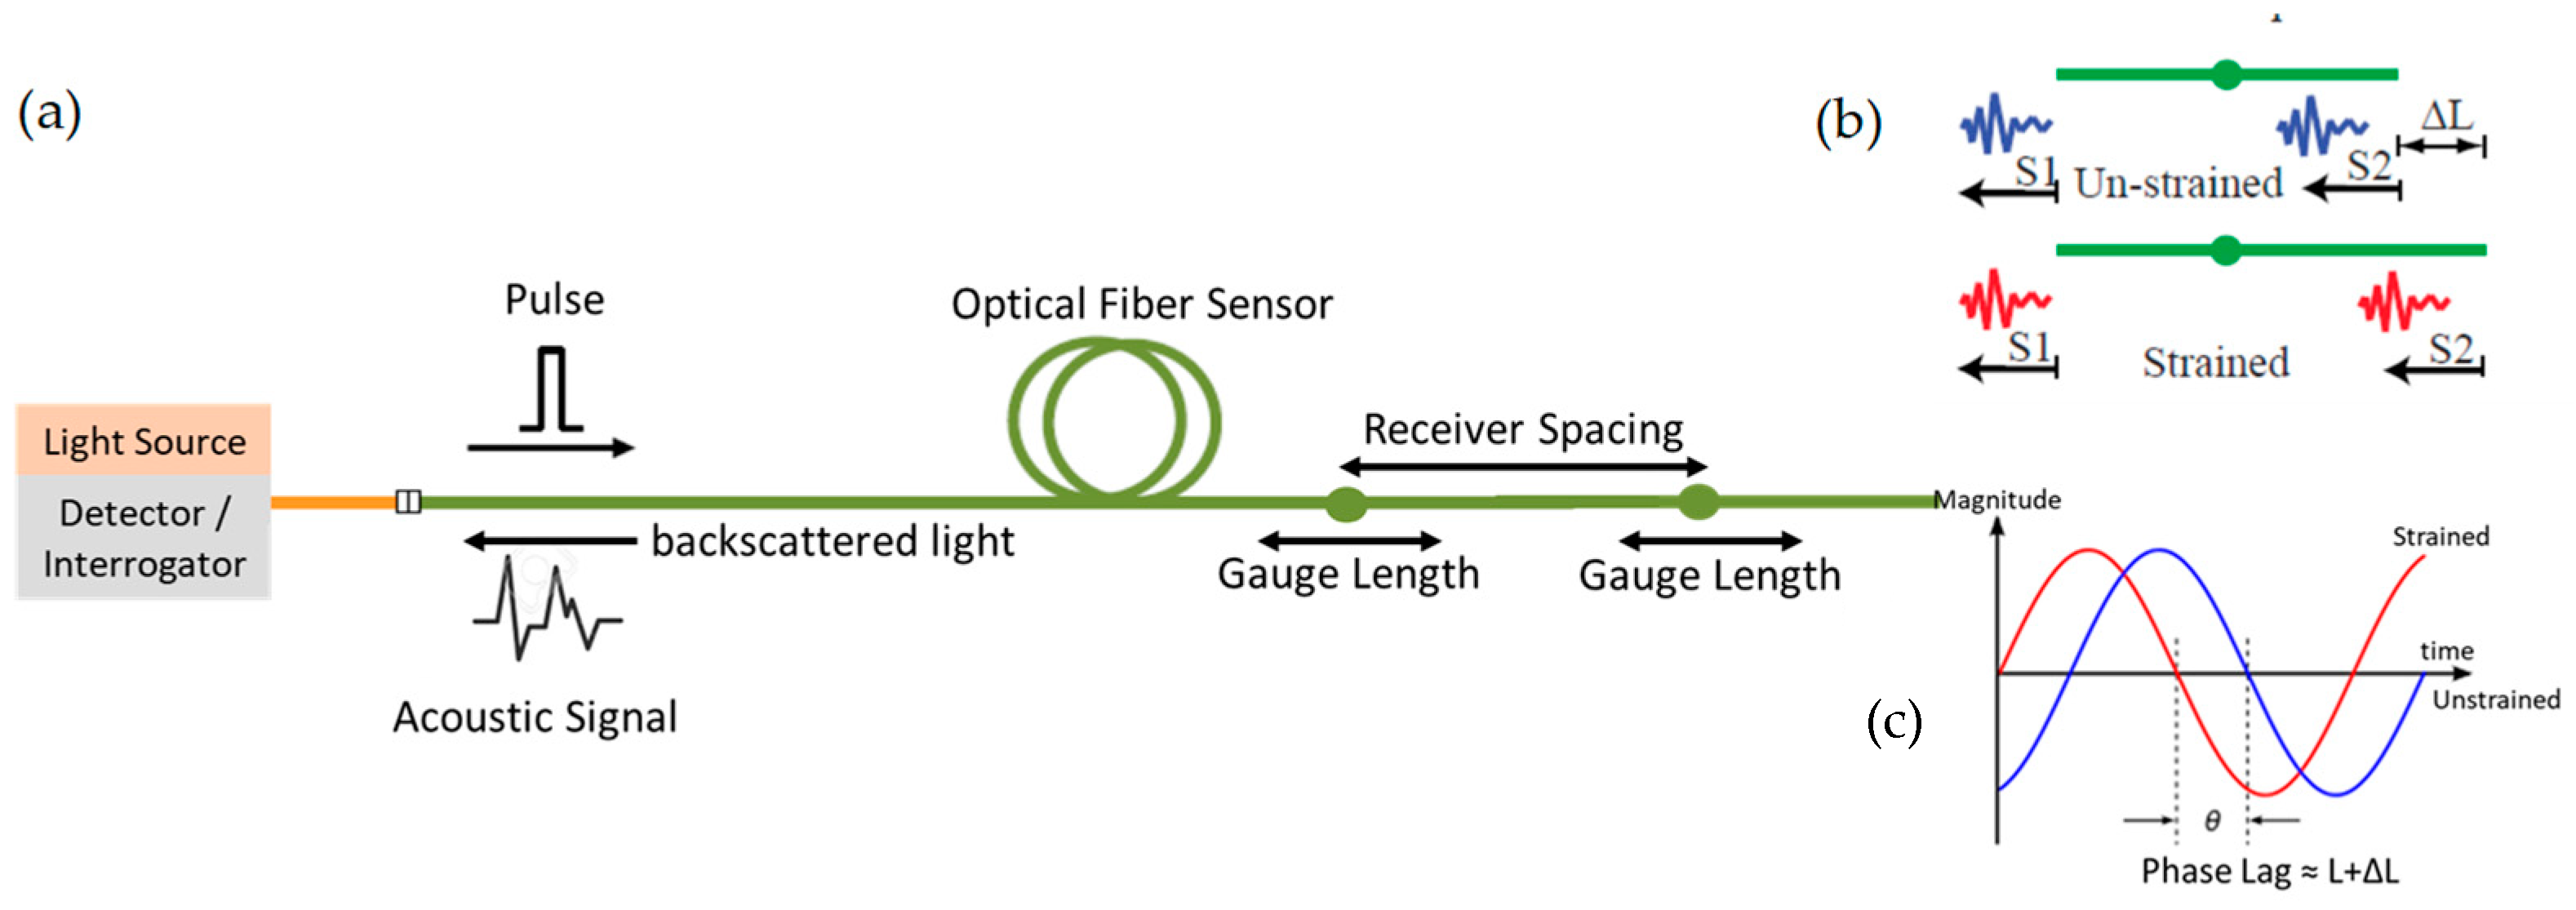
A DAS system is a specialized method for collecting seismic information, which utilizes an optical fiber cable inserted in the well [11]. The system consists of two main components: a surface-mounted interferometer, also known as a light-box or interrogator unit, and the fiber optical cable [12], as depicted in Figure 1. This system is similar to an array of geophones placed throughout the full fiber length [13]. The interrogator unit delivers brief laser pulses into the fiber, and by analyzing the Rayleigh-scattering, the strain along the cable can be determined.
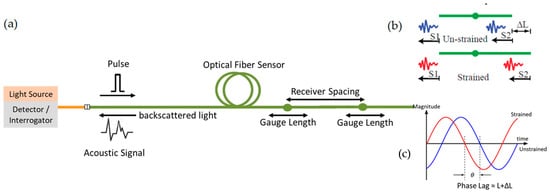
Figure 1.
(a) A schematic description of the various components of the DAS system, (b) modifications in the phase difference between the points along the fiber of the signal, (c) the phase-lag between the beat signals (S1 + S2) formed from two scattering points in the fiber in the unstrained (blue) and strained (red) state is proportional to the strain in that section of the fiber.
As the pulse travels along the fiber, a portion of the energy is reflected to the surface by the minute flaws in the fiber. The amplitude and phase of the backscattered signal at a specific site in the fiber are random, but the change in phase-lag between two locations at two different times is proportional to the strain in that segment of the fiber [14,15]. Thus, by analyzing the phase-lag, DAS can detect and quantify the strain along the cable, and this is used to collect seismic information. This method provides a unique and superior method of seismic measurement, as it has a high resolution both spatially and temporally, and it can record a dense amount of seismic data over several kilometers [16,17].
DAS systems can be deployed in different ways in a well, depending on the application and specific requirements of the well [18,19,20]. One common method of DAS deployment in wells is through a “permanently installed” system, where fiber-optic cables are permanently installed in the wellbore during the well construction phase [20]. This method involves embedding the fiber-optic cable within the cement sheath of the wellbore or attaching it to the outside of the production tubing or casing. The advantage of this method is that it provides continuous monitoring of the well over its entire lifetime, enabling early detection of any potential issues.
Another method of DAS deployment in wells is through a “temporary” system, which involves deploying the fiber-optic cable downhole for a specific period of time to conduct a monitoring campaign [20]. This method is typically used in situations where there is a need to assess the performance of the well or identify potential issues, but where a permanent installation is not necessary. The temporary deployment can be achieved through various techniques, including coiled tubing or slickline deployment.
Several papers provide a detailed overview of the use of DAS for permanent wellbore monitoring [21,22,23]. They discuss different installation methods, including embedding the fiber-optic cable in the cement sheath, attaching it to the production tubing, and suspending it on a cable, and provide case studies to illustrate the effectiveness of each approach. However, each of the installation approaches has yet to be discussed in terms of the optimum performance, sensitivity and accuracy of data acquired.
The focus of this study is on the dedicated downhole deployments of DAS. We conducted a field study to evaluate the effectiveness of DAS in a test well by deploying sensors in a way that is not possible with traditional geophones. Specifically, we analyzed a DAS Vertical Seismic Profiling (VSP) conducted onshore in 2019. The well was located in the middle of a Vibroseis sweep line, nearly vertical (with a very low incline angle) and was air-filled. This study is important for understanding the most optimal and cost-effective DAS VSP fiber deployment for well completion without compromising data quality.
One of the key advantages of this study was the examination of fiber maintenance and access in the event of cable complications. There were concerns that the data quality from a fiber deployed on tubing or wireline may be inferior compared to fiber directly linked to a formation. However, this paper addresses and resolves this concern by providing a detailed analysis and discussion of the results. The study highlights the potential of DAS in providing a unique and superior method of seismic measurement and its ability to record a dense amount of seismic data over several kilometers.
2. Principles of DAS Fiber Optic
DAS can be acquired using single-mode optical fiber as its fiber optic material. The most common type of fiber optic material is silica, which is a type of glass. Silica is an excellent material for fiber optic cables because it has very low optical attenuation (loss of light intensity) and can be drawn into very thin fibers with high tensile strength [24].
Single-mode fiber is a type of optical fiber that allows only a single mode of light to propagate, which results in lower signal attenuation and dispersion compared to multimode fiber [25]. This allows DAS to achieve high sensitivity and spatial resolution, making it a suitable technology for monitoring seismic activity over long distances. The other type of fiber is multimode fiber which allows multiple modes or rays of light to propagate through the fiber simultaneously. Unlike single-mode fiber, which only allows a single mode to propagate, multimode fiber has a larger core diameter and a higher numerical aperture, which allows for a larger range of incident angles and modes to be coupled into the fiber. Multimode fiber is also used in some sensing applications, such as distributed temperature sensing (DTS) and distributed strain sensing (DSS), which rely on the changes in the light signal caused by changes in temperature or strain. However, the use of multimode fiber for sensing is generally limited to short distances due to its higher attenuation and lower spatial resolution compared to single-mode fiber.
The fundamental principle of DAS is the use of a single optical fiber as both a sensor and a means of transmitting data [26]. DAS systems use a laser light to illuminate a segment of optical fiber, and then detect the backscattered light from the fiber using a photodetector. The backscattered light is affected by the mechanical and temperature changes along the fiber, which can be used to detect and locate events, such as acoustic signals, vibration, and strain. By measuring the time of flight of the backscattered light along different segments of the fiber, it is possible to create a high-resolution image of the acoustic or vibration activity along the entire length of the fiber [27,28].
2.1. Methodology
Strain can significantly affect the optical properties of optical fibers [29]. The application of strain to optical fiber can induce changes in the refractive index profile and the mode field diameter, which can alter the optical properties of the fiber. This is due to the fact that strain can modify the distribution of dopants in the fiber core and cladding, which in turn can affect the refractive index profile.
The measurement of the optical phase change that occurs as a result of the axial strain fluctuation in the optical fiber is how DAS is accomplished. The axial strain that the fiber experiences as a result of the action of the sound wave on the fiber causes a phase shift in the Rayleigh backscattering signal that is carried by the fiber. The photo-elastic effect [30] states that there is a linear relationship between the axial strain and the change in optical phase:
where β is the propagation constant of light, is the refractive index of the core of optical fiber, P12 and P11 are tensor coefficients of the optical fiber, ∆L is the change in fiber length from equation ΔL = εsL, εs is the axial strain of the fiber, and L is the length of the fiber. Therefore, as long as the modifications in the phase difference between the points along the fiber of the probe light can be recovered, the modifications in axial strain can be known, and the quantitative perception of acoustic waves or vibrations can finally be detected [31]. In order for DAS to function properly, it is essential to establish distortion-free phase demodulation along the whole fiber.
DAS is achieved by measuring the optical phase change caused by the axial strain variation of the optical fiber. When the sound wave acts on the fiber, the fiber will produce axial strain, which changes the phase of the Rayleigh backscattering signal in the fiber. According to the photo-elastic effect, there is a linear relationship between the axial strain and the optical phase change.
DAS uses the backscattered light from an optical fiber to detect and analyze acoustic signals. The backscattered light is caused by changes in the refractive index of the fiber caused by acoustic waves. The strength of the backscattered light is related to the amplitude of the acoustic wave, and the phase of the backscattered light is related to the distance to the reflection.
One of the key equations used in DAS is the equation for the backscattered light intensity [32], which is given by:
where I(z) is the backscattered light intensity at a distance z, I(0) is the input light intensity, and α is the fiber’s attenuation coefficient.
Another important equation in DAS is the phase shift equation, which describes the phase shift [33] of the backscattered light caused by a reflection. The phase shift is given by:
where Δ is the phase shift, n is the refractive index of the fiber, L is the distance to the reflection, and λ is the wavelength of the light.
2.2. Procedure
The DAS acquisition process is a method used to detect and measure acoustic signals using an optical fiber [34]. The process involves several steps that are used to generate, propagate, detect, and interpret the signals.
- Generating the excitation signal: a light source, such as a laser, is used to create an excitation signal that is sent into the optical fiber. This signal can be a continuous wave (CW) or a pulsed wave, depending on the specific application and environment.
- Propagation of the excitation signal: the excitation signal travels along the length of the optical fiber, scattering and reflecting off any changes in the fiber caused by acoustic signals. This scattering and reflection of the excitation signal is known as backscattering.
- Detection of the backscattered signal: the backscattered signal is then detected and measured by a detector, such as a photodiode. The detector converts the optical signal into an electrical signal, which can be further processed.
- Signal processing: the electrical signal is then passed through a signal processing system to extract the relevant information. This can include demodulation, filtering, and other signal processing techniques. The specific signal processing techniques used will depend on the type of signals being detected, the distance to the reflection, and the noise level of the system.
- Data interpretation: the processed data is then interpreted to determine the location and characteristics of the acoustic signals. This can include determining the distance to the reflection and the amplitude and frequency of the signal.
- Data visualization: the data is then visualized to provide a clear representation of the acoustic signals. This can include displaying the data on a map or in a graph, and can also include the use of data visualization tools such as GIS. This step allows for easy interpretation and analysis of the data.
It is worth noting that the specific steps and methods used for DAS acquisition can vary depending on the specific application and environment. The choice of light source, detector, and signal processing techniques will depend on the type of signals being detected, the distance to the reflection, and the noise level of the system. These variations are necessary to ensure accurate and reliable data acquisition.
3. DAS Field Site Deployment
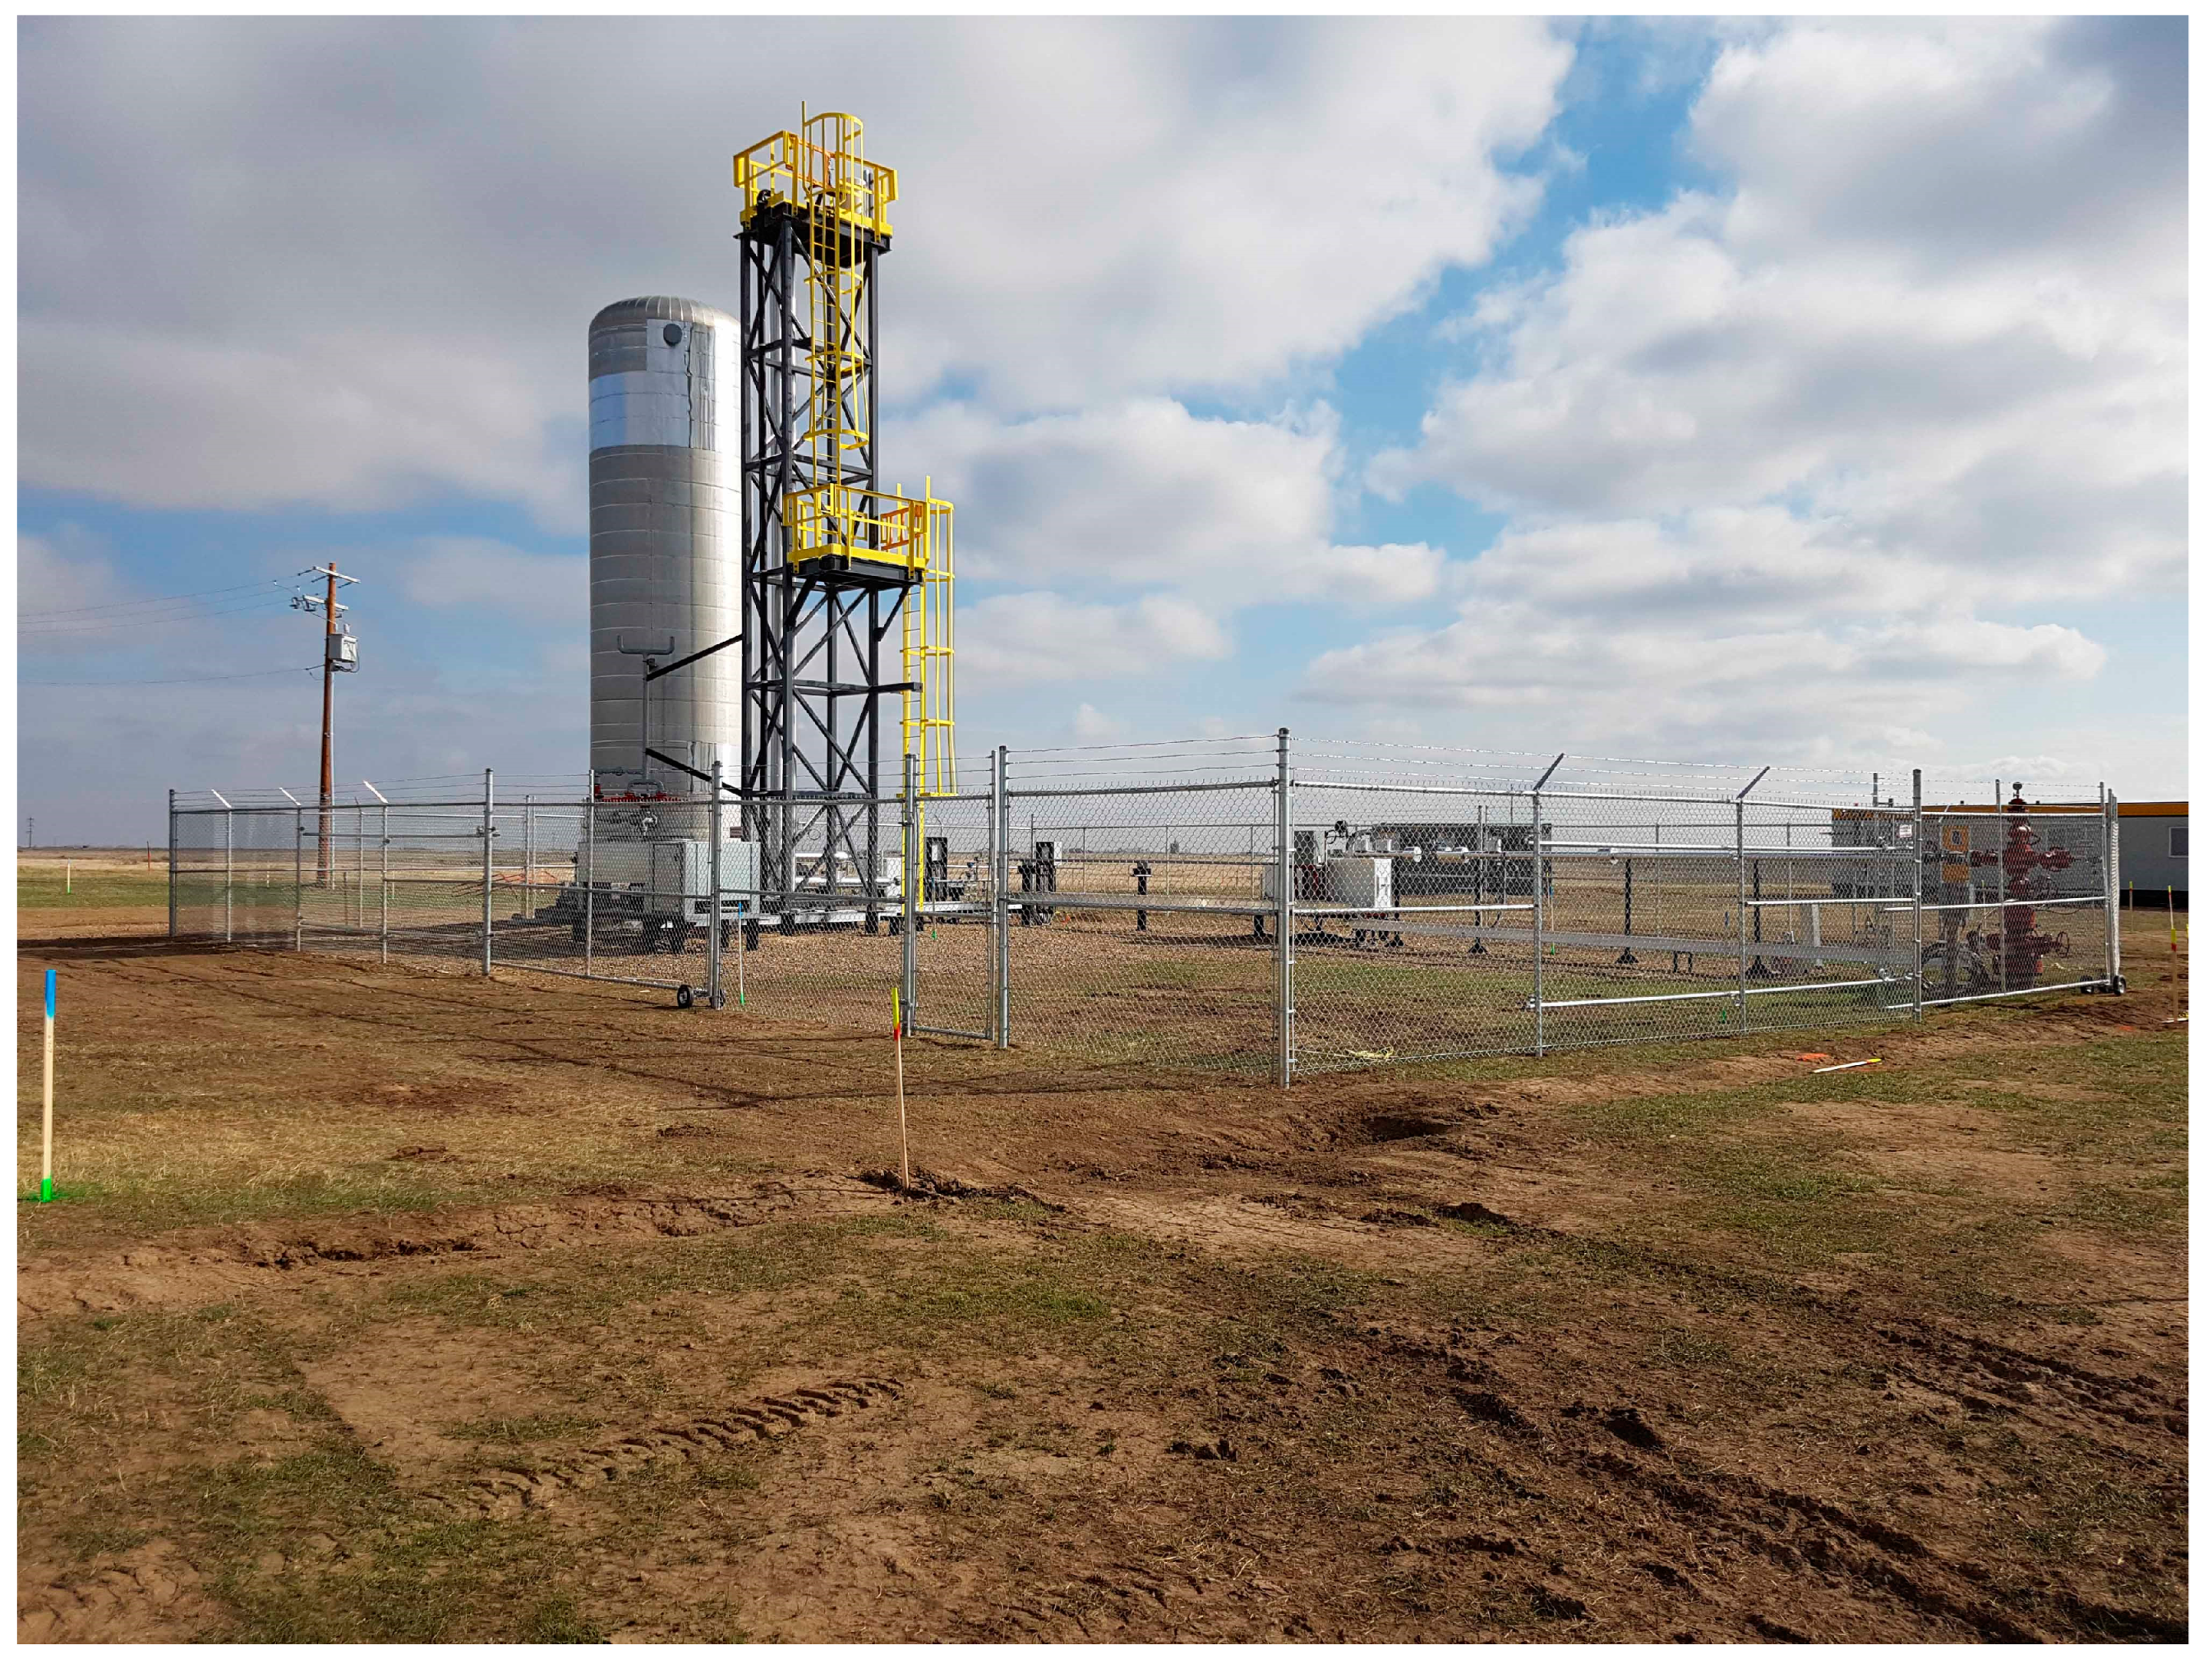
In 2019, our team conducted an experiment at Carbon Management Canada (CMC), Containment and Monitoring Institute Field Research Station (CaMI FRS), near Brooks, Alberta, Canada (Figure 2). The CaMI site had three primary wells, including one CO2 injection well and two adjacent monitor wells (Wells 1 and 2), all completed at a depth of 350 m [35,36,37]. One of these observation wells had steel casing and had an integrated DAS and DTS fiber pack, pressure gauges, and a fluid-sampling U-tube mounted on the outside of the casing. The second observation well had fiberglass casing with 3C geophones, as well as DAS and DTS fiber and electrodes cemented behind the casing. The surface area and wells at CaMI were heavily instrumented with many different types of modern geophysical instrumentation, including Fiber Optics, Geophones (surface and borehole) and Gauges. In the two instrumented wells, #1 and #2, pre-existing fiber optic cables were installed behind fiberglass casing and cemented in place. This experiment was conducted to evaluate and study the effectiveness of DAS in monitoring CO2 injection and subsurface changes in these wells.
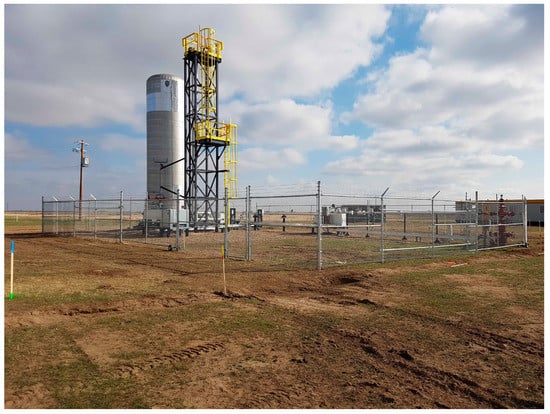
Figure 2.
Field site overview (CaMI Field, Brooks, Alberta CN).
3.1. Deployment Method
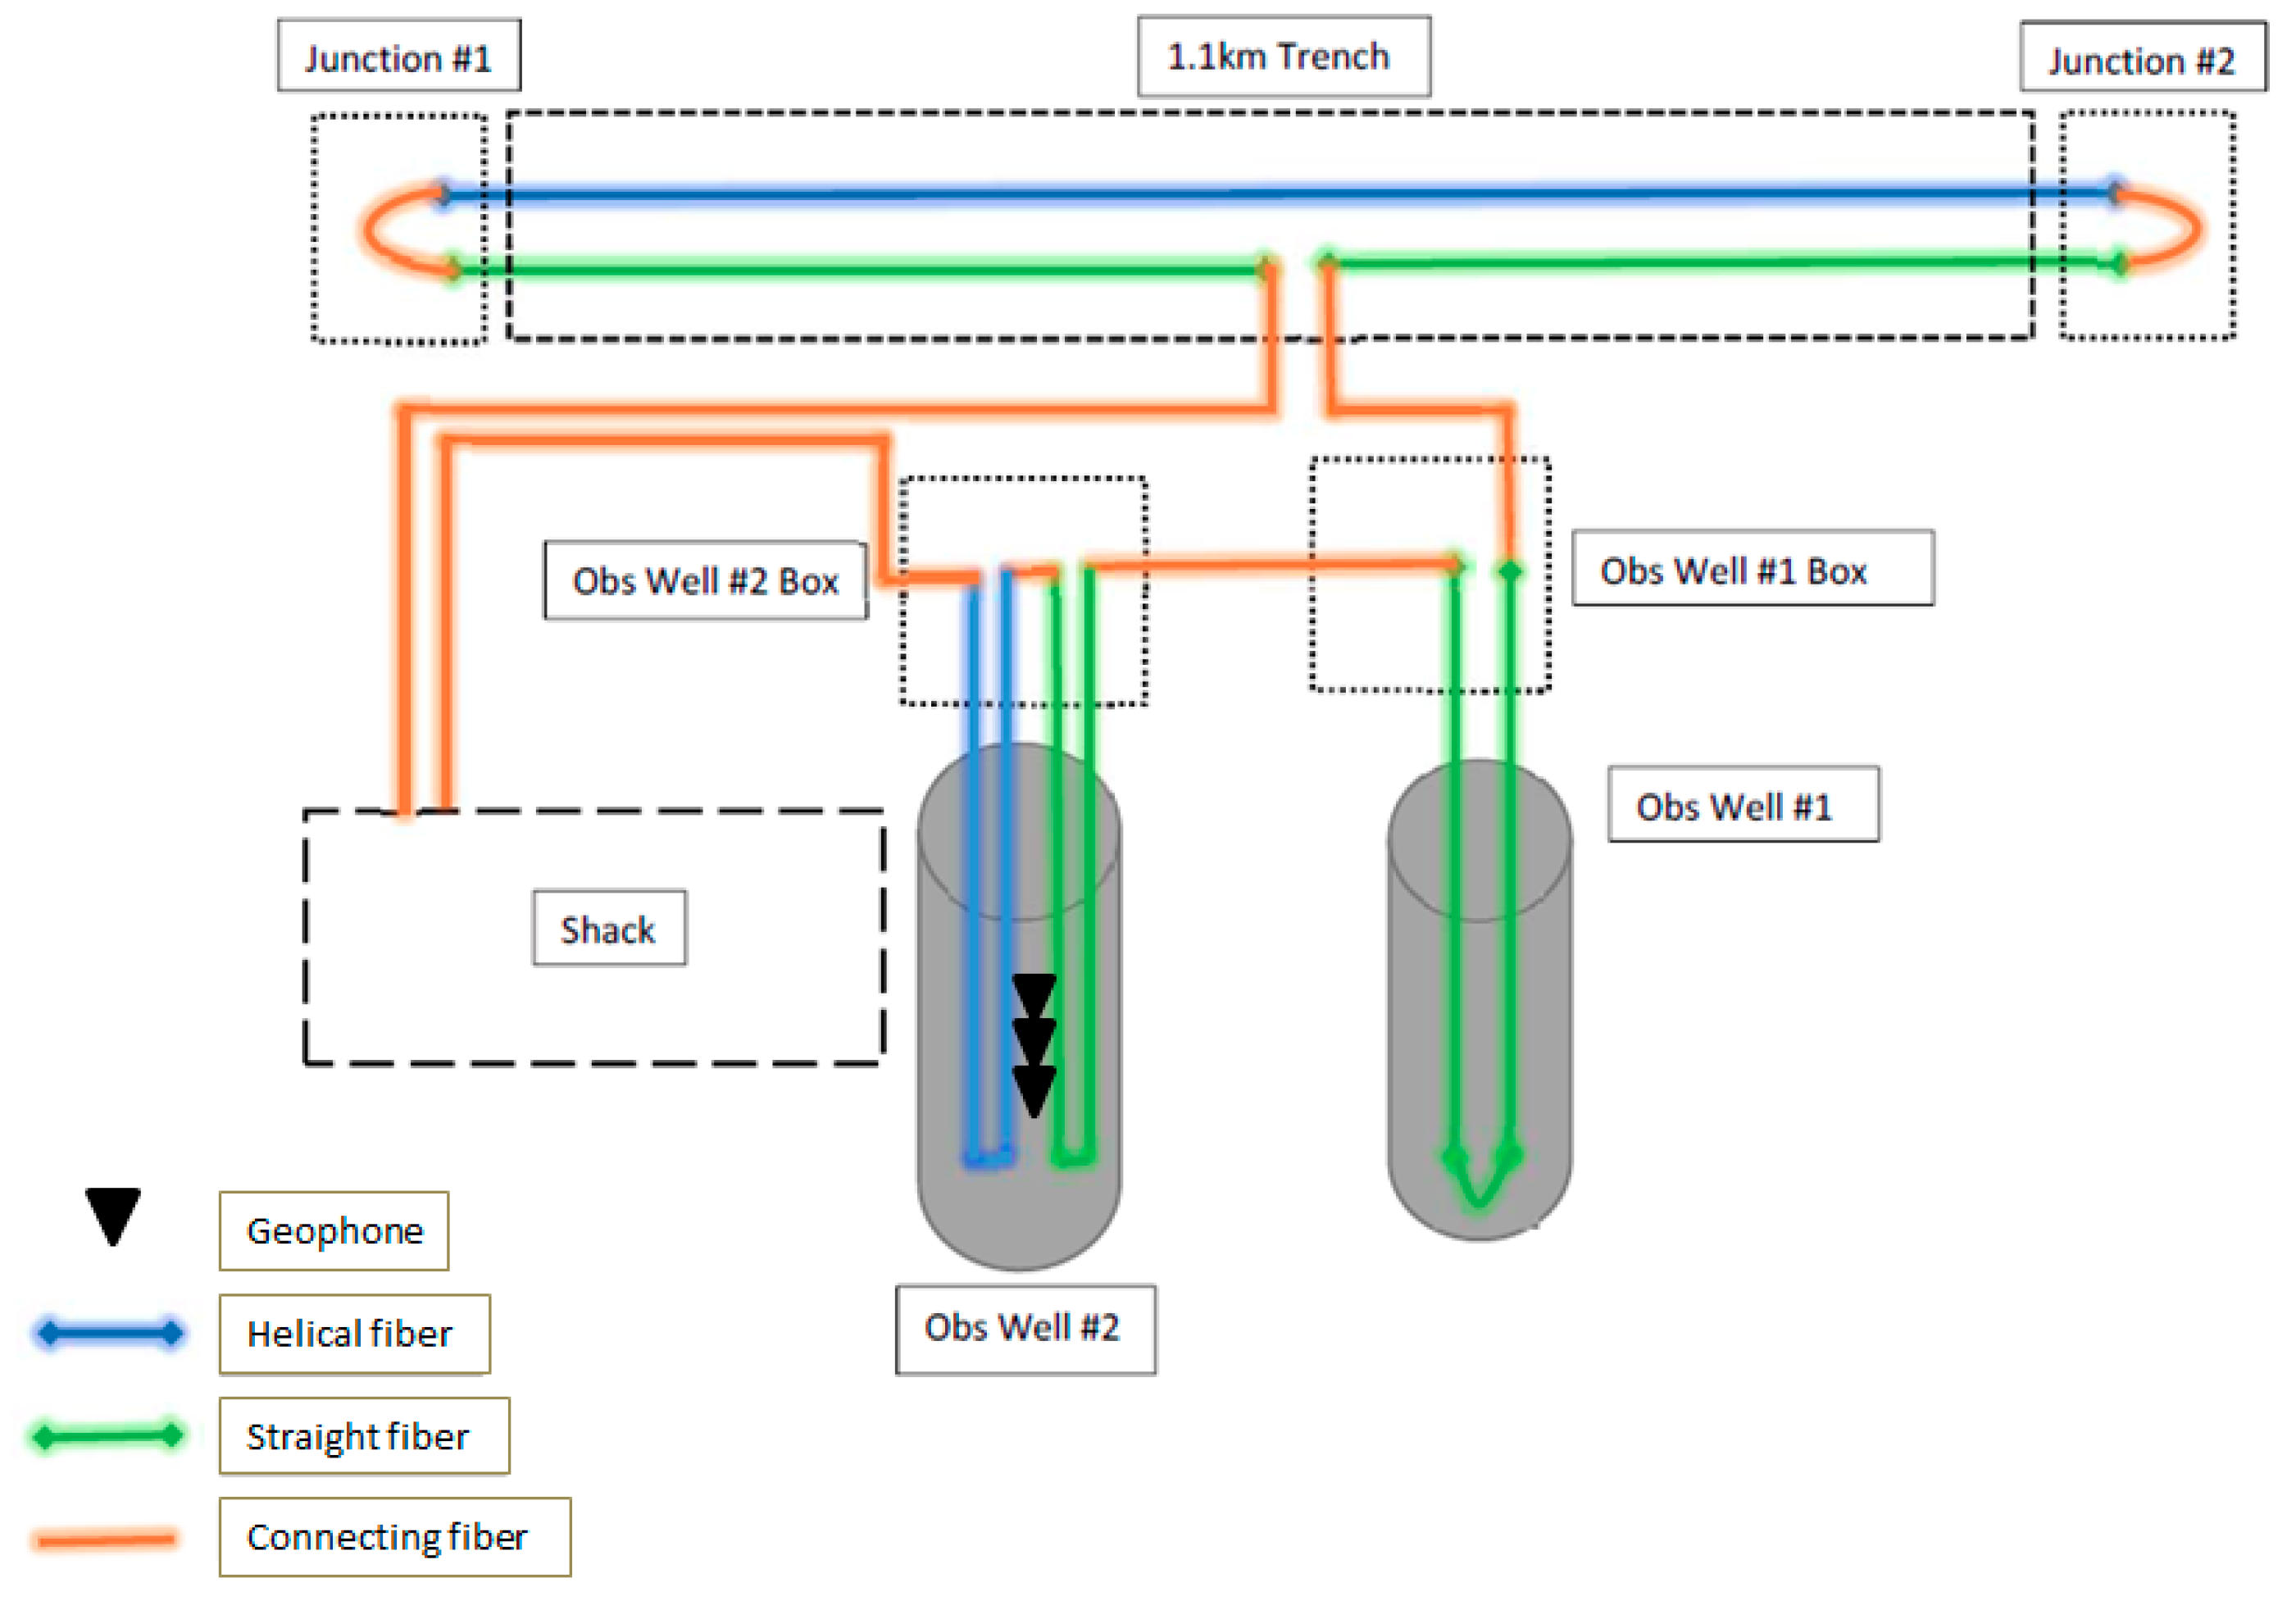
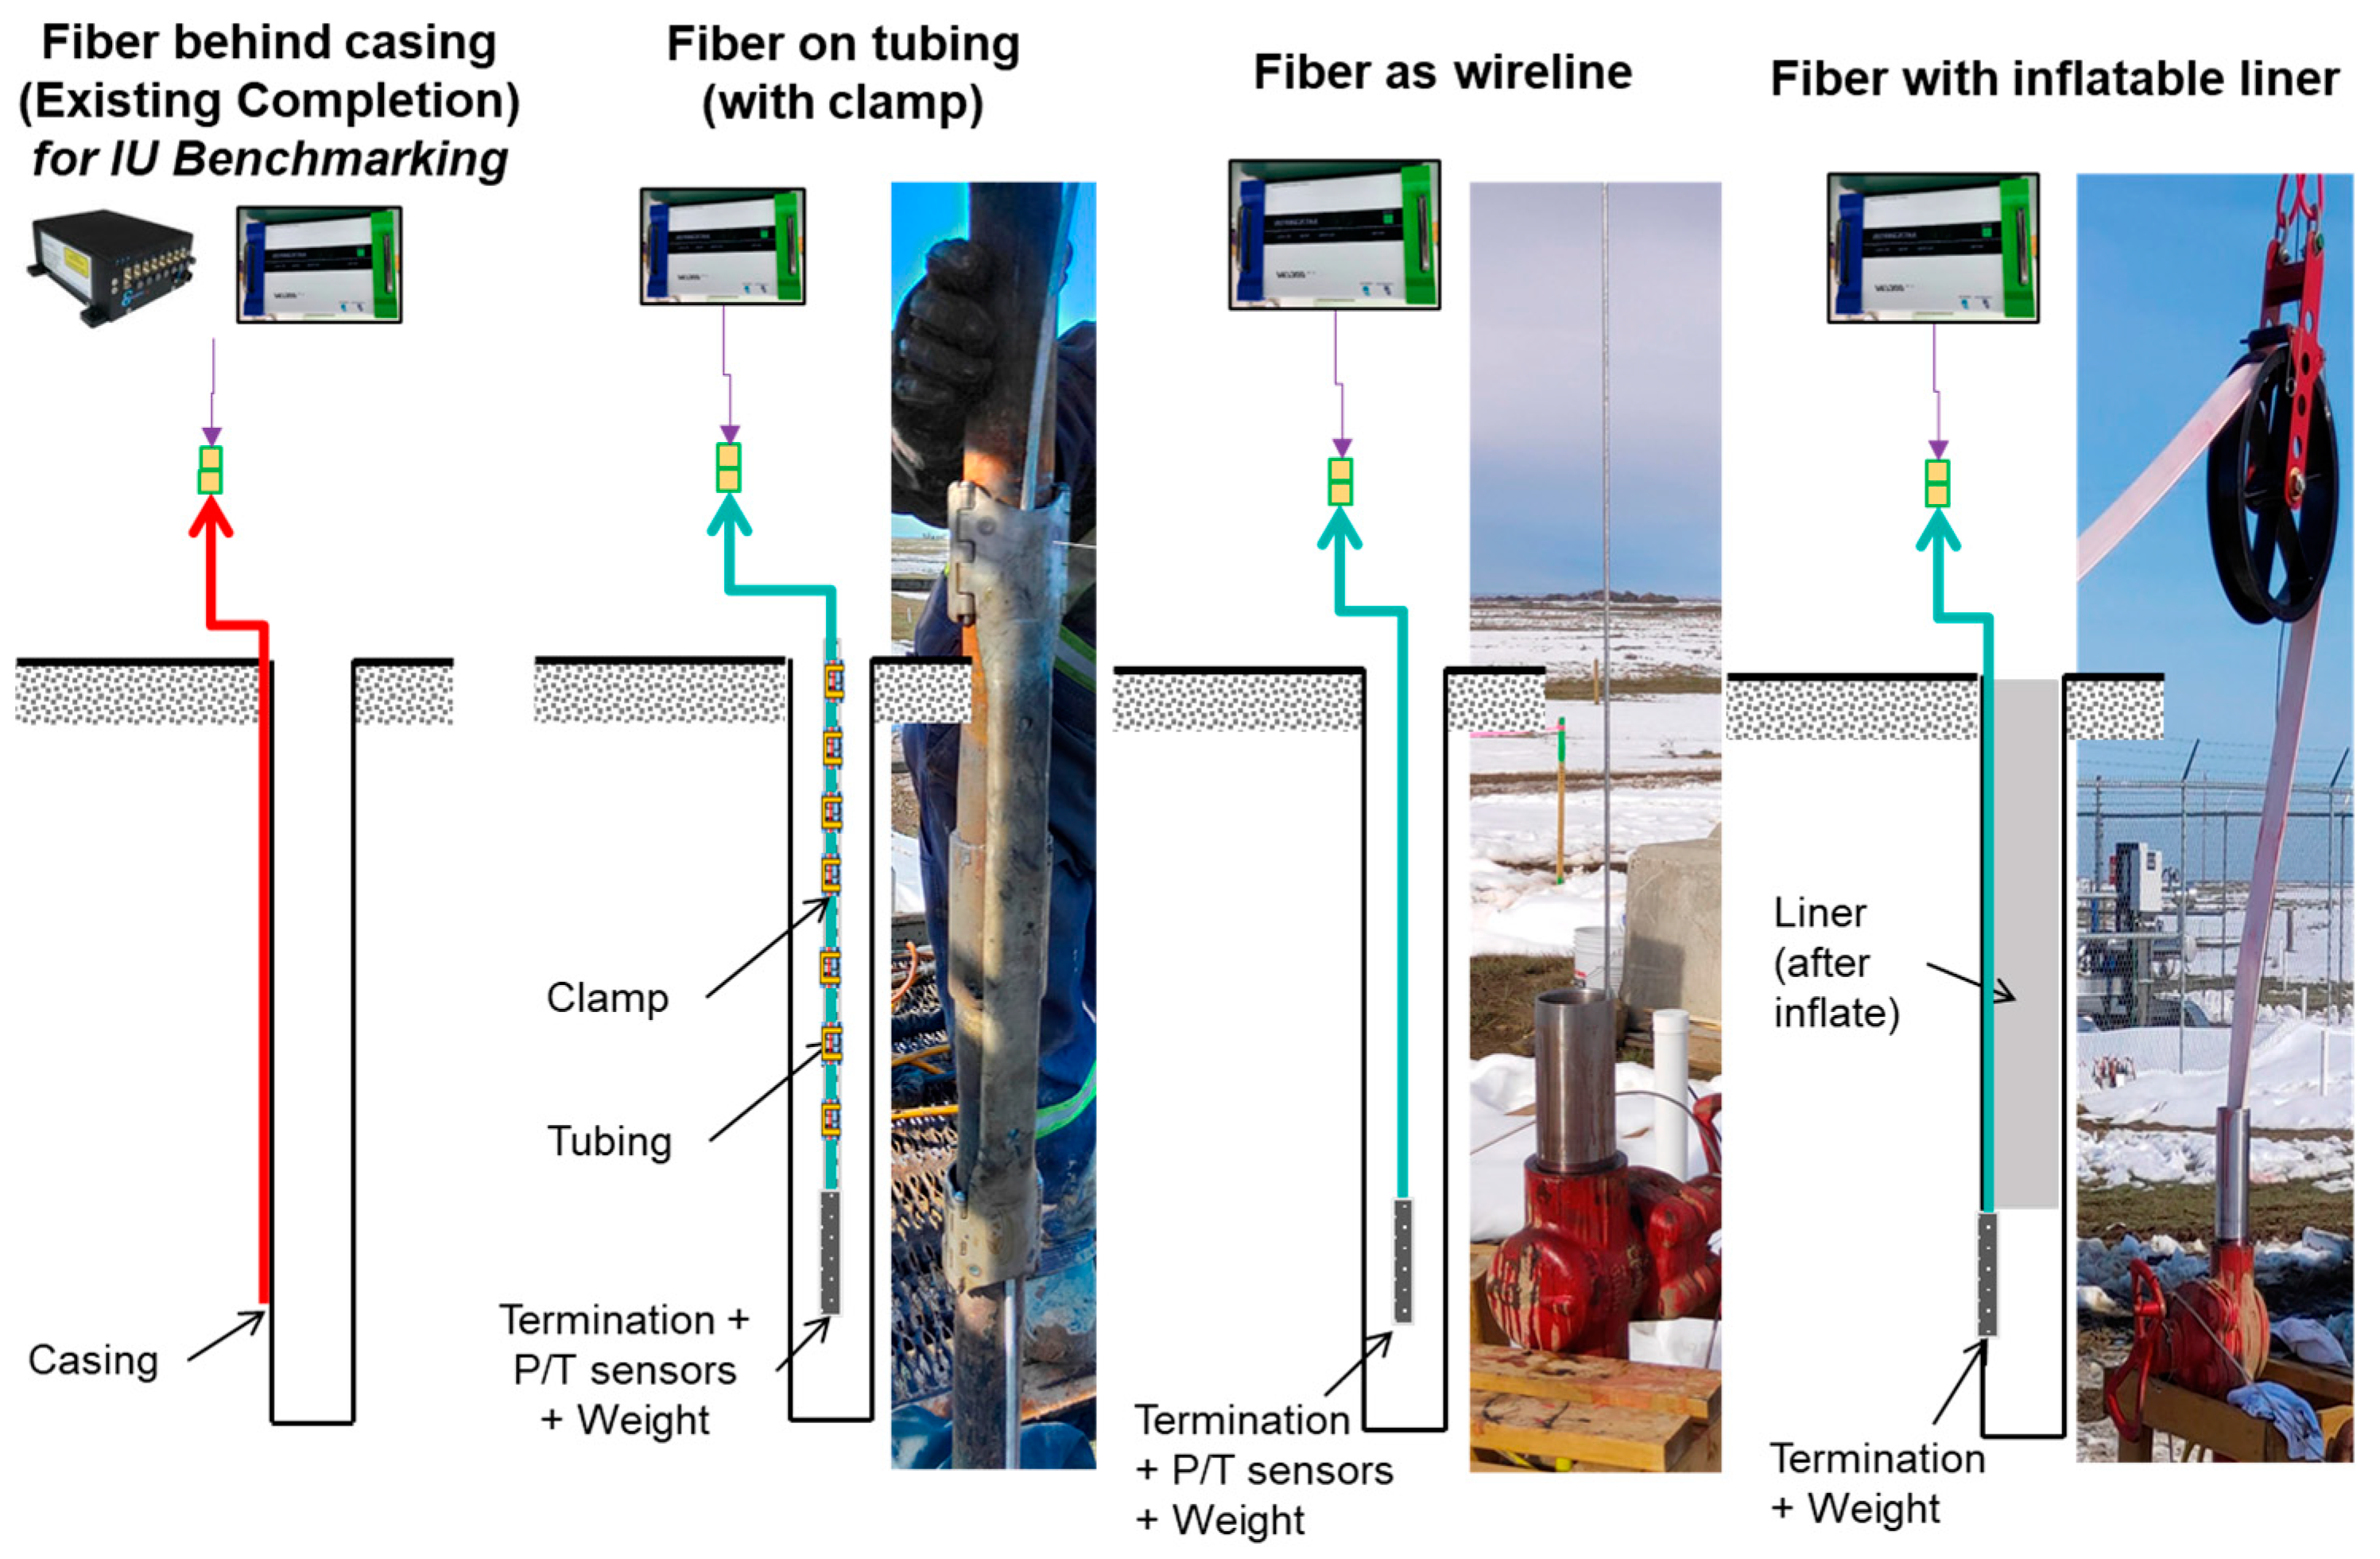
In our experiment, four different deployment strategies of DAS fibers/cables were implemented. These included: outside the well casing (existing fiber installed), clamped to the tubing, behind an inflatable liner, and as wireline tools along the entire extent of the well. The existing fiber cable was installed in a single loop at the bottom of the well and returned to the top and spliced to the next well and surface fiber array (Figure 3). For the other deployments, the cable was clamped to the tubing or lowered down as a single line to the bottom with a termination sub attached to the end of the fiber (Figure 4). One of the tests used an inflatable liner, which aimed to push the fiber lowered inside the well towards the inside wall of the well. By implementing these different deployment strategies, we aimed to determine the most optimal and cost-effective DAS fiber deployment for well completion without compromising data quality.
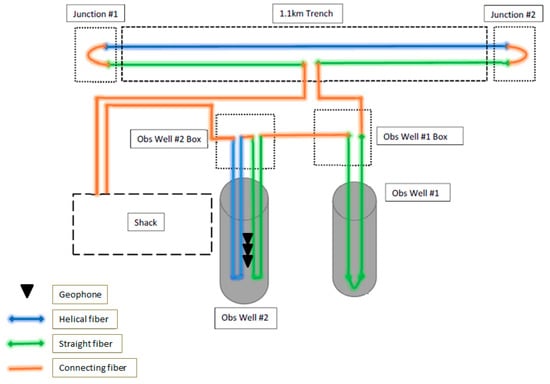
Figure 3.
Existing fiber optic cable deployment in CMC Field. Cable was deployed in a loop in two wells and along a surface trench. Obs Well #2 is used to compare with other deployment methods [37].
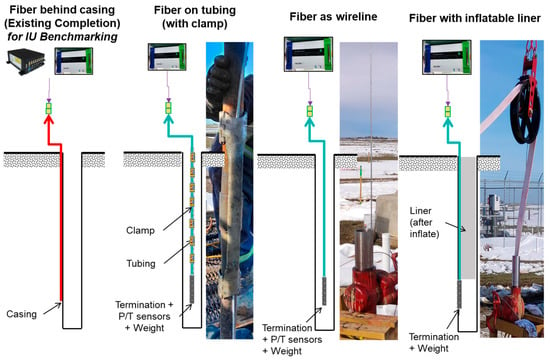
Figure 4.
Installation strategy simulation and method for optimum data acquisition for DAS VSP.
3.2. Data Acquisition
In the experiment, active sources were used to generate seismic waves and included a single 7257-kg Envirovibe P-wave Vibrator and an Envirovibe Shear (S) Wave Vibrator. Both vibe types (P and S) used a controlled vibratory sweep which had a linear pilot driving signal, i.e., 10–150 Hz, 16 s active sweep time with a 3 s listen time. Thus, for each active source, an uncorrelated record produced in these tests was 19 s temporal length. Four (4) sweeps per Vibroseis Point (VP) were generally used, with 16 sweeps per VP used on certain special VP locations (such as Zero-Offset) with sweep frequency from 10 to 150 Hz.
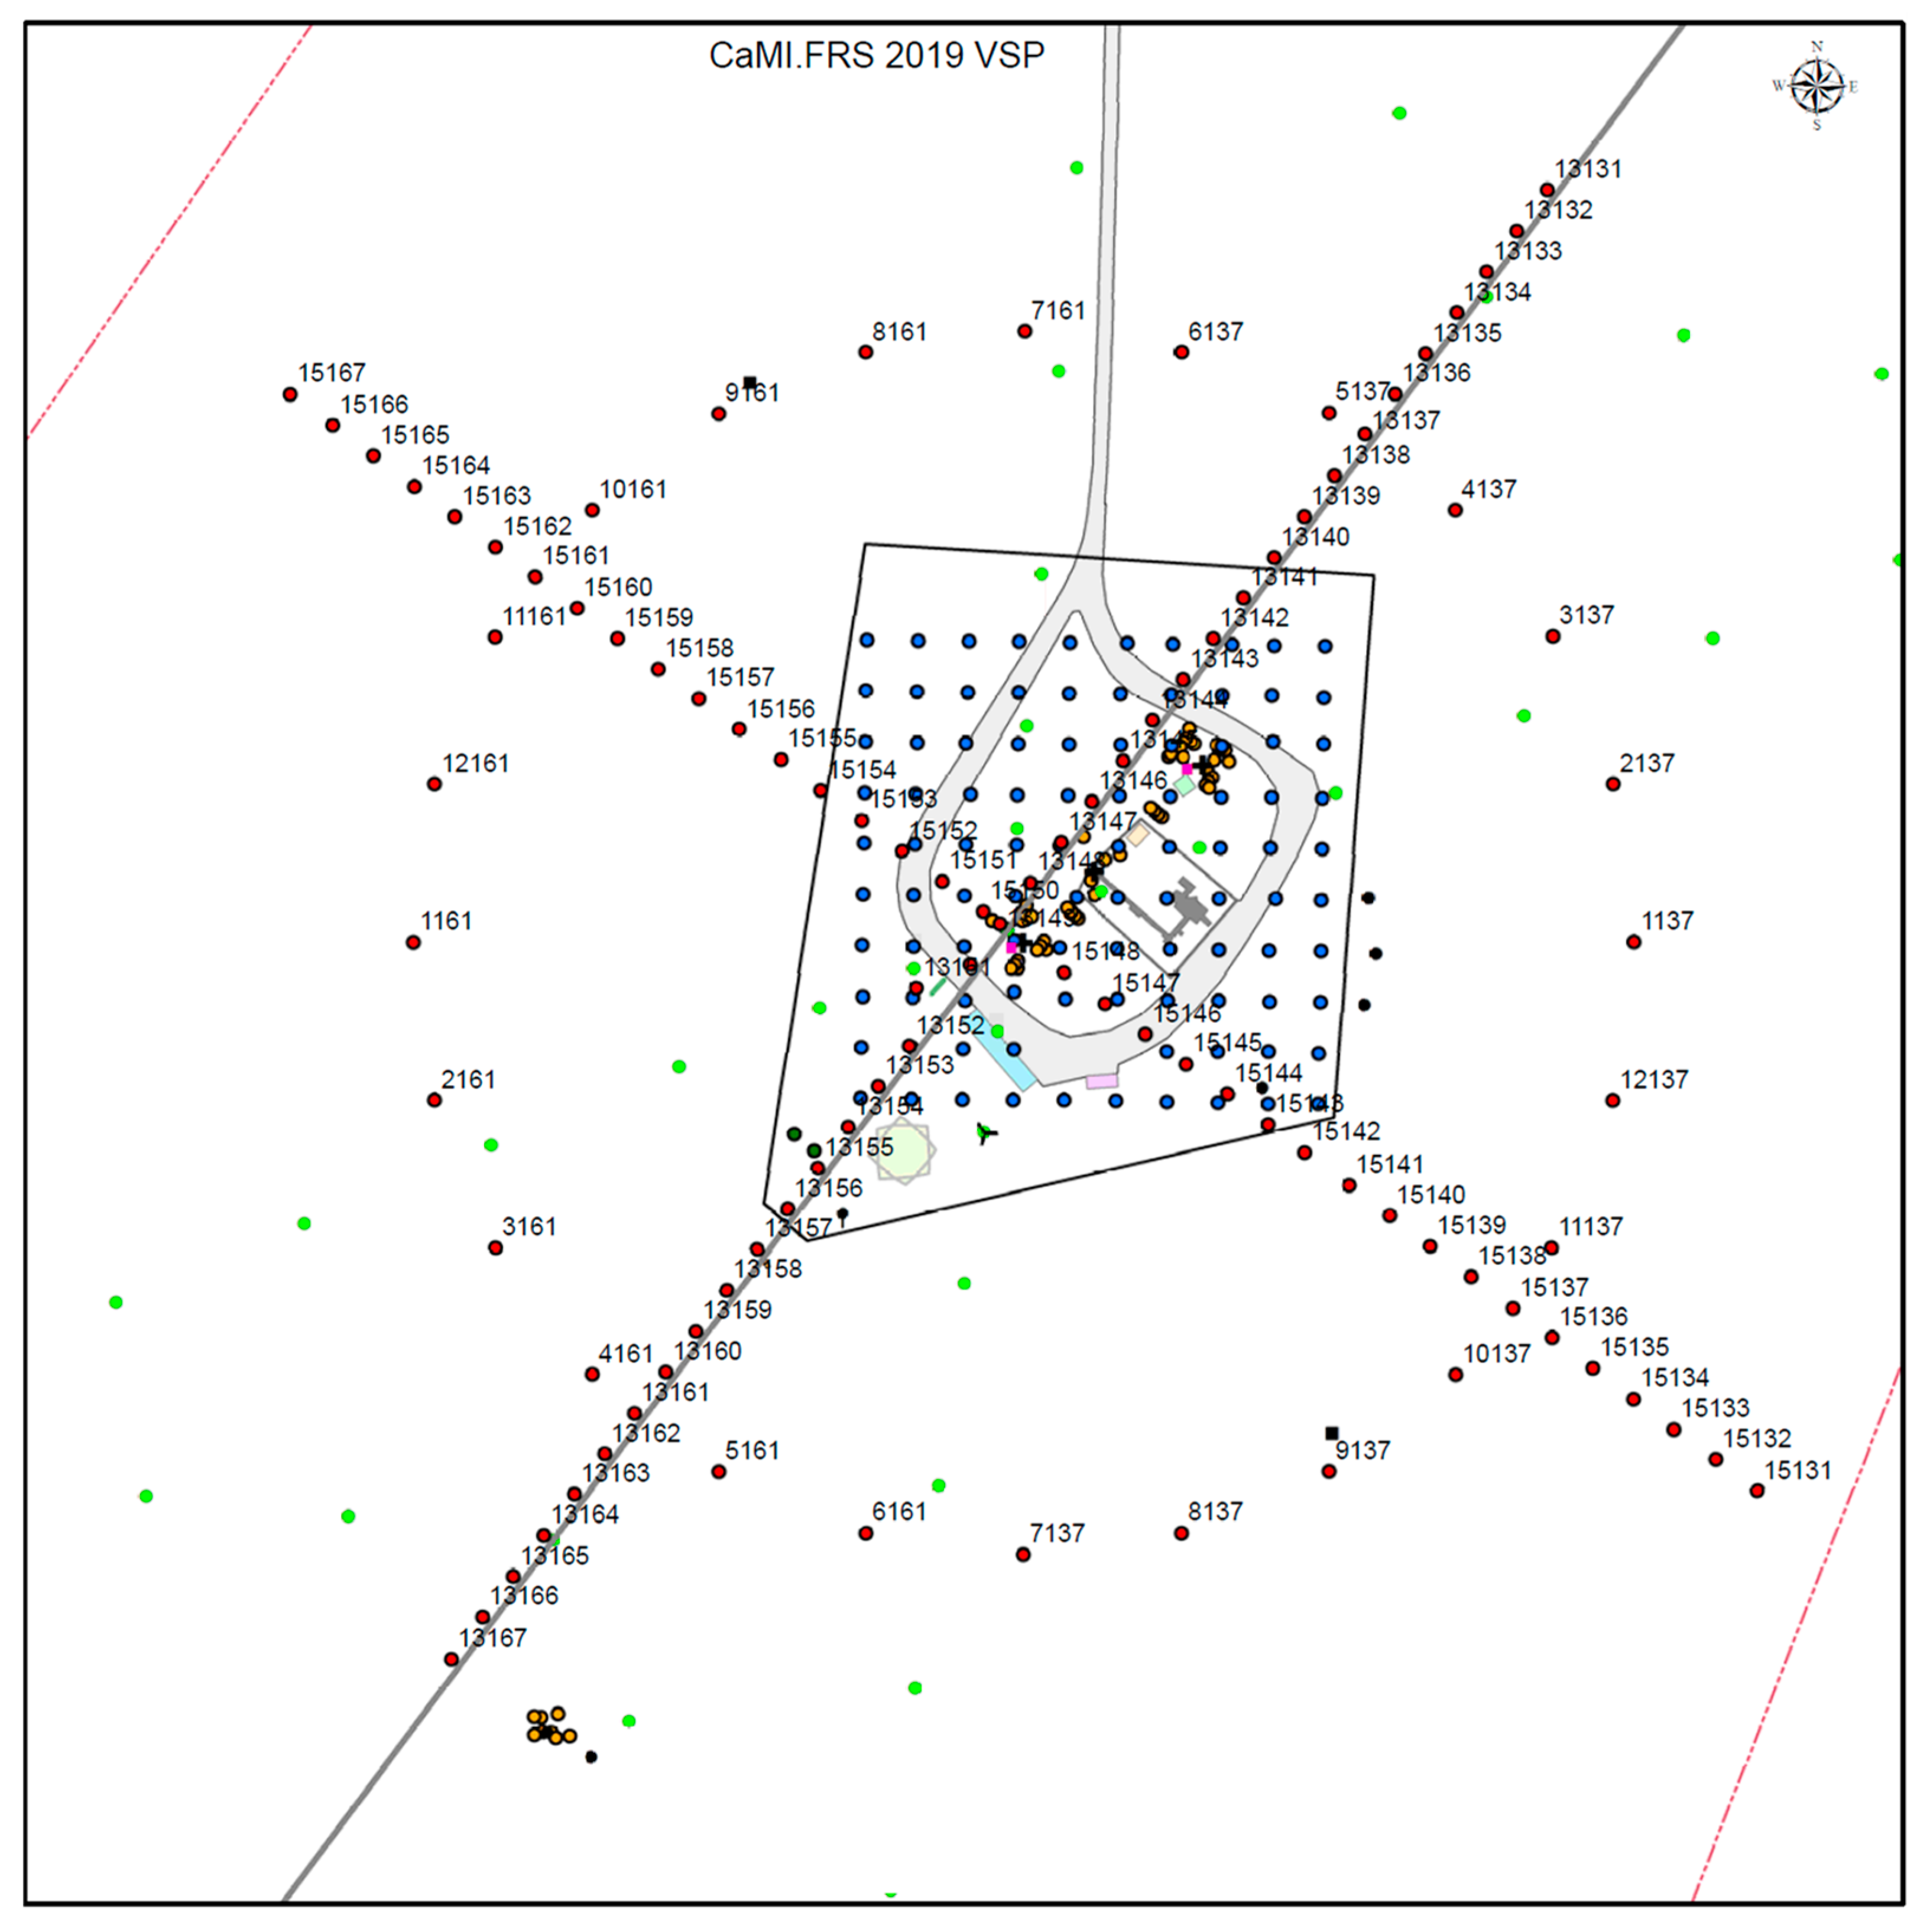
Sources were run across various geometrical configurations (Figure 5), including Walk-Away Lines, Walk-Around Circle, Zero-Offset, and Walk-Along (next to trench), each with a 10-m vibrator point interval. In some instances, a 20-m VP interval was used. In some limited special cases, an instantaneous thump type “sweep” was used as an additional experimental source input. The acquisition was done to meet the objective of gathering data to assess system characteristics, namely SNR, directional sensitivity (azimuthal), and spatial and temporal reflectivity resolution.
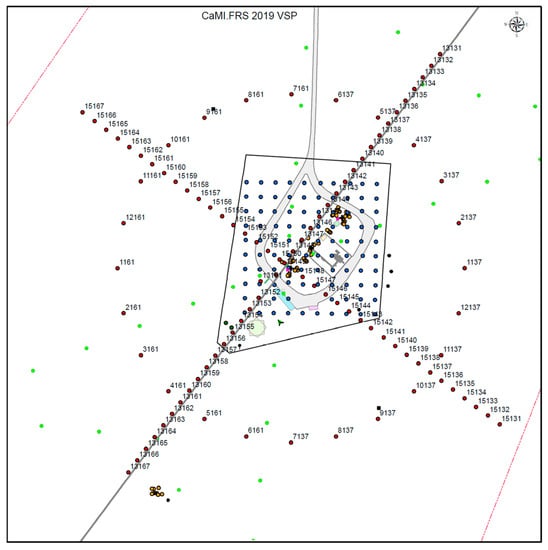
Figure 5.
CaMI Infrastructure and Vibroseis Source Vibrator Point (VP) map.
The DAS interrogator was used for this test with a 10-m gauge length and 0.2 m sampling interval. To increase SNR, DAS data was stacked with 16 repeated shots. The use of various active sources and acquisition techniques aimed to provide a comprehensive understanding of the system’s characteristics and performance, and to evaluate the effectiveness of DAS in monitoring subsurface changes in the well.
3.3. Data Processing
The data collected was analyzed to further understand the effectiveness of the different deployment strategies. The ease of picking first arrivals and separating the up- and down-going wavefields in the presence of noise is one of the most important aspects of the data processing flow. This process helped to calibrate the data in depth against the geophones at the bottom of the well, as the attempt to define depths in the well using tap tests did not provide accurate results [38]. To ensure that all datasets were comparable, the velocity model was derived from the surface seismic tests conducted earlier in the CMC program.
The process of selecting the initial arrival times, known as picking first breaks, is a crucial step in the analysis of VSP data collected using DAS. This step can be challenging, particularly when working with data from different cable deployment methods. Inaccurate or unreliable first break picks can negatively impact the overall reliability and accuracy of the final image.
Determining the precise depth of the fiber optic cable in the well is also crucial for obtaining accurate seismic data [39]. This is because the relationship between the depth of the cable and the distance traveled by the light in the cable can be affected by bends and twists in the cable. In this study, geophones near the base of the well were used for calibration to help establish the cable’s true depth. However, if geophones are not available, other methods, such as acoustic logs, may be necessary to obtain a precise depth measurement. This is especially important when working with other cable deployment methods, such as the liner, tubing and wireline, as it is harder to calibrate the cable’s depth in these scenarios. This accurate cable positioning is essential for obtaining high-quality seismic data and creating a reliable image of the subsurface.
4. Results
The process of transforming the data collected from DAS into Common Depth Point (CDP) domains is a complex one that requires several crucial steps. One of the first steps in this process is the ease of picking first arrivals and separating the up- and down-going wavefields, while also accounting for any noise that may be present due to the various cable combinations and deployments used. To ensure that the data is accurate, depth calibration is necessary by comparing it against geophones at the bottom of the well. However, this process can be difficult as the attempt to define depths using tap tests may not match up with the geophone data. In our study, the existing CaMI cable was used for calibration, but shot statics were derived as the sources occupied different locations. However, during the signal processing, the deployment for the tubing installation did not proceed, as the SNR was very low and the seismic amplitude was weak.
In our field study, the next step, picking first breaks, was most straightforward when using the cemented cable data, as this method provided the best coupling with the surrounding earth. However, picking first breaks proved more difficult when using other methods, such as the liner or tubing deployment. This is because these methods can lead to weaker signals and higher levels of noise, making it harder to distinguish the first arrival times.
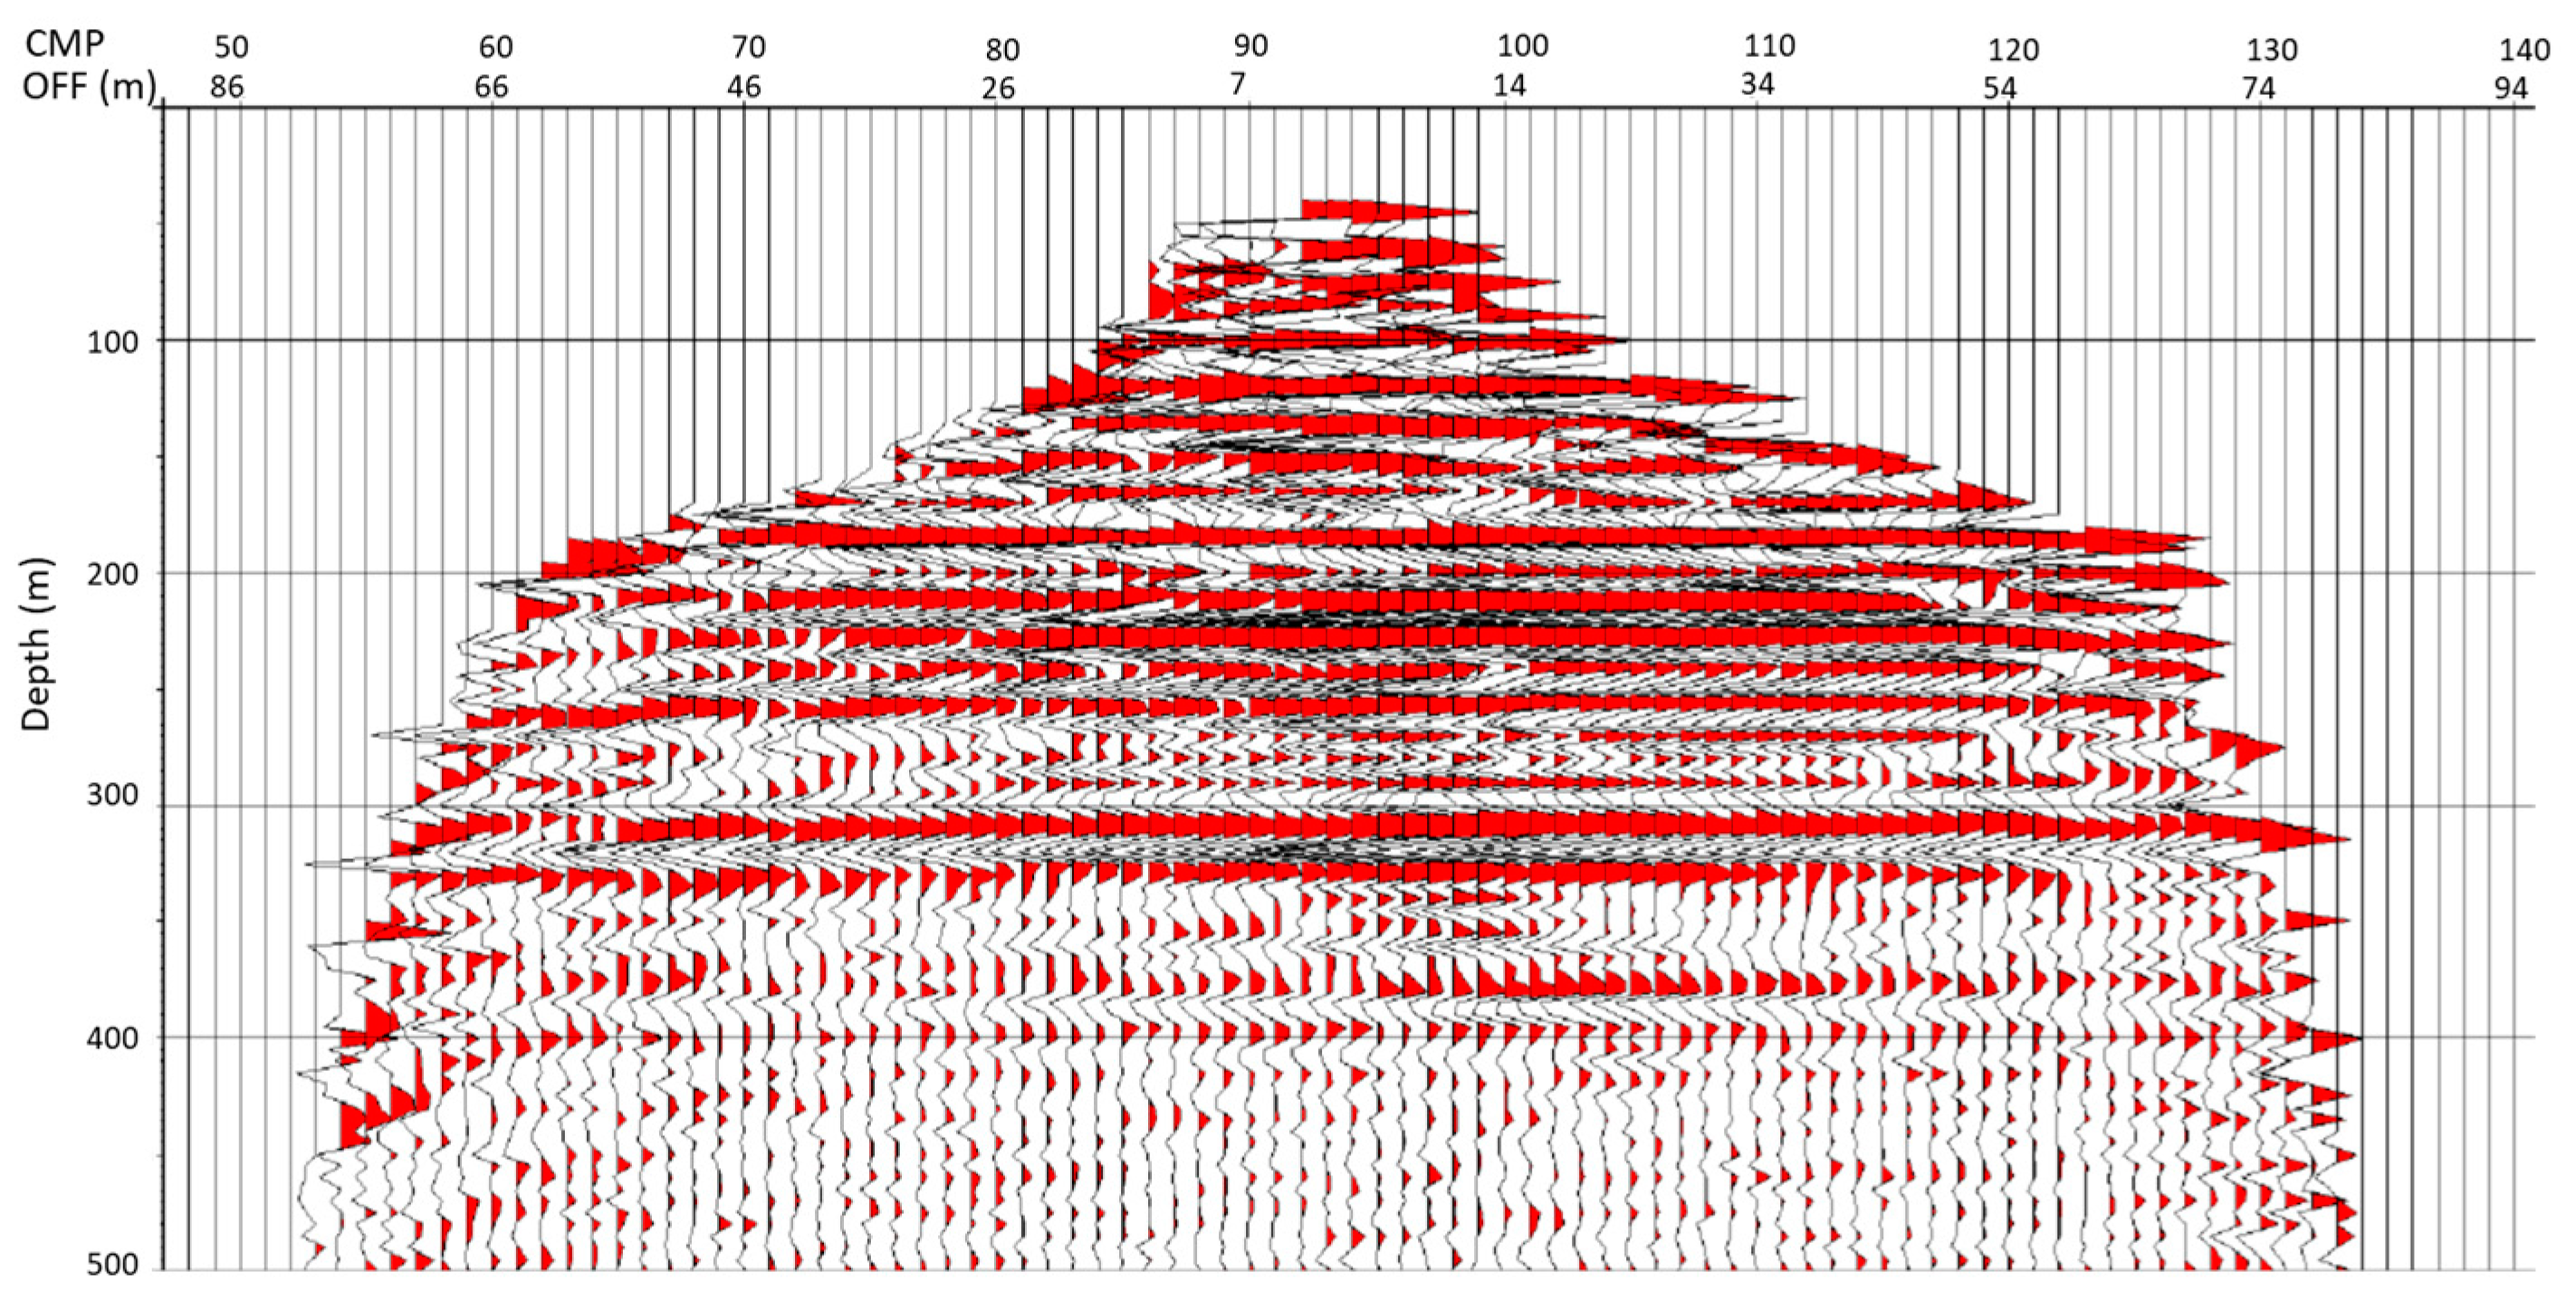
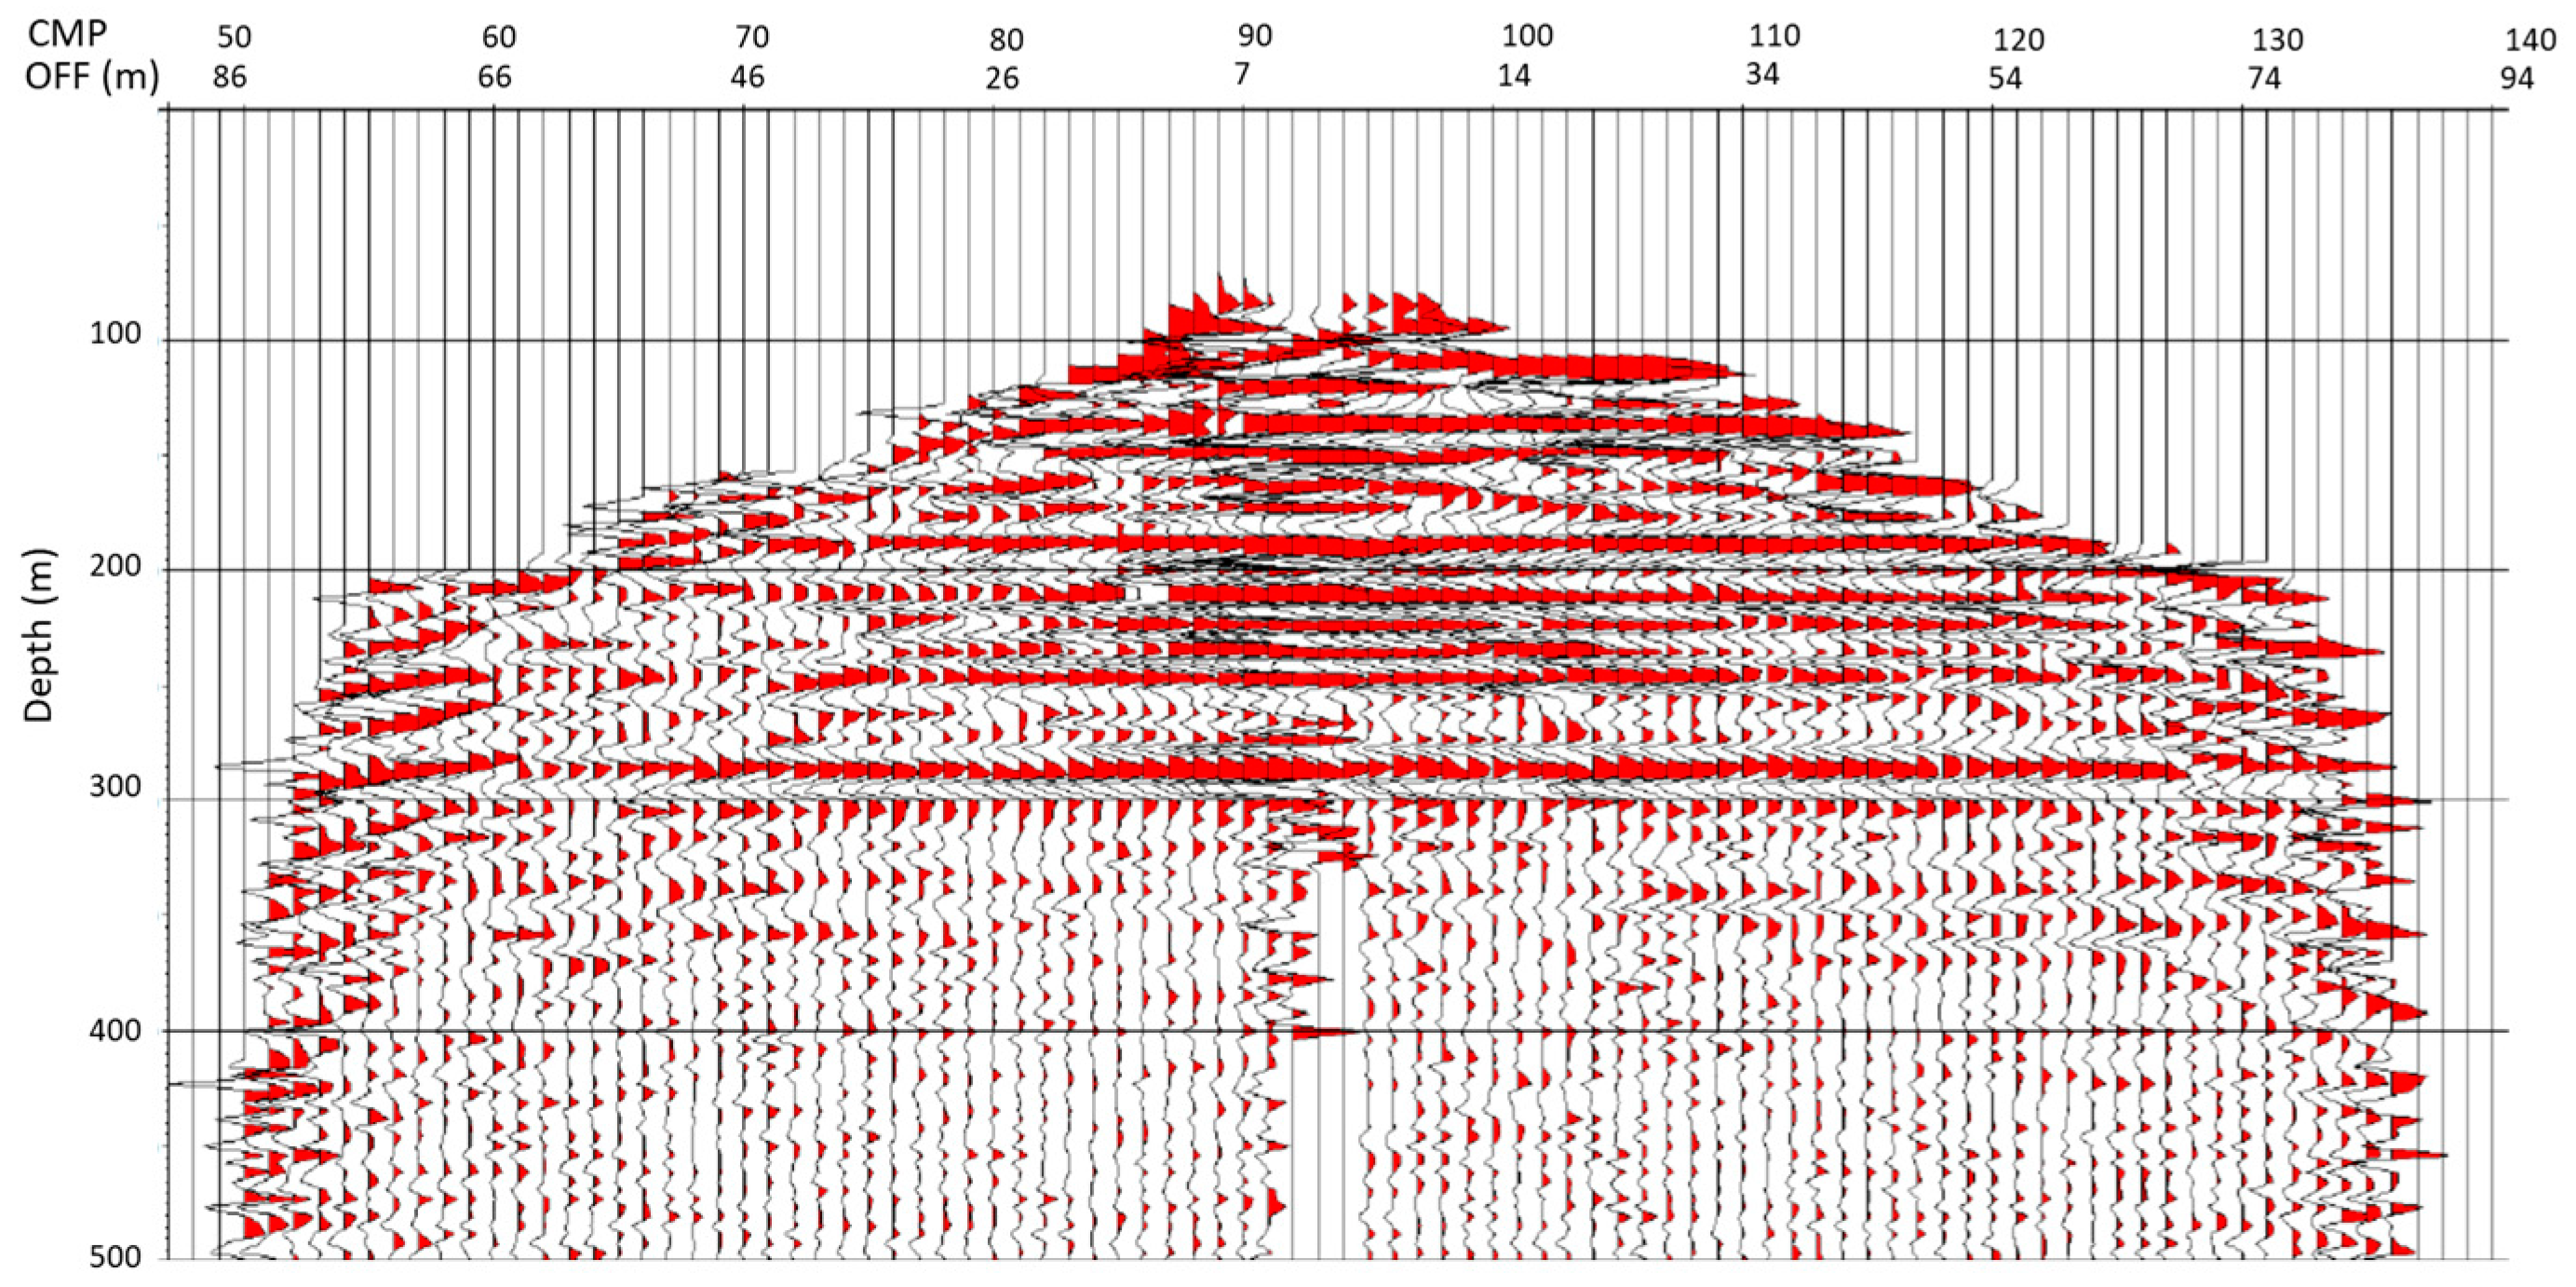
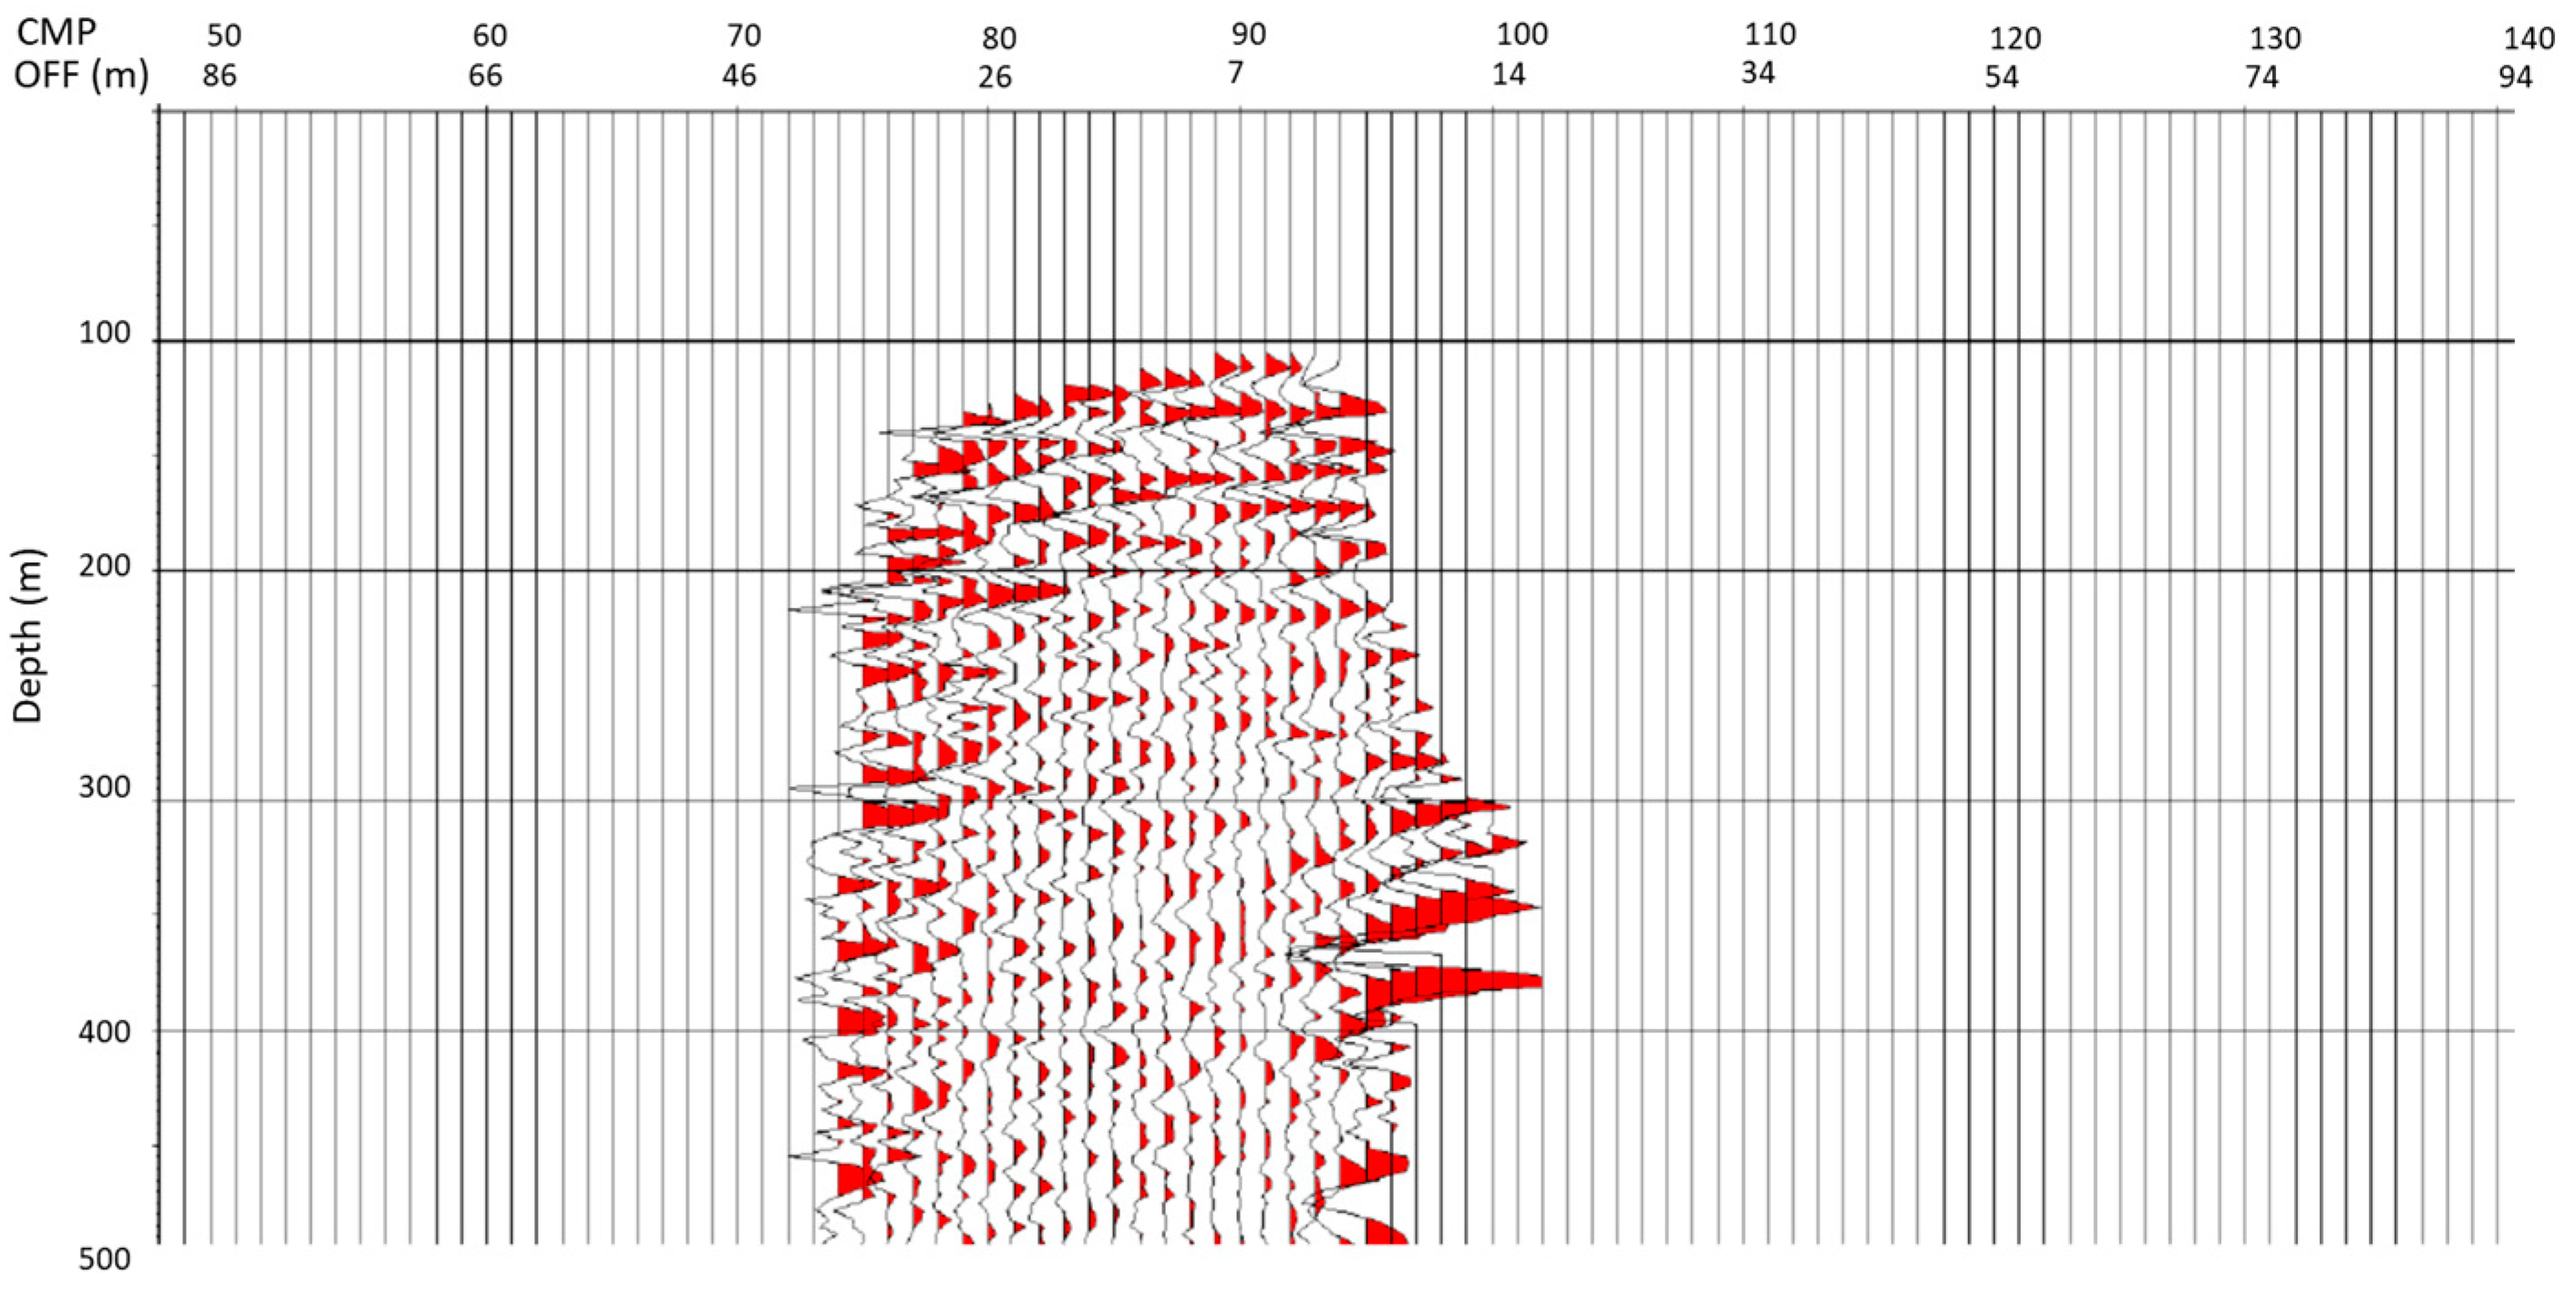
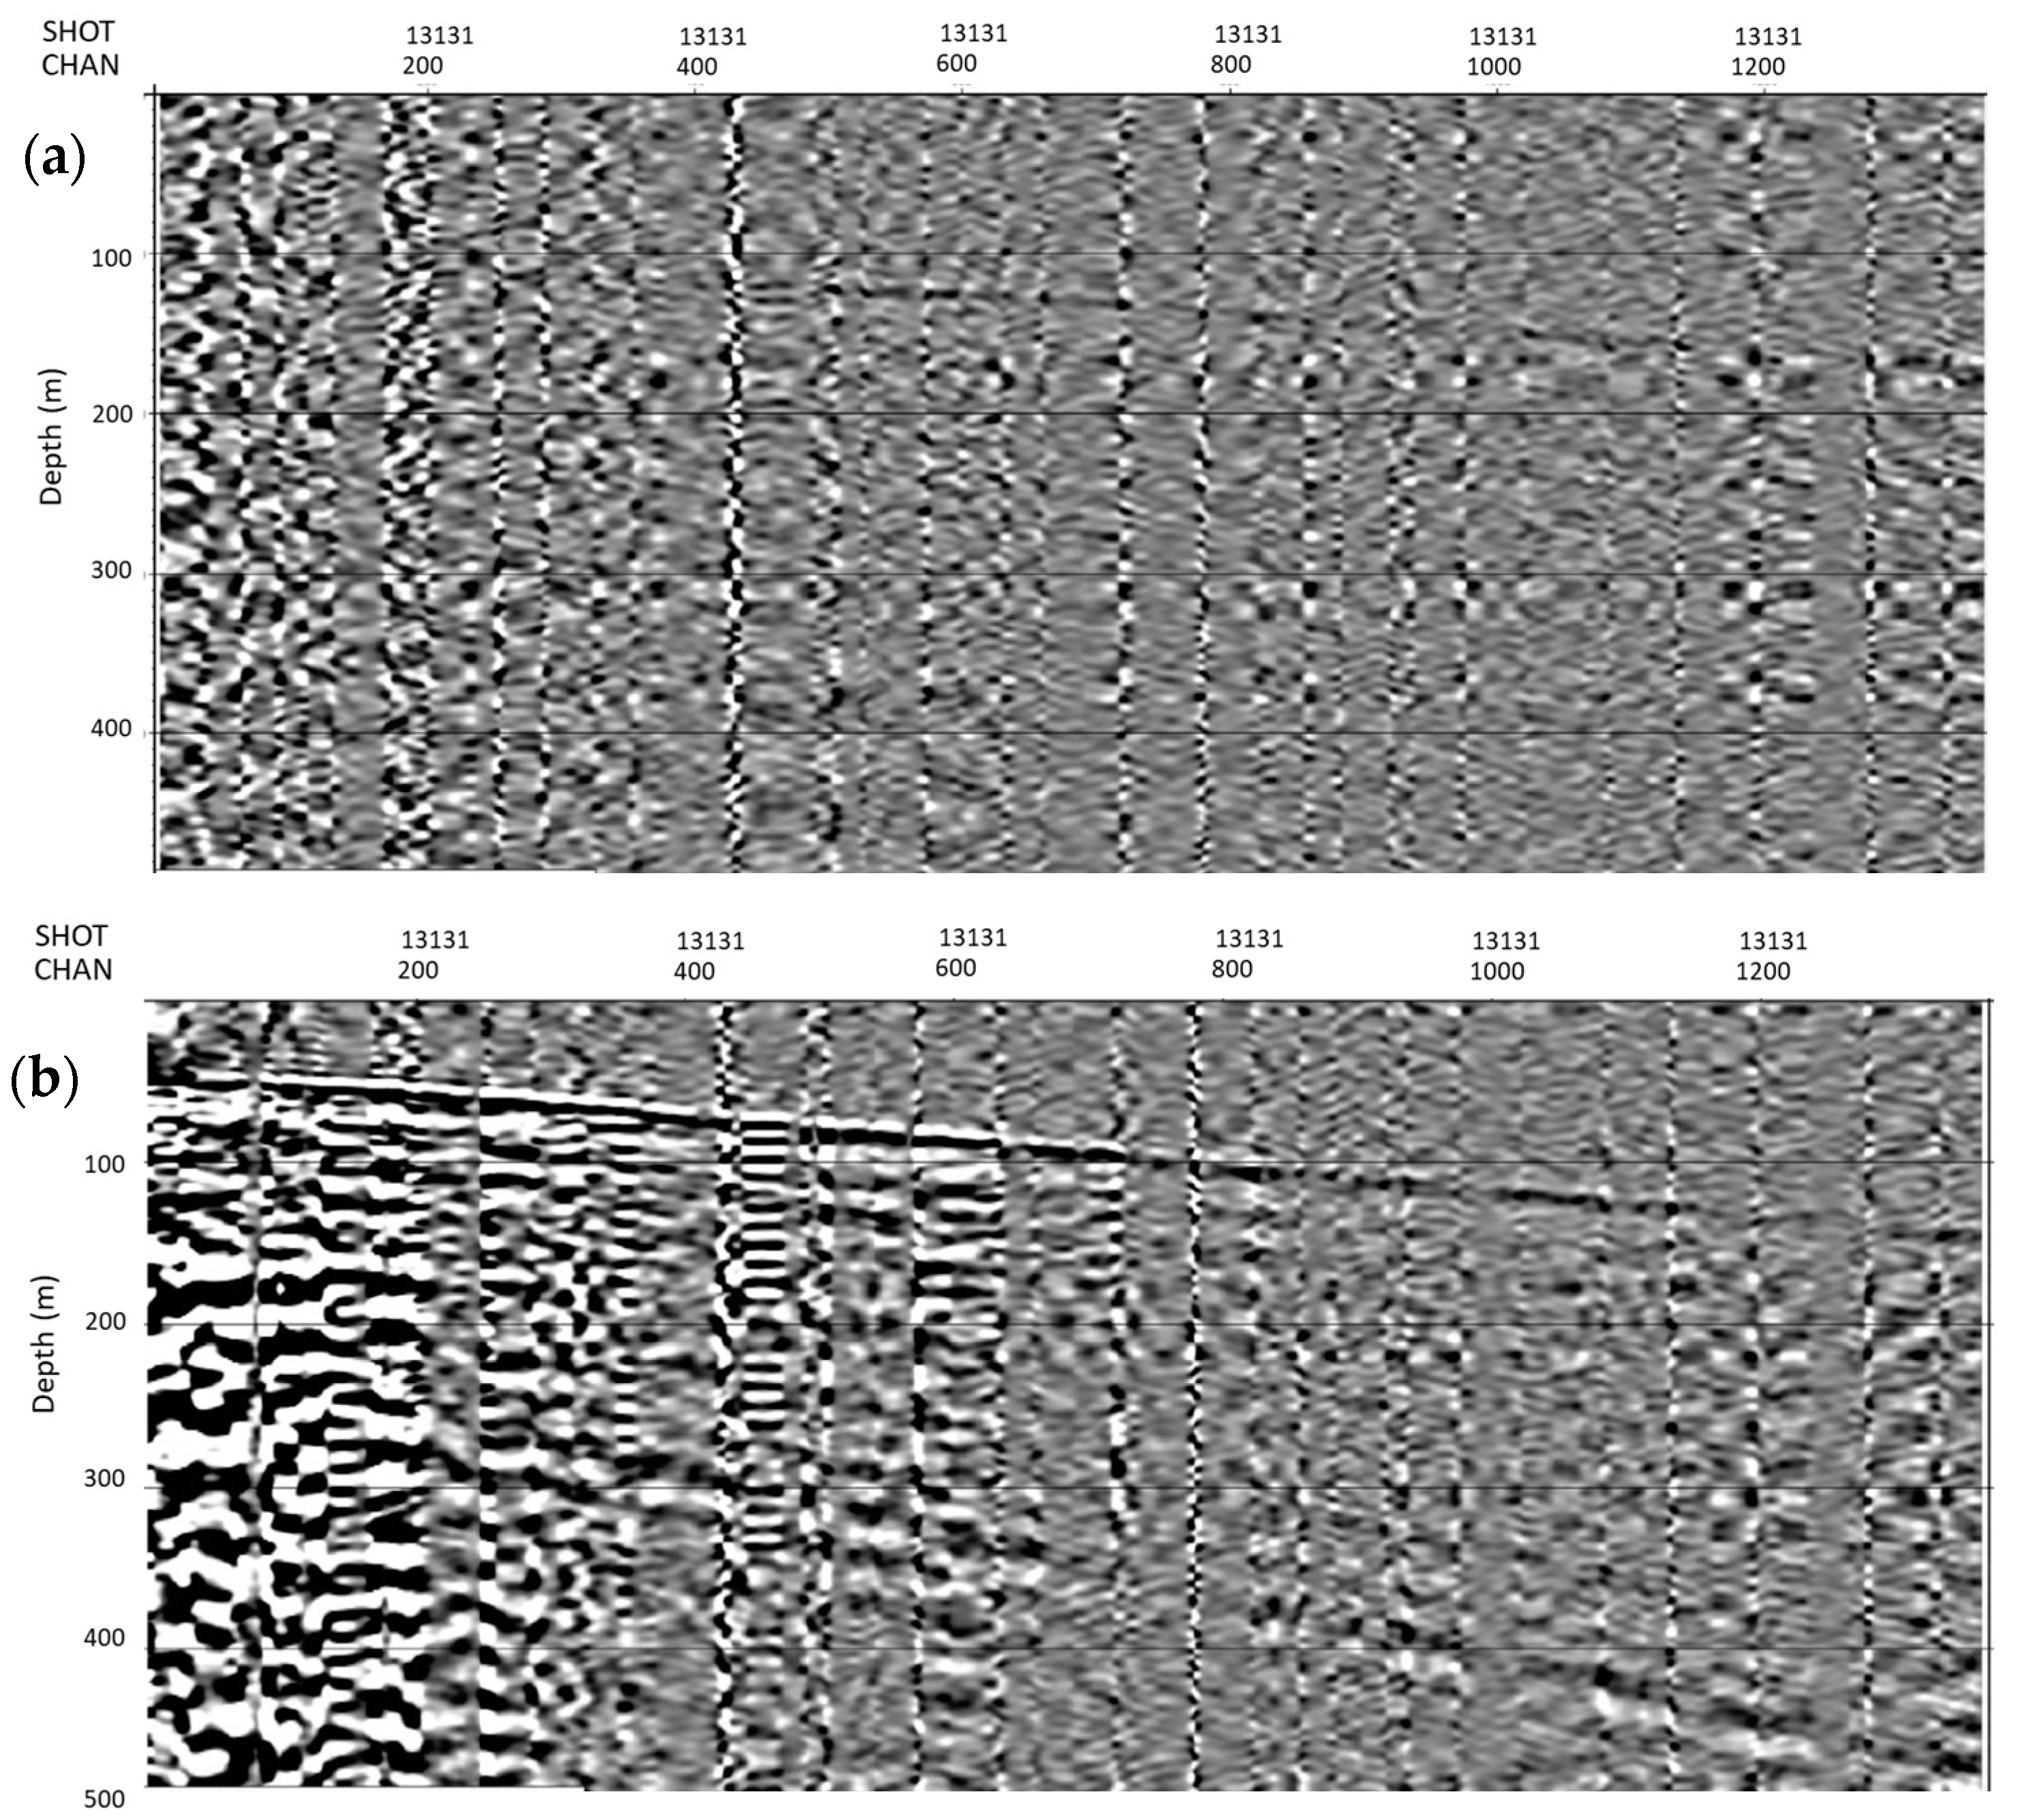
During the imaging process, timing jitter in the data needs to be smoothed out and the use of a fine 20-cm sampling interval acts as a benefit. Deconvolution of the up-going wavefield using the down-going wavefield as a source signature helps to attenuate multiple reflection energies and enhance the bandwidth of the up-going wavefield. The final imaging stage of the VSP–CDP transform using ray tracing through the pre-defined velocity model resulted in excellent images for the cemented cable data (Figure 6) and the cables behind inflatable liner (Figure 7). However, the image for the cable as wireline in the water-filled well (Figure 8) was limited to an extent, as only seven short offset shots could be used. As for strapped to tubing deployment, the SNR was very low, making the gather unable to be used for DAS VSP processing (Figure 9).
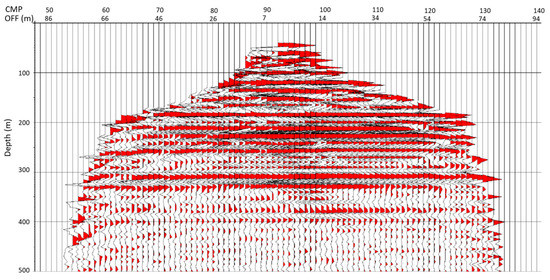
Figure 6.
VSP to CDP transform in time (ms) for the cemented cable.
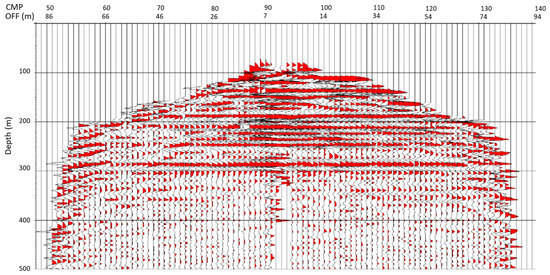
Figure 7.
VSP to CDP transform in time (ms) for the cable installed behind inflatable liner.
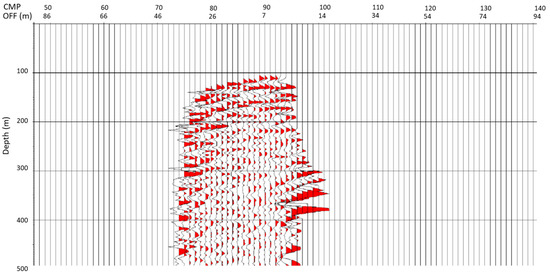
Figure 8.
VSP to CDP transform in time (ms) for the cable as wireline in WATER.
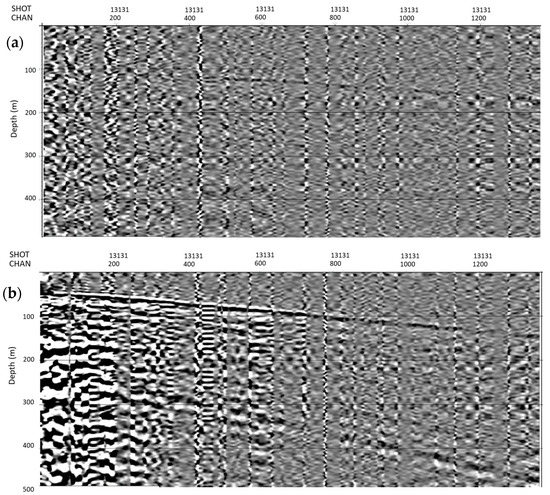
Figure 9.
Raw recording of cable deployment on tubing. (a) Shot gathers from far offset; (b) shot gathers from near offset.
Data attenuation occurred in all the deployment methods, most severely from the fiber on tubing installation in which the VSP data were unable to be imaged. The attenuation of DAS VSP data can lead to reduced SNR and affect the quality of the seismic data. Several issues were identified as the cased for poor SNR in the deployment. In wireline and on tubing installation, poor coupling between the fiber-optic cable and the surrounding medium led to a weak signal that was difficult to detect over background noise. To mitigate this, it is important to ensure that the fiber-optic cable is properly installed and in good contact with the surrounding medium as indicated in the permanent behind casing and via inflatable liner.
Strong tubing waves can be observed when the fiber-optic cable is deployed inside the tubing as wireline and on the tubing itself. Tubing waves are acoustic waves that propagate along the tubing and cause interference with the DAS VSP measurements. This interference led to a reduction in the SNR and affected the quality of the VSP data for these two deployment methods.
5. Discussion
The fiber cemented behind casing trial produced high-quality subsurface images, proving that DAS cable data is capable of generating such results, even if the raw field data appear insufficient. The fiber cemented behind casing trial also revealed key insights that were applied to other fiber deployment methods (clamped to tubing, behind inflatable liner, and wireline), such as the need for fine spatial source sampling and the requirement to acquire geophone data to calibrate the DAS fiber cable/interrogator combinations in depth (Table 1).

Table 1.
Quality conformance of fiber optic sensing demonstrates the field deployment advantages and disadvantages in data quality, sensitivity, and accuracy. Optimum data quality acquisition for reservoir monitoring is to place fiber optic cable behind casing and cable on tubing. Cable deployment with inflatable liner is not suitable for deep well deployment.
The raw data from the clamped to tubing, behind inflatable liner, and wireline methods showed low signal-to-noise ratios and picking first breaks was challenging. However, picking first breaks was easier on the fiber cemented behind casing data, which has the best earth coupling. The first breaks from the fiber behind inflatable liner were easier to pick than from the clamped to tubing and wireline methods. Picking first breaks is critical to the process as it is a foundation for subsequent steps, such as wavefield separation and velocity model building.
Correct positioning of the cable in relation to true depth is also important, and in this case, geophones near the base of the well were used for calibration. Using the tap tests and nominal cable distance alone provided poor depth estimates, due to factors such as cable twists and bends, signal quality, and other causes. If geophones are not available, other methods such as acoustic logs could be used, provided there is a distinct reflection sequence.
The data had significant timing jitter that needed to be smoothed out. This was a result of the fine 20 cm sampling interval, which was also beneficial for the imaging process. The deconvolution of the up-going wavefield using the down-going wavefield as a source signature successfully reduced multiple reflection energies and increased the bandwidth of the up-going wavefield, making it suitable for the final imaging stage. The VSP–CDP transform using the pre-defined velocity model generated high-quality images for the fiber cemented behind casing and the fiber behind inflatable liner data, but the image for the wireline fiber cable in the water-filled well was limited due to only seven short offset shots being used.
The excellent VSP–CDP images were a pleasant surprise, considering the low quality of the raw input data and initial low expectations. This result highlights the robustness of the processing sequence and the attention to detail given at each step of the process.
6. Conclusions
The field study conducted to evaluate DAS in a test well revealed that the best method for coupling the DAS cable to the earth is to install it with the casing at the time of drilling, when and if possible. The study found that deploying the cable in a water-filled well did not yield good results and imaging DAS VSP for on-tubing deployment was not possible due to low SNR. The use of an inflatable liner to push the cable against the side of the wellbore was found to be the best alternative for a free well. The DAS cables also needed to be depth calibrated against a reference, as tap tests were not found to be reliable. The extent of the DAS cable from the surface to near the bottom of the well enabled the construction of a comprehensive and detailed velocity model. It was also important to correct for source statics due to differences in elevation or local weathering effects in order to obtain the optimal resolution in the final image. With careful processing and attention to detail, the fine resolution of the DAS fiber optic cables can yield excellent results and provide an image that covers most of the depth range of the well, significantly better than geophones due to their limited depth range and generally poorer vertical resolution.
Author Contributions
Conceptualization, M.H.M.Z. and A.R.G.; methodology, M.H.M.Z.; formal analysis, M.H.M.Z.; investigation, M.H.M.Z. and K.M.A.A.; data curation, M.H.M.Z. and K.M.A.A.; writing—original draft preparation, M.H.M.Z.; writing—review and editing, M.H.M.Z. and A.H.A.L.; supervision, A.R.G. and A.H.A.L. All authors have read and agreed to the published version of the manuscript.
Funding
Universiti Teknologi Petronas: 015MD0-076.
Institutional Review Board Statement
Not applicable.
Informed Consent Statement
Not applicable.
Data Availability Statement
Not applicable.
Acknowledgments
The authors would like to thank the management of PETRONAS, PETRONAS Research and UTP for allowing us to pursue and publish this work through 015MD0-076. The authors would also like to thank Neubrex Co., Ltd. (Kobe, Japan) and CMC Research Institutes who contributed to the field trial.
Conflicts of Interest
The authors declare no conflict of interest.
References
- Mestayer, J.; Cox, B.; Wills, P.; Kiyashchenko, D.; Lopez, J.; Costello, M.; Bourne, S.; Ugueto, G.; Lupton, R.; Solano, G.; et al. Field Trials of Distributed Acoustic Sensing for Geophysical Monitoring. In SEG Technical Program Expanded Abstracts 2011; Society of Exploration Geophysicists: Tulsa, OK, USA, 2011; pp. 4253–4257. [Google Scholar] [CrossRef]
- Mateeva, A.; Lopez, J.; Potters, H.; Mestayer, J.; Cox, B.; Kiyashchenko, D.; Wills, P.; Grandi, S.; Hornman, K.; Kuvshinov, B.; et al. Distributed Acoustic Sensing for Reservoir Monitoring with Vertical Seismic Profiling. Geophys. Prospect. 2014, 62, 679–692. [Google Scholar] [CrossRef]
- Pendão, C.; Silva, I. Optical Fiber Sensors and Sensing Networks: Overview of the Main Principles and Applications. Sensors 2022, 22, 7554. [Google Scholar] [CrossRef]
- Lindsey, N.J.; Martin, E.R.; Dreger, D.S.; Freifeld, B.; Cole, S.; James, S.R.; Biondi, B.L.; Ajo-Franklin, J.B. Fiber-Optic Network Observations of Earthquake Wavefields. Geophys. Res. Lett. 2017, 44, 11792–11799. [Google Scholar] [CrossRef]
- Lellouch, A.; Biondi, B.L. Seismic Applications of Downhole DAS. Sensors 2021, 21, 2897. [Google Scholar] [CrossRef] [PubMed]
- Cheng, F.; Chi, B.; Lindsey, N.J.; Dawe, T.C.; Ajo-Franklin, J.B. Utilizing Distributed Acoustic Sensing and Ocean Bottom Fiber Optic Cables for Submarine Structural Characterization. Sci. Rep. 2021, 11, 5613. [Google Scholar] [CrossRef] [PubMed]
- Ghazali, A.R.; Abdul Rahim, M.F.; Mad Zahir, M.H.; Muhammad, M.D.; Mohammad, M.A.; Aziz, K.M.A. Ears On Wells: Reservoir Delineation and Monitoring Using True 3D Imaging Approaches. In Proceedings of the SPE Annual Technical Conference and Exhibition, Calgary, AB, Canada, 30 September 2019. [Google Scholar] [CrossRef]
- Daley, T.M.; Freifeld, B.M.; Ajo-Franklin, J.; Dou, S.; Pevzner, R.; Shulakova, V.; Kashikar, S.; Miller, D.E.; Goetz, J.; Henninges, J.; et al. Field Testing of Fiber-Optic Distributed Acoustic Sensing (DAS) for Subsurface Seismic Monitoring. Lead. Edge 2013, 32, 699–706. [Google Scholar] [CrossRef]
- Yuan, S.; Lellouch, A.; Clapp, R.G.; Biondi, B. Near-Surface Characterization Using a Roadside Distributed Acoustic Sensing Array. Lead. Edge 2020, 39, 646–653. [Google Scholar] [CrossRef]
- Rusmanugroho, H.; Jaya, M.S.; Zahir, M.H.; Rahim, M.F. Pre-Stack Depth Migration of High Resolution Distributed Acoustic Sensing VSP. In Proceedings of the International Petroleum Technology Conference, Virtual, 23 March 2021. [Google Scholar] [CrossRef]
- Parker, T.; Shatalin, S.; Farhadiroushan, M. Distributed Acoustic Sensing—A New Tool for Seismic Applications. First Break 2014, 32. [Google Scholar] [CrossRef]
- Bakku, S.K.; Fehler, M.; Wills, P.; Mestayer, J.; Mateeva, A.; Lopez, J. Vertical Seismic Profiling Using Distributed Acoustic Sensing in a Hydrofrac Treatment Well. In SEG Technical Program Expanded Abstracts 2014; Society of Exploration Geophysicists: Tulsa, OK, USA, 2014; pp. 5024–5028. [Google Scholar] [CrossRef]
- Fenta, M.C.; Potter, D.K.; Szanyi, J. Fibre Optic Methods of Prospecting: A Comprehensive and Modern Branch of Geophysics. Surv. Geophys. 2021, 42, 551–584. [Google Scholar] [CrossRef]
- Hartog, A.H. Distributed Sensors in the Oil and Gas Industry. In Optical Fibre Sensors; The Institute of Electrical and Electronics Engineers, Inc.: New York, NY, USA, 2020. [Google Scholar] [CrossRef]
- Chen, M.; Masoudi, A.; Parmigiani, F.; Brambilla, G. Distributed Acoustic Sensor Based on a Two-Mode Fiber. Opt. Express 2018, 26, 25399. [Google Scholar] [CrossRef]
- Fernández-Ruiz, M.R.; Soto, M.A.; Williams, E.F.; Martin-Lopez, S.; Zhan, Z.; Gonzalez-Herraez, M.; Martins, H.F. Distributed Acoustic Sensing for Seismic Activity Monitoring. APL Photonics 2020, 5, 030901. [Google Scholar] [CrossRef]
- Fernandez-Ruiz, M.R.; Martins, H.F.; Williams, E.F.; Becerril, C.; Magalhaes, R.; Costa, L.; Martin-Lopez, S.; Jia, Z.; Zhan, Z.; Gonzalez-Herraez, M. Seismic Monitoring With Distributed Acoustic Sensing From the Near-Surface to the Deep Oceans. J. Light. Technol. 2022, 40, 1453–1463. [Google Scholar] [CrossRef]
- Hill, D.J. Distributed Acoustic Sensing for Permanent Downhole Monitoring. In Second EAGE Workshop on Permanent Reservoir Monitoring 2013—Current and Future Trends; European Association of Geoscientists & Engineers: Utrecht, The Netherlands, 2013. [Google Scholar] [CrossRef]
- Feo, G.; Sharma, J.; Kortukov, D.; Williams, W.; Ogunsanwo, T. Distributed Fiber Optic Sensing for Real-Time Monitoring of Gas in Riser during Offshore Drilling. Sensors 2020, 20, 267. [Google Scholar] [CrossRef] [PubMed]
- van Horst, J.; Panhuis, P.; Al-Bulushi, N.; Deitrick, G.; Mustafina, D.; Hemink, G.; Groen, L.; Potters, H.; Mjeni, R.; Awan, K.; et al. Latest Developments Using Fiber Optic Based Well Surveillance Such as Distributed Acoustic Sensing (DAS) for Downhole Production and Injection Profiling. In Proceedings of the SPE Kuwait Oil and Gas Show and Conference, Mishref, Kuwait, 11–14 October 2015. [Google Scholar] [CrossRef]
- van der Horst, J.; Den Boer, H.; In’t Panhuis, P.; Wyker, B.; Kusters, R.; Mustafina, D.; Groen, L.; Bulushi, N.; Mjeni, R.; Awan, K.F.; et al. Fibre Optic Sensing For Improved Wellbore Production Surveillance. In Proceedings of the International Petroleum Technology Conference, Doha, Qatar, 19–22 January 2014. [Google Scholar] [CrossRef]
- Soroush, M.; Mohammadtabar, M.; Roostaei, M.; Hosseini, S.A.; Fattahpour, V.; Mahmoudi, M.; Keough, D.; Tywoniuk, M.; Mosavat, N.; Cheng, L.; et al. Downhole Monitoring Using Distributed Acoustic Sensing: Fundamentals and Two Decades Deployment in Oil and Gas Industries. In Proceedings of the SPE Conference at Oman Petroleum & Energy Show, Muscat, Oman, 21–23 March 2022. [Google Scholar] [CrossRef]
- Van Der Horst, J.; Lopez, J.L.; Berlang, W.; Potters, H. In-Well Distributed Fiber Optic Solutions for Reservoir Surveillance. In Proceedings of the Offshore Technology Conference, Houston, TX, USA, 6–9 May 2013. [Google Scholar] [CrossRef]
- Gambling, W.A. The Rise and Rise of Optical Fibers. IEEE J. Sel. Top. Quantum Electron. 2000, 6, 1084–1093. [Google Scholar] [CrossRef]
- Willis, M.E.; Ellmauthaler, A.; LeBlanc, M.; Palacios, W.; Wu, X. Comparing Distributed Acoustic Sensing, Vertical Seismic Profile Data Acquired with Single- and Multi-Mode Fiber Optic Cables. In SEG Technical Program Expanded Abstracts 2018; Society of Exploration Geophysicists: Tulsa, OK, USA, 2018; pp. 4674–4678. [Google Scholar] [CrossRef]
- Shatalin, S.; Parker, T.; Farhadiroushan, M. High Definition Seismic and Microseismic Data Acquisition Using Distributed and Engineered Fiber Optic Acoustic Sensors. In Distributed Acoustic Sensing in Geophysics: Methods and Applications; American Geophysical Union: Washington, DC, USA, 2021; pp. 1–32. [Google Scholar] [CrossRef]
- Wang, Z.; Lu, B.; Ye, Q.; Cai, H. Recent Progress in Distributed Fiber Acoustic Sensing with Φ-OTDR. Sensors 2020, 20, 6594. [Google Scholar] [CrossRef]
- Juarez, J.C.; Maier, E.W.; Choi, K.N.; Taylor, H.F. Distributed Fiber-Optic Intrusion Sensor System. J. Light. Technol. 2005, 23, 2081–2087. [Google Scholar] [CrossRef]
- Savović, S.; Djordjevich, A. Calculation of the Coupling Coefficient in Strained Step Index Plastic Optical Fibers. Appl. Opt. 2008, 47, 4935. [Google Scholar] [CrossRef]
- Sun, Y.; Li, H.; Fan, C.; Yan, B.; Chen, J.; Yan, Z.; Sun, Q. Review of a Specialty Fiber for Distributed Acoustic Sensing Technology. Photonics 2022, 9, 277. [Google Scholar] [CrossRef]
- Wu, Y.; Gan, J.; Li, Q.; Zhang, Z.; Heng, X.; Yang, Z. Distributed Fiber Voice Sensor Based on Phase-Sensitive Optical Time-Domain Reflectometry. IEEE Photonics J. 2015, 7, 1–10. [Google Scholar] [CrossRef]
- Brinkmeyer, E. Analysis of the Backscattering Method for Single-Mode Optical Fibers. J. Opt. Soc. Am. 1980, 70, 1010. [Google Scholar] [CrossRef]
- Korposh, S.; James, S.; Lee, S.-W.; Tatam, R. Tapered Optical Fibre Sensors: Current Trends and Future Perspectives. Sensors 2019, 19, 2294. [Google Scholar] [CrossRef] [PubMed]
- Lim Chen Ning, I.; Sava, P. Multicomponent Distributed Acoustic Sensing: Concept and Theory. Geophysics 2018, 83, P1–P8. [Google Scholar] [CrossRef]
- Lawton, D.C.; Osadetz, K.G.; Saeedfar, A. CCS Monitoring Technology Innovation at the CaMI Field Research Station, Alberta, Canada. In EAGE/SEG Research Workshop 2017; European Association of Geoscientists & Engineers: Utrecht, The Netherlands, 2017. [Google Scholar] [CrossRef]
- Macquet, M.; Kolkman-Quinn, B.; Lawton, D. Carbon Management Canada CaMI Field Research Station: Advancing Monitoring Technologies for CCS. In EAGE GeoTech 2022 Sixth EAGE Workshop on CO2 Geological Storage; European Association of Geoscientists & Engineers: Utrecht, The Netherlands, 2022; pp. 1–5. [Google Scholar] [CrossRef]
- Lawton, D.; Hall, K.; Gordon, A. Advances in DAS Seismic Monitoring for CO2 Storage. In SEG Technical Program Expanded Abstracts 2018; Society of Exploration Geophysicists: Tulsa, OK, USA, 2018; p. 5500. [Google Scholar] [CrossRef]
- Gordon, A.; Lawton, D.; Hall, K.; Freifeld, B.; Daley, T.; Cook, P. Depth Registration of VSP DAS Fiber. In SEG Technical Program Expanded Abstracts 2018; Society of Exploration Geophysicists: Tulsa, OK, USA, 2018; pp. 5427–5431. [Google Scholar] [CrossRef]
- Ellmauthaler, A.; LeBlanc, M.; Bush, J.; Willis, M.E.; Maida, J.L.; Wilson, G.A. Real-Time DAS VSP Acquisition and Processing on Single- and Multi-Mode Fibers. IEEE Sens. J. 2021, 21, 14847–14852. [Google Scholar] [CrossRef]
Disclaimer/Publisher’s Note: The statements, opinions and data contained in all publications are solely those of the individual author(s) and contributor(s) and not of MDPI and/or the editor(s). MDPI and/or the editor(s) disclaim responsibility for any injury to people or property resulting from any ideas, methods, instructions or products referred to in the content. |
© 2023 by the authors. Licensee MDPI, Basel, Switzerland. This article is an open access article distributed under the terms and conditions of the Creative Commons Attribution (CC BY) license (https://creativecommons.org/licenses/by/4.0/).

