
Prediction of Phytochemical Constituents in Cayenne Pepper Using MIR and NIR Spectroscopy

 , , , and
Abstract
:1. Introduction
2. Materials and Methods
2.1. Chilli Samples
2.2. Collection of NIR Spectra
2.3. Dry Matter Content and Total Phenolic Content
2.4. Collection of MIR Spectra
2.5. Data Processing and Analysis
3. Results
3.1. Dry Matter, TPC, and FRAP Content
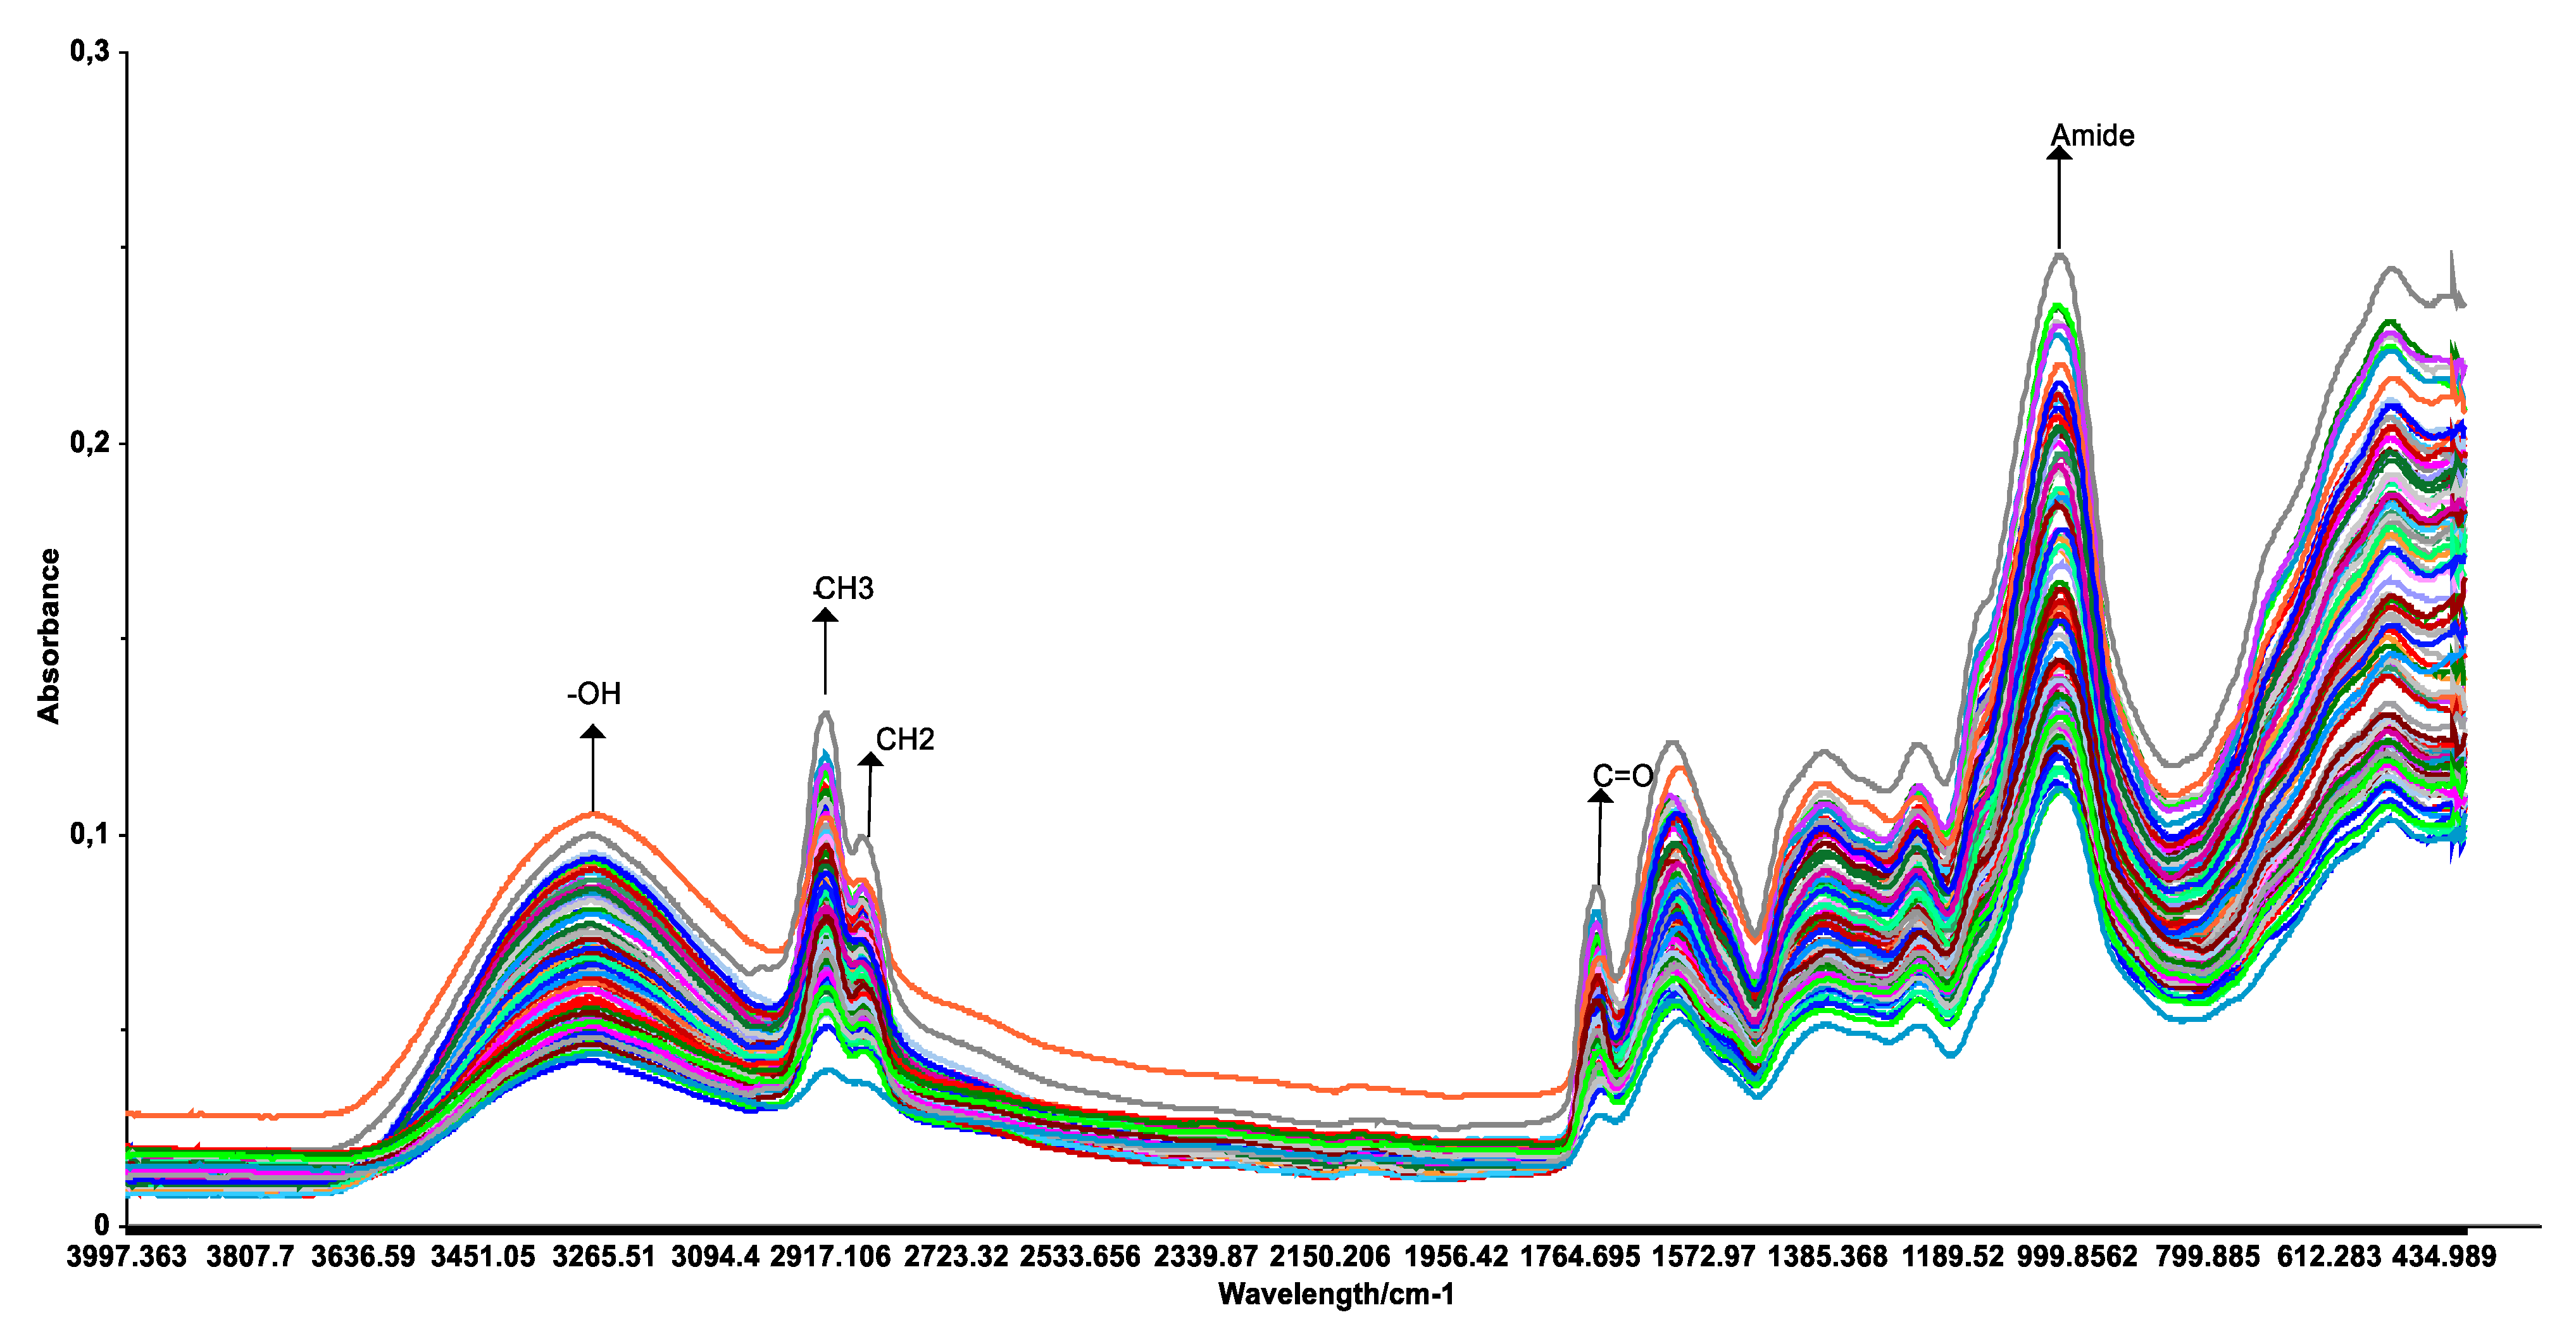
3.2. NIR and MIR Spectra
3.3. Prediction of DM, TPC, FRAP, and CUPRAC Using NIR Spectroscopy
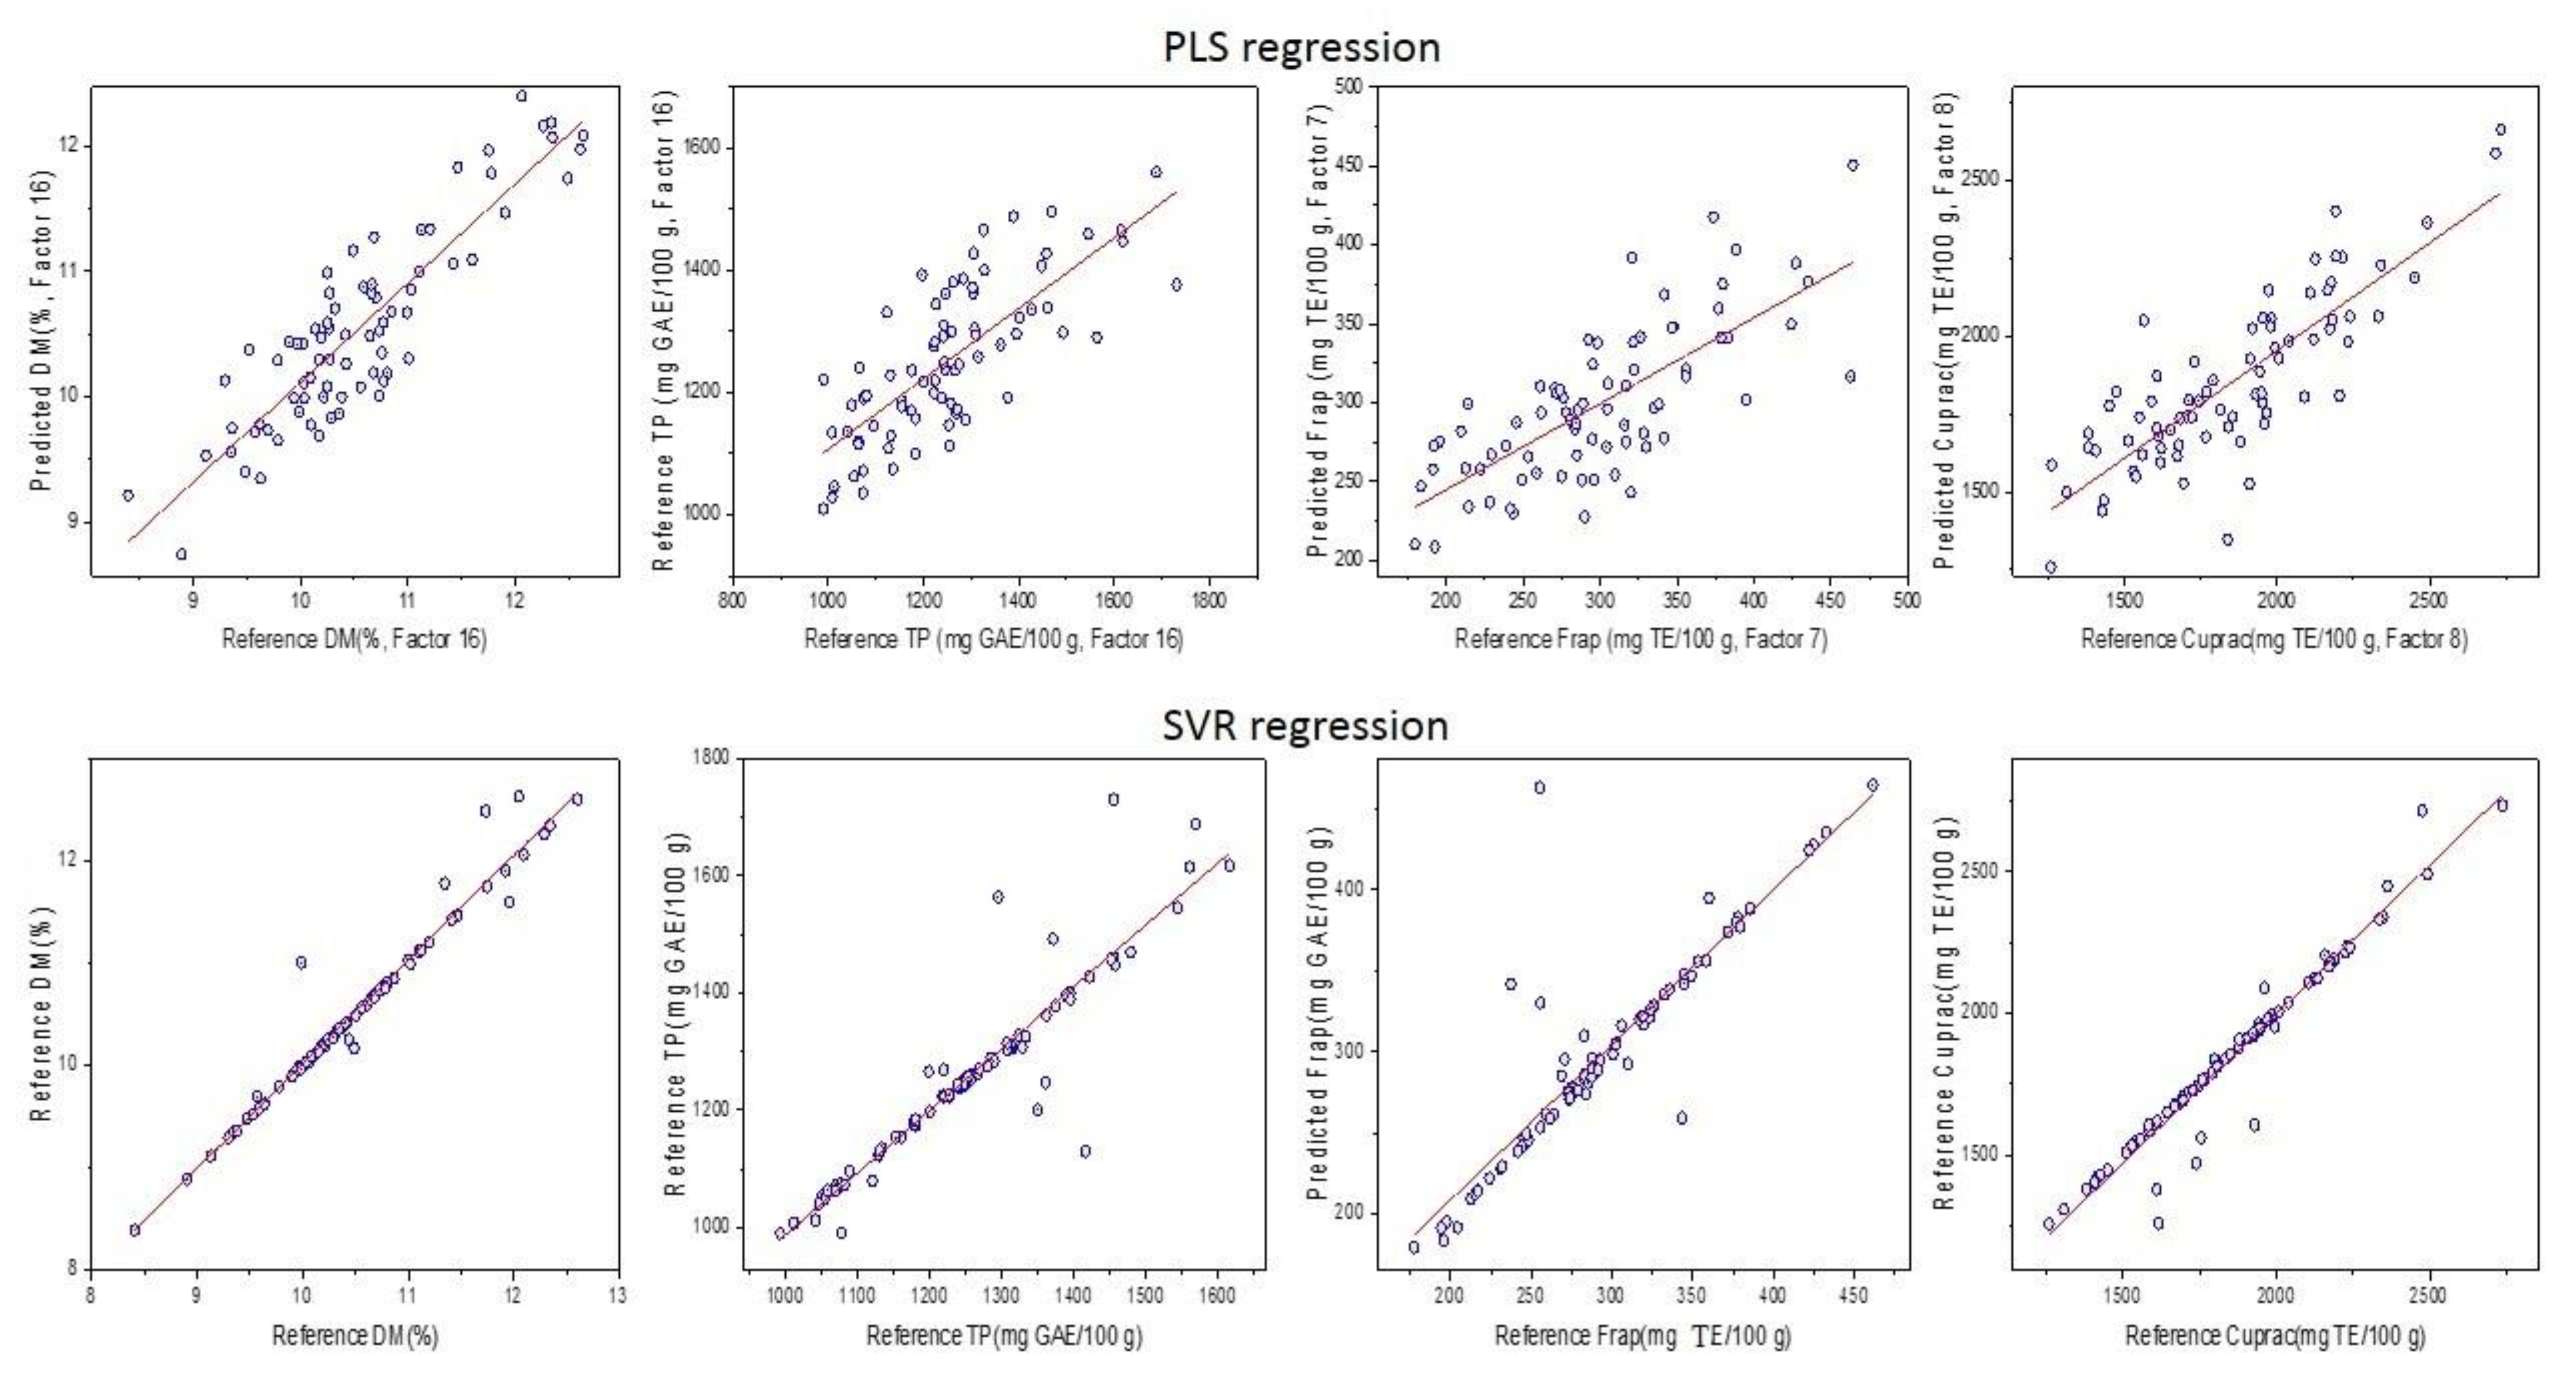
3.4. Prediction of DM, TPC, FRAP, and CUPRAC Using MIR Spectroscopy
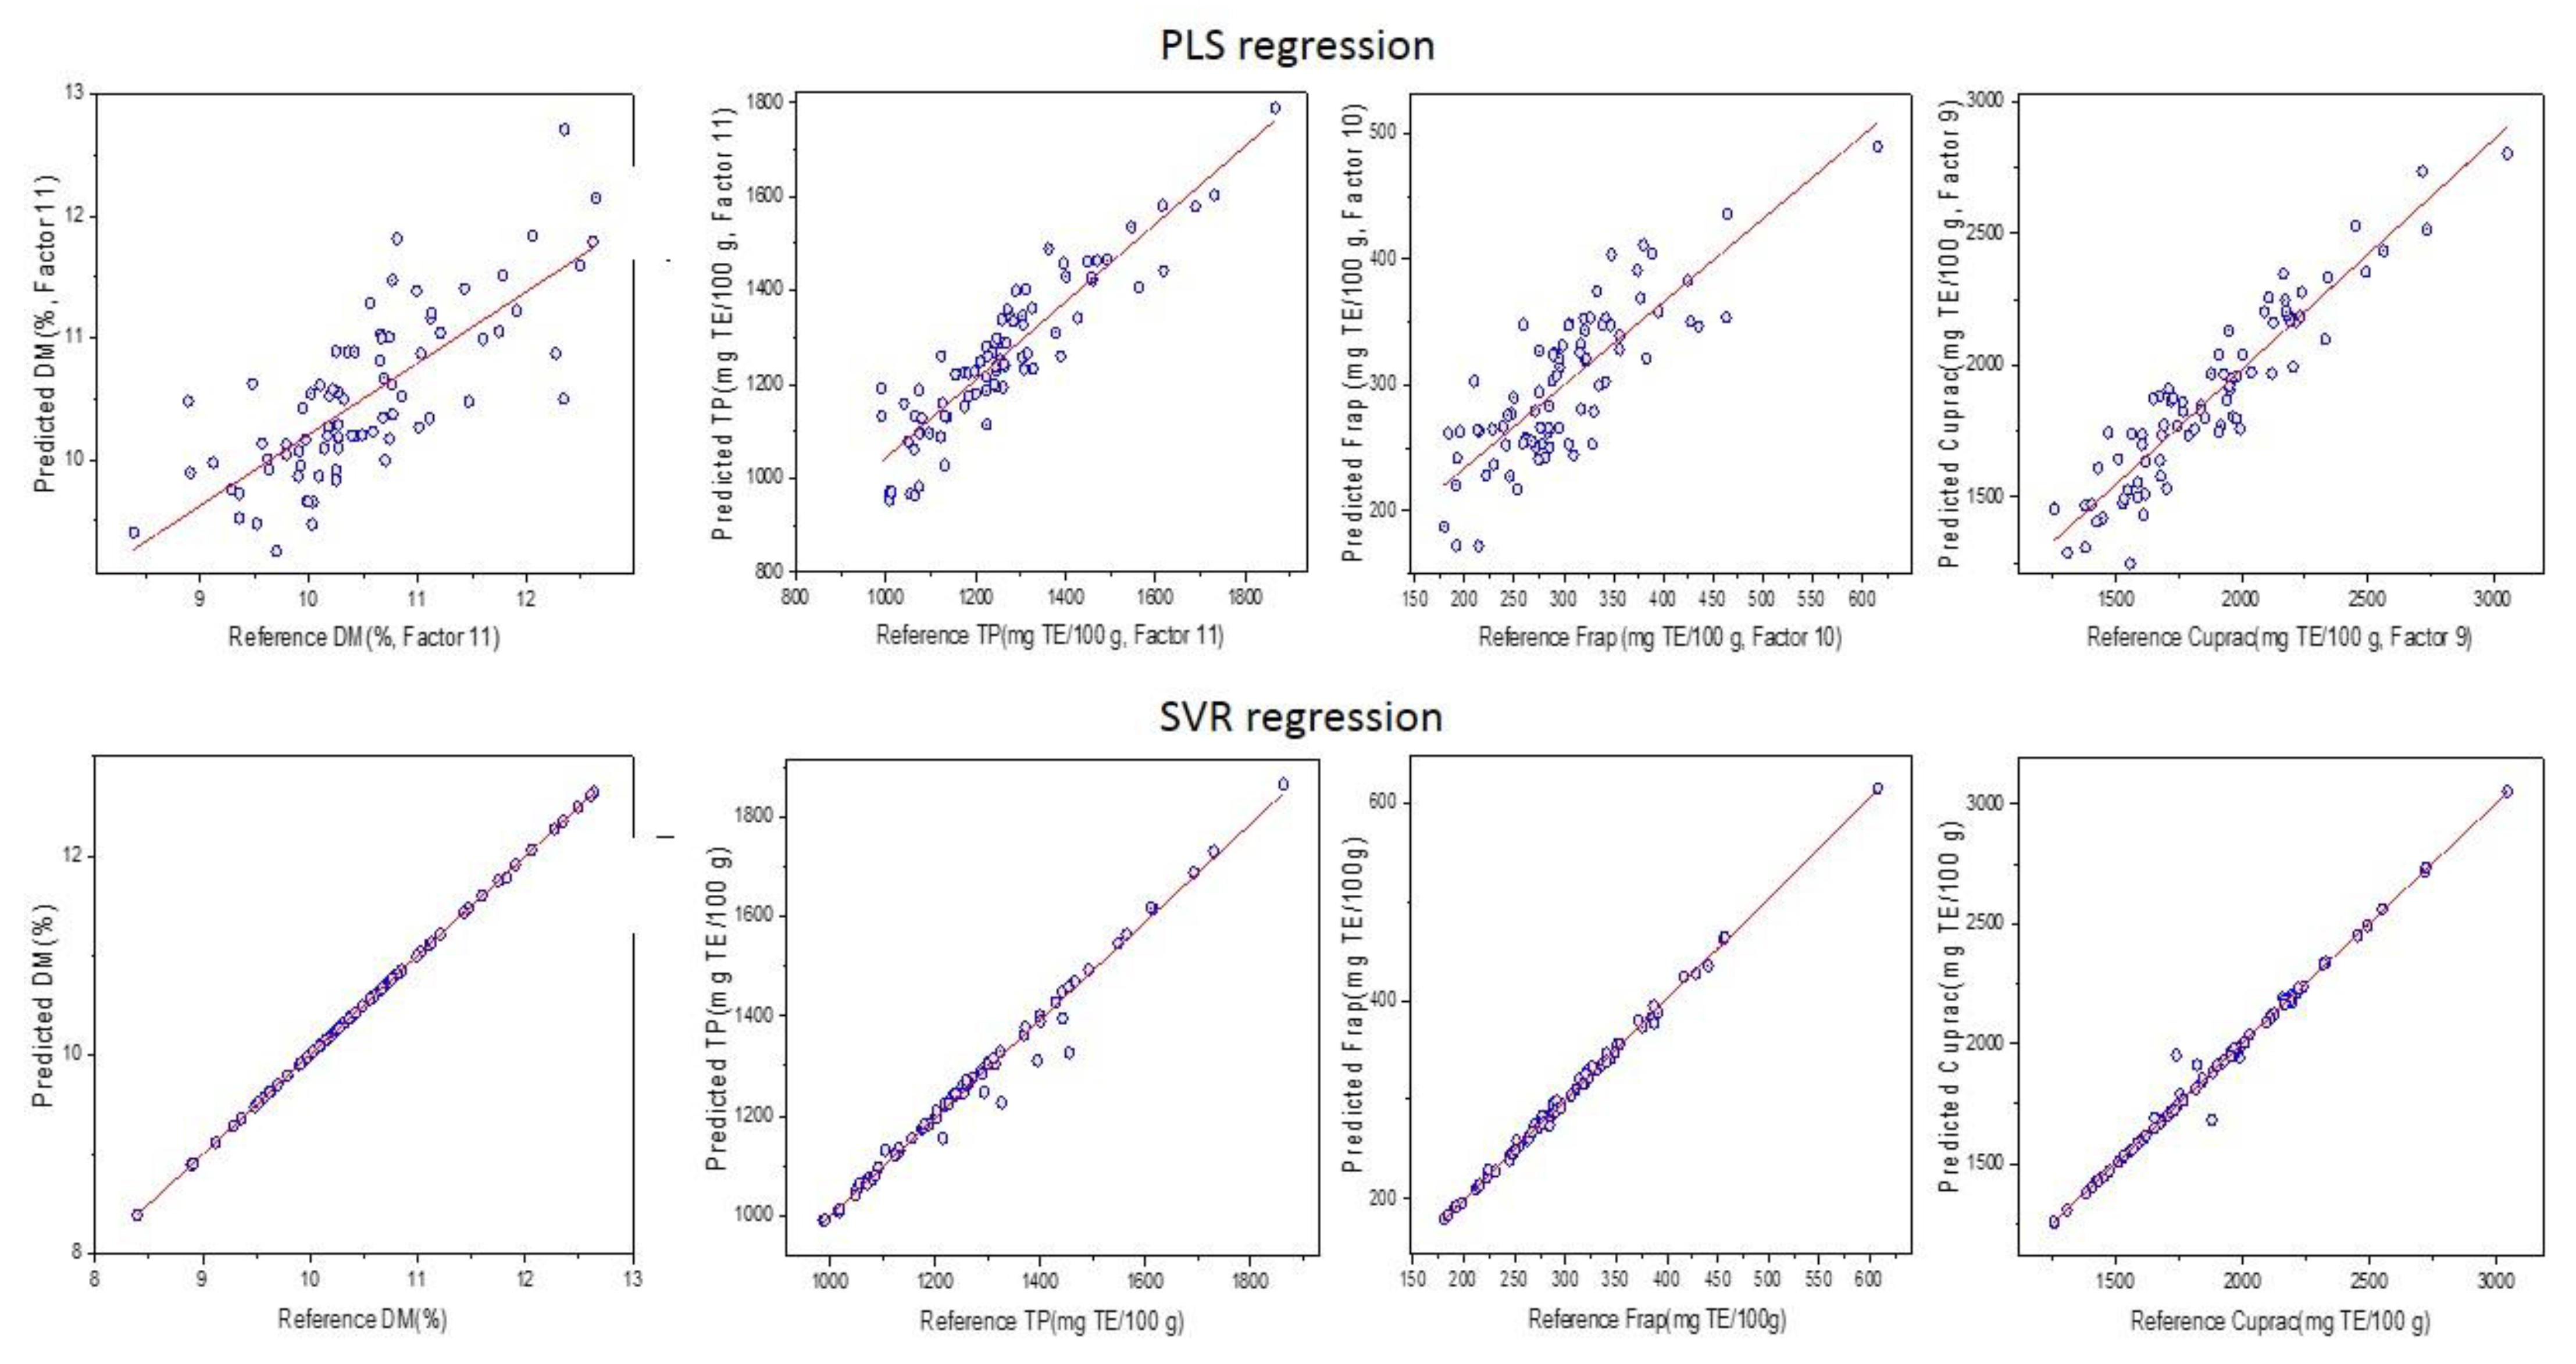
3.5. Prediction of DM, TPC, FRAP, and CUPRAC Contents Using Data Fusion of NIR and MIR Spectroscopy
4. Discussion
5. Conclusions
Author Contributions
Funding
Institutional Review Board Statement
Informed Consent Statement
Data Availability Statement
Acknowledgments
Conflicts of Interest
References
- Olatunji, T.L.; Afolayan, A.J. The suitability of chili pepper (Capsicum annuum L.) for alleviating human micronutrient dietary deficiencies: A review. Food Sci. Nutr. 2018, 6, 2239–2251. [Google Scholar] [CrossRef]
- Arora, V.; Campbell, J.N.; Chung, M.-K. Fight fire with fire: Neurobiology of capsaicin-induced analgesia for chronic pain. Pharmacol. Ther. 2021, 220, 107743. [Google Scholar] [CrossRef] [PubMed]
- Scarano, A.; Chieppa, M.; Santino, A. Looking at Flavonoid Biodiversity in Horticultural Crops: A Colored Mine with Nutritional Benefits. Plants 2018, 7, 98. [Google Scholar] [CrossRef] [PubMed]
- Hernández-Pérez, T.; Gómez-García, M.d.R.; Valverde, M.E.; Paredes-López, O. Capsicum annuum (hot pepper): An ancient Latin-American crop with outstanding bioactive compounds and nutraceutical potential. A review. Compr. Rev. Food Sci. Food Saf. 2020, 19, 2972–2993. [Google Scholar] [CrossRef] [PubMed]
- Bal, S.; Sharangi, A.B.; Upadhyay, T.K.; Khan, F.; Pandey, P.; Siddiqui, S.; Saeed, M.; Lee, H.-J.; Yadav, D.K. Biomedical and Antioxidant Potentialities in Chilli: Perspectives and Way Forward. Molecules 2022, 27, 6380. [Google Scholar] [CrossRef]
- Toledo-Martín, E.M.; García-García, M.C.; Font, R.; Moreno-Rojas, J.M.; Gómez, P.; Salinas-Navarro, M.; Del Río-Celestino, M. Application of visible/near-infrared reflectance spectroscopy for predicting internal and external quality in pepper. J. Sci. Food Agric. 2016, 96, 3114–3125. [Google Scholar] [CrossRef]
- AusVeg. Veggie Stats: Chillies; AusVeg: Melbourne, Australia, 2016; pp. 19–21. [Google Scholar]
- Anderson, N.T.; Subedi, P.P.; Walsh, K.B. Manipulation of mango fruit dry matter content to improve eating quality. Sci. Hortic. 2017, 226, 316–321. [Google Scholar] [CrossRef]
- Mickelbart, M.V.; James, D. Development of a dry matter maturity index for olive (Olea europaea). N. Z. J. Crop Hortic. Sci. 2003, 31, 269–276. [Google Scholar] [CrossRef]
- Ignat, T.; Alchanatis, V.; Schmilovitch, Z.E. Maturity prediction of intact bell peppers by sensor fusion. Comput. Electron. Agric. 2014, 104, 9–17. [Google Scholar] [CrossRef]
- Niklis, N.D.; Siomos, A.S.; Sfakiotakis, E.M. Ascorbic Acid, Soluble Solids and Dry Matter Content in Sweet Pepper Fruit: Change during Ripening. J. Veg. Crop Prod. 2002, 8, 41–51. [Google Scholar] [CrossRef]
- Kasampalis, D.S.; Tsouvaltzis, P.; Ntouros, K.; Gertsis, A.; Gitas, I.; Moshou, D.; Siomos, A.S. Nutritional composition changes in bell pepper as affected by the ripening stage of fruits at harvest or postharvest storage and assessed non-destructively. J. Sci. Food Agric. 2021, 102, 445–454. [Google Scholar] [CrossRef] [PubMed]
- Materska, M.; Perucka, I. Antioxidant Activity of the Main Phenolic Compounds Isolated from Hot Pepper Fruit (Capsicum annuum L.). J. Agric. Food Chem. 2005, 53, 1750–1756. [Google Scholar] [CrossRef] [PubMed]
- Hervert-Hernández, D.; Sáyago-Ayerdi, S.G.; Goñi, I. Bioactive Compounds of Four Hot Pepper Varieties (Capsicum annuum L.), Antioxidant Capacity, and Intestinal Bioaccessibility. J. Agric. Food Chem. 2010, 58, 3399–3406. [Google Scholar] [CrossRef] [PubMed]
- Lim, J.; Kim, G.; Mo, C.; Kim, M.S. Design and Fabrication of a Real-Time Measurement System for the Capsaicinoid Content of Korean Red Pepper (Capsicum annuum L.) Powder by Visible and Near-Infrared Spectroscopy. Sensors 2015, 15, 27420–27435. [Google Scholar] [CrossRef]
- San Park, T.; Min Bae, Y.; Jin Sim, M.; Eun Kim, D.; In Cho, S. Analysis of Capsaicinoids from Hot Red Pepper Powder by Near-Infrared Spectroscopy. In Proceedings of the American Society of Agricultural and Biological Engineers Annual International Meeting 2008, Providence, Rhode Island, 29 June–2 July 2008. [Google Scholar]
- Bae, M.-J.; Han, E.-S.; Hong, S.-H. Use of near Infrared Spectroscopy in Quality Control of Red Pepper Powder. J. Near Infrared Spectrosc. 1998, 6, A333–A335. [Google Scholar] [CrossRef]
- Bonifazi, G.; Gasbarrone, R.; Serranti, S. Dried red chili peppers pungency assessment by visible and near infrared spectroscopy. In Proceedings of the SPIE Defense + Commercial Sensing, Baltimore, MD, USA, 14 May 2019. [Google Scholar]
- Domínguez-Martínez, I.; Meza-Márquez, O.G.; Osorio-Revilla, G.; Proal-Nájera, J.; Gallardo-Velázquez, T. Determination of capsaicin, ascorbic acid, total phenolic compounds and antioxidant activity of Capsicum annuum L. var. serrano by mid infrared spectroscopy (Mid-FTIR) and chemometric analysis. J. Korean Soc. Appl. Biol. Chem. 2014, 57, 133–142. [Google Scholar] [CrossRef]
- Penchaiya, P.; Bobelyn, E.; Verlinden, B.E.; Nicolaï, B.M.; Saeys, W. Non-destructive measurement of firmness and soluble solids content in bell pepper using NIR spectroscopy. J. Food Eng. 2009, 94, 267–273. [Google Scholar] [CrossRef]
- Sánchez, M.-T.; Torres, I.; de la Haba, M.-J.; Chamorro, A.; Garrido-Varo, A.; Pérez-Marín, D. Rapid, simultaneous, and in situ authentication and quality assessment of intact bell peppers using near-infrared spectroscopy technology. J. Sci. Food Agric. 2019, 99, 1613–1622. [Google Scholar] [CrossRef]
- Ignat, T.; Schmilovitch, Z.; Fefoldi, J.; Steiner, B.; Alkalai-Tuvia, S. Non-destructive measurement of ascorbic acid content in bell peppers by VIS-NIR and SWIR spectrometry. Postharvest Biol. Technol. 2012, 74, 91–99. [Google Scholar] [CrossRef]
- Kusumiyati, K.; Putri, I.E.; Munawar, A.A.; Suhandy, D. A Data Fusion Model to Merge the Spectra Data of Intact and Powdered Cayenne Pepper for the Fast Inspection of Antioxidant Properties. Sustainability 2022, 14, 201. [Google Scholar] [CrossRef]
- Power, A.C.; Chapman, J.; Chandra, S.; Roberts, J.J.; Cozzolino, D. Illuminating the flesh of bone identification—An application of near infrared spectroscopy. Vib. Spectrosc. 2018, 98, 64–68. [Google Scholar] [CrossRef]
- Johnson, J.; Collins, T.; Skylas, D.; Quail, K.; Blanchard, C.; Naiker, M. Profiling the varietal antioxidative content and macrochemical composition in Australian faba beans (Vicia faba L.). Legume Sci. 2020, 2, e28. [Google Scholar] [CrossRef]
- Johnson, J.; Collins, T.; Power, A.; Chandra, S.; Portman, D.; Blanchard, C.; Naiker, M. Antioxidative properties and macrochemical composition of five commercial mungbean varieties in Australia. Legume Sci. 2020, 2, e27. [Google Scholar] [CrossRef]
- R Core Team. R: A Language and Environment for Statistical Computing, Version 4.0.2; R Foundation for Statistical Computing: Vienna, Austria, 2020. [Google Scholar]
- Johnson, J.B.; El Orche, A.; Naiker, M. Prediction of anthocyanin content and variety in plum extracts using ATR-FTIR spectroscopy and chemometrics. Vib. Spectrosc. 2022, 121, 103406. [Google Scholar] [CrossRef]
- Jie, Z.; Pan, R.; Gao, W.; Xu, B.; Wei, L. Automatic detection of layout of color yarns of yarn-dyed fabric. Part 3: Double-system-Mélange color fabrics. Color. Res. Appl. 2016, 41, 626–635. [Google Scholar]
- Nicolaï, B.M.; Beullens, K.; Bobelyn, E.; Peirs, A.; Saeys, W.; Theron, K.I.; Lammertyn, J. Nondestructive measurement of fruit and vegetable quality by means of NIR spectroscopy: A review. Postharvest Biol. Technol. 2007, 46, 99–118. [Google Scholar] [CrossRef]
- Sora, G.T.S.; Haminiuk, C.W.I.; da Silva, M.V.; Zielinski, A.A.F.; Gonçalves, G.A.; Bracht, A.; Peralta, R.M. A comparative study of the capsaicinoid and phenolic contents and in vitro antioxidant activities of the peppers of the genus Capsicum: An application of chemometrics. J. Food Sci. Technol. 2015, 52, 8086–8094. [Google Scholar] [CrossRef] [PubMed]
- Qiao, G.; Wenxin, D.; Zhigang, X.; Sami, R.; Khojah, E.; Amanullah, S. Antioxidant and anti-inflammatory capacities of pepper tissues. Ital. J. Food Sci. 2020, 32, 265–274. [Google Scholar] [CrossRef]
- Parnea, A.; Tulpan, R.; Vasiliu, I.; Moldovan, C.; Dumbravă, D.G. Assessment of Total Polyphenol Content and Antioxidant Capacity of Some Pepper Varieties. J. Agroaliment. Process. Technol 2018, 24, 286–288. [Google Scholar]
- Workman, J.; Weyer, L. Practical Guide to Interpretive Near-Infrared Spectroscopy; CRC Press: Boca Raton, FL, USA, 2007. [Google Scholar]
- Lapcharoensuk, R.; Danupattanin, K.; Kanjanapornprapa, C.; Inkawee, T. Combination of NIR spectroscopy and machine learning for monitoring chili sauce adulterated with ripened papaya. E3S Web Conf. 2020, 187, 04001. [Google Scholar] [CrossRef]
- Sigma Aldrich. IR Spectrum Table & Chart. Available online: https://www.sigmaaldrich.com/technical-documents/articles/biology/ir-spectrum-table.html (accessed on 31 March 2023).
- Pavia, D.L.; Lampman, G.M.; Kriz, G.S. Introduction to Spectroscopy: A Guide for Student of Organic Chemistry, 3rd ed.; Brooks/Cole: London, UK, 2001. [Google Scholar]
- Johnson, J.B.; Mani, J.S.; Walsh, K.B.; Naiker, M. Infrared spectroscopy for the quality assessment of Habanero chilli: A proof-of-concept study. J. Food Meas. Charact. 2023, 17, 1764–1774. [Google Scholar] [CrossRef]
- Kusumiyati, K.; Putri, I.E.; Hamdani, J.S.; Suhandy, D. Real-Time Detection of the Nutritional Compounds in Green ‘Ratuni UNPAD’ Cayenne Pepper. Horticulturae 2022, 8, 554. [Google Scholar] [CrossRef]


| Parameter | Typical Content | % RDI in 1 Serve (75 g) | Reference |
|---|---|---|---|
| Total phenolic content | 919–1803 mg GAE/100 g | n/a | [6] |
| Vitamin C | 80.6 mg/100 g | 67% | [1] |
| Niacin (Vit B3) | 0.48 mg/100 g | 2% | [1] |
| Vitamin E (α-tocopherol) | 0.37 mg/100 g | 2% | [1] |
| Vitamin B6 | 0.224 mg/100 g | 13% | [1] |
| Pantothenic acid (Vit B5) | 0.099 mg/100 g | 1% | [1] |
| Thiamin (Vit B1) | 0.057 mg/100 g | 4% | [1] |
| Riboflavin (Vit B2) | 0.028 mg/100 g | 2% | [1] |
| Vitamin A | 18 µg RAE/100 g | 2% | [1] |
| Folate | 10 µg/100 g | 2% | [1] |
| Vitamin K | 7.4 µg/100 g | 5% | [1] |
| DM Content (%) | TPC (mg GAE/100 g) | FRAP (mg TE/100 g) | CUPRAC (mg TE/100 g) | |
|---|---|---|---|---|
| Minimum | 8.39 | 898 | 168 | 1256 |
| Maximum | 12.64 | 2617 | 615 | 3138 |
| Mean | 10.52 | 1300 | 296 | 1917 |
| SD | 0.86 | 267 | 70 | 379 |
| CV (%) | 4.82 | 20.54 | 23.65 | 19.77 |
| Pre-Processing | Analyte | LVs (PLS) | R2cal | RMSEC | R2pred | RMSEP | RPD | |||||
|---|---|---|---|---|---|---|---|---|---|---|---|---|
| PLS | SVR | PLS | SVR | PLS | SVR | PLS | SVR | PLS | SVR | |||
| None | DM | 16 | 0.79 | 0.26 | 0.403 | 0.77 | 0.74 | 0.00 | 0.384 | 0.748 | 2.020 | 1.037 |
| TPC | 14 | 0.33 | 0.17 | 134.704 | 150.012 | 0.00 | 0.00 | 466.55 | 478.457 | 0.974 | 0.950 | |
| FRAP | 9 | 0.47 | 0.44 | 47.095 | 48.219 | 0.00 | 0.58 | 65.669 | 68.365 | 0.825 | 0.793 | |
| CUPRAC | 12 | 0.51 | 0.3 | 227.701 | 272.766 | 0.11 | 0.00 | 397.912 | 408.715 | 1.088 | 1.059 | |
| SG1 | DM | 16 | 0.67 | 0.84 | 0.506 | 0.356 | 0.27 | 0.00 | 0.646 | 0.407 | 1.200 | 1.905 |
| TPC | 16 | 0.57 | 0.53 | 107.029 | 116.674 | 0.00 | 0.65 | 451.12 | 463.816 | 1.008 | 0.980 | |
| FRAP | 7 | 0.48 | 0.58 | 46.485 | 41.599 | 0.00 | 0.62 | 66.396 | 72.911 | 0.816 | 0.743 | |
| CUPRAC | 8 | 0.52 | 0.64 | 225.74 | 196.814 | 0.1 | 0.00 | 410.437 | 421.314 | 1.055 | 1.028 | |
| SG2 | DM | 14 | 0.74 | 0.96 | 0.451 | 0.178 | 0.70 | 0.53 | 0.411 | 0.737 | 1.887 | 1.052 |
| TPC | 14 | 0.33 | 0.85 | 133.998 | 64.145 | 0.00 | 0.00 | 458.849 | 498.795 | 0.991 | 0.911 | |
| FRAP | 14 | 0.54 | 0.78 | 43.612 | 30.317 | 0.00 | 0.18 | 69.897 | 109.985 | 0.775 | 0.493 | |
| CUPRAC | 16 | 0.55 | 0.94 | 217.4 | 81.961 | 0.16 | 0.73 | 387.086 | 512.456 | 1.118 | 0.845 | |
| SNV | DM | 14 | 0.74 | 0.57 | 0.45 | 0.592 | 0.60 | 0.00 | 0.477 | 0.695 | 1.626 | 1.116 |
| TPC | 13 | 0.33 | 0.29 | 134.351 | 142.789 | 0.00 | 0.00 | 463.32 | 483.741 | 0.981 | 0.940 | |
| FRAP | 12 | 0.52 | 0.46 | 44.619 | 47.303 | 0.00 | 0.00 | 66.706 | 68.768 | 1.064 | 1.065 | |
| CUPRAC | 11 | 0.51 | 0.42 | 227.34 | 247.69 | 0.1 | 0.68 | 406.903 | 406.541 | 0.812 | 0.133 | |
| SNV Detrend 1 | DM | 13 | 0.73 | 0.65 | 0.453 | 0.548 | 0.68 | 0.86 | 0.428 | 0.618 | 1.812 | 1.255 |
| TPC | 12 | 0.31 | 0.27 | 136.107 | 141.195 | 0.00 | 0.00 | 467.973 | 480.962 | 0.971 | 0.945 | |
| FRAP | 12 | 0.53 | 0.5 | 44.401 | 37.4 | 0.00 | 0.19 | 68.356 | 137.117 | 0.793 | 0.395 | |
| CUPRAC | 11 | 0.51 | 0.45 | 226.828 | 241.311 | 0.1 | 0.00 | 403.157 | 398.094 | 1.074 | 1.087 | |
| SNV Detrend 2 | DM | 15 | 0.77 | 0.56 | 0.42 | 0.606 | 0.65 | 0.96 | 0.449 | 0.627 | 1.727 | 1.237 |
| TPC | 11 | 0.35 | 0.28 | 131.832 | 142.285 | 0.00 | 0.00 | 456.291 | 478.666 | 0.996 | 0.950 | |
| FRAP | 10 | 0.52 | 0.47 | 44.591 | 46.796 | 0.00 | 0.71 | 66.036 | 69.674 | 0.821 | 0.778 | |
| CUPRAC | 5 | 0.44 | 0.41 | 48.316 | 250.391 | 0.1 | 0.00 | 410.62 | 401.767 | 1.054 | 1.078 | |
| MSC | DM | 14 | 0.76 | 0.58 | 0.433 | 0.586 | 0.69 | 0.92 | 0.421 | 0.603 | 1.842 | 1.286 |
| TPC | 10 | 0.31 | 0.26 | 136.506 | 142.963 | 0.00 | 0.00 | 466.013 | 478.457 | 0.975 | 0.950 | |
| FRAP | 11 | 0.51 | 0.46 | 45.229 | 47.476 | 0.00 | 0.59 | 66.642 | 71.41 | 0.813 | 0.759 | |
| CUPRAC | 11 | 0.52 | 0.4 | 226.31 | 251.503 | 0.1 | 0.00 | 403.342 | 400.865 | 1.073 | 1.080 | |
| Pre-Processing | Analyte | LVs (PLS) | R2cal | RMSEC | R2pred | RMSEP | RPD | |||||
|---|---|---|---|---|---|---|---|---|---|---|---|---|
| PLS | SVR | PLS | SVR | PLS | SVR | PLS | SVR | PLS | SVR | |||
| None | DM | 12 | 0.51 | 0.56 | 0.613 | 0.863 | 0.54 | 0.08 | 0.513 | 1.232 | 1.512 | 0.629 |
| TPC | 12 | 0.58 | 0.84 | 113.289 | 75.956 | 0.00 | 0.77 | 482.832 | 499.78 | 0.942 | 0.910 | |
| FRAP | 12 | 0.65 | 0.89 | 42.962 | 26.14 | 0.00 | 0.17 | 128.45 | 180.553 | 0.422 | 0.300 | |
| CUPRAC | 12 | 0.88 | 0.84 | 120.36 | 148.391 | 0.00 | 0.37 | 519.759 | 618.733 | 0.833 | 0.700 | |
| SG1 | DM | 12 | 0.52 | 0.99 | 0.613 | 16.043 | 0.40 | 0.84 | 0.585 | 0.815 | 1.326 | 0.952 |
| TPC | 12 | 0.71 | 0.99 | 93.607 | 3.431 | 0.00 | 0.80 | 471.339 | 533.946 | 0.964 | 0.851 | |
| FRAP | 12 | 0.59 | 0.99 | 46.706 | 9.691 | 0.00 | 0.68 | 65.721 | 70.712 | 0.824 | 0.766 | |
| CUPRAC | 12 | 0.82 | 0.99 | 116.077 | 0.006 | 0.00 | 0.79 | 491.5 | 671.999 | 0.881 | 0.644 | |
| SG2 | DM | 11 | 0.58 | 0.99 | 0.569 | 0.001 | 0.38 | 0.67 | 0.595 | 1.048 | 1.303 | 0.740 |
| TPC | 11 | 0.83 | 0.99 | 72.582 | 0.204 | 0.00 | 0.79 | 474.649 | 483.197 | 0.958 | 0.941 | |
| FRAP | 10 | 0.66 | 0.99 | 42.248 | 0.078 | 0.20 | 0.96 | 46.323 | 95.737 | 1.170 | 0.566 | |
| CUPRAC | 4 | 0.87 | 0.99 | 126.191 | 0.372 | 0.10 | 0.99 | 404.672 | 477.769 | 1.070 | 0.906 | |
| SNV | DM | 3 | 0.49 | 0.99 | 0.631 | 0.102 | 0.32 | 0.88 | 0.624 | 0.685 | 1.243 | 1.132 |
| TPC | 14 | 0.86 | 0.98 | 66.217 | 23.542 | 0.01 | 0.86 | 440.574 | 433.142 | 1.032 | 1.050 | |
| FRAP | 9 | 0.43 | 0.99 | 54.637 | 4.162 | 0.00 | 0.57 | 56.479 | 77.343 | 0.959 | 0.701 | |
| CUPRAC | 5 | 0.57 | 0.99 | 232.55 | 35.394 | 0.10 | 0.52 | 405.221 | 505.185 | 1.068 | 0.857 | |
| SNV Detrend 1 | DM | 12 | 0.5 | 0.98 | 0.623 | 0.126 | 0.30 | 0.87 | 0.633 | 0.742 | 1.225 | 1.045 |
| TPC | 15 | 0.86 | 0.98 | 65.913 | 42.887 | 0.02 | 0.85 | 438.021 | 458.281 | 1.038 | 0.992 | |
| FRAP | 3 | 0.17 | 0.99 | 70.496 | 8.293 | 0.00 | 0.59 | 54.036 | 82.396 | 1.003 | 0.658 | |
| CUPRAC | 5 | 0.55 | 0.98 | 241.938 | 44.334 | 0.10 | 0.50 | 401.332 | 503.293 | 1.079 | 0.860 | |
| SNV Detrend 2 | DM | 12 | 0.49 | 0.98 | 0.629 | 0.127 | 0.29 | 0.87 | 0.635 | 0.718 | 1.221 | 1.080 |
| TPC | 15 | 0.88 | 0.99 | 61.821 | 18.8 | 0.04 | 0.86 | 435.235 | 446.348 | 1.044 | 1.018 | |
| FRAP | 6 | 0.25 | 0.99 | 62.869 | 6.942 | 0.00 | 0.66 | 55.665 | 70.199 | 0.973 | 0.772 | |
| CUPRAC | 5 | 0.57 | 0.98 | 233.641 | 48.374 | 0.10 | 0.88 | 406.149 | 522.235 | 1.066 | 0.829 | |
| MSC | DM | 12 | 0.52 | 0.99 | 0.613 | 0.062 | 0.37 | 0.88 | 0.601 | 0.664 | 1.290 | 1.168 |
| TPC | 14 | 0.85 | 0.99 | 85.685 | 13.029 | 0.00 | 0.85 | 449.565 | 446.884 | 1.011 | 1.017 | |
| FRAP | 6 | 0.25 | 0.99 | 63.098 | 4.671 | 0.00 | 0.58 | 54.328 | 76.234 | 0.997 | 0.711 | |
| CUPRAC | 5 | 0.57 | 0.97 | 233.596 | 63.031 | 0.10 | 0.42 | 407.824 | 504.007 | 1.062 | 0.859 | |
| Pre-Processing | Analyte | LVs (PLS) | R2cal | RMSEC | R2pred | RMSEP | RPD | |||||
|---|---|---|---|---|---|---|---|---|---|---|---|---|
| PLS | SVR | PLS | SVR | PLS | SVR | PLS | SVR | PLS | SVR | |||
| None | DM | 16 | 0.69 | 0.93 | 0.492 | 0.245 | 0.60 | 0.12 | 0.467 | 0.734 | 1.661 | 1.057 |
| TPC | 9 | 0.38 | 0.8 | 138.715 | 89.122 | 0.00 | 0.00 | 444.826 | 504.43 | 1.022 | 0.901 | |
| FRAP | 8 | 0.46 | 0.72 | 53.613 | 48.173 | 0.00 | 0.10 | 72.669 | 155 | 0.746 | 0.350 | |
| CUPRAC | 4 | 0.44 | 0.94 | 264.692 | 93.514 | 0.20 | 0.10 | 377.131 | 463.964 | 1.148 | 0.933 | |
| SG1 | DM | 12 | 0.63 | 0.99 | 0.54 | 0.005 | 0.40 | 0.46 | 0.58 | 0.806 | 1.337 | 0.962 |
| TPC | 10 | 0.38 | 0.99 | 138.302 | 0.638 | 0.02 | 0.00 | 442.631 | 519.086 | 1.027 | 0.876 | |
| FRAP | 11 | 0.45 | 0.99 | 53.811 | 3.966 | 0.00 | 0.02 | 68.738 | 71.269 | 0.788 | 0.760 | |
| CUPRAC | 2 | 0.49 | 0.99 | 253.393 | 9.41 | 0.10 | 0.35 | 378.035 | 576.296 | 1.145 | 0.751 | |
| SG2 | DM | 12 | 0.61 | 0.98 | 0.549 | 0.138 | 0.49 | 0.22 | 0.539 | 0.96 | 1.439 | 0.808 |
| TPC | 11 | 0.46 | 0.98 | 128.641 | 23.998 | 0.03 | 0.00 | 437.273 | 482.028 | 1.040 | 0.943 | |
| FRAP | 9 | 0.38 | 0.96 | 216.228 | 14.408 | 0.00 | 0.10 | 65.005 | 79.026 | 0.834 | 0.686 | |
| CUPRAC | 5 | 0.63 | 0.94 | 0.576 | 85.739 | 0.10 | 0.51 | 400.408 | 517.878 | 1.081 | 0.836 | |
| SNV | DM | 11 | 0.57 | 0.82 | 131.945 | 0.467 | 0.48 | 0.23 | 0.546 | 1.173 | 1.420 | 0.661 |
| TPC | 10 | 0.44 | 0.57 | 60.258 | 138.805 | 0.02 | 0.00 | 437.747 | 451.948 | 1.038 | 1.006 | |
| FRAP | 7 | 0.31 | 0.77 | 202.685 | 36.318 | 0.00 | 0.77 | 69.791 | 67.445 | 0.776 | 0.803 | |
| CUPRAC | 10 | 0.67 | 0.84 | 0.521 | 147.952 | 0.10 | 0.55 | 404.968 | 466.772 | 1.069 | 0.927 | |
| SNV Detrend 1 | DM | 12 | 0.65 | 0.92 | 132.309 | 0.267 | 0.55 | 0.27 | 0.505 | 0.949 | 1.536 | 0.817 |
| TPC | 10 | 0.43 | 0.74 | 46.033 | 95.437 | 0.03 | 0.69 | 436.035 | 424.868 | 1.043 | 1.070 | |
| FRAP | 14 | 0.6 | 0.86 | 204.903 | 29.065 | 0.00 | 0.35 | 68.737 | 73.335 | 0.788 | 0.739 | |
| CUPRAC | 10 | 0.67 | 0.84 | 0.514 | 164.865 | 0.10 | 0.14 | 406.269 | 379.48 | 1.141 | 1.066 | |
| SNV Detrend 2 | DM | 12 | 0.66 | 0.94 | 131.038 | 0.215 | 0.61 | 0.36 | 0.471 | 0.835 | 1.646 | 0.929 |
| TPC | 10 | 0.44 | 0.74 | 60.769 | 95.629 | 0.04 | 0.52 | 433.938 | 433.212 | 1.048 | 1.049 | |
| FRAP | 7 | 0.44 | 0.81 | 203.345 | 35.055 | 0.00 | 0.1 | 69.287 | 66.516 | 0.782 | 0.815 | |
| CUPRAC | 10 | 0.67 | 0.86 | 0.574 | 138.588 | 0.10 | 0.22 | 400.107 | 435.655 | 1.082 | 0.994 | |
| MSC | DM | 10 | 0.58 | 0.82 | 132.535 | 0.452 | 0.48 | 0.21 | 0.544 | 1.098 | 1.426 | 0.706 |
| TPC | 10 | 0.43 | 0.81 | 60.288 | 79.788 | 0.02 | 0.00 | 438.065 | 440.913 | 1.038 | 1.031 | |
| FRAP | 7 | 0.31 | 0.74 | 203.178 | 39.967 | 0.00 | 0.56 | 69.613 | 65.96 | 0.778 | 0.821 | |
| CUPRAC | 10 | 0.67 | 0.86 | 203.178 | 142.06 | 0.10 | 0.00 | 406.983 | 453.391 | 1.064 | 0.955 | |
| Study | Chili Type | DM Content | TPC | FRAP | CUPRAC |
|---|---|---|---|---|---|
| NIR spectroscopy | |||||
| Present study | Green cayenne | R2pred = 0.74, RMSEP = 0.38% | R2pred = 0.65, RMSEP = 464 mg/100 g | R2pred = 0.71 RMSEP = 70 mg/100 g | R2pred = 0.73, RMSEP = 512 mg/100 g |
| Sánchez, et al. [21] | Bell pepper (various) | R2CV = 0.62, RMSECV = 0.66% | |||
| Toledo-Martín, et al. [6] | Bell pepper (various) | R2CV = 0.71, RMSECV = 104 mg/100 g | |||
| Ignat, et al. [10] | Bell pepper (various) | R2CV = 0.93, RMSECV = 0.4 | |||
| Kasampalis, et al. [12] | Bell pepper (various) | R2CV = 0.53, RMSECV = 0.63% | R2CV = 0.67, RMSECV = 44 mg/100 g | ||
| Johnson, et al. [38] | Habanero | R2CV = 0.65, RMSECV = 0.50% | R2CV = 0.21, RMSECV = 162 mg/100 g | R2CV = 0.27, RMSECV = 38 mg/100 g | |
| Kusumiyati, et al. [39] | Green cayenne | R2pred = 0.85, RMSEP = 0.61% | |||
| MIR spectroscopy | |||||
| Present study | Green cayenne | R2pred = 0.54, RMSEP = 0.51% | R2pred = 0.86, RMSEP = 433 mg TE/100 g | R2pred = 0.96, RMSEP = 96 mg/100 g | R2pred = 0.99, RMSEP = 478 mg/100 g |
| Johnson, et al. [38] | Habanero | R2CV = 0.28, RMSECV = 0.86% | R2CV = 0.37, RMSECV = 145 mg/100 g | R2CV = 0.40, RMSECV = 35 mg/100 g | |
| Domínguez-Martínez, et al. [19] 1 | Serrano | R2CV = 0.94, SEP = 0.02 mg GAE/100 g |
Disclaimer/Publisher’s Note: The statements, opinions and data contained in all publications are solely those of the individual author(s) and contributor(s) and not of MDPI and/or the editor(s). MDPI and/or the editor(s) disclaim responsibility for any injury to people or property resulting from any ideas, methods, instructions or products referred to in the content. |
© 2023 by the authors. Licensee MDPI, Basel, Switzerland. This article is an open access article distributed under the terms and conditions of the Creative Commons Attribution (CC BY) license (https://creativecommons.org/licenses/by/4.0/).
Share and Cite
Johnson, J.B.; El Orche, A.; Mani, J.S.; Aït-Kaddour, A.; Walsh, K.B.; Naiker, M. Prediction of Phytochemical Constituents in Cayenne Pepper Using MIR and NIR Spectroscopy. Appl. Sci. 2023, 13, 5143. https://doi.org/10.3390/app13085143
Johnson JB, El Orche A, Mani JS, Aït-Kaddour A, Walsh KB, Naiker M. Prediction of Phytochemical Constituents in Cayenne Pepper Using MIR and NIR Spectroscopy. Applied Sciences. 2023; 13(8):5143. https://doi.org/10.3390/app13085143
Chicago/Turabian StyleJohnson, Joel B., Aimen El Orche, Janice S. Mani, Abderrahmane Aït-Kaddour, Kerry B. Walsh, and Mani Naiker. 2023. "Prediction of Phytochemical Constituents in Cayenne Pepper Using MIR and NIR Spectroscopy" Applied Sciences 13, no. 8: 5143. https://doi.org/10.3390/app13085143