Article

Design of Manufacturing Systems Based on Digital Shadow and Robust Engineering

Laboratory for Manufacturing Systems and Automation, Department of Mechanical Engineering and Aeronautics, University of Patras, 26504 Rio Patras, Greece
*
Author to whom correspondence should be addressed.
Appl. Sci. 2023, 13(8), 5184; https://doi.org/10.3390/app13085184
Submission received: 17 March 2023 / Revised: 12 April 2023 / Accepted: 19 April 2023 / Published: 21 April 2023
(This article belongs to the Special Issue Smart Machines and Intelligent Manufacturing)

Abstract

:
In the era of digital transformation, industry is facing multiple challenges due to the need for implementation of the Industry 4.0 standards, as well as the volatility of customer demands. The latter has created the need for the design and operation of more complex manufacturing systems and networks. A case study derived from Process Industries (PIs) is adopted in this research work in order to design a framework for flexible design of production lines, automation of quality control points, and improvement of the performance of the manufacturing system. Therefore, a Digital Shadow of a production line is developed to collect, analyze and identify potential issues (bottlenecks). An edge computing system for reliable and low-latency communications is also implemented. The digital model is validated using statistical Design Of Experiments (DOE) and ANalysis Of VAriance (ANOVA). For the assessment of what-if scenarios, the Digital Shadow model will be used in order to evaluate and find the desired solution. Ultimately, the goal of this research work is to improve the design and performance of the industry’s production section, as well as to increase the production rate and the product mix.

1. Introduction

A manufacturing system is a combination of humans and mechanical equipment, connected with common information and material flow [1]. Manufacturing systems and networks are facing constant challenges in producing new products at shortened time-to-market due to the current highly competitive business environment [2], which is mainly driven by the growing need for highly customized products and demand volatility [3]. However, continuous technological development enables the integration of customers through the entire product lifecycle, with the provision of functionalities for creation, customization and personalization of new products [4]. From an enterprise point of view, the Mass Customization and Mass Personalization paradigms exert pressure, since it becomes almost impossible to (i) build up stock ahead of time, (ii) plan surges in product demands, (iii) predict new trends, and (iv) maintain a variety of machinery that can produce different products at the lowest possible cost [5,6,7,8,9].
Small and Medium-sized Enterprises (SMEs) are cornerstones of economic development for the majority of the countries since they represent approximately 90% of the total number of businesses, and more than 50% of employment opportunities [10]. SMEs contribute up to forty 40% of national domestic product, making them important employers in the global market [11]. SMEs need to adapt to ever-changing business conditions in order to succeed. The authors of [12,13] have investigated the most prevalent challenges for SMEs, in order to achieve resiliency and sustainability. Regarding [14,15,16], sustainability, resiliency and human-centricity are the main pillars of Industry 5.0. Industry 5.0 is characterized as a new technological revolution that places the well-being of workers at the core of the manufacturing process, by making production respect the boundaries of our planet and the harmonious symbiosis between humans and machines. Therefore, the main technological pillars of Industry 5.0, along with the key enabling technologies in the transition from Industry 4.0 to Industry 5.0, will contribute to the transit of SMEs to the core of manufacturing production and will overcome the challenges arising from mass personalization [15].
Key technologies supporting the wave towards digital transformation are Big Data Analytics (BDA), Artificial Intelligence (AI), Internet of things (IoT), Cloud Computing and Edge Computing, to mention but a few [17]. By implementing the aforementioned advanced technologies, SMEs aim to achieve high levels of production flexibility, quality and efficiency. However, in case SMEs are unable to participate in the highly challenging strategic programs of the aforementioned countries, they can apply techniques that will improve the operation of SMEs; the most common techniques are discussed in the manufacturing tetrahedron: (i) cost, (ii) quality, (iii) flexibility and (iv) time. This manufacturing tetrahedron contains four general theories that can be used for decision-making in real case studies.
When the SME belongs to the category of Process Industry (PI), there are many issues that the company might face, such as low flexibility, the need to store a large number of products, seasonality, and a market demand influenced by geopolitical and societal disturbances. The authors of [18] support the idea that both Industry 4.0 and Society 5.0 are an opportunity adopted by PI SMEs in order to transform their business model, increase customer satisfaction and improve the value chain of a food product through traceability. Therefore, the PI needs a good strategy to continue to be competitive with other companies and to assimilate changes in the dynamic market environment. According to [19,20,21], companies that belong to the category of PIs invest small capital into Research and Development (R&D), and this is mainly observed in EU member states [20]. As stated in [22], in Greece, the value added to the manufacturing of food, beverages, and tobacco is very high compared to other developed countries. In Greece, the food sector plays an important role in the level of export share and in a positive trade balance; however, there is a lack of digital transformation within companies and little adaption of Industry 4.0 technologies and techniques to the industrial landscape [23]. In this case study, a Digital Shadow architecture will be proposed, adopting edge computing technology to increase the digitization and digitalization level of the PI to move towards Industry 4.0 standards. According to [24,25,26,27,28,29,30], Digital Shadow is a next-generation information system that allows a more efficient operation of value-creation systems and provides holistic data from multiple and diverse sources to support the decision-making process. Digital Shadow is a key component of the visibility intelligence level and contributes to make, in near real-time, management decisions, as stated in real data [31]. The development of Digital Shadow architecture will be used in the implementation of edge computing technology to bring the services and utilities of cloud computing closer to the end user [32]. Edge computing technology is characterized by fast processing and quick application response time [33].
Based on the above-mentioned ideas, the key advantages of integrating Digital Shadow technology into a conventional food industry production line are the multiple benefits that will be analyzed in the following. More specifically, Digital Shadow technology offers various advantages, such as enhanced efficiency by identifying bottlenecks, reducing waste and boosting productivity. It also improves quality control by detecting any defects or contamination and alerting managers immediately, which can prevent costly recalls and improve customer satisfaction. In addition, implementing this technology ensures compliance with safety regulations and protocols related to temperature control, sanitation and allergen management. Real-time data analysis can help managers in informed decision making, especially when dealing with issues such as equipment breakdowns or supply chain disruptions. Ultimately, Digital Shadow technology can lead to long-term cost savings for companies by optimizing production processes, reducing waste and improving quality control, which can result in increased profitability and competitiveness. Furthermore, integrating Design of Experiments (DOE) with Digital Shadow technology in a traditional production line contributes towards the following benefits:
  • Enhanced Process Optimization: The statistical technique of DOE can be employed to identify critical factors that affect a particular process, enabling companies to optimize production. By using Digital Shadow technology, real-time data can be collected from production processes to pinpoint the most significant factors affecting efficiency, quality, and safety. This combination enables companies to continuously optimize production processes and to lower production costs.
  • Improved Quality Control: With Digital Shadow technology, companies can monitor production processes in real-time, gather data from sensors and devices, and ensure that quality parameters are met. By using DOE techniques, companies can identify critical factors affecting product quality and adjust them to improve quality consistency. The combination of DOE and Digital Shadow technology ensures that products are consistently produced with high quality and meet or exceed customer expectations.
  • Increased Efficiency: Digital Shadow technology allows for the collection of industrial big data sets in real-time, giving production managers insights into how to optimize production processes. By using DOE techniques, companies can identify the most significant factors affecting production efficiency, such as machine speed, temperature, or pressure. By optimizing these factors, companies can reduce cycle times, increase production throughput and improve efficiency.
  • Reduced Downtime: By integrating Digital Shadow technology, companies can monitor production processes in real-time and promptly identify potential issues that may cause downtime. By using DOE techniques, companies can identify critical factors affecting machine reliability, such as machine speed or maintenance schedules. As a next step, by optimizing these factors, companies can reduce machine downtime, leading to increased productivity and decreased maintenance costs.
  • Improved Cost Management: Digital Shadow technology can provide companies with real-time data on production costs, such as energy usage, raw material costs and labor costs. As a result, by using DOE techniques, companies can identify the most significant factors that impact production costs and make adjustments to lower costs. Finally, by optimizing production processes and reducing waste, companies can save money on production costs, leading to improved profitability.
The contribution of this paper can be summarized as follows. The main advantage of utilizing Digital Shadows technology and robust engineering techniques is the improved decision-making support in PI. The production line is digitized, and the digitalization services in combination with Industry 4.0 technologies, such as Internet of Things, Simulation and Cloud Computing, etc., are utilized. The Digital Shadow of a production line is developed to collect, analyze, and identify potential issues, with decisions made based on the integration of historical data and current dynamic events. The suggested actions can be adapted, taking into consideration the current production situation. The technology can also be used to digitize the knowledge of experienced operators, which is crucial in the food industry, where product quality is sensitive to delicate manipulations. The use of Digital Shadow makes the transition to Digital Twins technology easier. Robust engineering/statistical DOE techniques are used to validate the digital model through a specific number of experiments. ANOVA is employed to identify control factors affecting performance and to propose alternative solutions. The research topic to be addressed in the following paragraphs is “the definition, design, and development of a framework for the utilization of DOE in combination with Digital Shadow, in order to further improve and automate decision-making in a food industry”.
The rest of the manuscript is structured as follows. In Section 2, the state of the art in Digital Shadows, Edge Computing and DOE is investigated. In Section 3 the proposed framework of Digital Shadow is presented and discussed. In Section 4, the problem formulation is described. In Section 5 the system implementation is presented. In Section 6 the results are analyzed. Finally, in Section 7, the manuscript is concluded and future research directions are discussed.

2. State of the Art

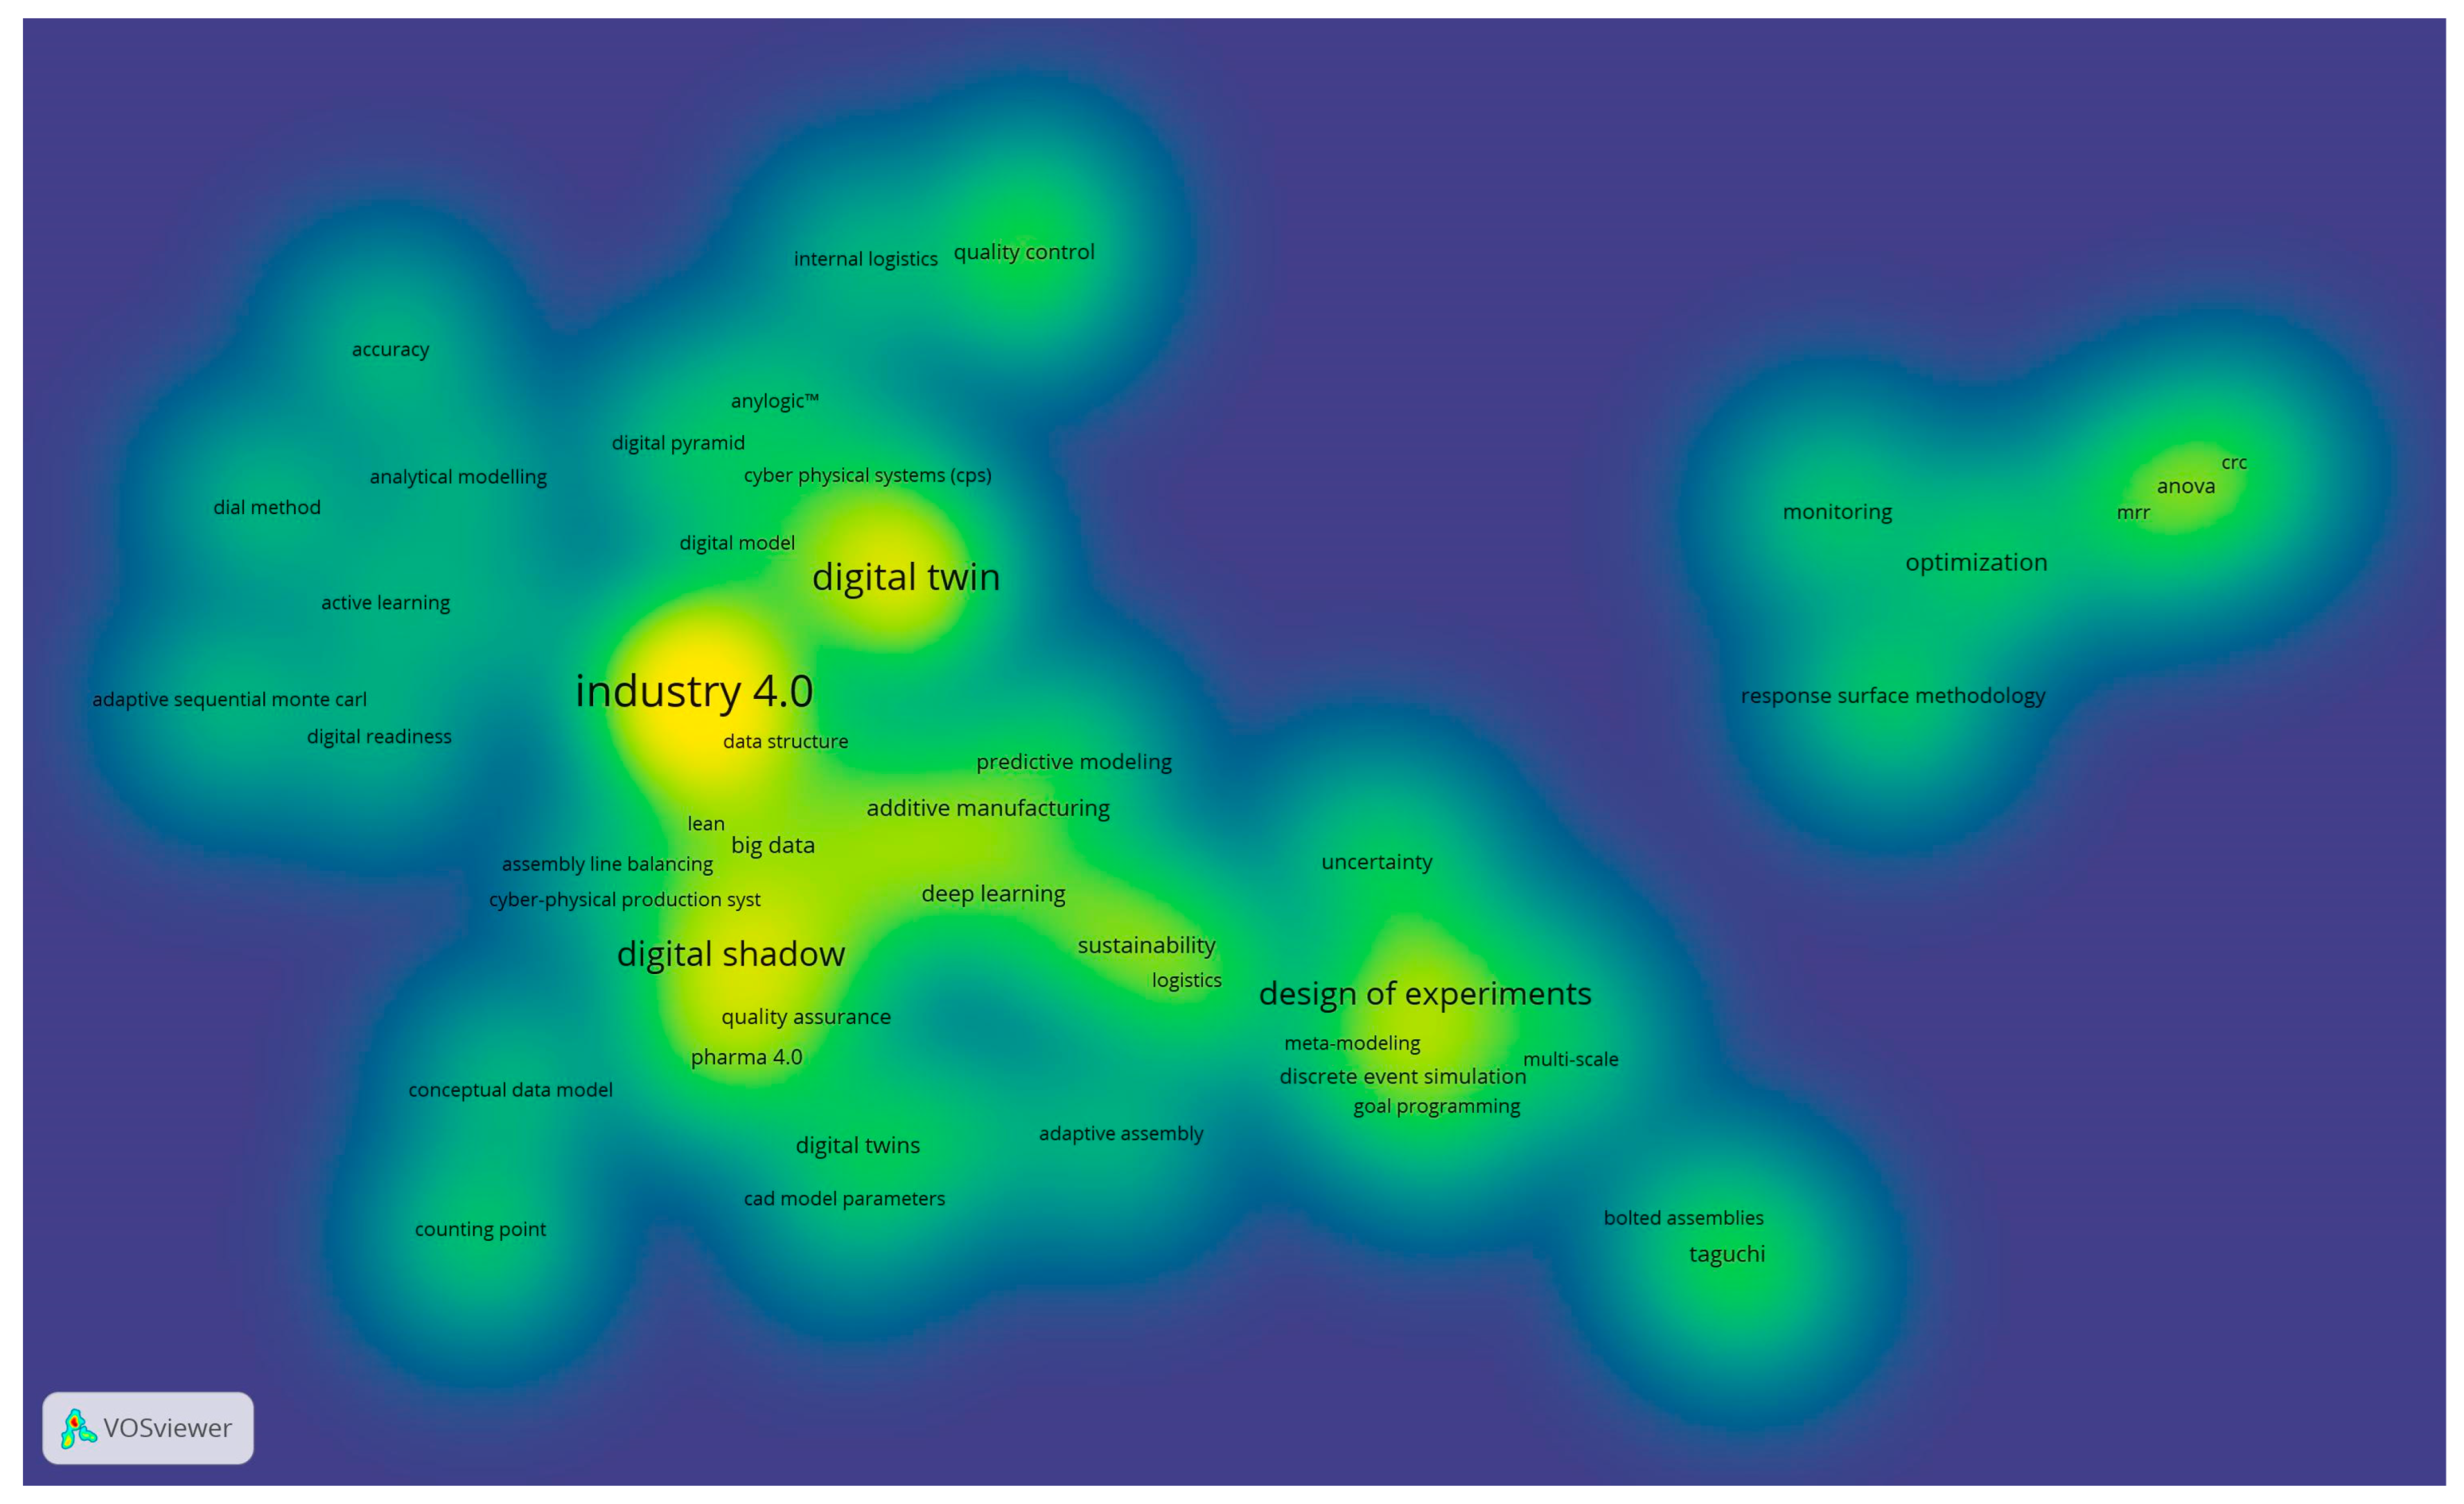
The review methodology is based on academic peer-reviewed publications drawn from well-known academic databases, such as ScienceDirect, Scopus, Google Scholar and Web of Science. Furthermore, the bibliometric analysis, has been chronologically limited to the period of the last five years (i.e., 2018 up to 2023). The structure of the search query applied for the literature investigation is as follows: TITLE-ABS-KEY (industry 4.0 AND “Digital Shadow*” OR “Taguchi method*” OR “design of experiments*”) AND PUBYEAR > 2017 AND PUBYEAR > 2017. The initial search returned a total of 105 scientific articles. Among them were 52 conference papers, 38 articles, 7 conference reviews, 4 book chapters, and 4 review papers. The results obtained from the literature investigation have been processed with the utilization of the VOSviewer software (Version 1.6.19), which provides additional functionalities for the visualization of the bibliometric analysis and the clustering of the results [34]. In Figure 1 the literacy network is displayed. According to this literacy network, the main keywords include, among others, Industry 4.0, Digital Twin, Digital Shadow and DOE. Nodes are a qualitative representation of the volume of publications that mention or implement the aforementioned technologies. By analyzing the visualization of the literacy network, it can be observed that there is no visible connection between the Digital Shadow node and the DOE node, thus indicating the innovation of the presented research work, in which the authors aim to combine the above-mentioned concepts, in order to fully utilize the capabilities of advanced simulation techniques.
The relationship between the major keywords with other technologies is described in the form of lines (links). These lines show with which additional technologies, or in what kind of applications, Industry 4.0, Digital Twin, Digital Shadow, and DOE are implemented. The thickness of the line is a qualitative representation of the number of implemented applications and it is described based on the resulting tree between the lines. In Figure 2, the density visualization of the publications is shown.
In Figure 2 the breadth of research on the subject is illustrated in the form of a heatmap. In particular, the visualization of Figure 2 is useful for unveiling the trends on which the current research effort focuses more frequently. To further improve the interpretation of the presented literature investigation results, all of the topics are grouped in three clusters, as presented in Table 1.
With clustering, any correlation between different topics is feasible, thus making easier the recognition of non-visible linkages. For example, in Figure 1 and Figure 2, the connections between “DOE”, “Industry 4.0”, and “Digital Shadow” are fewer, since there are limited research works combining the above-mentioned methods. However, from the clustering, it becomes apparent that they are correlated.
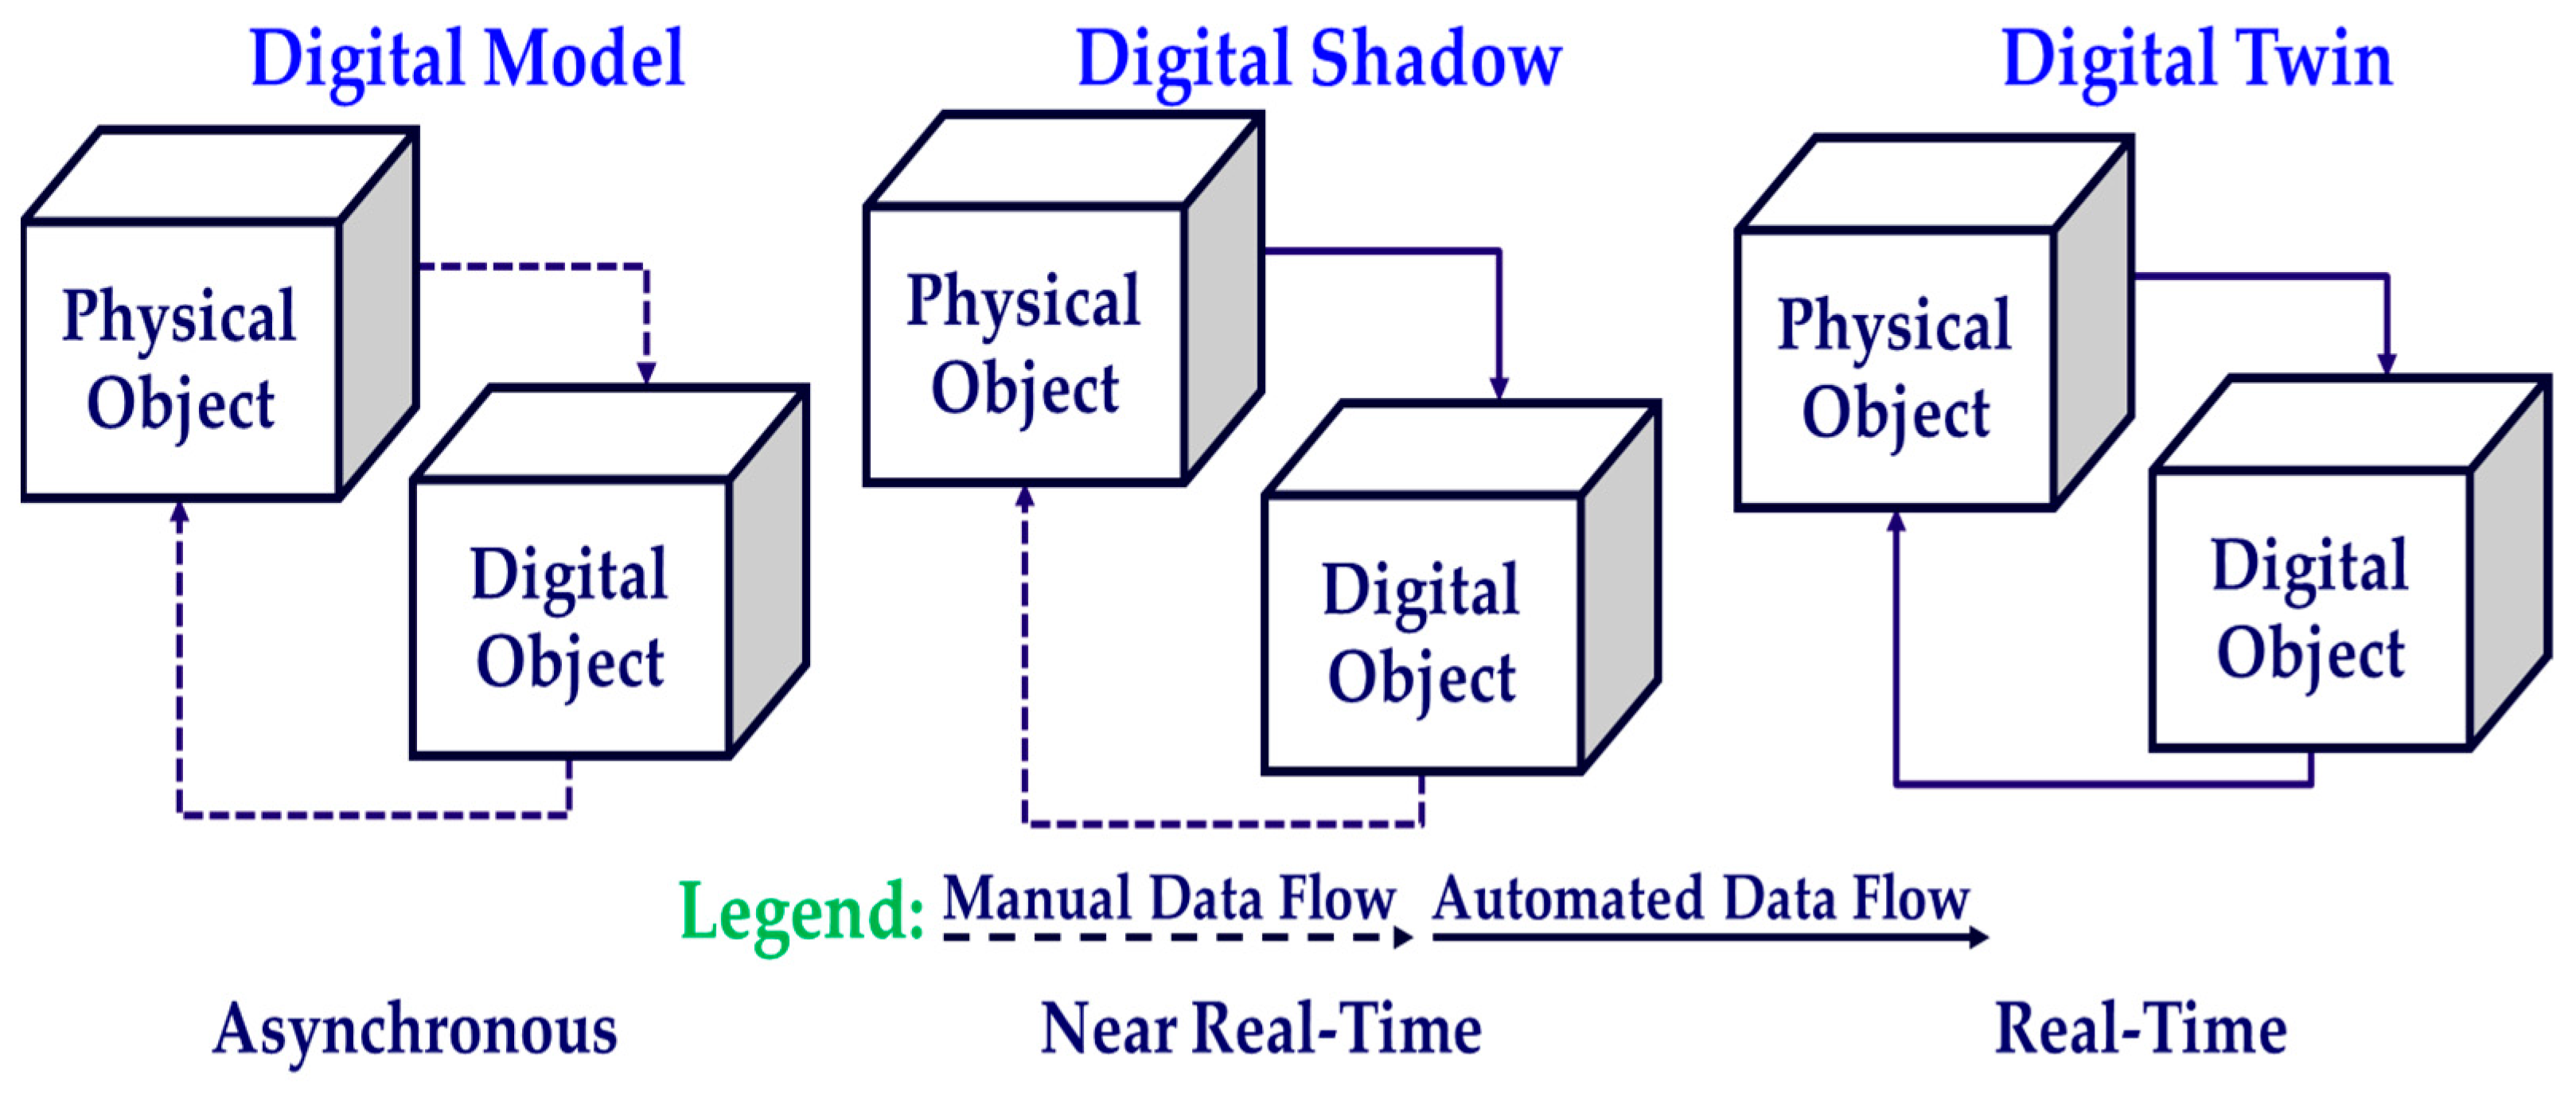
The authors in [24] have presented three different conceptual models related to the communication and data flow between the physical system and its digital counterpart. The models are categorized in (i) Digital Model, in which the communication between the systems is performed manually (asynchronous communication), (ii) Digital Shadow, in which the data flow is semi-automated (near real-time communication), and (iii) Digital Twin, in which the data flow is fully automated (real-time/synchronous communication), thus minimizing human intervention (Figure 3).
Table 2 presents the advantages when comparing Digital Model, Digital Shadow, and Digital Twin technologies [24,25,26,27,28].
The industrial case study presented in this research work involves a process industry, specifically within the food industry, in which there is a continuous flow of materials/resources and data. Considering the delicacy of the final products (food products) and the strict regulations to comply with, it becomes obvious that a digital twin modeling approach is more suitable, in order to act proactively, reduce waste and ensure compliance to these regulations and high-quality standards. Consequently, in this research work, a digital shadow model has been modeled and developed prior to the setup of the required infrastructure for a fully connected industry, which will facilitate the implementation of the digital twin model. With the integration of the developed digital shadow, engineers are capable of monitoring offline the production processes and proceeding easily with changes and/or modifications to production processes. Furthermore, the developed digital shadow model can be used as an analytical tool, in order to provide feedback and insights for decision-making, enabling adjustments to the production process parameters.
Digital Shadow is precisely designed to support decision-making in near real-time in specific modules and has huge potential to reduce time and cost in manufacturing. According to [33], a conceptual model for Digital Shadows is discussed and a holistic data view on production planning and control-specific tasks based on ontology is presented. A Digital Shadow model was implemented in a real case study for an automotive supplier, in which raw data were collected from different machines, processed, analyzed, and reused to make changes in the physical model [35]. According to [36], Digital Shadow was implemented for the optimization of production systems, and DOE analysis was proposed to find the number of experimental runs. Based on [37], Digital Shadow is characterized as one of the most important concepts in Industry 4.0 and is used for data collection for the entire maintenance, repair, and overhaul (MRO) service, regardless of the source data. The authors in [38] present a conceptual framework of an application for the aeronautic machining industry. Regarding [39], a Digital Shadow model was used to improve the design and geometry of a turbine blade. According to the literature review and the network visualization of the literacy topic area, as depicted in Figure 1, there is no variety within publications on Digital Shadow models with implementation in PI, food industries, and food manufacturing. However, there are many publications on Digital Twins technology based on food manufacturing [40,41,42,43].
Edge computing technology enables near real-time data processing at the edge of a network before sending this data to the cloud. The authors of [44] present an architecture based on edge computing as an enabling technology for adaptive production, together with the Digital Shadow. Digital Shadow is not only used for the aggregation of data but also for pushing the data back to the knowledge space to analyze it and to control the process. According to [45], a Digital Twin framework with the assistance of mobile edge computing architecture was developed for industrial automation. The result was that multiple IoT devices offload computing tasks to multiple mobile edge computing servers to reduce end-to-end latency in near real-time intelligent analysis. The authors of [46] develop a platform and test it in a real case study on a dairy farm. The contribution of the integration of edge computing technology in this case study was a reduction in data traffic and an improvement in the reliability of the communication between the edge layer and the cloud layer. An edge computing framework based on the utilization of microcomputers has been presented [47]. The contribution of this work is focused on the offloading of the cloud layer, thus enabling the minimization of simulation times and, by extension, the response time of the Digital Twin paradigm.
Digital Twin is the most prevalent modeling approach. Consequently, the Digital Shadow model presented in this research can be considered as a preparatory stage towards the complete digitalization of the investigated industry. Furthermore, Digital Shadows have been previously researched, as concluded from the online literature. In Table 3, the authors have compiled a list of key research works in the area, in order to highlight key contributions to the body of knowledge, as well as to present ongoing challenges.
Robust engineering is used for designing high-quality systems at reduced costs, increasing the performance of the manufacturing system, and providing inherent strength in a system to cope with external disturbances. In the context of robust engineering, statistical DOE is utilized for solving and optimizing alternative system configurations. According to [48], the authors combined the discrete event simulation to select data from a real case study and implemented DOE to analyze the experimental data and optimize the operation of the current system. The authors of [49] describe how different geometrical designs and machining parameters can affect the energy consumption in milling processes, using DOE analysis. As stated in [50], robust engineering is conducted to provide the quantitative and visual interactive effects of independent parameters on the mechanical performance of different cable bolts. The authors of [51] present the design, development and validation of an automated DOE toolset that is part of a larger Cyber-Physical System (CPS); this research aims to demonstrate the capability to automate, characterize, and predict the power of phases during an industrial machining process and to choose the machining toolpath that improves energy consumption. The authors of [52] describe how an autonomous mobile robot in production systems in the process industry can improve manufacturing performance in terms of productivity, flexibility, and costs. This is a study where the cutting-edge technologies of Industry 4.0 are used to improve the operation and design of the system. With the use of advanced simulation tools, the authors of [53] have developed a new manufacturing system for the production of railcar subassemblies. Several examples have also been discussed in the literature regarding the food industry, investigating issues such as (i) thermal inhibition kinetics of enzymes in fruits and vegetables, (ii) modeling of the heat transfer of tomatoes and other fruit and vegetables during the peeling process, (iii) modeling of the heating process, and (iv) moisture diffusion in rice kernels during the drying process [54,55]. The authors of [56] focus on the design and development of a simulation tool, enabling the analysis of food processing systems. A methodology according to DES is implemented to explore the dynamics and behavior of the processing systems based on an event-driven approach. According to [57], ANOVA was used to investigate the key control parameters and identify the factor with the biggest contribution to the performance of the system. Thus, ANOVA is used to achieve higher quality in the final product and for predictive maintenance. ANOVA was also used to discover the water jet machining parameters and the interactions between them and revealed that pressure and flow rate influence the kerf width, whereas stand-off distance and pressure influence material removal [58]. According to [59], ANOVA analysis is performed to show the contribution of each factor during the joining process. The three factors show an influence on the electromagnetically crimped threaded surfaced tube-to-tube joint (EMCT3), but the pitch of the thread contributes more to the strength of the EMCT3 joint than the other two factors. The author of [60] uses ANOVA to optimize the turning parameters and, among these, the considered parameters are cutting speed, feed rate and depth of cut. Furthermore, a multitude of case studies have been conducted on the ANOVA method, among which the main purpose is the study, analysis, and optimization of a product, service, or system to find the factor that contributes the most to the performance and operation of the manufacturing system [61,62,63].
Although many studies have addressed manufacturing design using digital models, few publications combine frameworks with real data for verification, validation and further experimentation, in cases referring to PI. In the current research, an existing line in a PI is described, and a Digital Shadow framework is presented to improve the design, control, operation and throughput of the production line. The implementation of the Digital Shadow architecture will increase the digitization and digitalization level of the production line under investigation. Moreover, DOE analysis is conducted to find the appropriate number of experiments that have to be performed in order to find the key factors that most affect the operation of the current production line. In the end, the proposed solution will be evaluated using the validated digital model to achieve the desired objectives according to the selected Key Performance Indicators (KPIs). Additionally, the main points of the paper, comparing it with other key publications [25,30,48,52] is presented in Table 4.

3. Proposed Digital Shadow Model

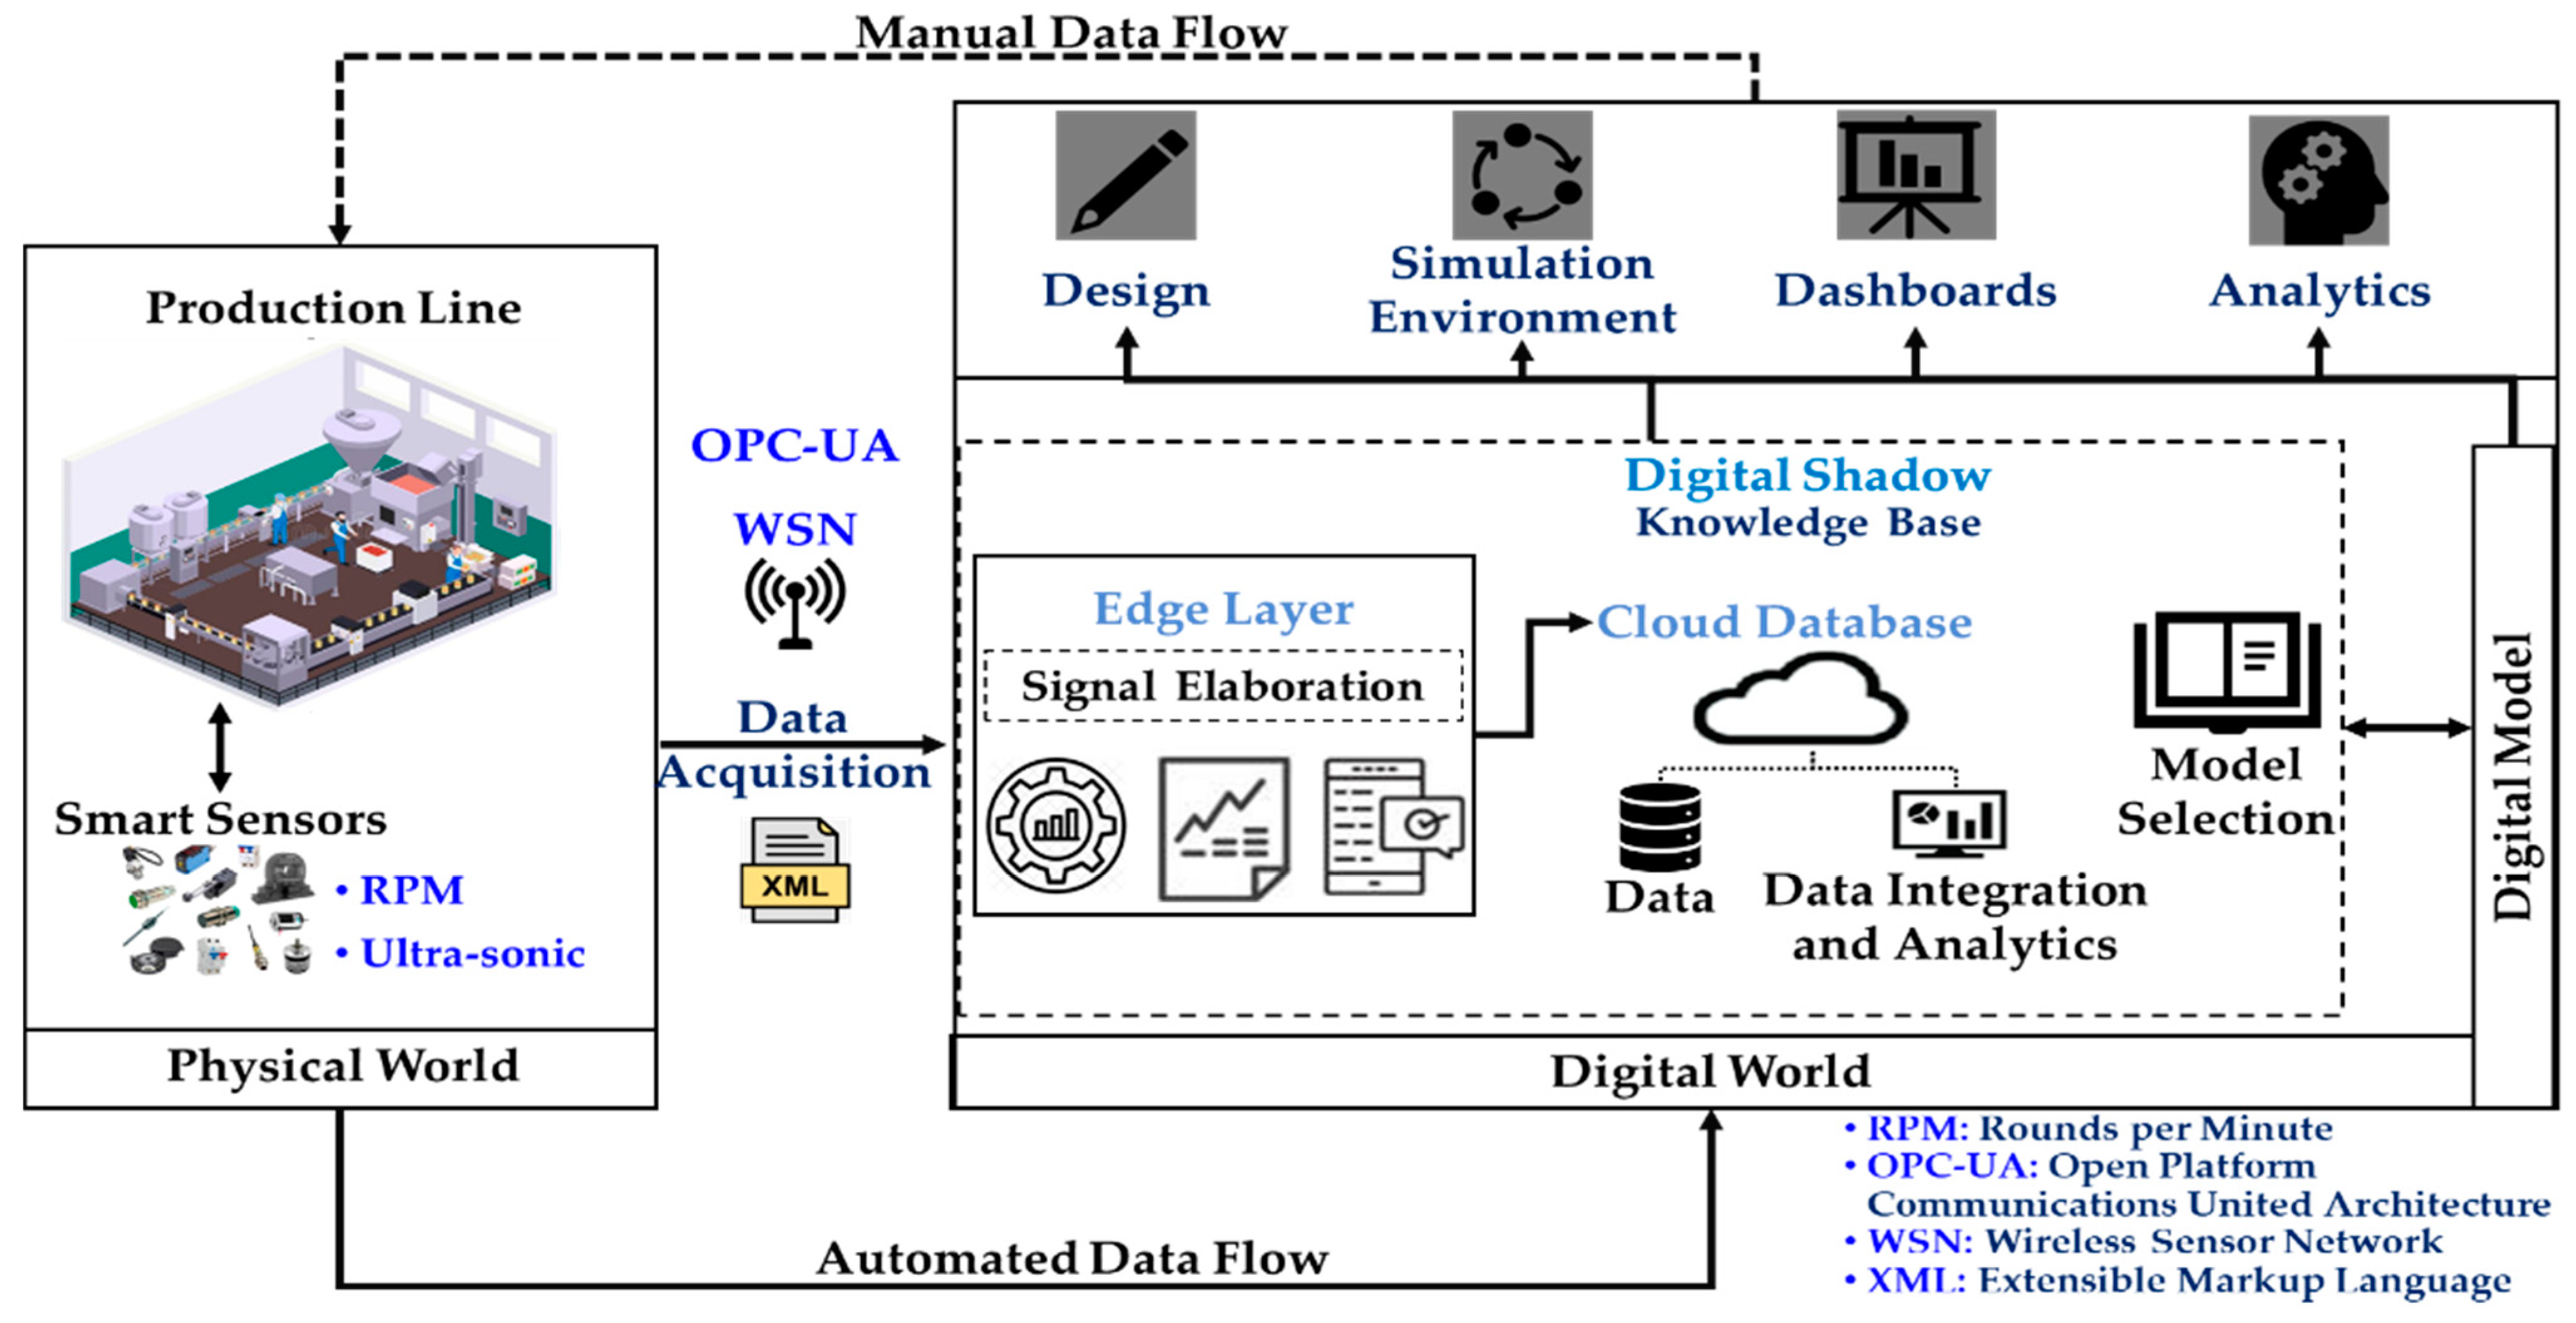
The physical system of the proposed framework consists of machines and sensing devices. The properties of, and adjustments to, the machines need to be obtained from diverse sources, ranging from the type of final products, cycle time of each machine, flow rates, product temperature, type of bottles, etc. Sensing techniques can be used to improve these attributes such as flow, temperature, piece counters and weight sensors, etc. The sensors used for the monitoring and data acquisition for the production floor are: (i) Hall Effect RPM sensors (Revolutions Per Minute), in order to calculate the rate of change in the transportation of products between the production equipment, (ii) ultra-sonic sensors for controlling the filling process, counting the number of bottles/cans transported through the conveyors, and ensuring that no cracks are present (applicable only in glass bottle processing lines). Regarding those lines processing cartons and cans, piezoelectric load cells are used in order to weigh the final product. Finally, since PI involves the processing of foods, the preparation of the intermediate products involves thermal processing. Consequently, infrared sensors are chosen in order to monitor the temperature of the intermediate product and to avoid any contact with the sensing device. For secondary systems, such as water boilers, additional sensors are required for monitoring the flow of resources (i.e., liquid fuel, cold water), as well as for monitoring the quality and quantity of the steam produced. Regarding the flow of the liquid resources, ultrasonic flow sensors are used. At this point it has to be stressed that steam is used in the food processing stages, and thus is required to comply with strict regulations. Concretely, there are certain aspects of steam which need to be controlled, such as moisture content, temperature (for the determination of the superheat of the steam), pressure (determination of the steam saturation), and flow rate. Therefore, content conductivity sensors are used for the steam, thermocouples for the superheat, pressure sensors for the steam’s saturation, and differential pressure flow meters for measuring the steam flow. In order to ensure high reliability, security and support for complex data types, the OPC UA (Open Platform Communications Unified Architecture) Machine-to-Machine (M2M) communication protocol is implemented. In order to take advantage of the increased capabilities of modern sensing and controller systems, a Wireless Sensor Network (WSN) following a star topology has been created. By doing so, the creation of an Edge Computing layer is facilitated. In Edge Computing environments, OPC UA can be used to connect industrial devices such as sensors, controllers and machines to applications running on edge servers or gateways. The edge servers or gateways can then process the data locally, and only send relevant information to a central server or cloud for further analysis (i.e., the proposed digital shadow). The Digital Shadow framework is presented in Figure 4.

4. Proposed Methodology Description

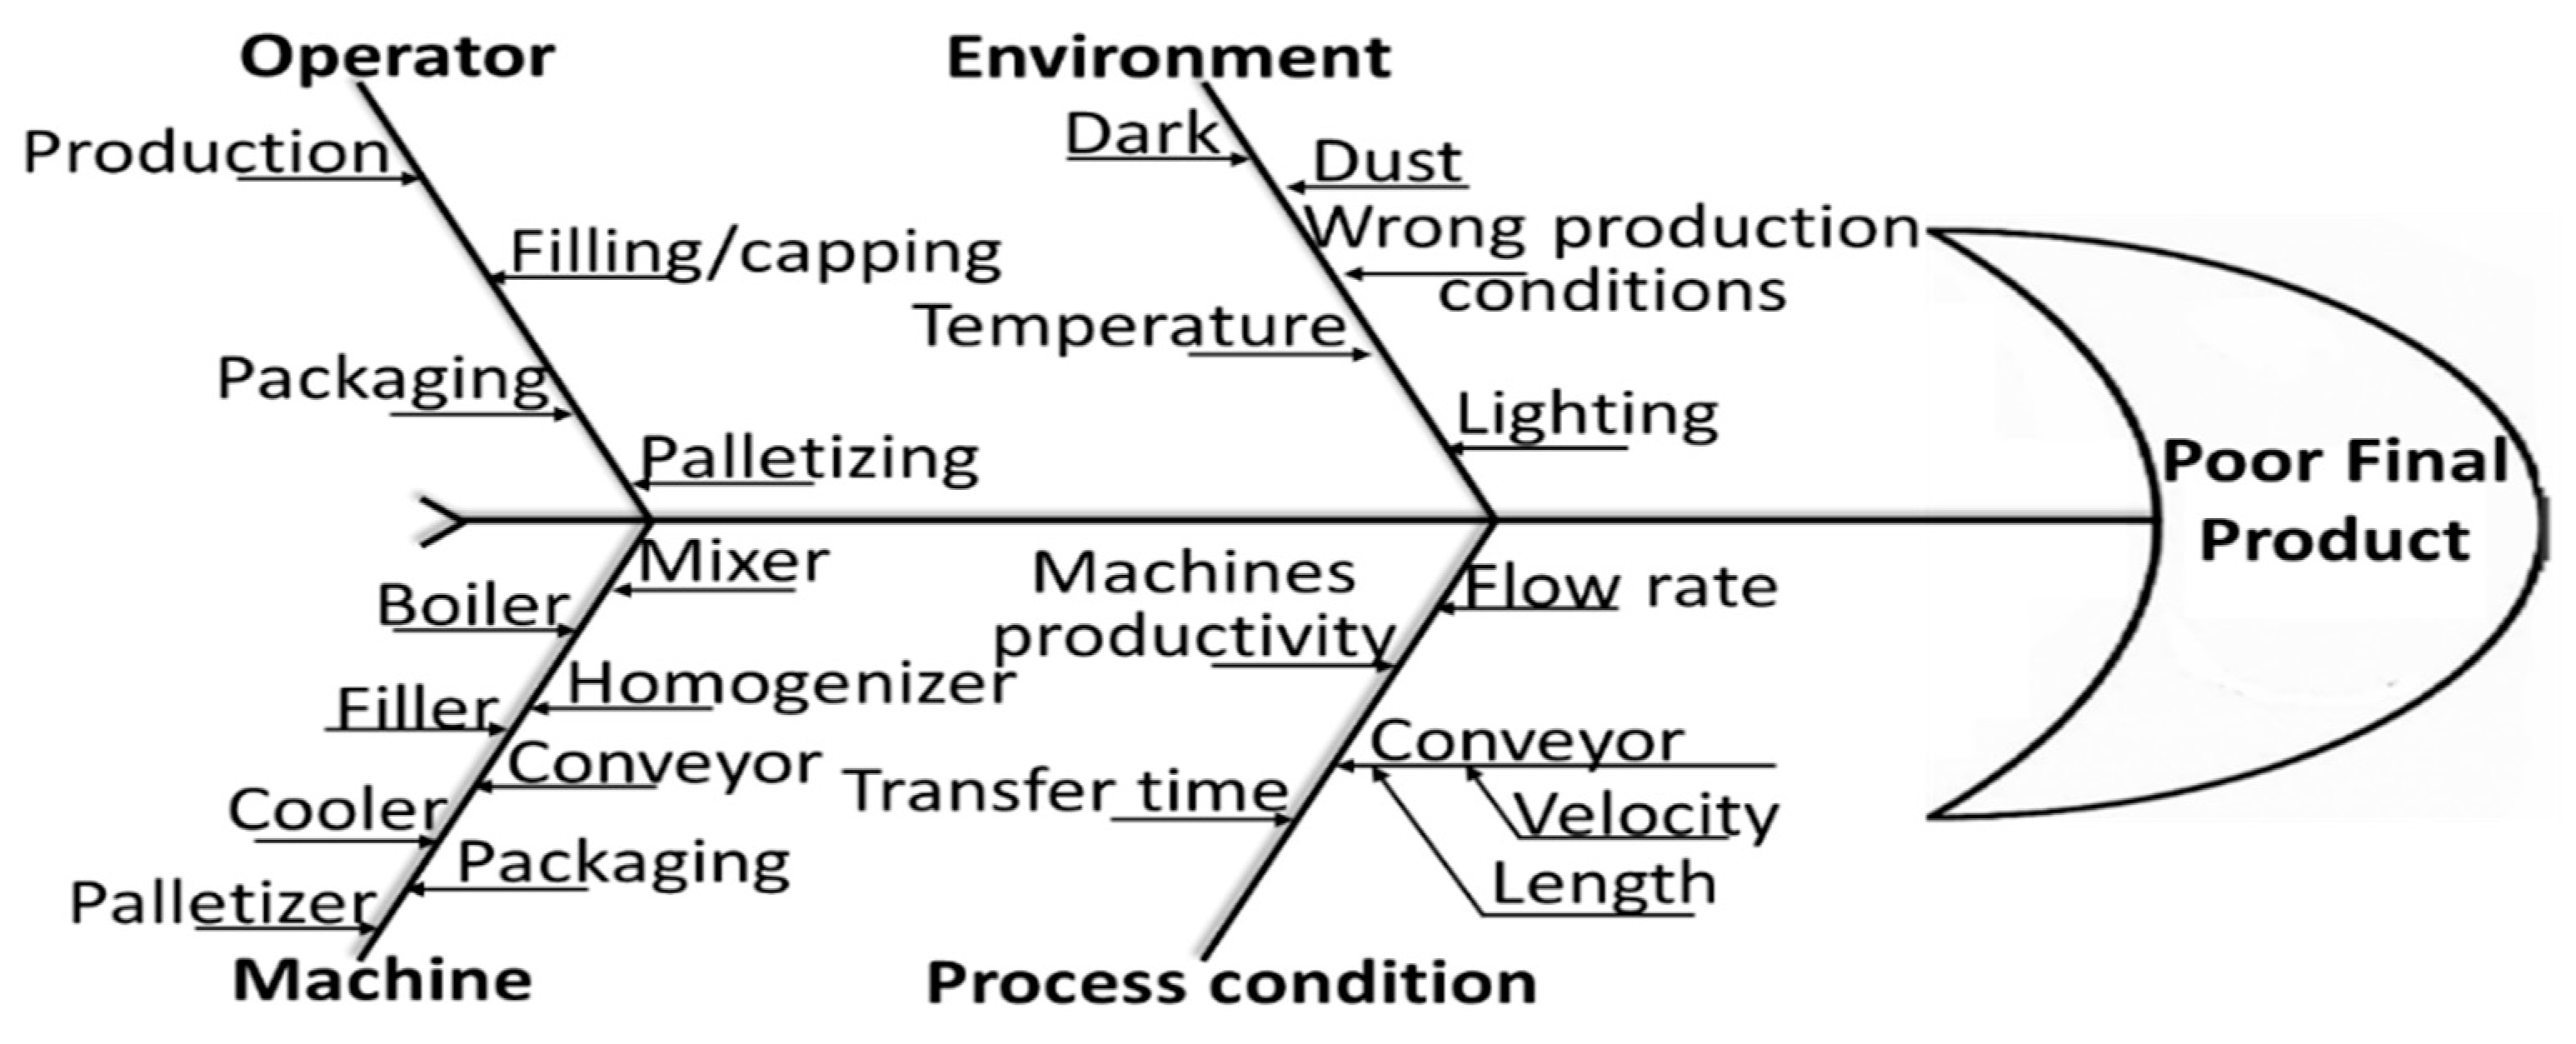
Following the discussion in the previous paragraphs, a Digital Shadow is designed and implemented to further automate critical processes of the production activities taking place in the PI, in particular (i) monitoring of the equipment and the intermediate processes, (ii) control of the production equipment parameters, and (iii) simulation of the overall process to facilitate the identification of possible bottlenecks. Consequently, in order to facilitate the engineers interpretation of the effect of bottlenecks, a parallelization to the corresponding control factors/equipment properties has been performed. The control factors are organized into four main categories (i.e., Machine, Operator, Environment, and Process Condition), and have been illustrated in the cause-effect diagram (also known as the fishbone diagram) in Figure 5.
Following the categorization of the control factors with the utilization of the cause-causality diagram, ANOVA is employed in order to reveal the contribution percentage of each control factor, and thus select the most critical factors. Environmental factors are indeed important for the modelling of the system. However, in the current version of the manuscript, efforts have been focused solely on the mechanical aspect of the system. Concretely, one of the key research goals was to build a proof of concept for the physical system. By extension, environmental factors, which can be considered as random and uncontrollable variables, will be included in a future and more elaborate model of the system. To include environmental factors in DOE and ANOVA, it would be necessary to replicate the experiment under a plethora of environmental conditions, which can be time-consuming, expensive and impractical [64]. Next, the proposed scenarios will be introduced into the digital model to test the functionality and performance of the production line. The generalized workflow is presented in Figure 6. The first steps refer to the data collection from the current case study, system modeling, and the development of a digital model. The second step, digital experimentation, refers to the verification and validation of the digital model based on real data from the production line, in contrast to a list of selected KPIs. After the verification and validation of the digital model, the third step involves the selection of control factors from the fishbone diagram (conveyors’ velocity, machines’ productivity and the number of operators in the palletizing process). The control factors are analyzed with the use of ANOVA to determine the contribution of each parameter to the system performance. The fourth step refers to the selection of the best scenarios for improving the design and performance of the production line.

Mathematical Formulation of the Problem

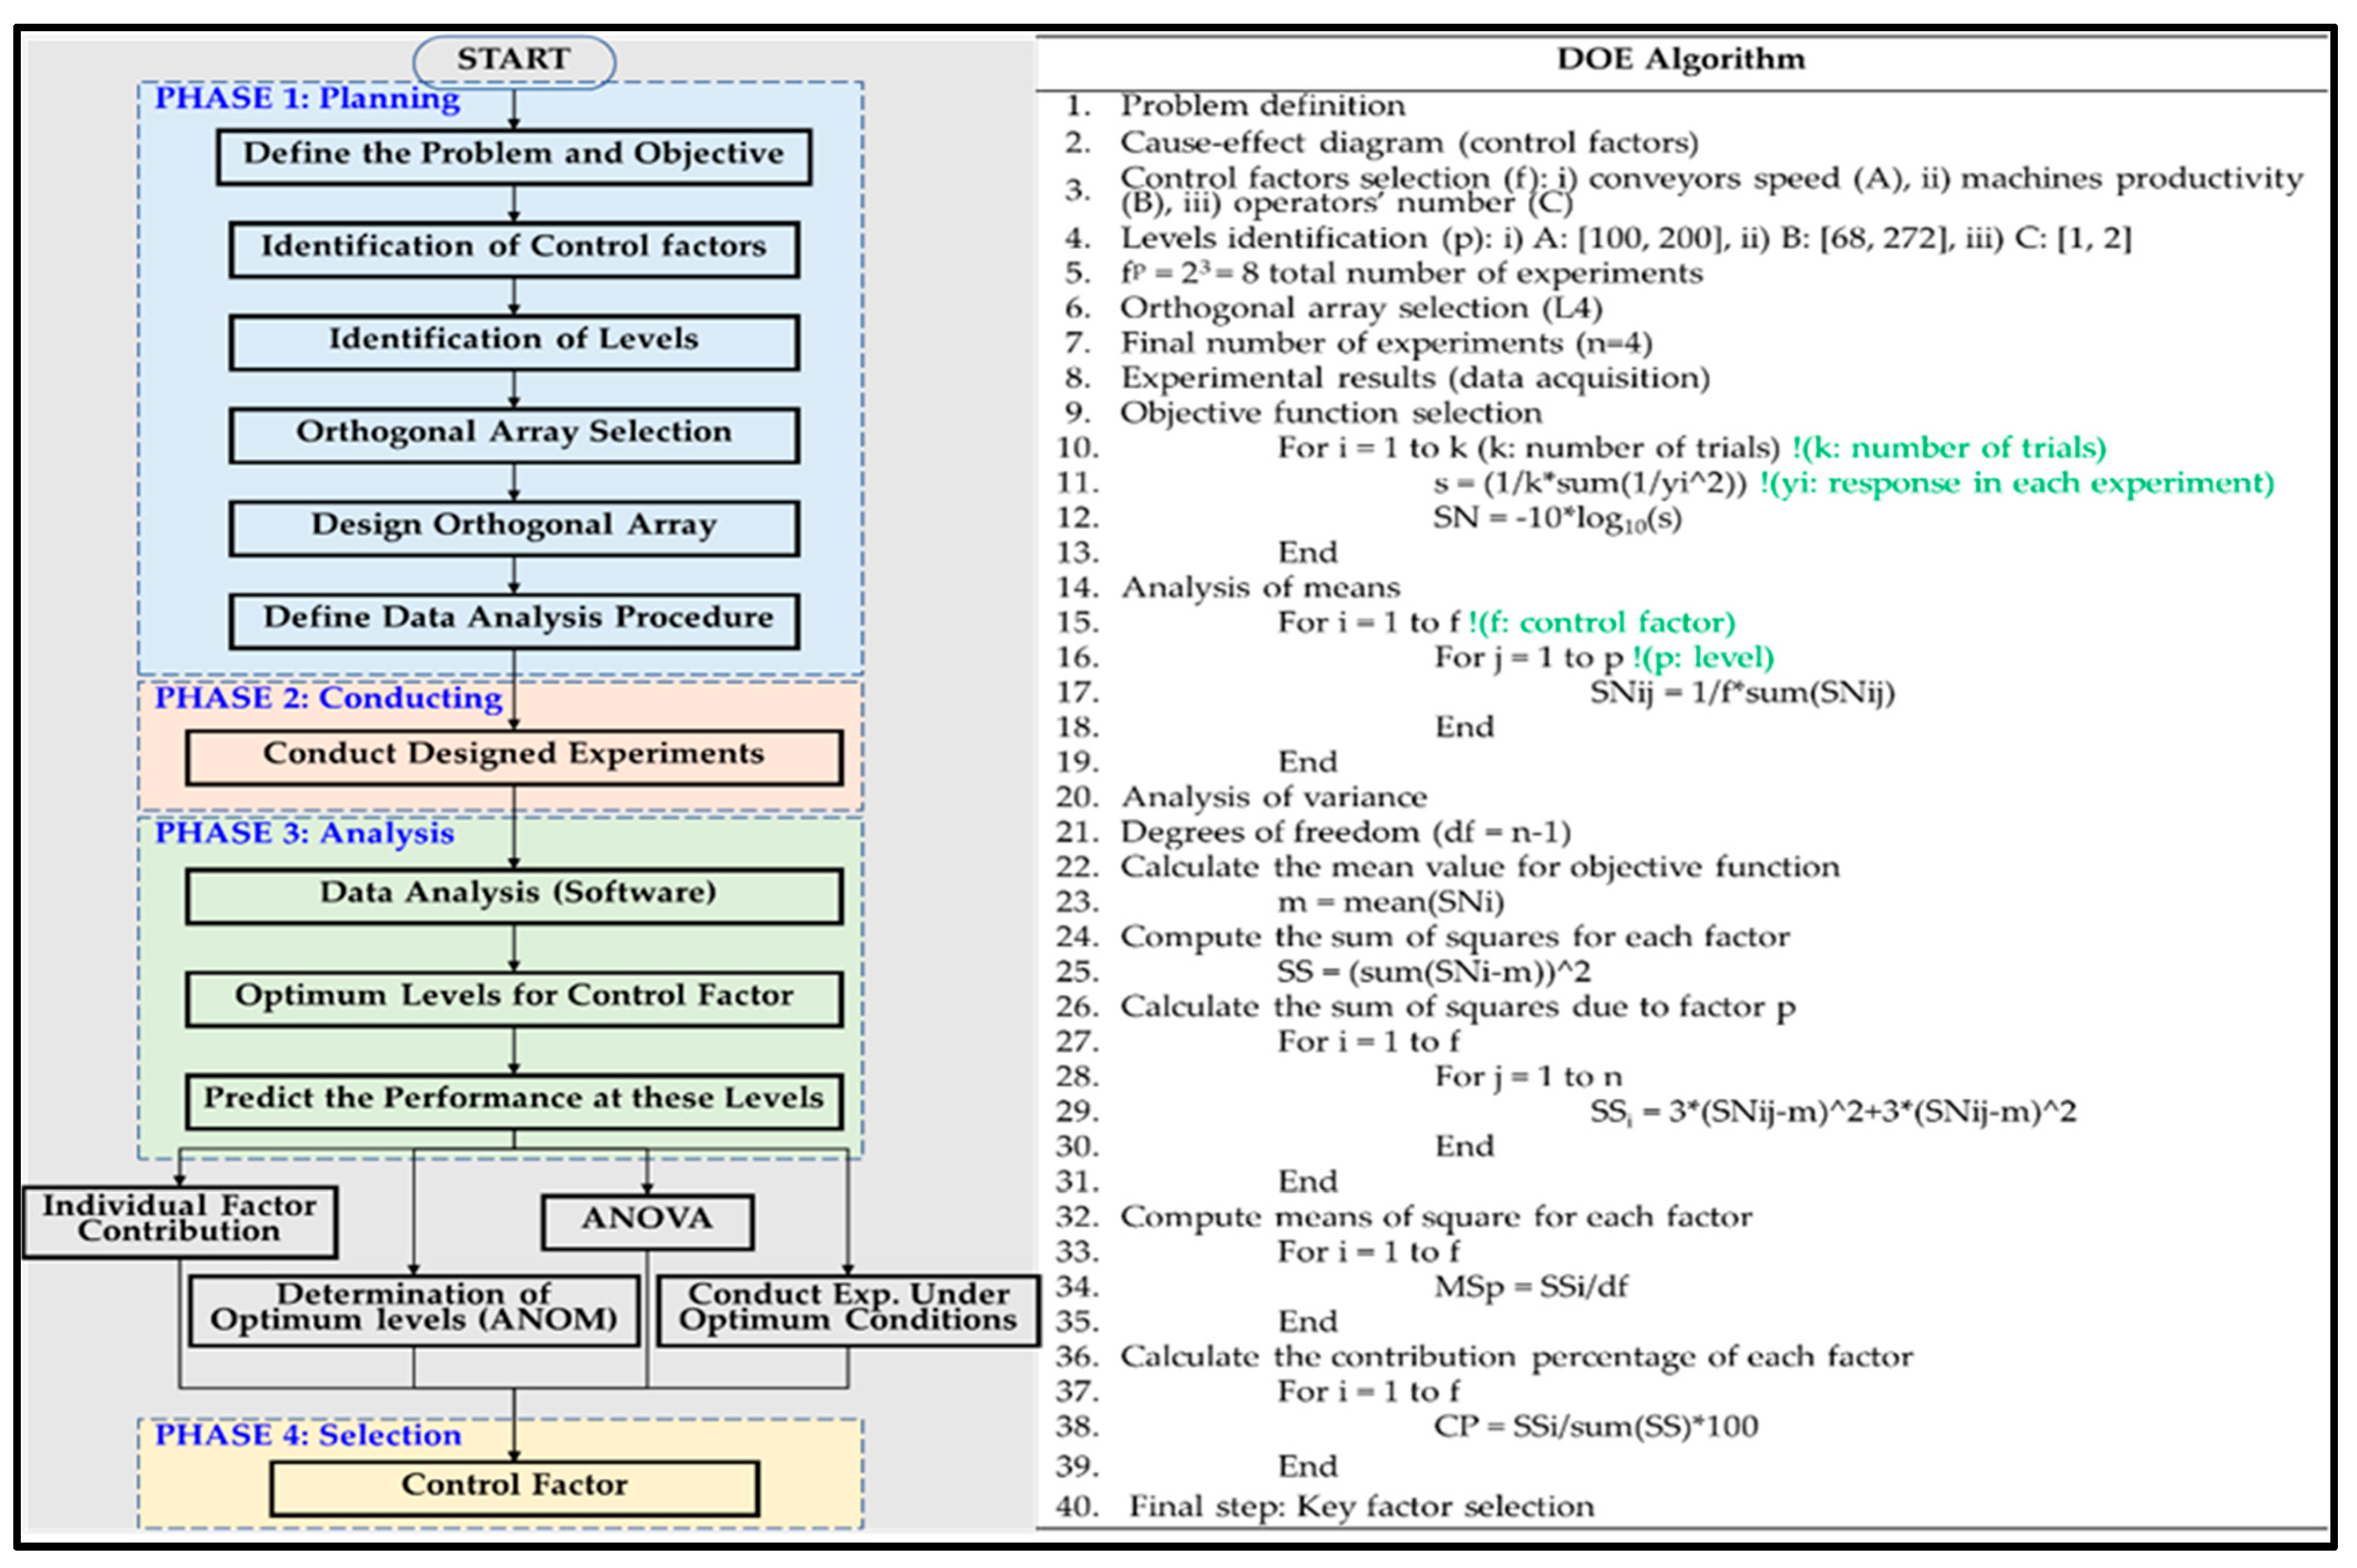
According to Steinberg [64], robust design can be realized via a set of quality engineering activities whose goal is the development of low-cost, yet high quality, products and processes. in this direction, statistically planned experiments are used in order to identify the most influential factors in final product quality. Most importantly, the above-mentioned statistical methods are used in order to optimize the nominal levels of the most influential factors. Robust engineering includes concept design, parameter design and tolerance design [65]. Taguchi’s robust design method uses parameter design to place the design in a position where random “noise” DOE does not cause failure, and to determine the proper design parameters and their levels [66]. The basic idea of parameter design in Taguchi’s robust design is to identify appropriate settings for control factors that make the system’s performance robust in relation to changes in the noise factors [67]. Thus, the control factors are assigned to an inner array in an orthogonal array, and the noise factors are assigned to an outer array. Phadke in [68] also describes robust engineering as a method for studying large numbers of decision variables with the bare minimum number of experiments required. In order to accomplish this, orthogonal arrays are utilized. Furthermore, robust engineering is taken into consideration as an approximation for the implementation/calculation of the DOE and ANOVA method and is presented and described in Figure 7. Robust engineering/statistical DOE based on the Taguchi approach is also used, in order to calculate the minimum number of experiments required for the validation of the digital model. Following the model validation, ANOM (ANalysis Of Means) and ANOVA methods are used for the recognition of the most affecting control factors. In the left part of Figure 7, the flowchart for the DOE analysis is presented. Similarly, in the right part of Figure 7 the corresponding pseudocode for the DOE algorithm is presented.
The preliminary design of the problem and the planning consists of (i) problem definition, (ii) identification of control factors based on a cause-causality diagram, (iii) level identification, (iv) orthogonal array selection, and (v) data analysis. The data connection between the digital model and the orthogonal array is performed in step 2. The third step consists of (i) data analysis and (ii) the prediction of the optimum level for each control factor. ANOVA analysis is used to identify the control factor that affects the system the most (highest percentage). Subsequently, the key control factor with the highest percentage affecting the efficiency of the system is selected.
The selection of the appropriate objective functions is very important for measuring the robustness of a system and solving engineering problems in order to identify control factors that reduce the variability in a product or process by minimizing the effects of uncontrollable factors. In a Taguchi-designed experiment, noise factors are manipulated to force variability and, from the results, to identify the optimal control factor settings that make the process or product robust or resistant to variation from the noise factors. Higher values of the signal-to-noise ratio (SNR) identify control factor settings that minimize the effects of the noise factors; types of SNR are presented in Table 5.
The ultimate goal in the current case study is to increase the overall throughput of the system. Therefore, and according to [47,68,69], the “Larger is better” SNR is selected, as indicated in Equation (1):
S N R = 10 l o g 10 1 k i = 1 k 1 y i 2
where SNR is the signal-to-noise ratio, k is the number of trials and y i is the response in each experiment. Next, ANOM is used to find the variation caused by each factor in the overall mean and is plotted on appropriate graphs. The overall mean is indicated and the average of each factor for each level is also plotted [69]. Equation (2) is used for the calculation of means.
S N R f p ¯ = 1 p i = 1 p S N R
where f is the key factor and p is the number of levels. The contribution of each factor is calculated with the use of Equations (3)–(6) [69].
S S = i = 1 f p S N R i m 2
where SS is the sum of the squares of each factor, fp is the number of experiments in the orthogonal matrix and m is the overall mean of SN ratio
S S A = 3 S N R A 1 ¯ m 2 + 3 S N R A 2 m 2
where S S A is the sum of squares of factor A
M S f a c t o r = S S A D e g r e e s   o f   F r e e d o m
where M S f a c t o r is the mean square for each factor.
C P = S S A S S × 100 %
where C P presents the contribution percentage of each factor in the system performance.
The parameters used in Equations (1)–(6) are summarized below:
  • f → number of factors
  • p → number of levels per factor
  • k → number of trials
  • y i → model response for experiment iteration i
The number of control factors and the number of levels to be used affect the total number of experiments. The number (i.e., k) corresponds to the number of trials, and y i refers to the response in each experiment and is used to calculate the signal-to-noise ratio (SNR). Therefore, the critical parameters are the control factor and the number of levels. Next, the y i is calculated in order to proceed with Equations (1)–(6). As for these parameters, they are not fully related to the proposed framework, except ‘ y i ’. The ‘ y i ’ parameter is measured using an ultra-sonic sensor, and the framework element corresponding to ‘ y i ’ is described during data acquisition. As regards the other parameters, ( f , p , k ) are not inserted into the Digital Shadow model, but they are required for DOE and ANOVA analysis.

5. Industrial Case Study Implementation

This methodology has been applied in a Process Industry to improve the performance of the production line by increasing the product mix and the production rate of machines. The targeted industry faces several challenges, including low digitization and digitalization levels, low production rates compared to the theoretical value of its machines, low production rates in the job shop, and no product mix. The methodology has been adapted to the production and packaging job shop in collaboration with experts from the PI production line. The key goals of this research are to improve the digitization and digitalization level of the company, investigate the most influential control factors affecting the production line performance, and improve the production rate of the machines and product mix. Additionally, a Digital Shadow model has been designed and developed focusing on key activities, such as monitoring, analysis, verification, validation, and identification of bottlenecks in the production line. In Section 5.1, the manufacturing system is presented and discussed, along with the corresponding flowchart for the description of the processes involved. After the modeling of the manufacturing system as a flowchart, the specifications for the development of the digital model are laid out in Section 5.2. In Section 5.3, the implementation of the Taguchi method in the existing manufacturing system will be presented. The selection of control factors along with their levels will be discussed and the selection of the appropriate orthogonal array will be carried out.

5.1. Manufacturing System Description

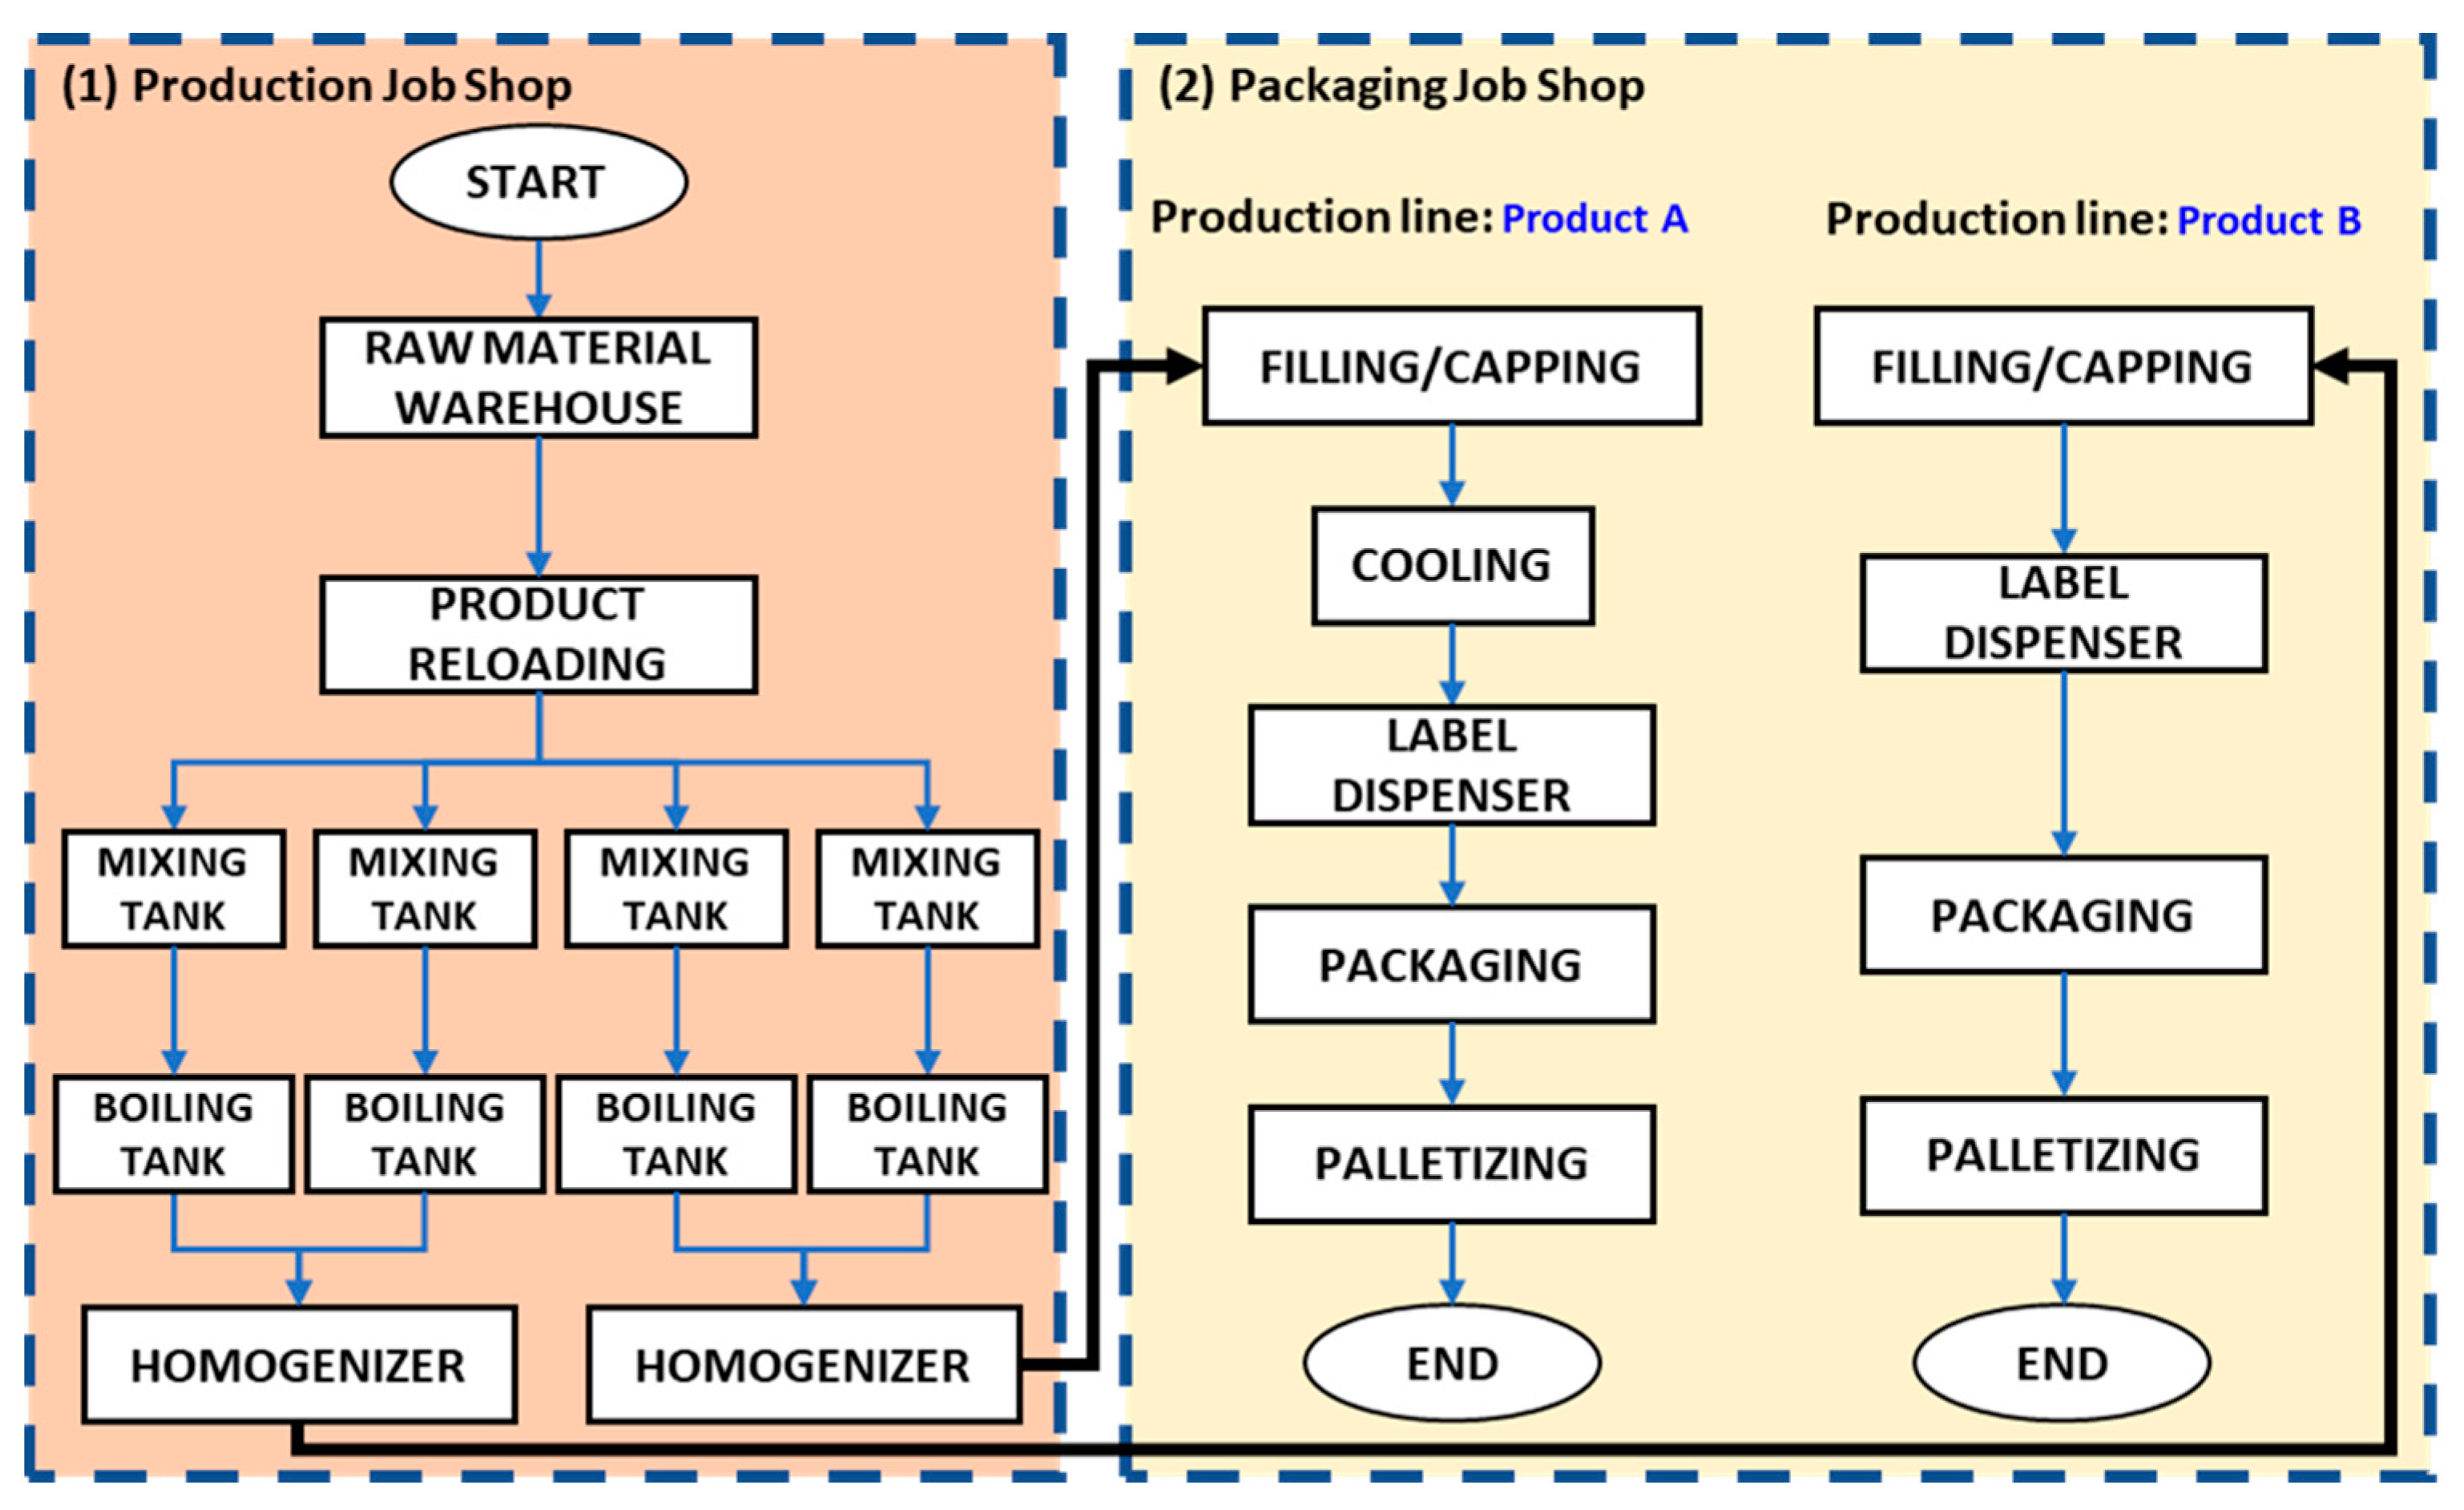
PI operates throughout the calendar year and consists of three main sections: (i) the preparation of the raw material, (ii) the production of the different products, and (iii) the packaging of the finished products. The PI can produce two codes, which are Product A and Product B. The production line consists of two sections, the main production room, and the packaging of the intermediate products.
The raw material comes from the warehouse in special packages, is pumped and transported to a silo. The production job shop consists of the following equipment: (i) two storage tanks to mix the product, (ii) two boiling tanks to boil the product, and (iii) one homogenizer to homogenize the product. All tanks are placed in the production room along with the homogenizer. Each of the tanks and the homogenizer has a capacity of one cubic meter (1 m3). After the homogenizer, the production line is divided into two sub-lines. The first production line receives Product A and the second production line receives Product B. Then the packaging line follows, where the final product is pumped from the production job shop and fed to filling machines. The filled bottles are conveyed to the filling/capping machine and the chiller. In this step, Product B is not directed to the chiller (Figure 8). After the chiller, the bottles are conveyed to the label dispenser, the packaging machine, and the palletizer. In the packaging job shop, the machines, from the filling/capping process to the palletizing process, can reach at least three 300 bottles per minute, but the equipment placed in the production job shop cannot process such large quantities of product. The equipment in the production job shop can process at most 2000 kilos of product per hour (2000 kg/h) and this amount of product for a bottle of 490 g corresponds to a production rate of 68 bottles per minute. The working schedule of the company covers three shifts per day and five days per week.

5.2. Digital Model

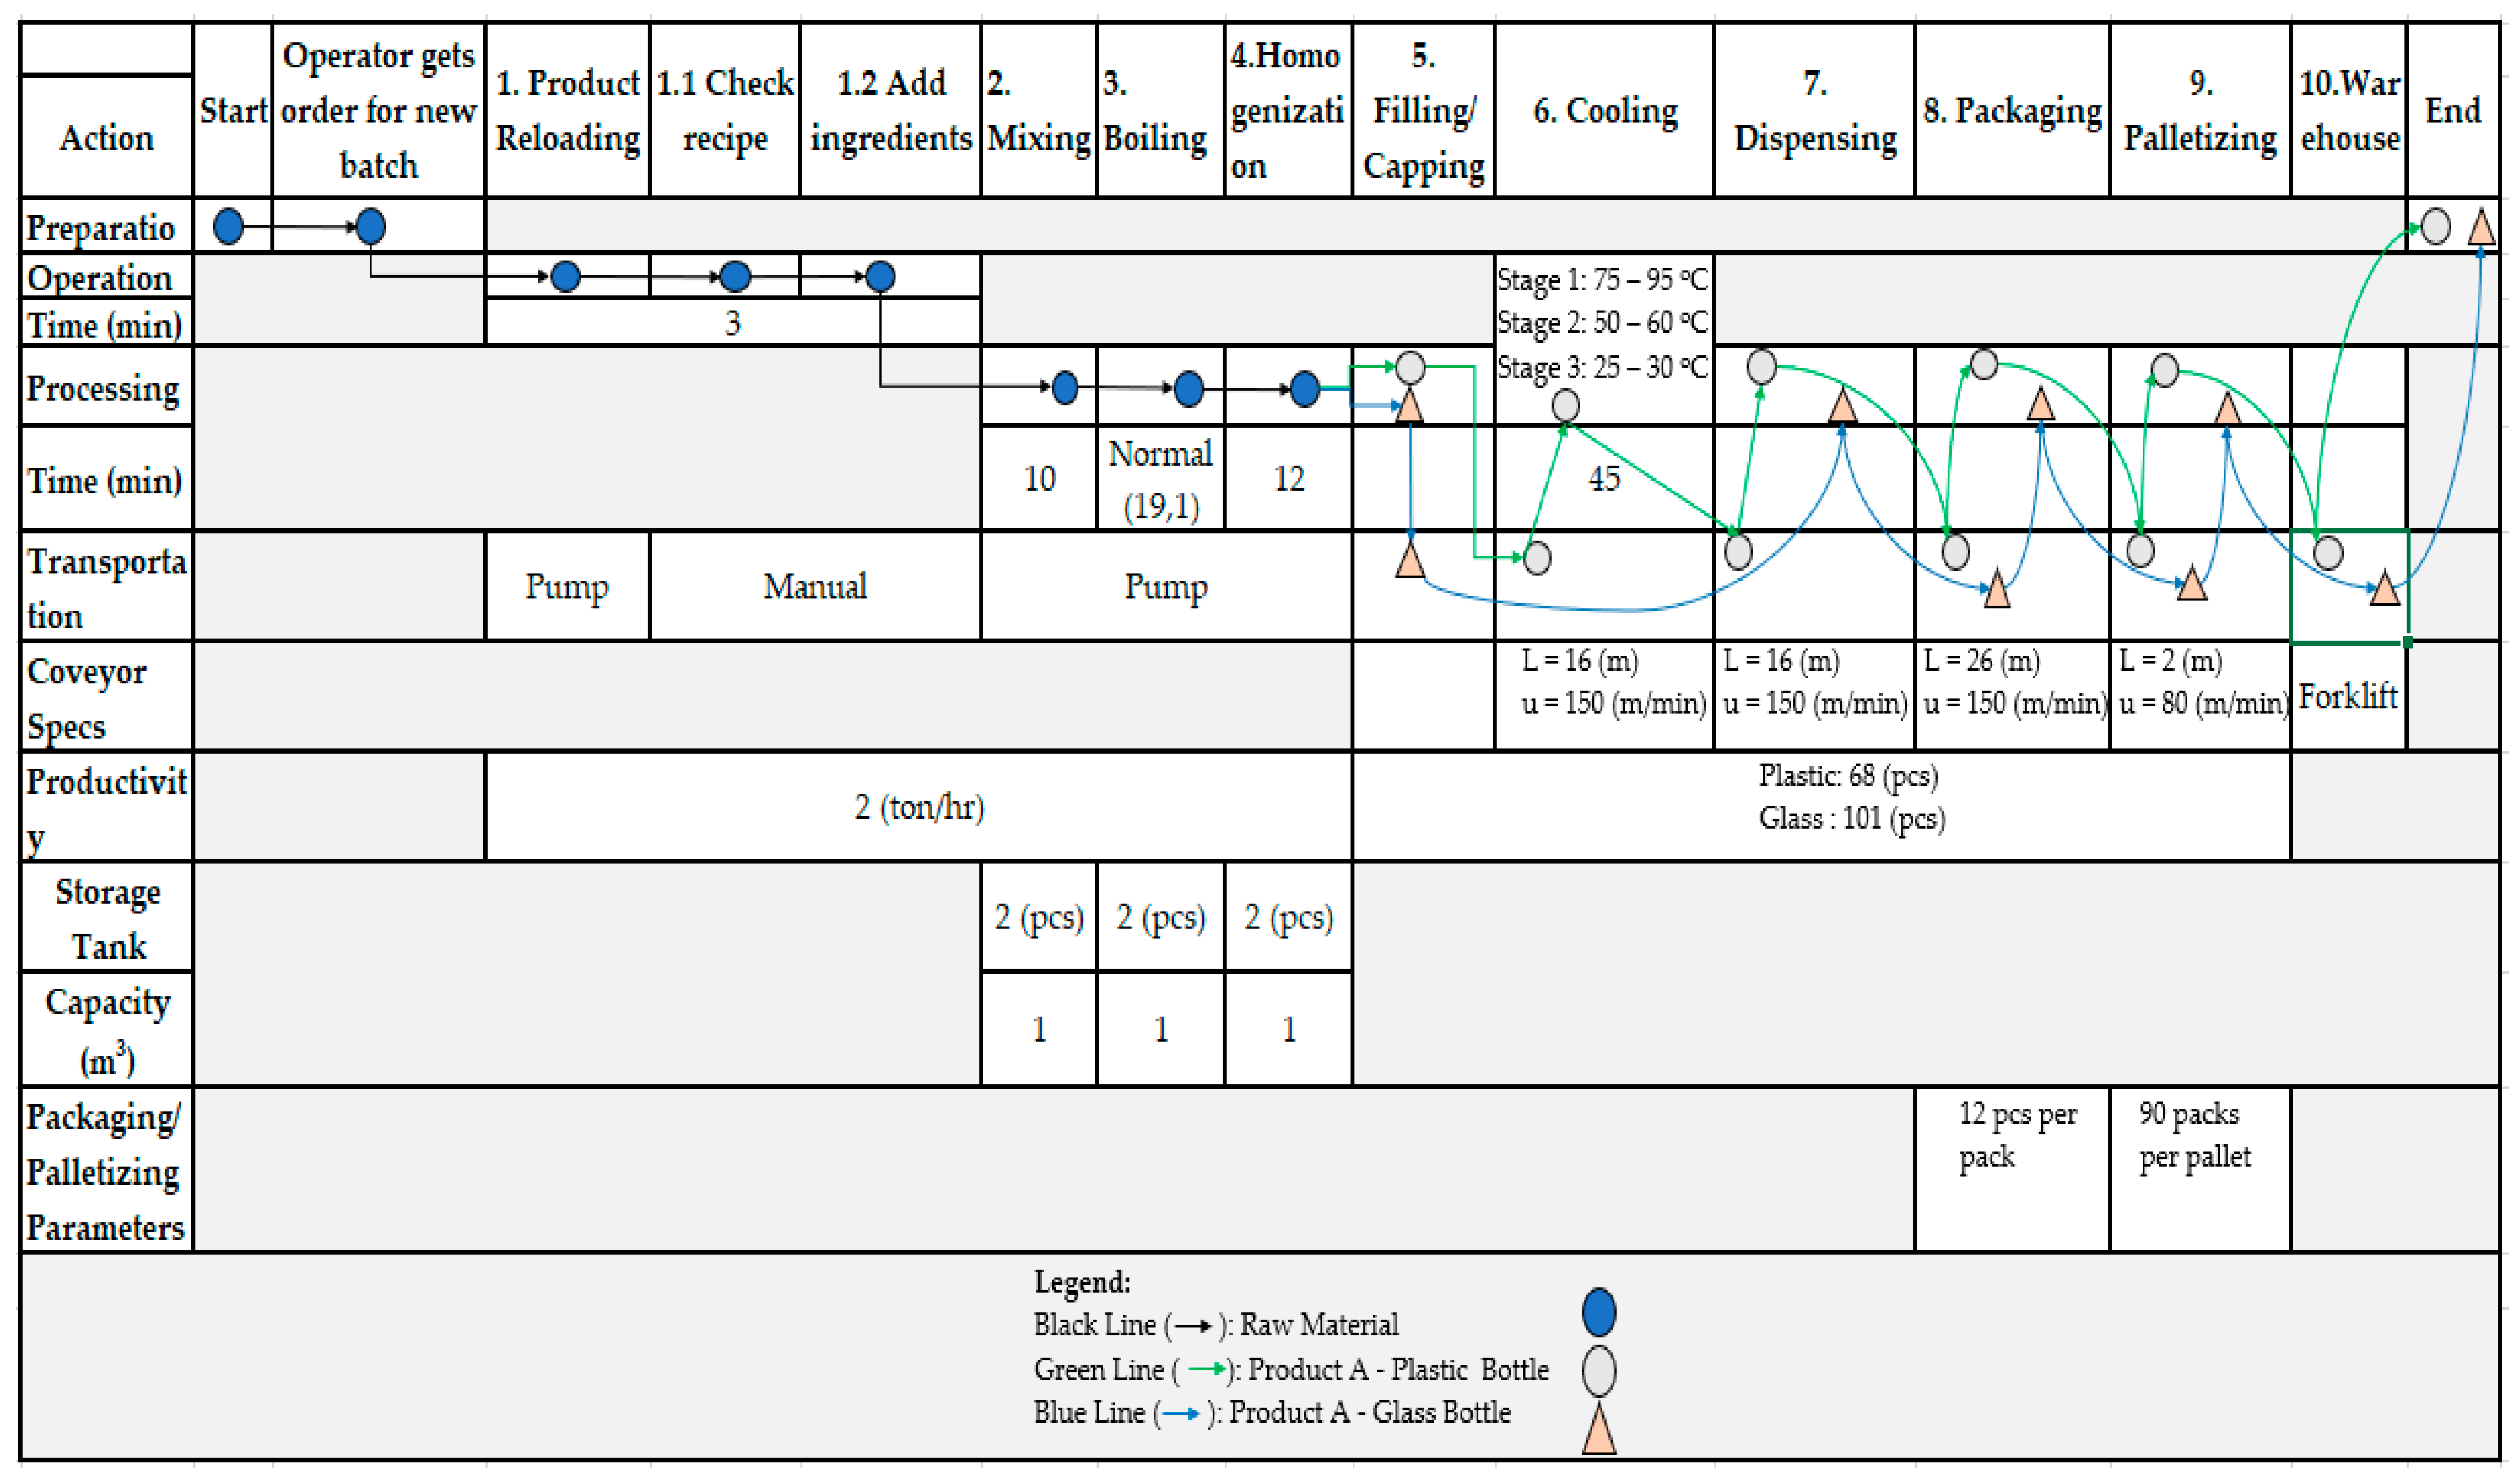
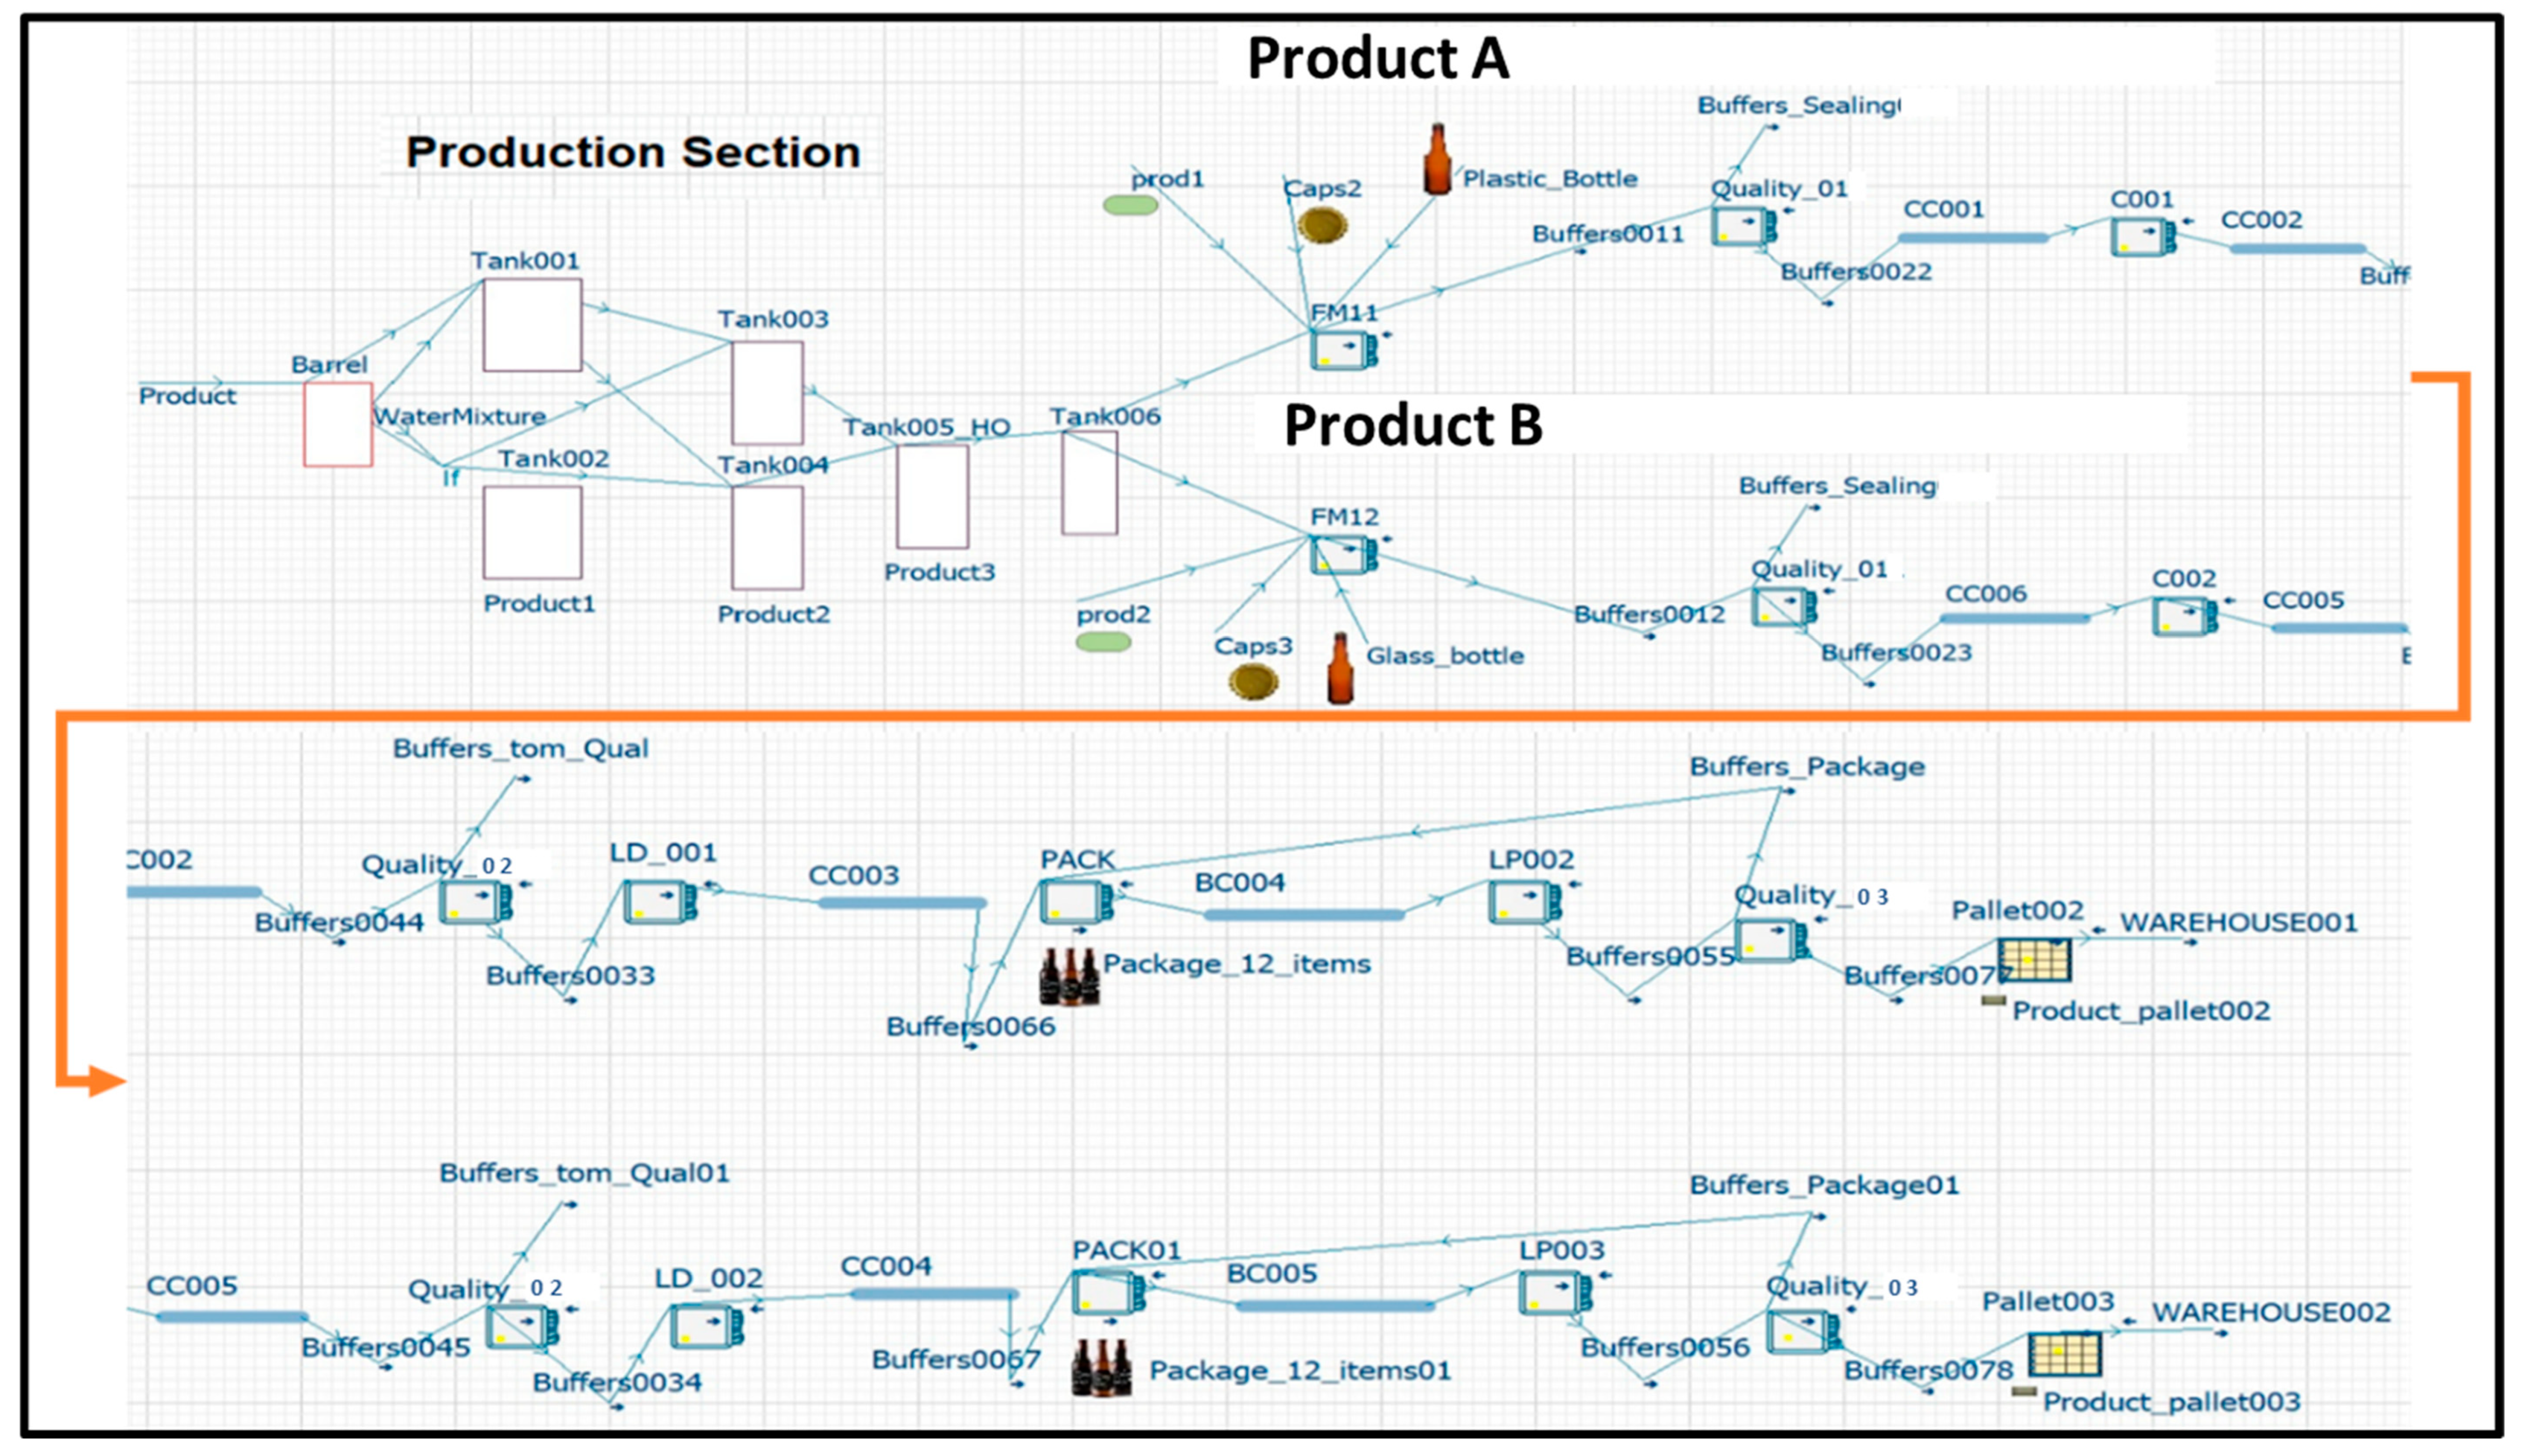
After the description of the current manufacturing system, the flowchart of the digital model is depicted in Figure 9, while the development is demonstrated in Figure 10. The flowchart includes two production lines, presented in Figure 7 with different colors; in particular, (i) the green line is the production line of Product A, and (ii) the blue line is the production line of Product B. Both production lines are connected to the same production department equipment (black line). In Figure 9, the most important information/details for the development of the digital model is presented: (i) the time required to complete a process, (ii) the number of storage tanks, (iii) the throughput of machines, (iv) the specification of conveyors, (v) packaging/palletizing parameters and (vi) flow process for each type of bottle. Moreover, the simulation tool used to model and simulate the production lines is a commercial software called Witness [70]. The digital model is developed for a continuous production rate and the maximum possible productivity of machines. In the case that the productivity is measured in given pieces per time, these should be transformed in the cycle time to be introduced into the digital model. Cycle time is the time required to perform a process. The formulas for the calculation of machines’ cycle time are presented in Equations (7) and (8) below:
Production   line   for   Product   A :   C y c l e   T i m e = 1 c a n · m i n 1 ( m i n ) 68 ( b o t t l e s ) 1 ( m i n ) = 1.47 × 10 2 ( min )
Production   line   for   Product   B :   C y c l e   T i m e = 1 c a n · m i n 1 ( m i n ) 101 ( b o t t l e s ) 1 ( m i n ) = 9.90 × 10 3 ( min )
There are three quality controls that check the bottle sealing, product quality and packaging quality. The abbreviations for each quality control are introduced below, (i) bottle sealing (Quality_01), (ii) product quality (Quality_02), and (iii) packaging quality (Quality_03).
Based on Figure 10, the mixing tanks are Tank001-2, the boiling tanks are Tank003-4, the homogenizer is Tank005_HO and the storage tank of the filling machine is Tank006. The abbreviation for filling machines is ‘FM’, cooler ‘C001’, chain conveyors ‘CC001-5’ and belt conveyors ‘BC004-5’; label dispenser is ‘LD001-2’, packaging machines are ‘PACK-01’ and layer palletizers are ‘LP002-3’. Furthermore, the quality control of bottle sealing, final product quality, and packaging quality. as a form of a pseudo-code for the acceptance or rejection of a bottle, are presented in Figure 11.

5.3. Design of Experiments Based on Taguchi Method

The implementation of the Taguchi method into the existing manufacturing system will be presented; the control factors that will be selected in the DOE analysis are the velocity of conveyors (Factor A), machines’ productivity (Factor B), and operators’ number (Factor C) in the palletizing process. The levels for each factor are described in Table 6. The implementation of DOE analysis was based only on Product A, because this is the most preferred product, according to the production managers.
The total number of experiments is calculated from Equation (9).
t o t a l   n u m b e r   o f   e x p . = p f = 2 3 = 8   e x p e r i m e n t s
The total number of experiments is eight but using Table 7, as mentioned in [68], the final number of experiments is four.
The final experiments are presented in Table 8 using three factors and two levels for each factor.
As shown in Table 8, the verification and validation of the digital model will be performed with the implementation of four experiments, as opposed to eight experiments.
The statistical Design of Experiments and the corresponding plots for the analysis of the results have been executed and produced using Matlab 2022b [72,73], which is integrated with the required libraries for performing such operations. More specifically, the steps followed are summarized below:
  • Definition of the experiment objectives, including the response variable and the potential influencing factors.
  • Selection of the appropriate experimental design (e.g., Full Factorial, Fractional Factorial, Response Surface) based on the number of factors, their levels, and the available resources.
  • Generation of the experimental design. This action generated a randomized plan of the experiments to be performed.
  • Execution of the experiments according to the plan and data collection regarding the response variable and the factor levels.
  • Data analysis using ANOVA.
  • Data interpretation, in order to identify the most influential factors and the optimal conditions for the production process.

6. Results and Discussion

6.1. Analysis of Experimental Data Based on Taguchi Approach

KPIs are selected to evaluate the performance of a case study and find any bottlenecks in the production line under investigation [74]. The selected KPIs for the validation of the digital model are presented in Table 9.
The results of the digital model are described in Table 10.
Table 10 verifies that the bottleneck is placed in the production section (mixing–boiling–homogenization process).
After conducting the experiments based on the proposed values of Table 8, the mean value of response ‘ y i ’ for each experiment is presented in Table 11.
Using the digital model developed in the previous section, the mean response value for each experiment is presented in Table 11. Based on Equation (2) and the responses in Table 11, the calculation of the SNR is described in Table 12.
After the calculation of the objective function SNR, the average SNR for each level of a specific factor is calculated, as depicted in Table 12. Moreover, at the end of Table 13, in the raw “Rank”, the importance of each factor can be recognized. This rank refers to the higher and the lower SNR resulting from each factor.
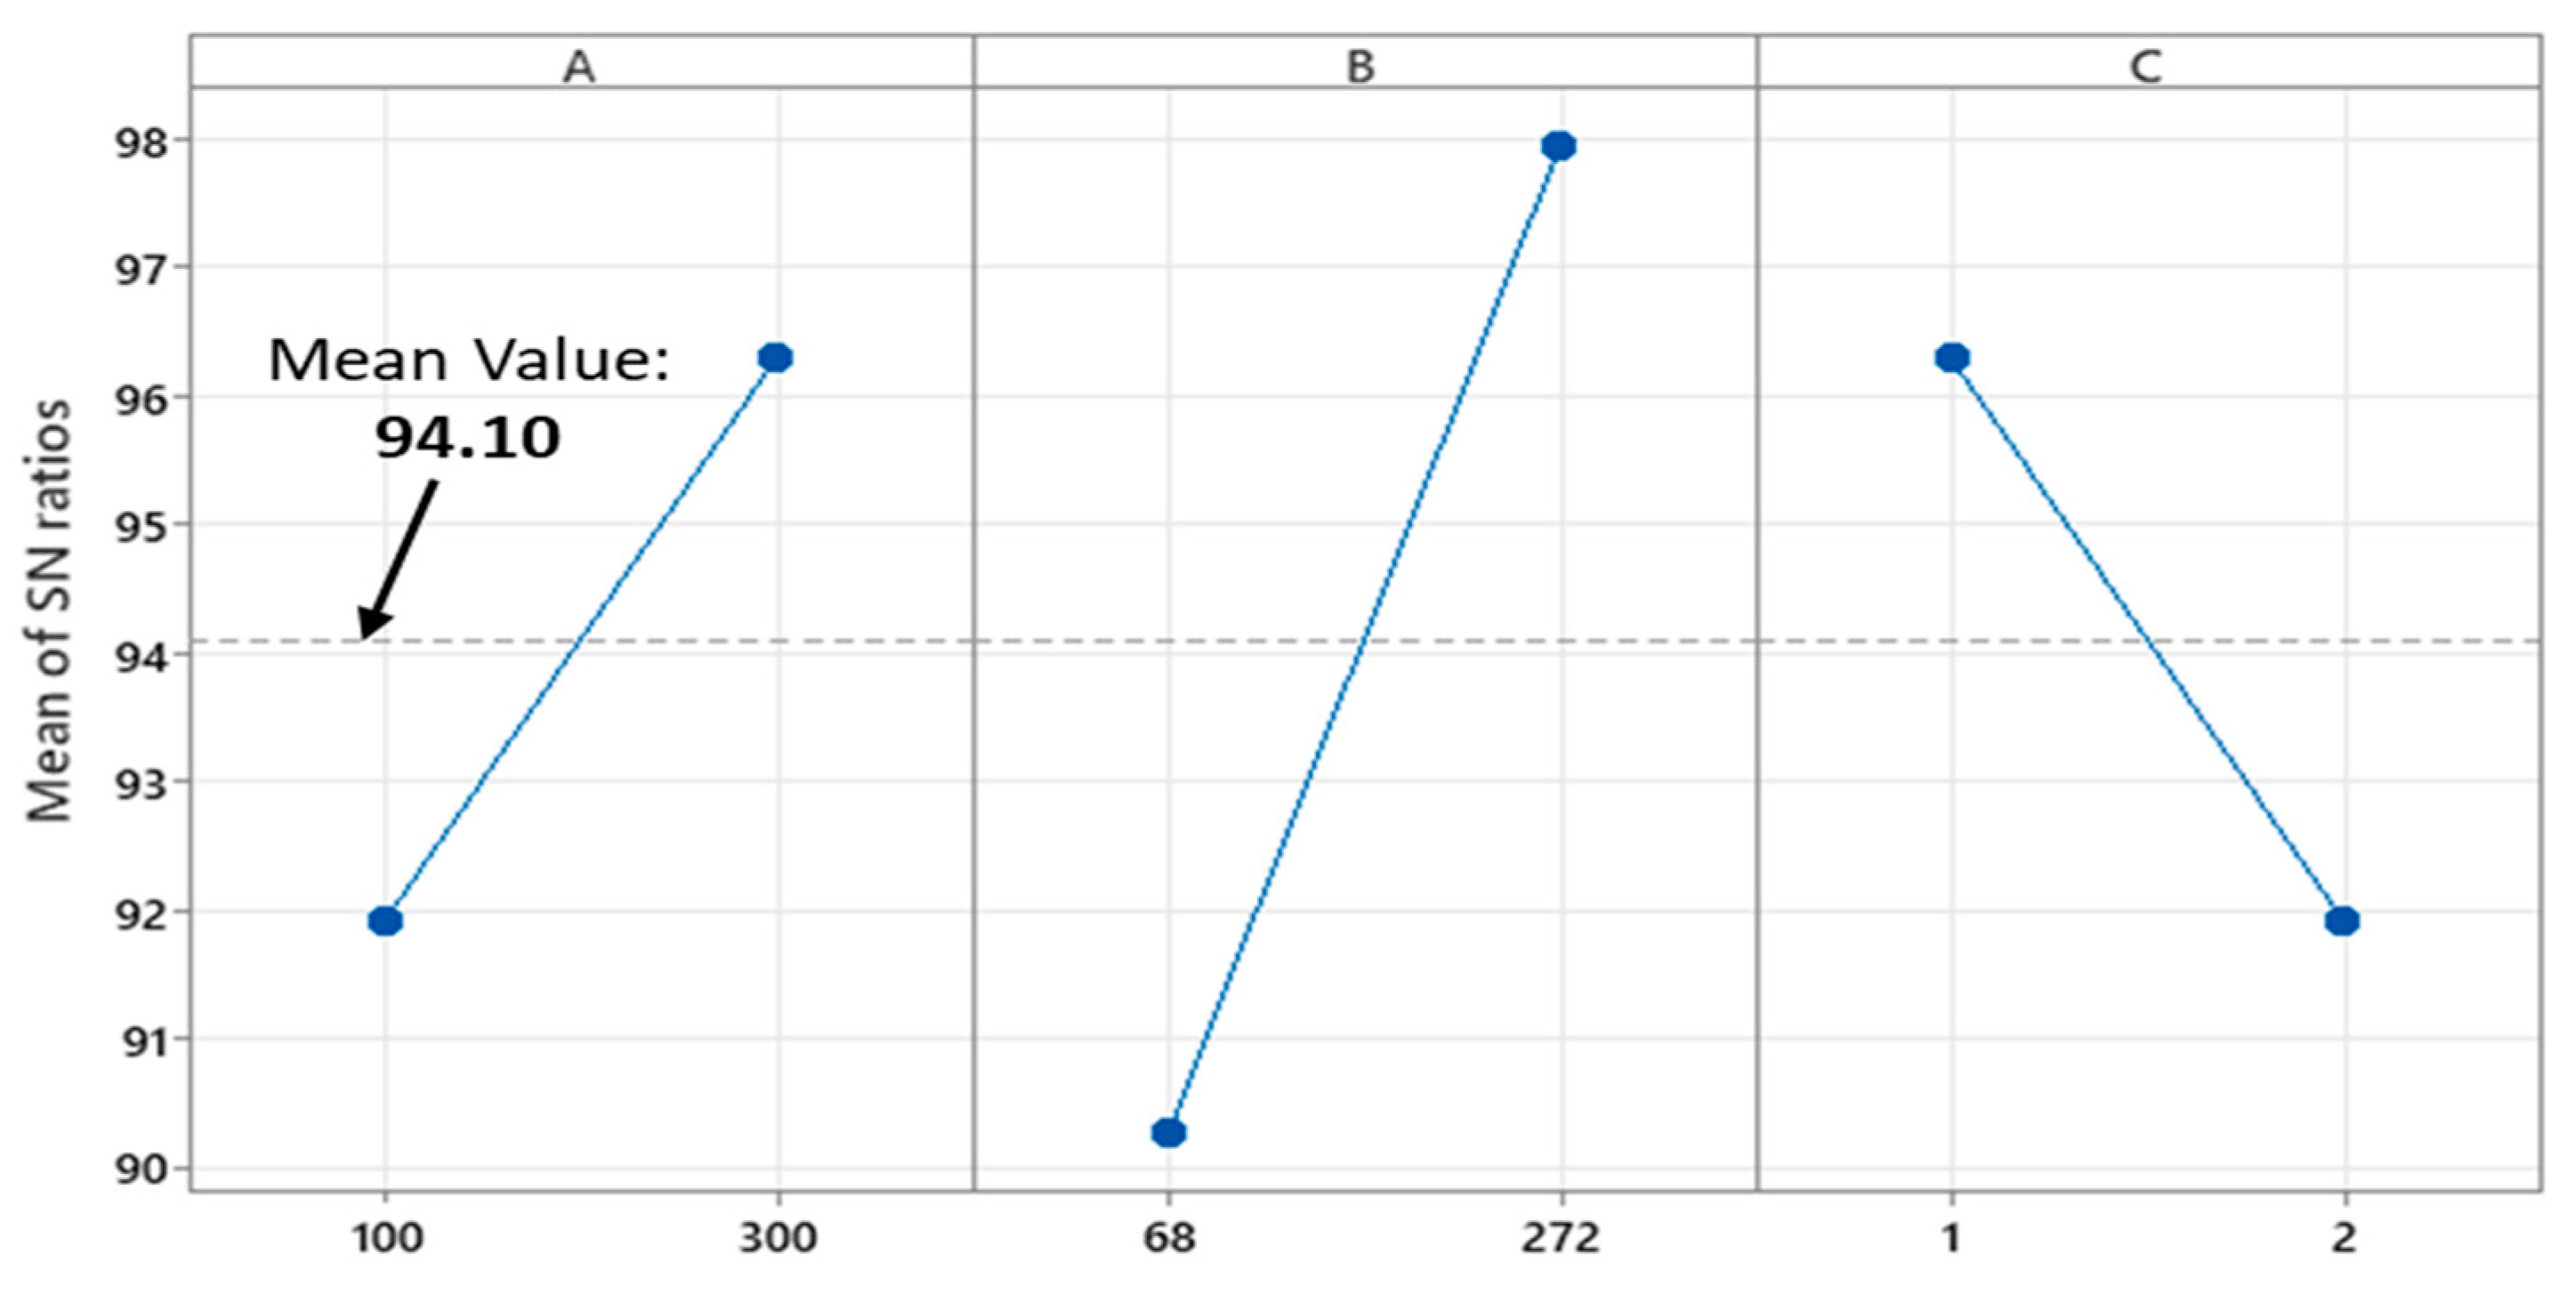
Table 13 presents the factor with the highest contribution to the performance of the production line, i.e., the “Machines’ Productivity”. The variation caused by each factor to the overall mean is presented in Figure 12.
In Figure 12, the dashed line is the overall mean of the analysis, with a value of 94.10; the deviation between each factor with the mean value is depicted. The last step is the ANOVA analysis, via which the contribution of each factor of the system will be calculated. Prior to calculating the contribution level of each factor, the values should be predetermined using Equations (3)–(6).
The factor that most affects the performance of the production line under investigation is the machine’s productivity, with a percentage of 48.20%, as described in Table 14. Therefore, the what-if scenarios will be presented in the next subsections, focusing on the production section, in order to increase the quantity of products produced, as well as the production rate of the machines. Furthermore, the contribution percentages of each control factor are depicted in Figure 13.

6.2. Proposed Solutions

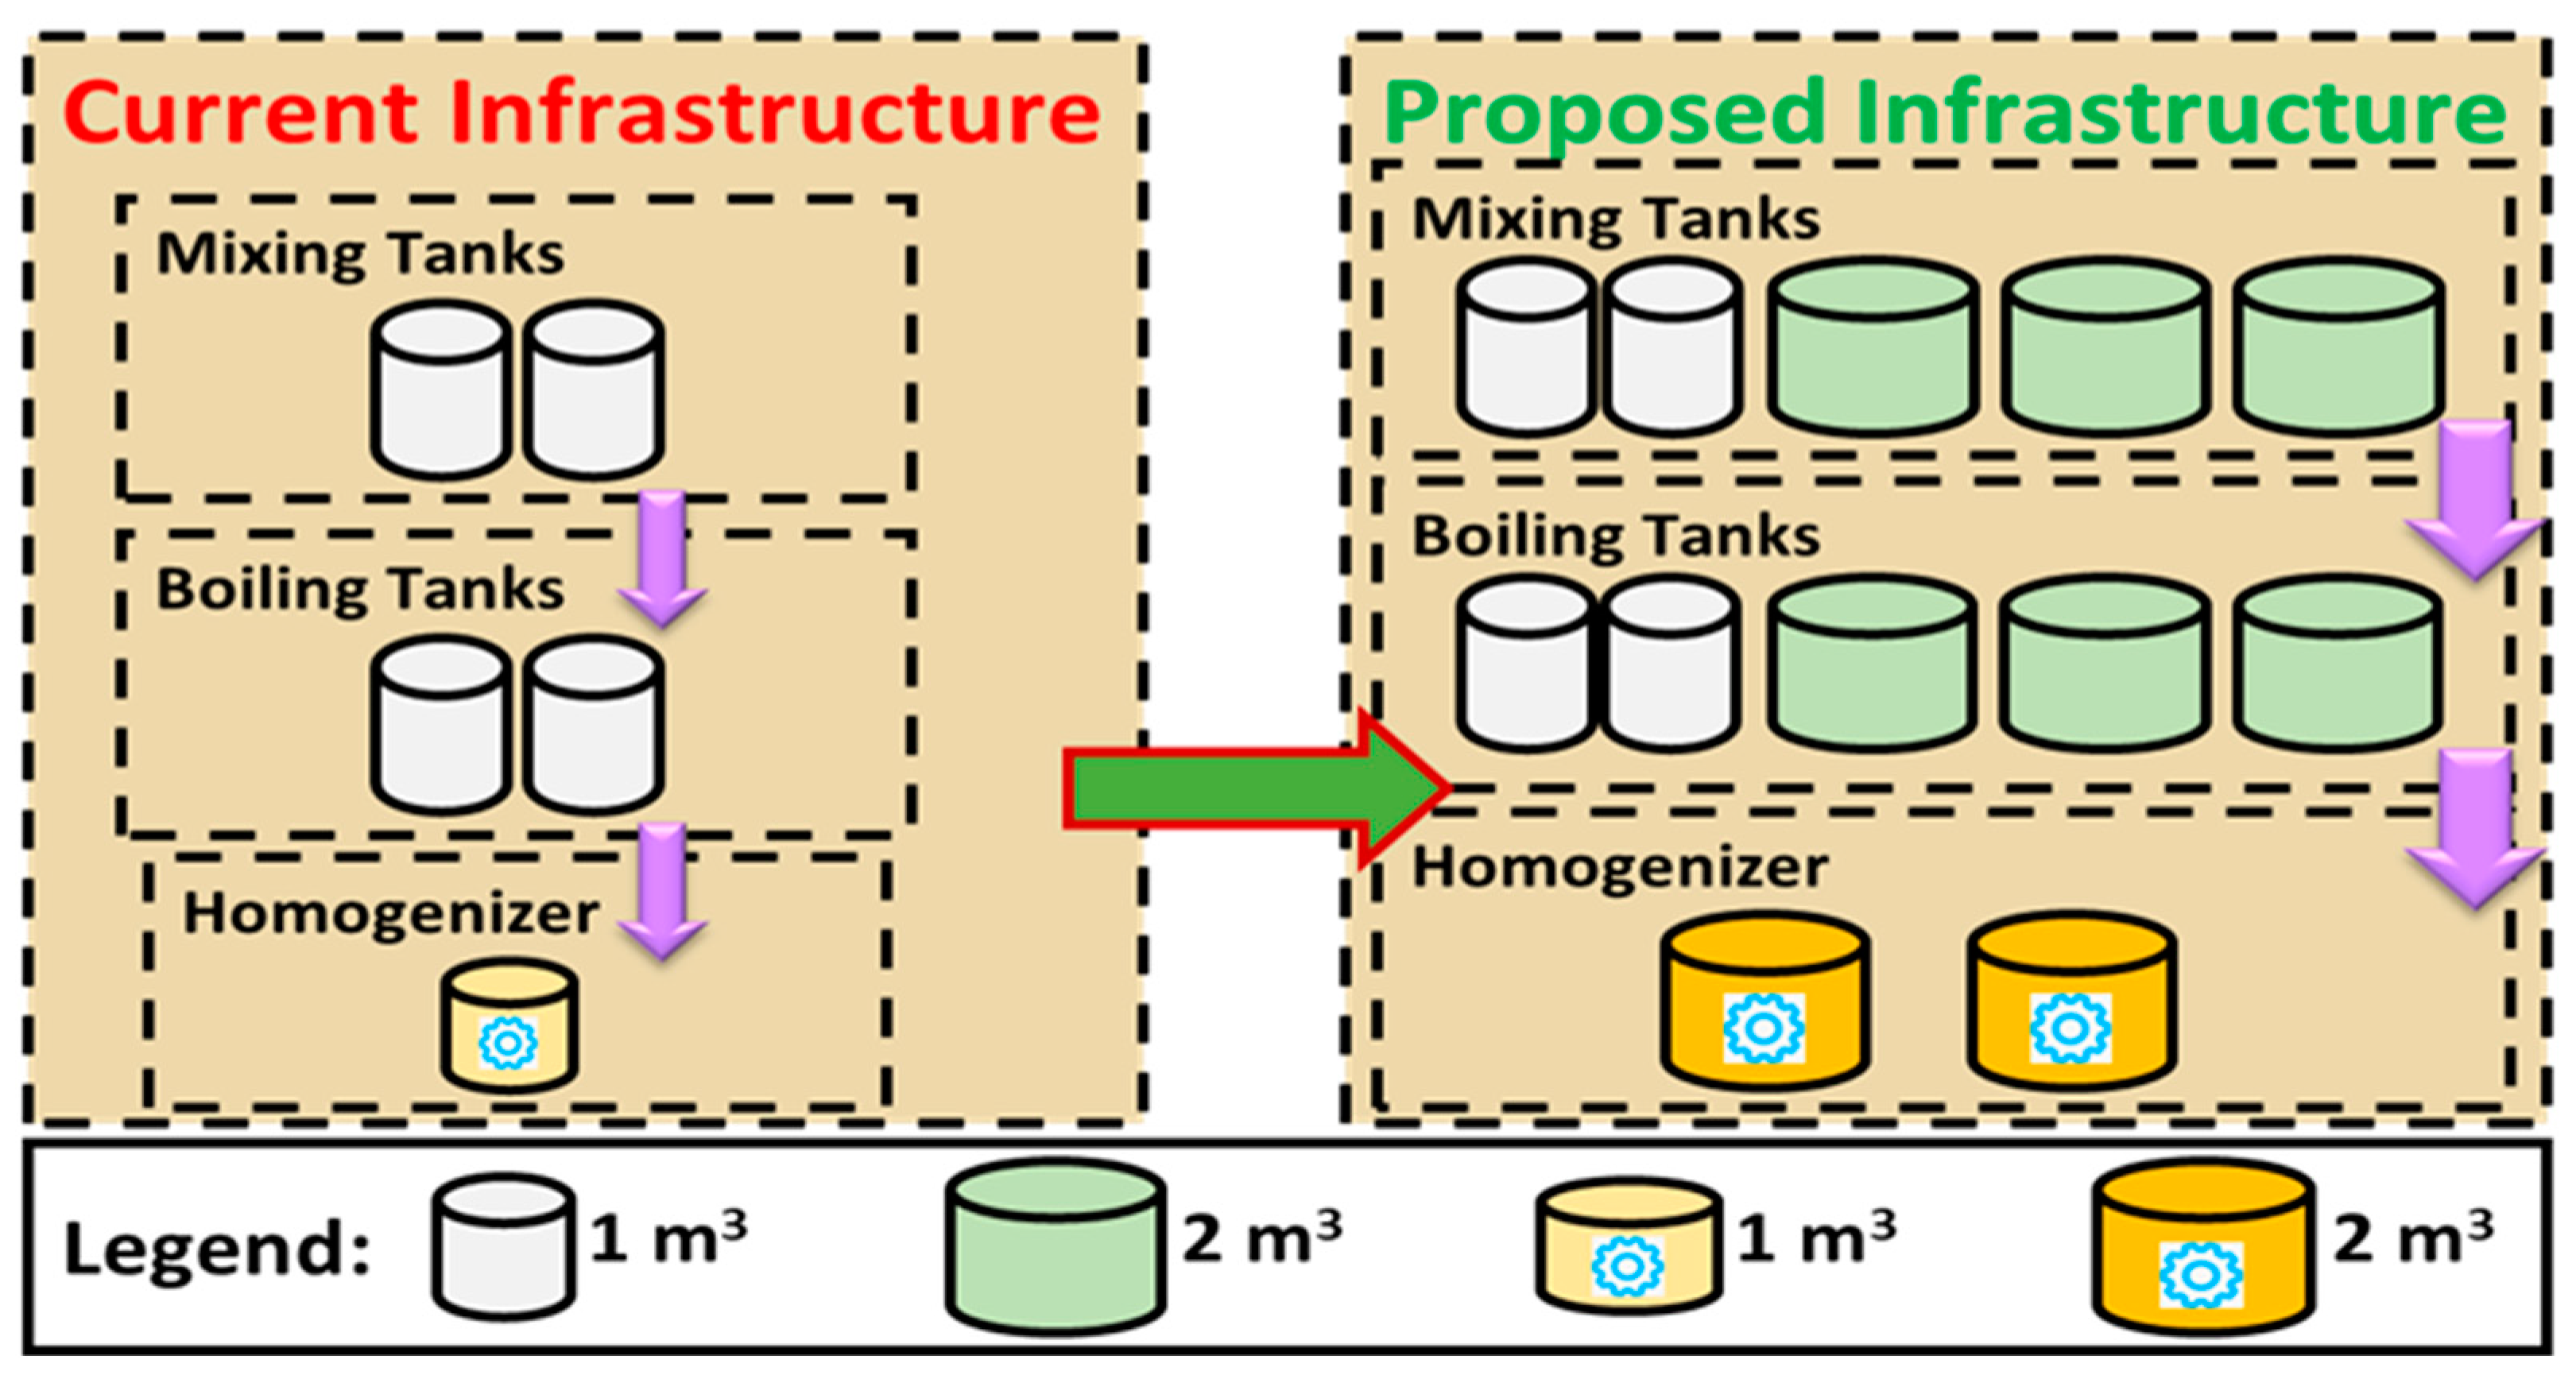
The proposed solutions for improving the efficiency of the current manufacturing system are based on the following parameters: (i) the production rate for the finished products, (ii) the variety of products, and (iii) machine utilization, which are presented below. However, as mentioned in the ANOVA analysis, the proposed what-if scenarios will focus on increasing the quantity of the final product processed in the production job shop, as well as increasing the production rate of the machines. The accepted solution should also follow these parameters: (i) flexibility, (ii) cost, (iii) profit, and (iv) market demand. In Figure 14, the production section layout is depicted.
Figure 14 presents the current, as well as the proposed, infrastructure of the production section, consisting of the mixing and boiling tanks along with the homogenizer. The proposed layout includes, in particular, the addition of six tanks, three for the mixing process and the remaining three for the boiling process. Tanks have a capacity of 2 m3 each. The homogenizer is replaced by two homogenizers with a capacity of two cubic meters 2 m3 per machine. The estimated cost for the proposed infrastructure amounts to 40,000 €. Moreover, the estimated throughput of the production section will reach 8 tons/h, in which this amount is addressed by 272 bottles per minute (272 pcs/min). This section refers to the presentation of the new flowchart according to the proposed layout and its implementation, as well as the analysis of the results based on the validated digital model. The updated flowchart for the new production line is shown in Figure 15.
The production lines can operate in parallel with different products by adding mixing, boiling tanks, and homogenizers as depicted in Figure 15. Hence, the production section of the PI is much more flexible than before, with low investment cost compared to measured profit, as presented below. Furthermore, the simulation results, after the implementation of the proposed equipment to the digital model, are shown in Table 15.
According to Table 15, the bottle productivity and maximum quantity of Product A per shift (480 min) are verified. An additional benefit provided by the productivity of eight tons per hour is that the improved manufacturing system has a variable production rate for every product produced. Moreover, based on Table 15, the company would achieve the following profit (profit from one bottle of Product A is 0.20 €) from the additional production.
  • Product A/Quantity 4 (ton/h): (8160 (pcs/h) − 4080 (pcs/h)) × 0.20 €) ≃ 820 (€/h) or in a week: 98,400 (€/week);
  • Product A/Quantity 6 (ton/h): (12,240 (pcs/h) − 4080 (pcs/h)) × 0.20 (€) ≃ 1600 (€/h) or in a week: 192,000 (€/week);
  • Product A/Quantity 8 (ton/h): (16,320 (pcs/h) − 4080 (pcs/h)) × 0.20 (€) ≃ 2400 (€/h) or in a week: 288,000 (€/week).

7. Concluding Remarks and Outlook

The concept of Digital Shadow is a promising technology that provides the user with valuable information regarding the operation of manufacturing systems, which can further facilitate the reduction of costs related to production, operation and maintenance operations. Moreover, with the integration of advanced simulation techniques, engineers are provided with tools for reducing decision-making time. In this research, the implementation of a Digital Shadow framework in the production line of a food manufacturer has been presented. The Digital Shadow model was used for monitoring the production line, collecting and analyzing datafor the prediction of future system states and possible malfunctions. With the proposed Digital Shadow model the design, operation, control, and performance of the production line can be further improved by running experimental scenarios. The implementation of the proposed Digital Shadow model lays the foundations for the complete digitalization of the industry and facilitates its conformity to Industry 4.0 standards. Specifically, sensors were installed for data acquisition and the corresponding communication protocols have been applied for efficient and continuous data transmission. The validation of the digital model was carried out using a DOE approach, where control factors and levels were selected to determine the required experiments. Four control factors were selected along with two levels for each factor; the verification/validation of the digital model was carried out in four instead of eight digital experiments. The ANOVA method was then followed to find the factor that most affects the performance of the production system; this was the machine’s productivity. Although this productivity can reach up to 300 pieces per minute, the machines operate at 68 pieces per minute. This is because a bottleneck occurs in the production section, in particular in the mixing, boiling, and homogenizing process. The digital model was used to evaluate the proposed scenario, which resulted in an increase in production capacity from two tons to eight tons per hour. The estimated investment cost is approximately 40,000 €, while the profit from the production of additional products is estimated at 288,000 € within one working week. Furthermore, the proposed production line layout contributed to the increase in production rate and product mix.
Future research work will focus on the finalization of the digitalization process for the company. Concretely, the evolution of the Digital Shadow model to a Digital Twin model will take place. In addition, the aim will be to improve the communication level between the digital object and the physical object, so that bidirectional communication can take place. Digital Twin architecture will be piloted in the filling machine and the model will expand to the entirety of the production line.

Author Contributions

Conceptualization, Project Acquisition, Supervision; writing—review and editing. D.M.; Software, writing—original draft preparation, writing—review and editing N.B. All authors have read and agreed to the published version of the manuscript.

Funding

This research received no external funding.

Institutional Review Board Statement

Not applicable.

Informed Consent Statement

Not applicable.

Data Availability Statement

Data sharing not applicable.

Conflicts of Interest

The authors declare no conflict of interest.

References

  1. Efthymiou, K.; Mourtzis, D.; Pagoropoulos, A.; Papakostas, N.; Chryssolouris, G. Manufacturing systems complexity analysis methods review. Int. J. Comput. Integr. Manuf. 2016, 29, 1025–1044. [Google Scholar] [CrossRef]
  2. Ghobakhloo, M. The future of manufacturing industry: A strategic roadmap toward Industry 4.0. J. Manuf. Technol. Manag. 2018, 29, 910–936. [Google Scholar] [CrossRef]
  3. Mourtzis, D. The Mass Personalization of Global Networks. In Design and Operation of Production Networks for Mass Personalization in the Era of Cloud Technology; Elsevier: Amsterdam, The Netherlands, 2022; pp. 79–116. [Google Scholar] [CrossRef]
  4. Bortolini, M.; Galizia, F.G.; Mora, C. Reconfigurable manufacturing systems: Literature review and research trend. J. Manuf. Syst. 2018, 49, 93–106. [Google Scholar] [CrossRef]
  5. Mourtzis, D. Simulation in the design and operation of manufacturing systems: State of the art and new trends. Int. J. Prod. Res. 2020, 58, 1927–1949. [Google Scholar] [CrossRef]
  6. Wang, Y.; Ma, H.S.; Yang, J.H.; Wang, K.S. Industry 4.0: A way from mass customization to mass personalization production. Adv. Manuf. 2017, 5, 311–320. [Google Scholar] [CrossRef]
  7. Mourtzis, D.; Angelopoulos, J.; Panopoulos, N. Personalized PSS Design Optimization Based on Digital Twin and Extended Reality. Procedia CIRP 2022, 109, 389–394. [Google Scholar] [CrossRef]
  8. Song, W.; Sakao, T. A customization-oriented framework for design of sustainable product/service system. J. Clean. Prod. 2017, 140, 1672–1685. [Google Scholar] [CrossRef]
  9. Whitepaper. Skill Development for Industry 4.0. Brics Skill Development Working Group. 2016. Available online: https://www.globalskillsummit.com/whitepaper-summary.pdf (accessed on 30 January 2023).
  10. The World Bank. Small and Medium Enterprises (SMEs) Finance; The World Bank: Washington, DC, USA, 2023. [Google Scholar]
  11. Benitez, B.G.; Ayala, F.N.; Frank, G.A. How can SMEs Participate Successfully in Industry 4.0 Ecosystems? In The Digital Supply Chain; Elsevier: Amsterdam, The Netherlands, 2022; pp. 325–342. [Google Scholar] [CrossRef]
  12. Ericson, Å.; Lugnet, J.; Solvang, W.D.; Kaartinen, H.; Wenngren, J. Challenges of Industry 4.0 in SME businesses. In Proceedings of the 2020 3rd International Symposium on Small-Scale Intelligent Manufacturing Systems (SIMS), IEEE, Gjovik, Norway, 10–12 June 2020; pp. 1–6. [Google Scholar] [CrossRef]
  13. Kusumawardhany, P.A.; Baihaqi, I.; Karningsih, P.D. Frugal Innovation in SMEs: Challenges and Opportunities of Doing More with Less Strategy. In Proceedings of the IEEE Technology & Engineering Management Conference-Asia Pacific (TEMSCON-ASPAC), Bangkok, Thailand, 19–22 September 2022; pp. 48–53. [Google Scholar] [CrossRef]
  14. Huang, S.; Wang, B.; Li, X.; Zheng, P.; Mourtzis, D.; Wang, L. Industry 5.0 and Society 5.0—Comparison, complementation and co-evolution. J. Manuf. Syst. 2022, 64, 424–428. [Google Scholar] [CrossRef]
  15. Mourtzis, D.; Angelopoulos, J.; Panopoulos, N. A Literature Review of the Challenges and Opportunities of the Transition from Industry 4.0 to Society 5.0. Energies 2022, 15, 6276. [Google Scholar] [CrossRef]
  16. Leng, J.; Sha, W.; Wang, B.; Zheng, P.; Zhuang, C.; Liu, Q.; Wuest, T.; Mourtzis, D.; Wang, L. Industry 5.0: Prospect and retrospect. J. Manuf. Syst. 2022, 65, 279–295. [Google Scholar] [CrossRef]
  17. Roche, R. The Nine Pillars of Industry 4.0-Transforming Industrial Production. 2020. Available online: https://circuitdigest.com/article/what-is-industry-4-and-its-nine-technology-pillars (accessed on 19 April 2023).
  18. Saptaningtyas, W.W.E.; Rahayu, D.K. A Proposed Model for Food Manufacturing in SMEs: Facing Industry 5.0. In Proceedings of the 5th NA International Conference on Industrial Engineering and Operations Management, Detroit, MI, USA, 10–14 August 2020; pp. 10–12. [Google Scholar]
  19. Török, Á.; Tóth, J.; Balogh, J.M. Push or Pull? The nature of innovation process in the Hungarian food SMEs. J. Innov. Knowl. 2019, 4, 234–239. [Google Scholar] [CrossRef]
  20. European Commission. The Impact of Private R&D on the Performance of Food-Processing Firms; JRC Technical Reports; Joint Research Centre: Sevilla, Spain, 2018. [Google Scholar]
  21. Statista, Retail & Trade, Food & Beverage. Research and Development Expenditure in Food, Beverages and Tobacco Product Businesses in the United Kingdom (UK) from 2002 to 2020. Available online: https://www.statista.com/statistics (accessed on 30 January 2023).
  22. World Data Bank, Food, Beverages and Tobacco (% of Value Added in Manufacturing)—United Kingdom, Japan, Germany, Hungary, Italy. Available online: https://data.worldbank.org (accessed on 30 January 2023).
  23. Nikolaidis, A. Greece and the Industry 4.0 Intelligent Automations, Sector of Industry, Development, Networks & Regional Policy, SEV. Available online: https://en.sev.org.gr (accessed on 30 January 2023).
  24. Stavropoulos, P.; Mourtzis, D. Digital Twins in industry 4.0. In Design and Operation of Production Networks for Mass Personalization in the Era of Cloud Technology; Elsevier: Amsterdam, The Netherlands, 2022; pp. 277–316. [Google Scholar] [CrossRef]
  25. Segovia, M.; Garcia-Alfaro, J. Design, modeling and implementation of digital twins. Sensors 2022, 22, 5396. [Google Scholar] [CrossRef]
  26. Singh, M.; Fuenmayor, E.; Hinchy, E.P.; Qiao, Y.; Murray, N.; Devine, D. Digital twin: Origin to future. Appl. Syst. Innov. 2021, 4, 36. [Google Scholar] [CrossRef]
  27. Riesener, M.; Schuh, G.; Dölle, C.; Tönnes, C. The digital shadow as enabler for data analytics in product life cycle management. Procedia CIRP 2019, 80, 729–734. [Google Scholar] [CrossRef]
  28. Kritzinger, W.; Karner, M.; Traar, G.; Henjes, J.; Sihn, W. Digital Twin in manufacturing: A categorical literature review and classification. IFAC-PapersOnLine 2018, 51, 1016–1022. [Google Scholar] [CrossRef]
  29. Bauernhansl, T.; Hartleif, S.; Felix, T. The Digital Shadow of production–A concept for the effective and efficient information supply in dynamic industrial environments. Procedia CIRP 2018, 72, 69–74. [Google Scholar] [CrossRef]
  30. Sapel, P.; Gannouni, A.; Fulterer, J.; Hopmann, C.; Schmitz, M.; Lütticke, D.; Gützlaff, A.; Schuh, G. Towards Digital Shadows for production planning and control in injection molding. CIRP J. Manuf. Sci. Technol. 2022, 38, 243–251. [Google Scholar] [CrossRef]
  31. Schuh, G.; Anderl, R.; Gausemeier, J.; Hompel, M.; Wahlster, W. (Eds.) Industrie 4.0 Maturity Index: Managing the Digital Transformation of Companies; Herbert Utz Verlag GmbH: Munich, Germany, 2017. [Google Scholar]
  32. Khan, W.Z.; Ahmed, E.; Hakak, S.; Yaqoob, I.; Ahmed, A. Edge computing: A survey. Future Gener. Comput. Syst. 2019, 97, 219–235. [Google Scholar] [CrossRef]
  33. Hassan, N.; Gillani, S.; Ahmed, E.; Yaqoob, I.; Imran, M. The role of edge computing in internet of things. IEEE Commun. Mag. 2018, 56, 110–115. [Google Scholar] [CrossRef]
  34. Van Eck, N.; Waltman, L. Software survey: VOSviewer, A computer program for bibliometric mapping. Scientometrics 2010, 84, 523–538. [Google Scholar] [CrossRef]
  35. Brecher, C.; Dalibor, M.; Rumpe, B.; Schilling, K.; Wortmann, A. An ecosystem for Digital Shadows in manufacturing. Procedia CIRP 2021, 104, 833–838. [Google Scholar] [CrossRef]
  36. Ehrhardt, J.M.; Hoffmann, C.T. The Digital Shadow: Developing a universal model for the automated optimization of cyber-physical production systems based on real-time data. Procedia CIRP 2020, 93, 304–310. [Google Scholar] [CrossRef]
  37. Schuh, G.; Jussen, P.; Harland, T. The Digital Shadow of services: A reference model for comprehensive data collection in MRO services of machine manufacturers. Procedia CIRP 2018, 73, 271–277. [Google Scholar] [CrossRef]
  38. Ladj, A.; Wang, Z.; Meski, O.; Belkadi, F.; Ritou, M.; Da Cunha, C. A knowledge-based Digital Shadow for machining industry in a Digital Twin perspective. J. Manuf. Syst. 2021, 58, 168–179. [Google Scholar] [CrossRef]
  39. Santolamazza, A.; Groth, C.; Introna, V.; Porziani, S.; Scarpitta, F.; Urso, G.; Valentini, P.P.; Costa, E.; Ferrante, E.; Sorrentino, S.; et al. A Digital Shadow cloud-based application to enhance quality control in manufacturing. IFAC-PapersOnLine 2020, 53, 10579–10584. [Google Scholar] [CrossRef]
  40. Kannapinn, M.; Pham, M.K.; Schäfer, M. Physics-based Digital Twins for autonomous thermal food processing: Efficient, non-intrusive reduced-order modeling. Innov. Food Sci. Emerg. Technol. 2022, 81, 103143. [Google Scholar] [CrossRef]
  41. Ariesen-Verschuur, N.; Verdouw, C.; Tekinerdogan, B. Digital Twins in greenhouse horticulture: A review. Comput. Electron. Agric. 2022, 199, 107183. [Google Scholar] [CrossRef]
  42. Purcell, W.; Neubauer, T. Digital Twins in Agriculture: A State-of-the-art review. Smart Agric. Technol. 2022, 3, 100094. [Google Scholar] [CrossRef]
  43. Melesse, T.Y.; Bollo, M.; Di Pasquale, V.; Centro, F.; Riemma, S. Machine Learning-Based Digital Twin for Monitoring Fruit Quality Evolution. Procedia Comput. Sci. 2022, 200, 13–20. [Google Scholar] [CrossRef]
  44. Brecher, C.; Buchsbaum, M.; Storms, S. Control from the cloud: Edge computing, services and digital shadow for automation technologies. In Proceedings of the 2019 International Conference on Robotics and Automation (ICRA), Montreal, QC, Canada, 20–24 May 2019; pp. 9327–9333. [Google Scholar] [CrossRef]
  45. Do-Duy, T.; Van Huynh, D.; Dobre, O.A.; Canberk, B.; Duong, T.Q. Digital twin-aided intelligent offloading with edge selection in mobile edge computing. IEEE Wirel. Commun. Lett. 2022, 11, 806–810. [Google Scholar] [CrossRef]
  46. Alonso, R.S.; Sittón-Candanedo, I.; García, Ó.; Prieto, J.; Rodríguez-González, S. An intelligent Edge-IoT platform for monitoring livestock and crops in a dairy farming scenario. Ad. Hoc. Netw. 2020, 98, 102047. [Google Scholar] [CrossRef]
  47. Mourtzis, D.; Angelopoulos, J.; Panopoulos, N. Design and Development of an Edge-Computing Platform Towards 5G Technology Adoption for Improving Equipment Predictive Maintenance. Procedia Comput. Sci. 2022, 200, 611–619. [Google Scholar] [CrossRef]
  48. Mourtzis, D.; Angelopoulos, J.; Panopoulos, N. Robust engineering for the design of resilient manufacturing systems. Appl. Sci. 2021, 11, 3067. [Google Scholar] [CrossRef]
  49. Guerra-Zubiaga, D.A.; Mamun, A.A.; Gonzalez-Badillo, G. An energy consumption approach in a manufacturing process using design of experiments. Int. J. Comput. Integr. Manuf. 2018, 31, 1067–1077. [Google Scholar] [CrossRef]
  50. Li, D.; Li, Y.; Asadizadeh, M.; Masoumi, H.; Hagan, P.C.; Saydam, S. Assessing the mechanical performance of different cable bolts based on design of experiments techniques and analysis of variance. Int. J. Rock Mech. Min. Sci. 2020, 130, 104307. [Google Scholar] [CrossRef]
  51. Pantazis, D.; Pease, S.G.; Goodall, P.; West, A.; Conway, P. A design of experiments Cyber–Physical System for energy modelling and optimisation in end-milling machining. Robot. Comput. Integr. Manuf. 2023, 80, 102469. [Google Scholar] [CrossRef]
  52. ElMaraghy, H.; Monostori, L.; Schuh, G.; ElMaraghy, W. Evolution and future of manufacturing systems. CIRP Ann. 2021, 70, 635–658. [Google Scholar] [CrossRef]
  53. Singh, A.; Singh, J.; Ali, M. A Simulation Study for Investigation of Routing Flexibility on Performance in Flexible Manufacturing System Environment. Indian J. Sci. Technol. 2018, 11, 30. [Google Scholar] [CrossRef]
  54. Professor Pan’s Research Group. Modeling and Simulation of Food Processing Technologies. Available online: https://research.engineering.ucdavis.edu (accessed on 30 January 2023).
  55. Bosman, A. Modelling and Simulation of Food Processes. Campden BRI. Available online: https://www.campdenbri.co.uk (accessed on 30 January 2023).
  56. Penazzi, S.; Accorsi, R.; Ferrari, E.; Manzini, R.; Dunstall, S. Design and control of food job-shop processing systems: A simulation analysis in the catering industry. Int. J. Logist. Manag. 2017, 28, 782–797. [Google Scholar] [CrossRef]
  57. Psarommatis, F.; May, G.; Kiritsis, D. Predictive maintenance key control parameters for achieving efficient Zero Defect Manufacturing. Procedia CIRP 2021, 104, 80–84. [Google Scholar] [CrossRef]
  58. Chakrapani, P.; Suryakumari, T.S.A. Modelling and analysing the water jet machining parameters of aluminium nano composite by ANOVA and Taguchi. Mater. Today Proc. 2021, 47, 370–375. [Google Scholar] [CrossRef]
  59. Kumar, D.; Murthy, K.; Kore, S.D.; Nandy, A. Effect of thread angle besides other process parameters in electromagnetically crimped threaded surfaced tube-to-tube joint: FEM modelling and ANOVA analysis. Mater. Today Proc. 2023. [Google Scholar] [CrossRef]
  60. Azadar, M. Optimize the Turning Parameter Using Taguchi Methodology. Int. J. Sci. Res. Sci. Technol. 2022, 9, 278–285. [Google Scholar] [CrossRef]
  61. Pagone, E.; Haddad, Y.; Barsotti, L.; Dini, G.; Salonitis, K. A stochastic evaluation framework to improve the robustness of manufacturing systems. Int. J. Comput. Integr. Manuf. 2023, 1–19. [Google Scholar] [CrossRef]
  62. Entezaminia, A.; Gharbi, A.; Ouhimmou, M. A joint production and carbon trading policy for unreliable manufacturing systems under cap-and-trade regulation. J. Clean. Prod. 2021, 293, 125973. [Google Scholar] [CrossRef]
  63. Udroiu, R.; Braga, I.C.; Nedelcu, A. Evaluating the quality surface performance of additive manufacturing systems: Methodology and a material jetting case study. Materials 2019, 12, 995. [Google Scholar] [CrossRef] [PubMed]
  64. Steinberg, D.M. 7 Robust design: Experiments for improving quality. In Handbook of Statistics; Elsevier: Amsterdam, The Netherlands, 1996; Volume 13, pp. 199–240. [Google Scholar] [CrossRef]
  65. Tomy, L.; Chesneau, C.; Madhav, A.K. Statistical Techniques for Environmental Sciences: A Review. Math. Comput. Appl. 2021, 26, 74. [Google Scholar] [CrossRef]
  66. Taguchi, G. Off-Line and On-Line Quality Control Systems. In Proceedings of the International Conference on Quality Control, Tokyo, Japan, 20–24 October 1978; Volume 4, pp. 1–5. [Google Scholar] [CrossRef]
  67. Taguchi, G.; Shih-Chung, T. Introduction to Quality Engineering: Bringing Quality Engineering Upstream; American Society of Mechanical Engineering: New York, NY, USA, 1992. [Google Scholar]
  68. Byrne, D.M.; Taguchi, S. The Taguchi approach to parameter design. Qual. Prog. 1987, 20, 19–26. [Google Scholar]
  69. Phadke, M.S. Quality engineering using robust design. Technometrics 2012, 33, 235–236. [Google Scholar] [CrossRef]
  70. Witness Lanner. Available online: https://www.lanner.com/en-us/technology/witness-simulation-software.html (accessed on 11 April 2023).
  71. Montgomery, D.C. Design and Analysis of Experiments; John Wiley & Sons: Hoboken, NJ, USA, 2017. [Google Scholar]
  72. Mathworks, Help Center, ANOVA. Available online: https://www.mathworks.com/help/stats/anova.html (accessed on 11 April 2023).
  73. Mathworks, Help Center, Design of Experiments. Available online: https://www.mathworks.com/help/stats/design-of-experiments-1.html (accessed on 11 April 2023).
  74. D’Orazio, L.; Schirald, M.M.; Varisco, M. KPIs in Operations Management: Extending the ISO22400 Standard Scope. In Proceedings of the Industrial Systems Engineering Conference, Palermo, Italy, 12–14 September 2018. [Google Scholar]
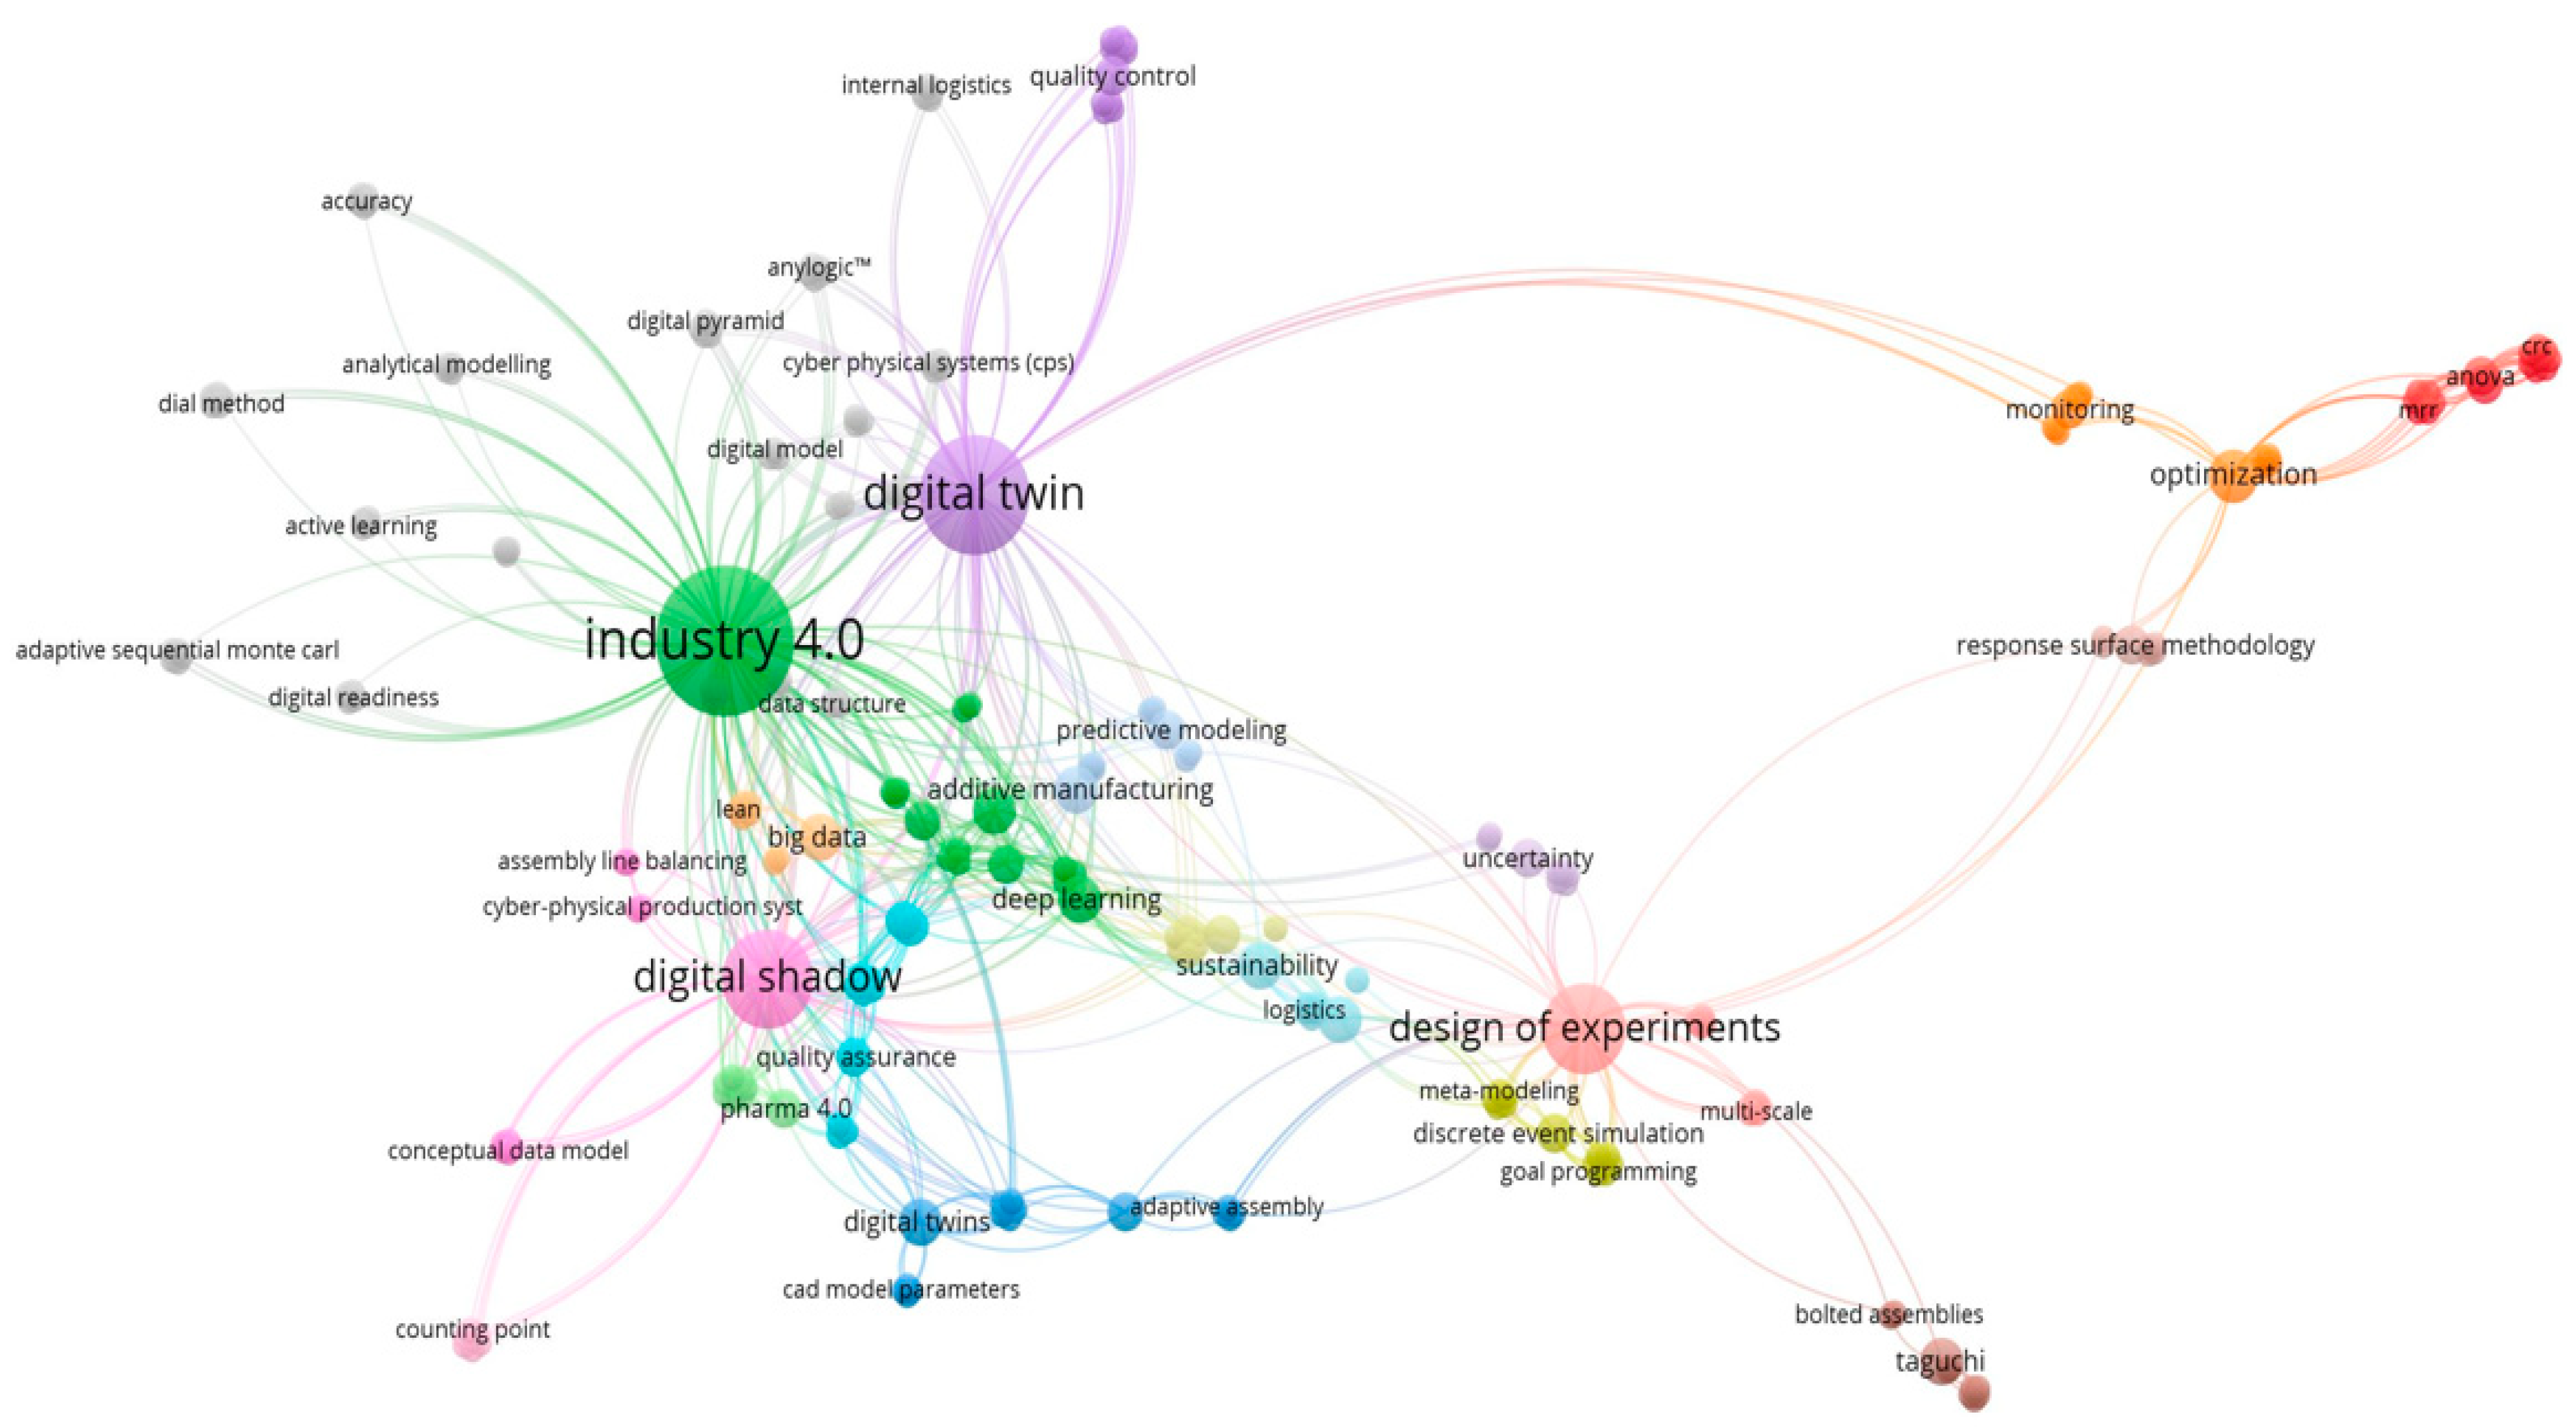
Figure 1. Network Visualization of Literacy Topic Area.
Applsci 13 05184 g001
Figure 2. Density Visualization of the Scientific Literacy Topic Areas.
Applsci 13 05184 g002
Figure 3. From left to right: Digital Model; Digital Shadow; Digital Twin, adapted from [24].
Applsci 13 05184 g003
Figure 4. The Proposed Digital Shadow framework.
Applsci 13 05184 g004
Figure 5. Cause-causality diagram for bottleneck parallelization to control factors.
Applsci 13 05184 g005
Figure 6. Workflow of the Proposed Methodology.
Applsci 13 05184 g006
Figure 7. (left) DOE flowchart; (right) DOE pseudocode.
Applsci 13 05184 g007
Figure 8. Flowchart of the Process Industry Production Line Under Investigation.
Applsci 13 05184 g008
Figure 9. Flow Process Chart of the Production Line.
Applsci 13 05184 g009
Figure 10. Digital Model of the Production Line in the WITNESS simulation environment.
Applsci 13 05184 g010
Figure 11. (a). Quality Control#01; (b). Quality Control#02 and (c). Quality Control#03 as a Pseudo-code.
Applsci 13 05184 g011
Figure 12. Main Effects Plot for SN ratios (A) Conveyor Velocity, (B) Machine’s Productivity, (C) Operator Number.
Applsci 13 05184 g012
Figure 13. Contribution Analysis per Factor, based on ANOVA.
Applsci 13 05184 g013
Figure 14. Production Section Layout.
Applsci 13 05184 g014
Figure 15. Proposed Layout of the Process Industry Production Line.
Applsci 13 05184 g015
Table 1. Clusters as Constructed by VOSviewer Software.
Cluster 1Cluster 2Cluster 3
Digital TwinAssembly line balancingBolted assemblies
“as built” designConceptual data modelCloud computing
Design for zero-defect manufacturingCyber-physical modelEdge computing
Intelligent manufacturingData AnalyticsFuzzy logic
Mesh monitoringDigital ShadowLoad balancing
Quality controlDigital supply chainMulti responses
ZDM mappingIndustry 4.0Response time
Life-cycle controlMixed-model stochasticSmart tightening
Smart ManufacturingProcurement 4.0Taguchi
Table 2. Comparative analysis of Digital Model, Digital Shadow, and Digital Twin.
CriteriaDigital ModelDigital ShadowDigital Twin
EfficiencyIdentification of inefficiencies and bottlenecks virtually for process optimizationNear real-time data monitoring and analysis to identify inefficiencies and bottlenecksUses sensors and data analytics to create a real-time, virtual replica of a physical production system, enabling bi-directional communication
Quality ControlIdentification of potential quality issues before implementationNear real-time monitoring and analysis of product quality parametersBi-Directional near real-time monitoring of product quality, enabling process adjustments for improving quality
SafetyOffline identification of safety hazards before implementationNear real-time monitoring of safety protocols & alerts for any deviationsNear real-time monitoring of safety protocols & provision of safety countermeasures
Real-time Data AnalysisOffline support for decision-makingNear real-time data analysis for decision-making supportUses real-time data to provide continuous insights for decision-making and enable predictive maintenance to reduce downtime
Cost SavingsSimulation models can help identify cost-saving opportunities in a virtual environment before implementationOptimized production processes and improved quality control can reduce costsEnables optimized production processes, improved quality control, and predictive maintenance to reduce costs and increase efficiency
Table 3. Achievements and Limitations Using Digital Shadow Technology.
ReferenceKey ContributionsChallenges—Limitations
[26]
  • real-time monitoring
  • data analysis
  • product optimization
Significant investment in:
  • data infrastructure
  • analytics tools
[28]
  • real-time monitoring
  • analysis for decision-making for production optimization
  • Lack of standardized data formats
  • Lack of protocols
[29]
  • real-time monitoring, and analysis for predictive maintenance and quality control in injection molding
Requires specialized expertise for
  • development
  • maintenance
  of the Digital Shadow model
[34]
  • real-time monitoring
  • analytics
  • decision-making
  • Interoperability and data governance issues
[35]
  • real-time monitoring
  • data analysis
  • optimization of manufacturing processes
  • Availability & data quality
  • Requires complex algorithms and machine learning techniques
[36]
  • predictive maintenance
  • Lack of standardized data formats
  • Lack of protocols
[37]
  • Integration of diverse data sources
  • real-time monitoring
  • data analysis
  • machining processes optimization
Requires specialized expertise for
  • development
  • maintenance
  of the Digital Shadow model
[38]
  • real-time monitoring
  • data analysis
  • data privacy & security
  • requires reliable internet connectivity
Table 4. Contribution/Comparison Current Paper with Other Key Publications.
ReferenceContributionMain Topics CoveredApplications and Benefits
[24]Presents a framework for the design, modeling, and implementation of Digital Twins, and discusses their potential applications and benefits.Design and modeling of Digital Twins.—Applications of Digital Twins in various industries, including manufacturing, healthcare, and transportation.—Benefits of using Digital Twins, such as reducing development time and cost, improving system performance, and enabling predictive maintenance.Various industries, including manufacturing, healthcare, and transportation. Reducing development time and cost. Improving system performance. Enabling predictive maintenance.
[29]Presents a conceptual framework of Digital Shadow that allow for a holistic data view on production planning and controlDesign and modeling of Digital Shadow—Digital Shadow for production process and control in the injection moldingManufacturing system (injection molding). Minimizing rejection rates in injection molding. Decisions can be made simultaneously
[47]Provides a framework for designing a production system based on Digital Model technology and different simulation scenarios are evaluated using DOEDesign of manufacturing systems using Digital Model technology—Different simulation scenarios based on the DOE are studied towards the optimization of the productionManufacturing systems (copper tube production line). Low cost, quick analysis, low risk. Improving system performance.
[51]Provides an overview of the historical evolution of manufacturing systems and discusses the major trends and challenges in the field.Historical evolution of manufacturing systems, from craft production to modern cyber-physical systems.—Major trends and challenges in the field.—Insights into the future of manufacturing, including the integration of new technologies and the need for sustainability.Manufacturing systems. Integration of new technologies. Need for sustainability.
Current ManuscriptPresents a method for designing manufacturing systems based on Digital Shadow technology and robust engineering principles.Design of manufacturing systems using Digital Shadow technology.—Implementation of robust engineering principles.—Advantages of using Digital Shadow technology and robust engineering in manufacturing systems design.Manufacturing systems (food industry). Improving system resilience and robustness. Reducing manufacturing costs. Improving system performance.
Table 5. Types of Signal-to-noise Ratio.
Signal-to-Noise Ratio
(SNR)
Goal of the ExperimentData CharacteristicsSignal-to-Noise Ratio Formulas
Larger is BetterMaximize the responsePositive
S N R = 10 l o g 10 1 k i = 1 k 1 y i 2
Smaller is BetterMinimize the responseNon-negative with a target value of zero
S N R = 10 l o g 10 s i 2
s: variation
Nominal is BestTarget the response and you want to base the signal-to-noise ratio on standard deviations onlyPositive, zero, or negative
S N R = 10 l o g 10 1 k i = 1 k 1 y i 2
Nominal is Best (default)Target the response and you want to base the signal-to-noise ratio on means and standard deviationsNon-negative with an “absolute zero” in which the standard deviation is zero when the mean is zero
S N R = 10 l o g 10 y i 2 ¯ s 2
y 2 ¯ : A v e r a g e   o f   D a t a
s: variation
Table 6. Levels for Each Factor.
Factor   ( f ) Levels   ( p )
12
A (m/min)100300
B (pcs/min)68272
C (-)12
Table 7. Orthogonal Array Selection, Adapted From [71].
Number   of   Factors   ( f )
234567891011121331
Number of Levels (p)2L4L4L8L8L8L12L12L12L12L12L16L12L32
3L9L9L9L18L18L18L18L27L27L27L27L27
4L16L16L16L16L16L32L32L32L32
5L25L25L25L25L25L25L50L50L50L50L50
Table 8. Orthogonal Array (OA) L4 (23).
ExperimentsConveyors Velocity
(A)
Machines’ Productivity
(B)
Operator Number
(C)
1111
2122
3212
4221
Table 9. Key Performance Indicators’ Selection.
Key Performance IndicatorDescription
KPI_1Production Rate (quantity) of products
KPI_2Filling Machines’ Productivity
Table 10. Results of Digital Model—Before the Implementation of the Proposed Infrastructure.
Simulation Time = 480 (min)—Bottle Capacity = 490 (g)
ProductKPI_1: Quantity
(ton/h)
KPI_2: Productivity
(Bottles/h)
Theoretical ValueExperimental ValueTheoretical ValueExperimental Value
Product A2230068
Table 11. L4 Orthogonal Array with Experimental Results.
ExperimentsConveyors
Velocity (A)
Machines’
Productivity (B)
Operator Number
(C)
1 k k = 1 k 1 y i , k = 2
110068132,624
2100272247,719
330068232,640
43002721130,442
Table 12. Resulting L4 Array for the Use Case.
ExperimentsConveyors
Velocity (A)
Machines’
Productivity (B)
Operator Number
(C)
SN Ratio
110068190
2100300294
330068290
43003001102
Table 13. Average SNR for Each Factor Level.
Larger Is BetterConveyors Velocity
(A)
Machines’ Productivity
(B)
Operator Number
(C)
191.92490.27096.290
296.29097.94091.922
Rank213
Table 14. ANOVA Table Excluding Error.
SourceDegrees of FreedomSSMSContribution Percentage
Conveyors Velocity (A)11,711,435,5301,711,435,53025.90%
Machines’ Productivity (B)13,186,433,1523,186,433,15248.20%
Operator Number (C)11,710,111,9621,710,111,96225.88%
Error00
Sum36,607,980,645
Table 15. Results of Digital Model—After the Implementation of Proposed Infrastructure.
Simulation Time = 480 (min)/Bottle Capacity = 490 (g)/Product A
A/AKPI_1: Quantity
(ton/h)
KPI_2: Productivity
(Bottles/min)
Theoretical ValueExperimental ValueTheoretical ValueExperimental Value
12230068
244136
366204
488272
Disclaimer/Publisher’s Note: The statements, opinions and data contained in all publications are solely those of the individual author(s) and contributor(s) and not of MDPI and/or the editor(s). MDPI and/or the editor(s) disclaim responsibility for any injury to people or property resulting from any ideas, methods, instructions or products referred to in the content.