Article

Analysis of the Bearing Capacity of Reinforced Concrete Dapped-End Beams

Department of Reinforced Concrete Structures and Geotechnics, Faculty of Civil Engineering, Vilnius Gediminas Technical University, Saulėtekis Ave. 11, LT-10223 Vilnius, Lithuania
*
Author to whom correspondence should be addressed.
Appl. Sci. 2023, 13(9), 5228; https://doi.org/10.3390/app13095228
Submission received: 12 March 2023 / Revised: 17 April 2023 / Accepted: 20 April 2023 / Published: 22 April 2023
(This article belongs to the Special Issue Structural Design and Analysis for Constructions and Buildings)

Abstract

:
The dapped-end beam is a widely utilized structural component that offers many benefits in real-world applications. However, abrupt changes in the geometry result in complex stress flows, rendering conventional calculation methods unreliable. The estimation of the bearing capacity becomes particularly challenging when such elements are designed with prestressed reinforcement. Previous studies have identified that prestressing can have a negative impact on the behavior of dapped-end beams in specific configurations; however, this effect remains inadequately studied. This study employed both analytical and numerical parametric analyses to compare the behavior of prestressed and non-prestressed dapped-end beams. The results show that prestressing has a significant impact on the crack formation and bearing capacity of dapped-end beams. The intensity of this effect is dependent on various parameters, including shear reinforcement, concrete strength, height of the dap, and the distance between the support and the re-entrant corner. A reduction of approximately 50% in the cracking load was observed when the compressive stress ratio fell within the 0.20–0.25 range. At elevated prestressing levels, cracks emerged in the re-entrant corner prior to the beam being subjected to an external load. The analysis conducted revealed a decline of up to 8.81% in load-bearing capacity attributable to prestressing. The study highlights the importance of assessing reductions in bearing capacity and proposes an analytical calculation model for evaluating such reductions.

1. Introduction

Precast and prestressed reinforced concrete is favored for several advantages it has over cast-in-place reinforced concrete, primarily for its time and energy efficient construction as well as it capability to withstand much higher loads concerning serviceability requirements and to minimize on-site error. The connection between the individual precast concrete elements is the crucial part in designing safe, durable, and efficient structures. One of these connections, which is, used for multi-story buildings and bridges is the dapped end, which is formed by notching the bottom corner of the beam and moving the supporting location to a higher point in the cross-section [1], as shown in Figure 1. This brings several significant benefits to the structure. By supporting the dapped end of the beam on a corbel, on inverted T-beams, or on L-shaped edges, the overall structural height and dead weight of the building can be greatly reduced [2,3], thereby making the construction more sustainable and efficient by requiring significantly less material and labor input. Additionally, by raising the bearing point on the element and lowering its own structural height at the supporting end, the lateral stability of the isolated element is greatly increased [4]. Even though the advantages of the dapped end beam have promoted its extensive practical usage in structural design, too few studies have been made on its behavior when the reinforcement used in the beam is prestressed.
The abrupt change in geometry at the notched end causes a complex strain distribution at the area around the re-entrant corner [1,3]. The part of the element which has these geometrical discontinuities is called a disturbed region. Such regions are more likely to fail first compared to other parts of the element and are prone to fail due to shear forces rather than flexure [5]. Aswin et al. (2015) [2] conducted a review of 111 dapped-end beam studies and concluded that 93.69% of the beams experienced failure as a result of shear forces. The important factor to consider here is that shear failure can occur immediately, and rarely do these types of failures have early warning signs [2], but because of the complexity of the flow of stresses, accurately predicting the failure load using conventional design methods is nearly impossible [1]. That is why dapped-end beams are designed using one of the two general approaches: the shear–friction method defined by the PCI (Precast/Prestressed Concrete Institute) [6], or the different strut-and-tie models (STM) [7,8,9,10,11] adopted by many international design codes such as ACI-318 (American Concrete Institute) [12], fib Model Code [8], and Eurocode 2 [7]. Each model weights certain calculation parameters differently, and thus, the results of each model differ, but adding prestressed reinforcement to the dapped end increases the complexity of the flow of stresses even more, and the results diverge even further [5].
Studies have repeatedly analyzed the behavior of non-prestressed dapped-end beams, but few studies have analyzed how varying intensities of prestressing and different arrangements of prestressed reinforcement, draped or straight, affect the shear strength of such a beam. It was ascertained that when the prestressing force compresses the element, the shear strength increases as the force intensifies [13,14,15,16,17,18]. In a dapped-end beam, the existence of such a force occurs when the tendons are extended to the nib, resulting in the compression of the element by force P1, as depicted in Figure 2. Due to technical reasons and practical difficulties in manufacturing, such reinforcement arrangements are not feasible in many elements, particularly in thin-stemmed members [16]. The problem arises when the prestressed reinforcement is arranged in such a way that the force P2 induces tension at the re-entrant corner A, and the shear strength is thereby reduced [14,15]. Additionally, the longevity of the element is compromised, as the tension has a significant impact on premature cracking at the re-entrant corner [14,16]. Hence, it is imperative to investigate the performance of dapped-end beams reinforced with straight prestressed tendons as well as to assess the influence of prestressing on load-bearing capacity.
This article provides the findings of analytical and numerical parametric analyses of the shear failure load of a prestressed dapped-end beam. The parametric analysis focused on the dimensions of the dapped end, location of the support in the dapped end, concrete strength, quantities of shear reinforcement, and prestressing intensity. Numerical analysis was done using FEA software DIANA FEA.

2. Analytical Methods for Calculating the Failure Load

The load capacity of a dapped-end beam is defined by its flexural strength in the mid-section and the strength of the supporting section. As mentioned, dapped-end beams mostly fail due to shear forces acting on the dapped end. If the element is reinforced with straight prestressed strands in the tension zone, the flexural strength’s impact is further reduced. The complex stress distribution in the notched end prevents accurate calculation of the failure load through conventional methods of determining shear strength. To calculate the load capacity of dapped-end beams, specialized methods are chosen. These methods typically involve assessing the potential failure modes such as those shown in Figure 3. According to the PCI [6], these failure modes can be described as one of the following: flexure (cantilever bending) and axial tension in the extended end; direct shear at the junction of the dap and the main body of the component; diagonal tension emanating from the reentrant corner; diagonal tension in the extended end; diagonal tension in the undapped portion.
To determine the failure load, the following specialized methods were chosen:
  • PCI dapped-end beam design method, which is defined in Section 5.6.3 [6];
  • EC2 strut-and-tie (STM) model, which is defined in Section 6.5 [7];
  • The semi-empirical truss model of Wang et al. in 2005 [19].
It is crucial to note that the specialized methods employed do not account for the effects of prestressing. These methods are designed and optimized for a specific configuration of the dapped end and cannot evaluate the impact of prestressed reinforcement if such reinforcement is not used in the methods. The decision to employ these methods was taken to achieve two objectives. The first objective was to compare the bearing capacity of the prestressed beam in the numerical model with analytical methods and to determine if the impact of prestressing was significant enough to cause an overestimation of the bearing capacity and pose a risk of premature failure. The second objective was to identify which methods most accurately reflect the behavior of a non-prestressed dapped-end beam in the numerical model so they can be utilized as a baseline for future research to modify these methods and evaluate the impact of prestressing. The primary mode of failure observed in dapped-end beams is attributed to shear forces. Therefore, the use of the shear calculation method outlined in Eurocode 2 (EC2) Section 6.2 [7] is considered to be an alternative approach for analytically determining the failure load of the dapped-end beams.
Employing analytical calculation methods, a parametric analysis of the failure load was conducted based on the height of the dap h d , the distance of the support from the re-entrant corner l s , the concrete strength f c m , and the area of shear reinforcement A v h . The varying parameters of the dapped end are highlighted in blue in Figure 4.
The impact of reinforcement prestressing was examined utilizing the proposed model presented in Section 4 of this study. The proposed analytical model was founded on the shear computation methodology described in EC2, which is explained in Section 6.2, and was derived from the parametric analysis conducted within the scope of this research. In the EC2 methodology, prestressing affects the load-bearing capacity of compressive concrete struts. Following the parametric analysis, modified equations and coefficients were introduced to account for prestressing when the prestressed tendons induced force P2, as illustrated in Figure 2.
According to EC2, two primary scenarios for diagonal section calculations can be identified. The first scenario occurs when there is no shear reinforcement in the element, and thus, the concrete alone withstands the shear forces. The second scenario arises when the shear reinforcement bears the tensile forces and the concrete struts are thereby subjected to compression. In the first case, the diagonal section’s load-bearing capacity is determined by the larger value according to the formulas provided below [7]:
V R d , c = C R d , c k 100 ρ 1 f c m 1 3 + k 1 σ c p b w d ,
V R d , c = ν m i n + k 1 σ c p b w d ,
where C R d , c is a coefficient with a recommended value of 0.18 γ c ; k is a coefficient evaluating the effective depth, which is calculated using the following formula:
k = 1 + 200 d 2.0 ,
where d is the effective cross-sectional depth.
ρ 1 is a coefficient representing the amount of tensile reinforcement within the distance of l b d + d , and it is calculated as follows:
ρ 1 = A s 1 b w d 0.02 ,
where A s 1 is the cross-sectional area of the tensile reinforcement; b w is the minimum width of the examined element within the analyzed zone.
f c m is the average compressive strength of concrete; k 1 is the coefficient evaluating the influence of cross-sectional stresses from axial forces on the diagonal section, which is recommended to be equated to 0.15; σ c p is the average of stresses across the entire cross-section resulting from axial forces. These are limited by the following condition:
σ c p = N E d A c < 0.2 f c m ,
where: N E d is the axial force in the cross-section resulting from the load or prestressing; A c is the area of the element’s cross-section; f c m is the average compressive strength of the concrete.
ν m i n is calculated according to the following equation:
ν m i n = 0.035 k 3 2 f c m 1 2 .
When the element is reinforced with shear reinforcement, the shear capacity is determined with the subsequent equation:
V R d = min V R d , s ; V R d , m a x ,
where V R d , s is the shear strength of shear reinforcement; V R d , m a x is the maximum shear strength of compressive concrete struts.
The shear strength of vertical shear reinforcement is calculated as follows:
V R d , s = A s w s z f y w m cot θ ,
where A s w is the cross-sectional area of shear reinforcement; s is the spacing between stirrups; z is the inner lever arm, which can be equated to approximately 0.9 d ; f y w m is the average yield strength of shear reinforcement; θ is the angle of the diagonal strut, which is limited to a range of 22 degrees to 45 degrees. When the angle is 45 degrees, the shear strength V R d , s has the lowest value.
The shear strength of the compressive concrete strut is calculated as follows:
V R d , m a x = α c w b w z ν 1 f c m cot θ + tan θ ,
where b w is the minimum width of the element in the analyzed zone; z is the inner lever arm, which can be equated to approximately 0.9 d ; ν 1 is a coefficient assessing the strength of the cracked concrete in the diagonal section, calculated using the formula specified earlier in this section for the v m i n ; θ is the angle of the compressive struts, which is limited to being between 22 degrees and 45 degrees. At a strut angle of 22 degrees, V R d , m a x is at its minimum. The coefficient α c w accounts for the influence of the stress state in the cross-section on the shear capacity. For structures without prestressing, it equates to 1.0. In other cases, it is calculated as follows:
α c w = 1 + σ c p f c m , w h e n   0 < σ c p < 0.25 f c m ,
α c w = 1.25 , w h e n   0.25 f c m < σ c p < 0.5 f c m ,
α c w = 2.5 1 σ c p f c m , w h e n   0.5 f c m < σ c p < 1.0 f c m ,
where: σ c p is the average of stresses across the entire cross-section resulting from the axial force. These stresses are considered positive when the cross-section is subjected to compression.

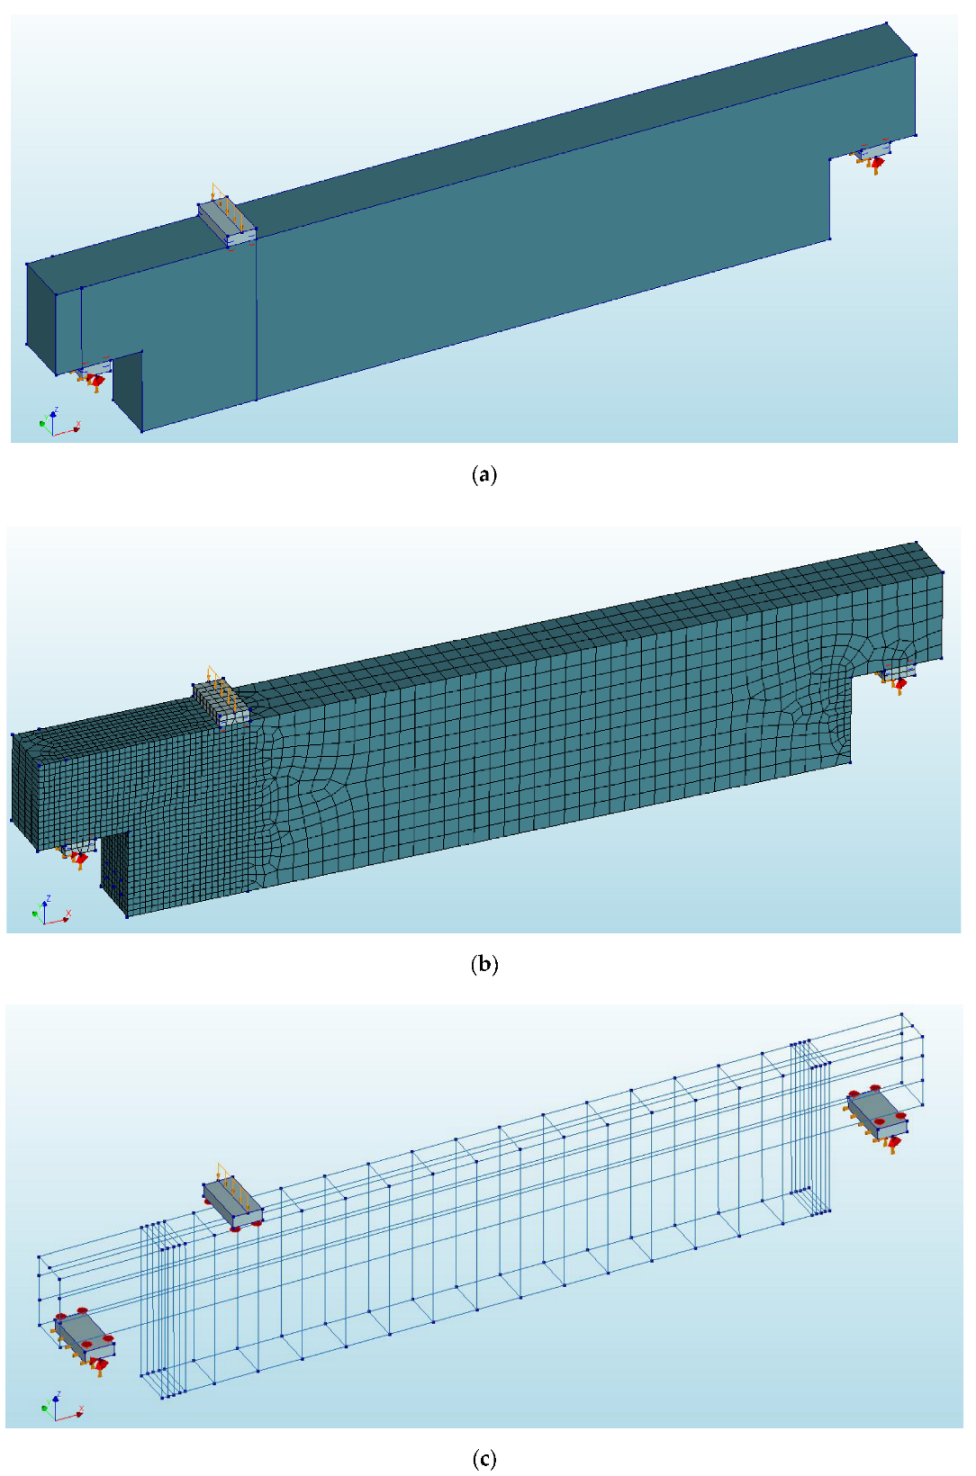
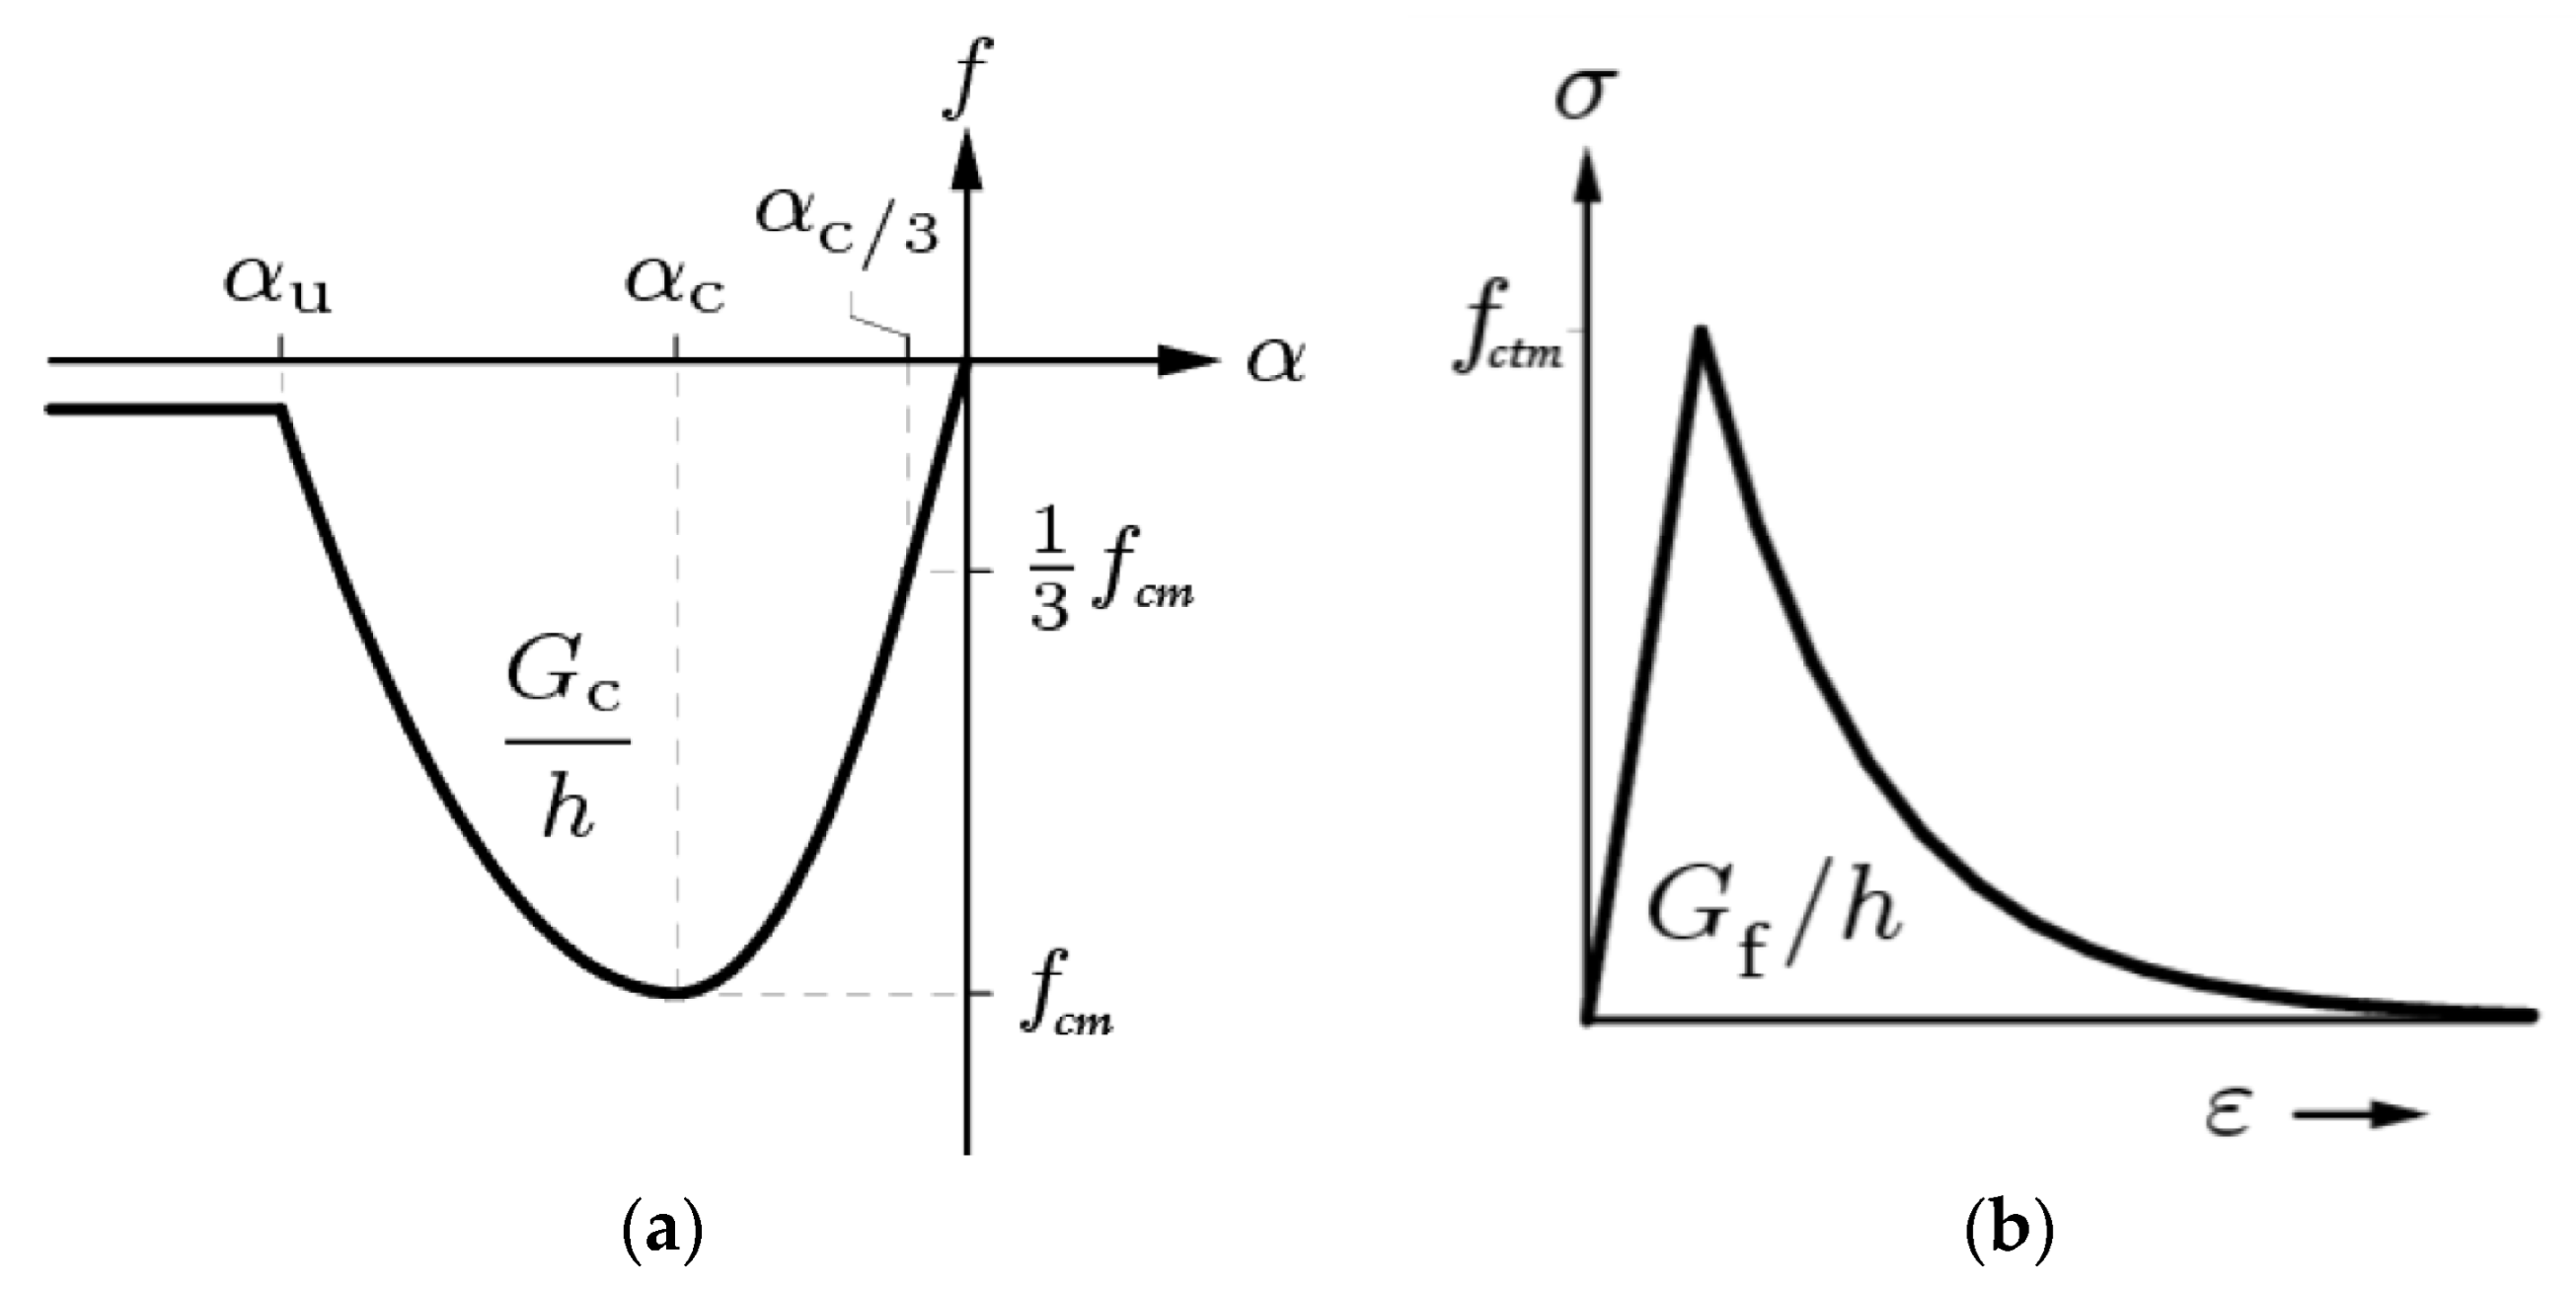
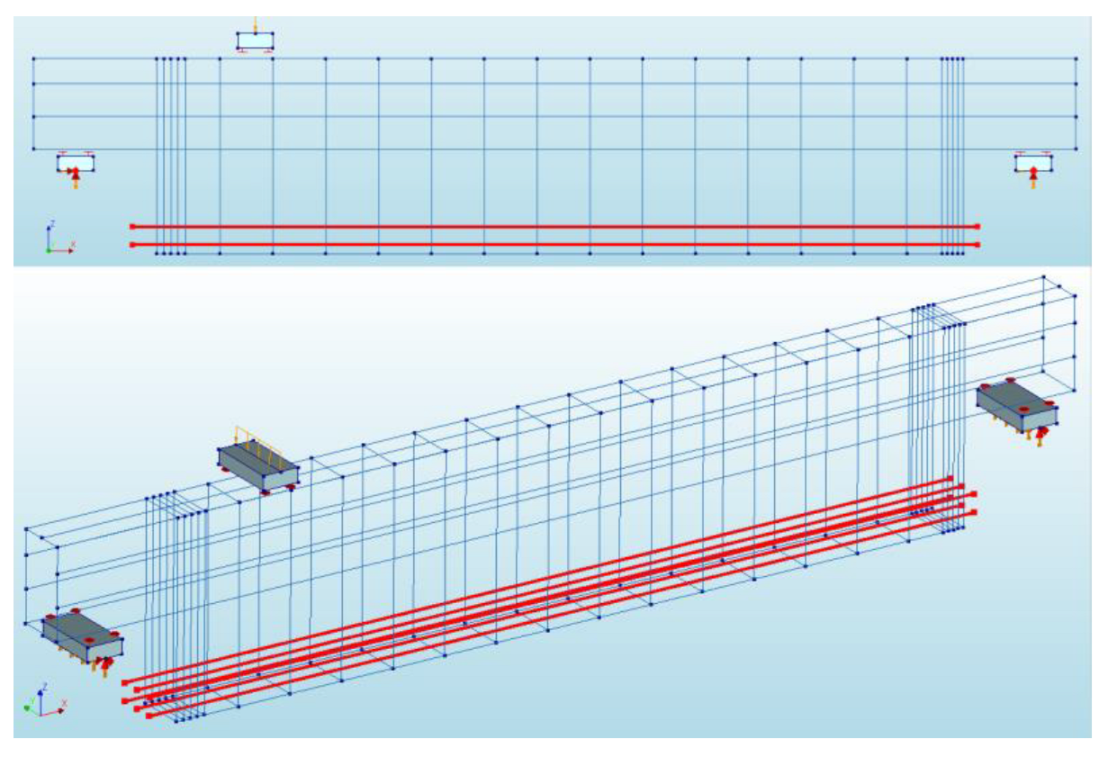
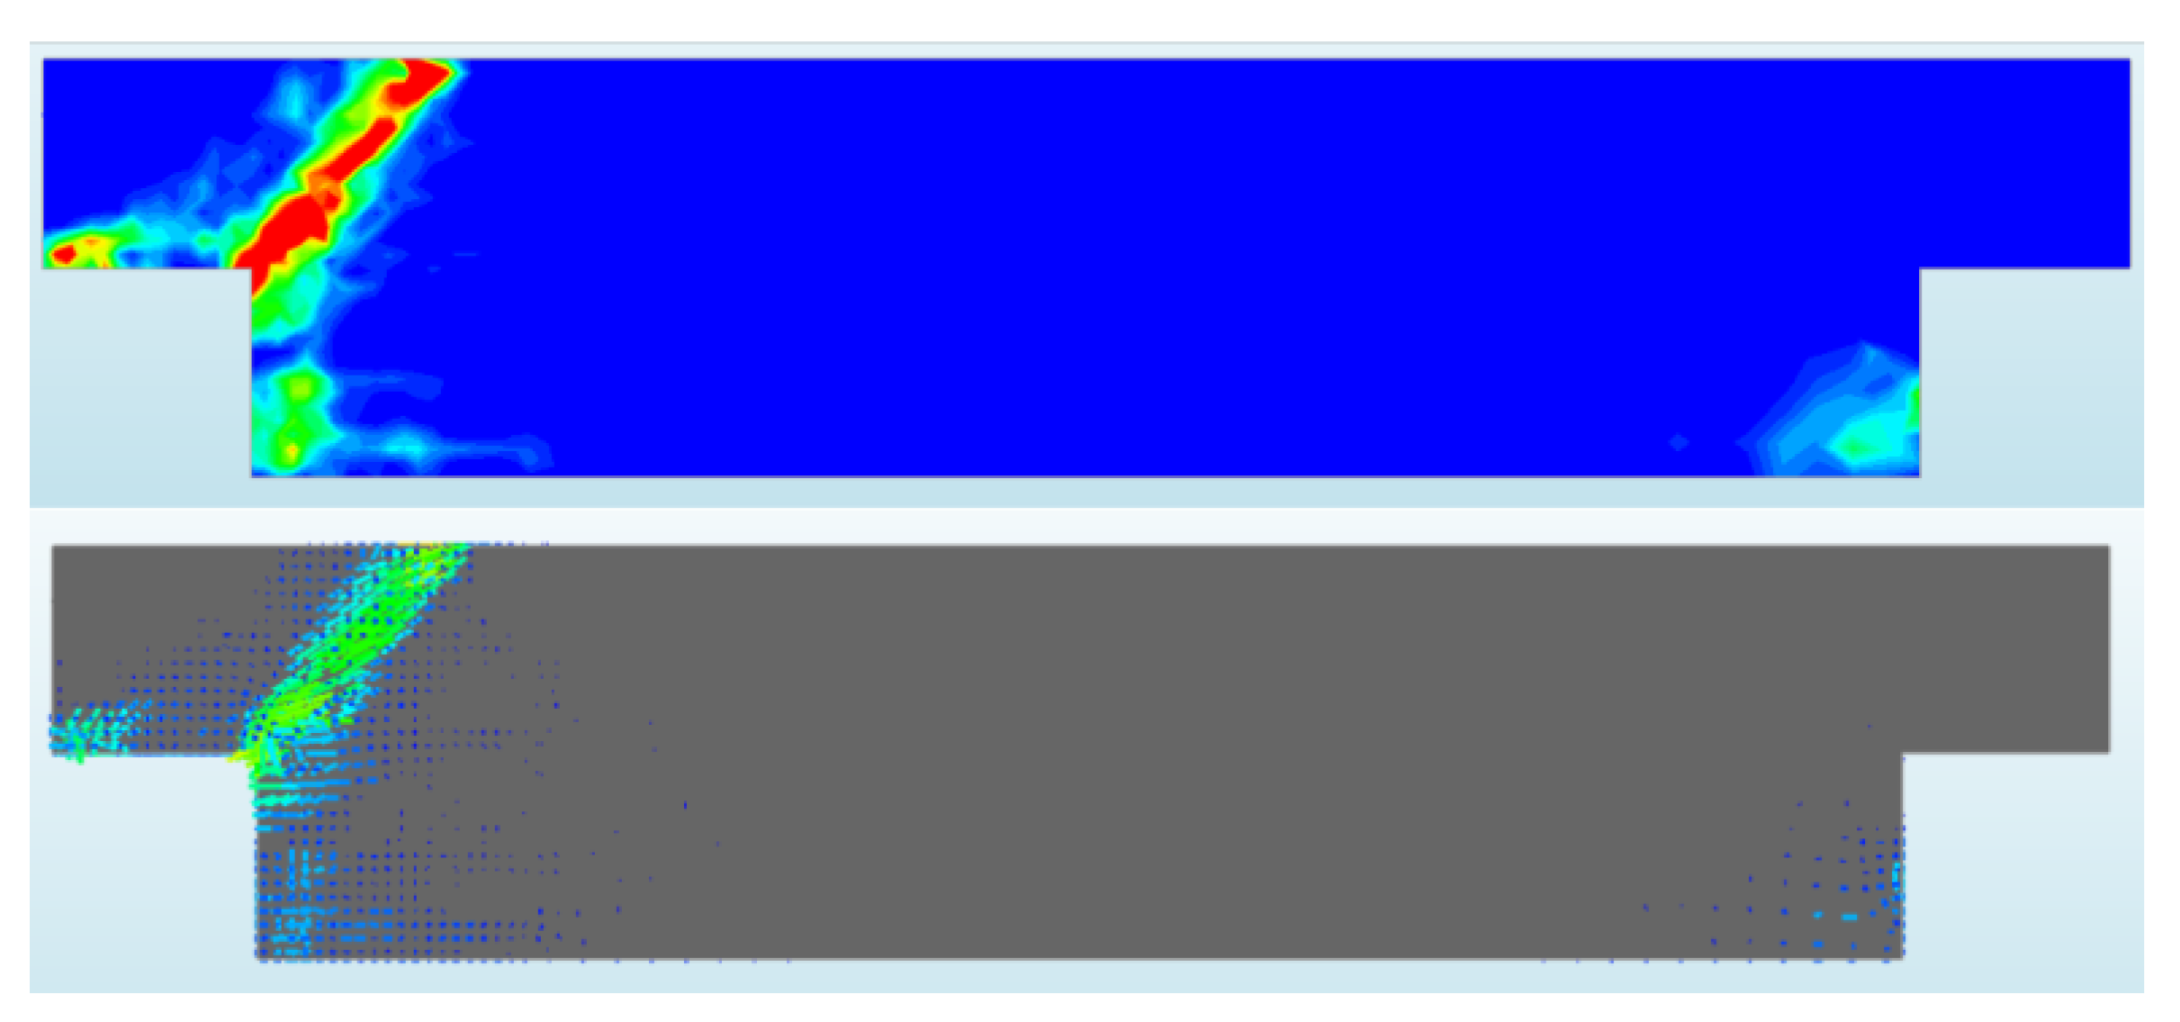
3. Numerical Modelling of the Dapped-End Beam

To perform a parametric analysis on a dapped-end beam and to examine the influence of the prestressing force, a numerical model was developed utilizing the finite element analysis software DIANA FEA. The drawings of the models are shown in Figure 5 and Figure 6. The width of the beam b = 200 mm, the length L = 3000 mm, and the height H = 600 mm. The beam was modeled as a 3D solid element, which can be observed in Figure 7. The beam model was supported by simulated plates with dimensions of 100 mm in length, 200 mm in width, and 40 mm in height. An identical plate was used to apply loads. The plates were modelled as 3D solid elements. The displacement of the left support was constrained in all directions and constrained in rotation around the z and x axes. The right support was equivalent to the left, but the displacement was not fixed along the x-axis. The model of the beam was exposed to two loads: a load of its own weight and an external load on the load plate. Between the surface of the plates and their imprint on the beam, a 3D surface interface was modelled. For the plate steel, an elastic material model was selected with a modulus of E = 210 GPa, a Poisson’s coefficient of v = 0.3 , and a density of ρ = 7850 kg/m3.
The finite element (FE) mesh was composed of elements of varying sizes (see Figure 7b) not only to achieve the required accuracy of the calculations but also to maintain a rational duration of computer calculation. The beam was divided into several zones where the FE sizes differ: the zone around the left end of the beam was divided into square elements 20 × 20 × 20 mm in size, the re-entrant corner of the notch was divided into elements 10 × 10 × 10 mm in size, and the wall of the right notch was divided into 20 × 20 × 20 mm-sized elements (to more accurately assess the deformations caused by the prestressed reinforcement). The rest of the beam model was divided into 50 mm adaptive dimensional-size FEs. The size of the FE of the support and load plates was chosen to form at least two FEs through the thickness of the plates.
In the numerical model, concrete was defined as an elastic–plastic material. A total train-based crack model was selected for the concrete model. The behavior of concrete under compression was defined by a parabolic stress–strain relationship curve (see Figure 8a) and the tensile behavior was defined by an exponential curve (see Figure 8b).
The material properties employed in this research were derived from the study conducted by Lu et al., 2003 [22]. The remaining concrete parameters were selected according to EN 1992-1-1 Table 3.1 [7]. Based on an average compressive concrete strength of 33.7 MPa, the C25/30 concrete class was chosen. The following parameters were adopted: concrete modulus of elasticity E c m = 31.675 GPa; tensile strength f c t m = 2.613 MPa; Poisson’s ratio ν = 0.2; concrete density ρ = 2400 kg/m3. The specified concrete model in the numerical model necessitated certain concrete properties that were not provided in the table. These parameters were estimated using the subsequent formulas.
The dependence between compressive concrete strength and fracture energy when concrete is under compression can be expressed through the following formula [23]:
G c = 15 + 0.43 f c m 0.0036 f c m 2 ,
where f c m is the average compressive strength of concrete in MPa; G c is fracture energy under compression in N/mm.
The dependence between compressive concrete strength and fracture energy when the concrete is subjected to tension is expressed by this formula [24]:
G f = 0.03 f c m 10 0.7 ,
where f c m is the average compressive strength of the concrete; G f is fracture energy under tension in N/mm.
The following parameters were estimated: fracture energy under compression G c = 25.40 N/mm; fracture energy under tension G f = 0.07 N/mm.
The reinforcement was modelled using lines in a 3D environment, as shown in Figure 6c. In the compression zone of the beam, three reinforcement rods A s were modelled, whereas in the tensile zone, two reinforcement rods A s . A total of four reinforcement rods A h were modelled in the zone above the dap, where the neutral axis varies at different stages of beam loading. The properties of reinforcement A s , A h , and A v h were obtained from the study by Lu et al., 2003. The prestressed reinforcement A s p comprised grade Y1860S steel tendons. Their respective properties are presented in Table 1, and their arrangement is illustrated in Figure 5 and Figure 6.
For the assessment of the effect of prestressed reinforcement, six tendons with a diameter of 15.7 mm in the tensile zone of the beam were introduced in the model (see Figure 9). The properties of the reinforcement A s p are indicated in Table 1. The prestressing of the reinforcement was introduced as a load of 1000 MPa of stress in the tendons.

4. Results

To evaluate the effect of reinforcement prestressing on the dapped-end beam, the numerical parametric analysis was conducted twice. In the first analysis, reinforcement prestressing was not considered, and in the second analysis, the reinforcement was prestressed prior to loading the beam.
The nonlinear analysis was performed in three stages. The first stage involved prestressing the reinforcement using the Newton–Raphson load control method. The second stage assessed the self-weight of the element using the same method. The final stage incrementally increased the external load by employing the arch length control method until the element failed.

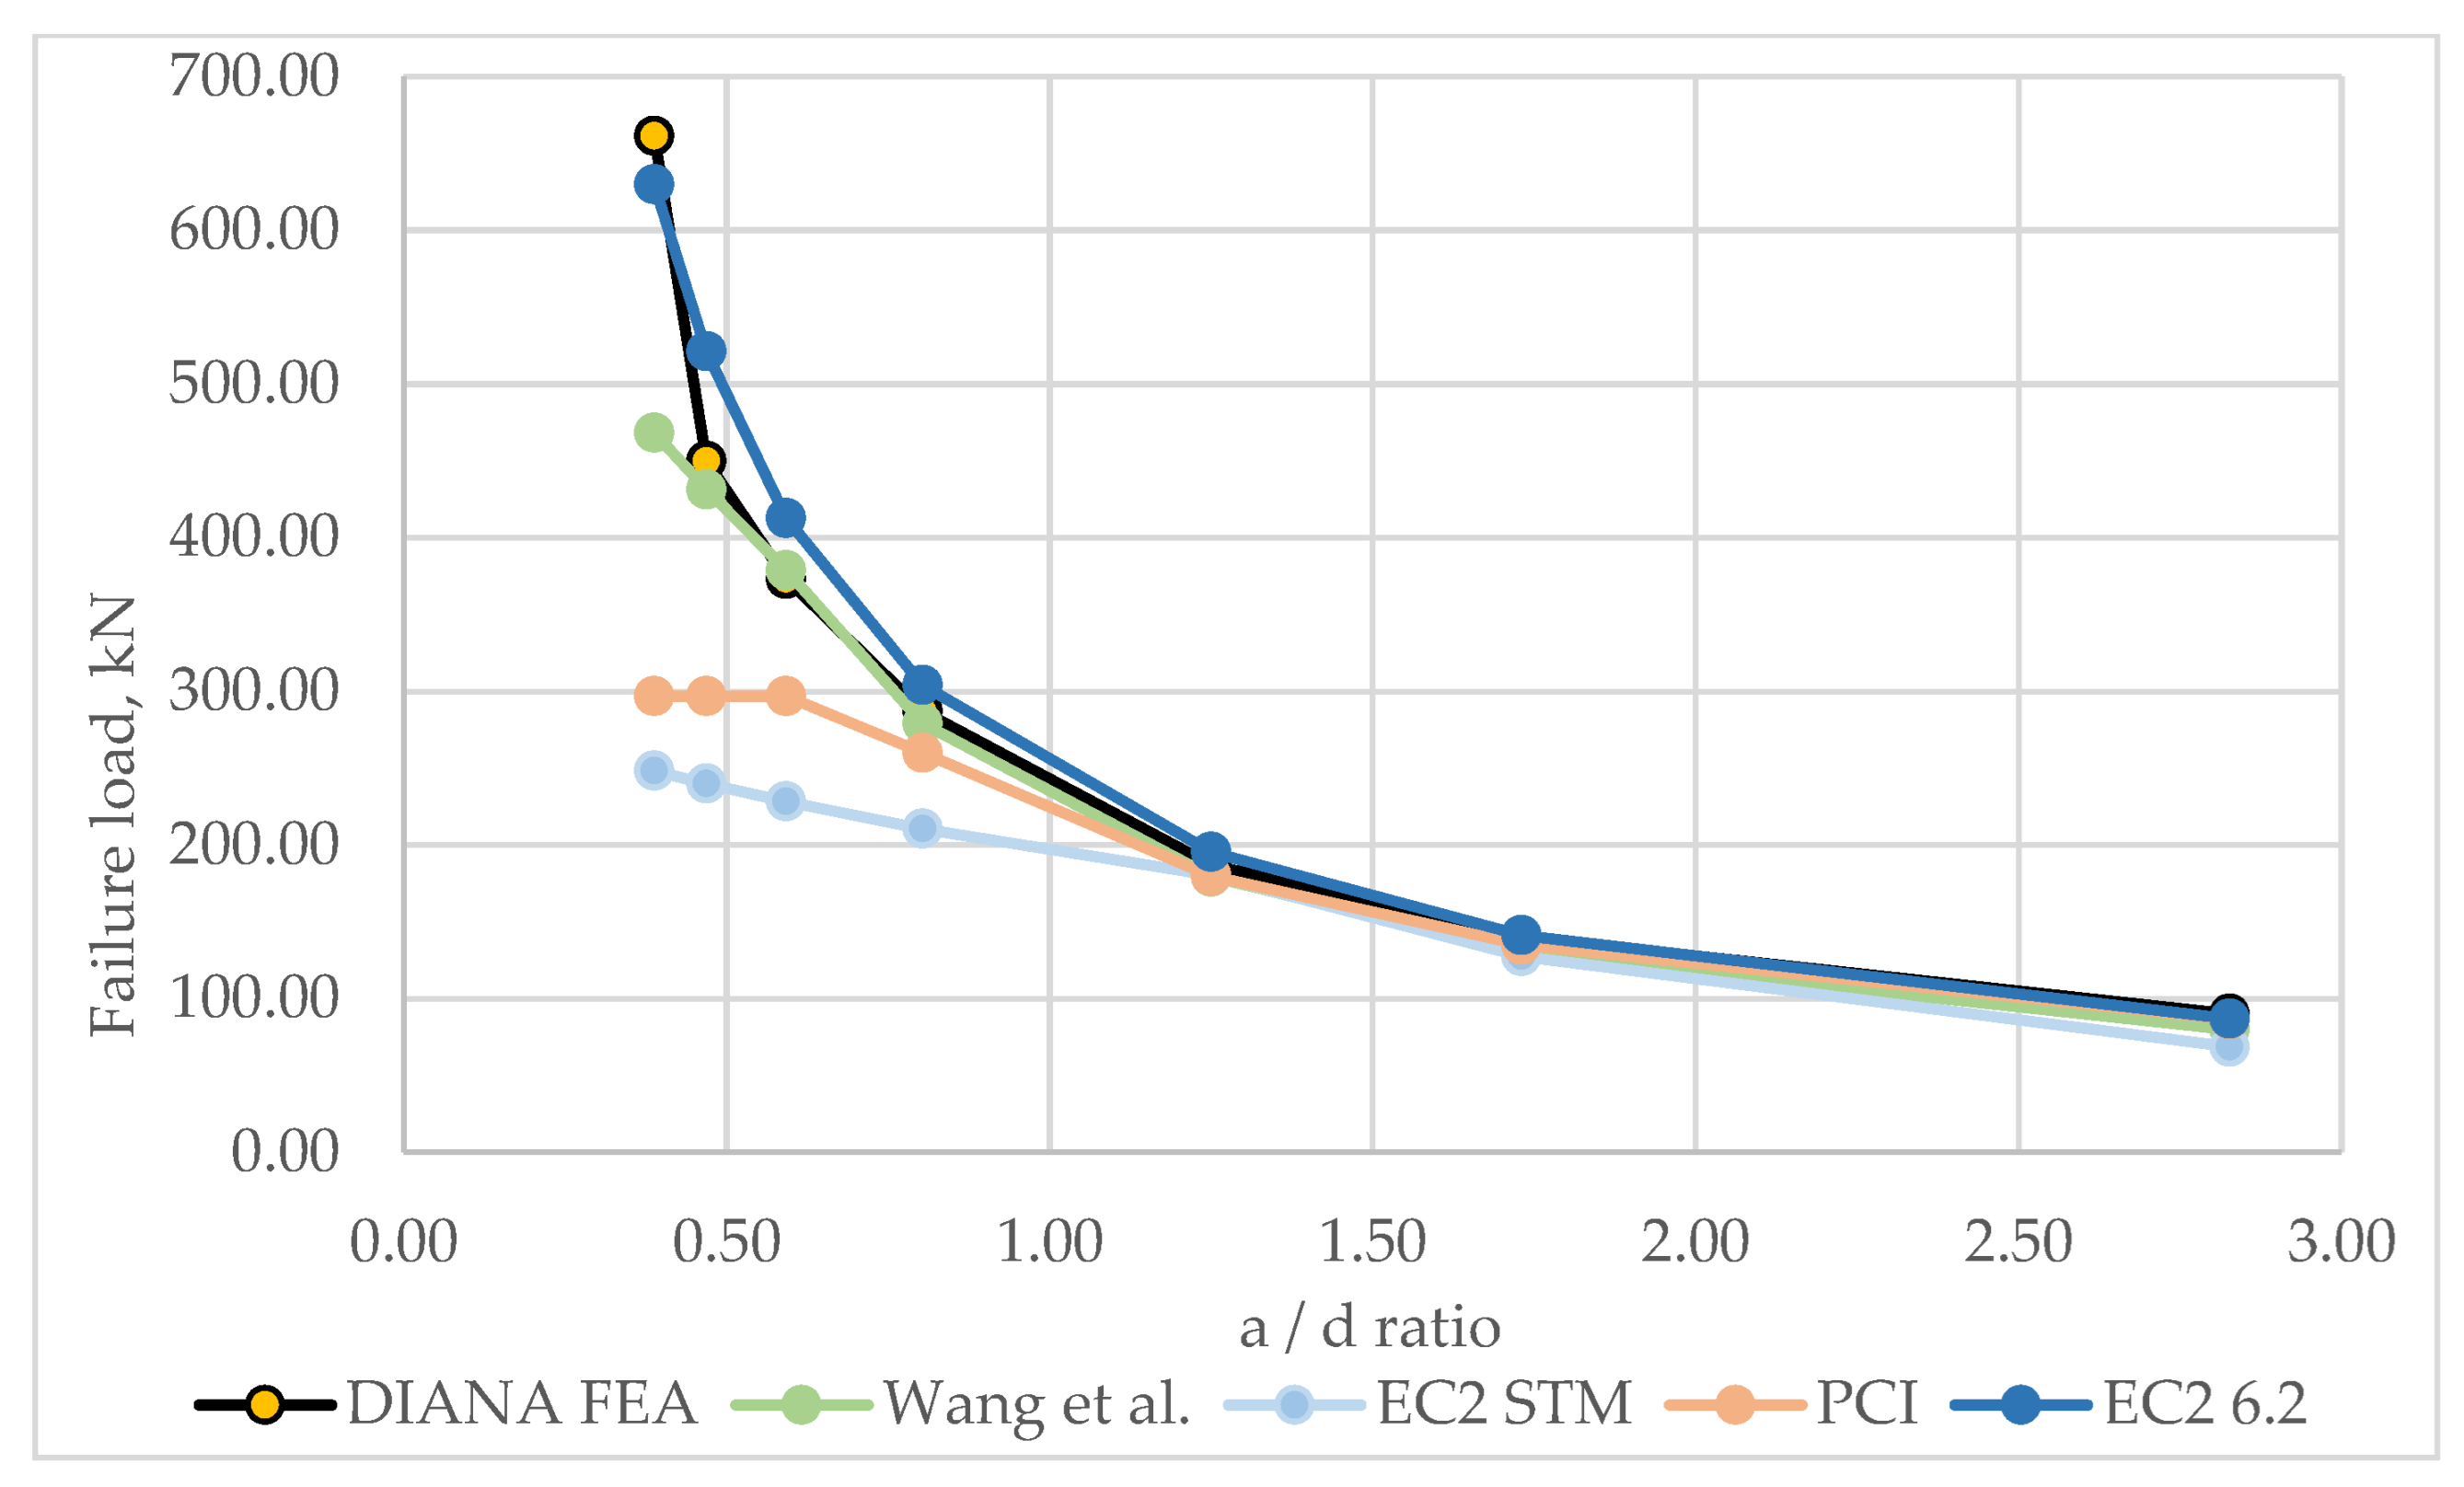
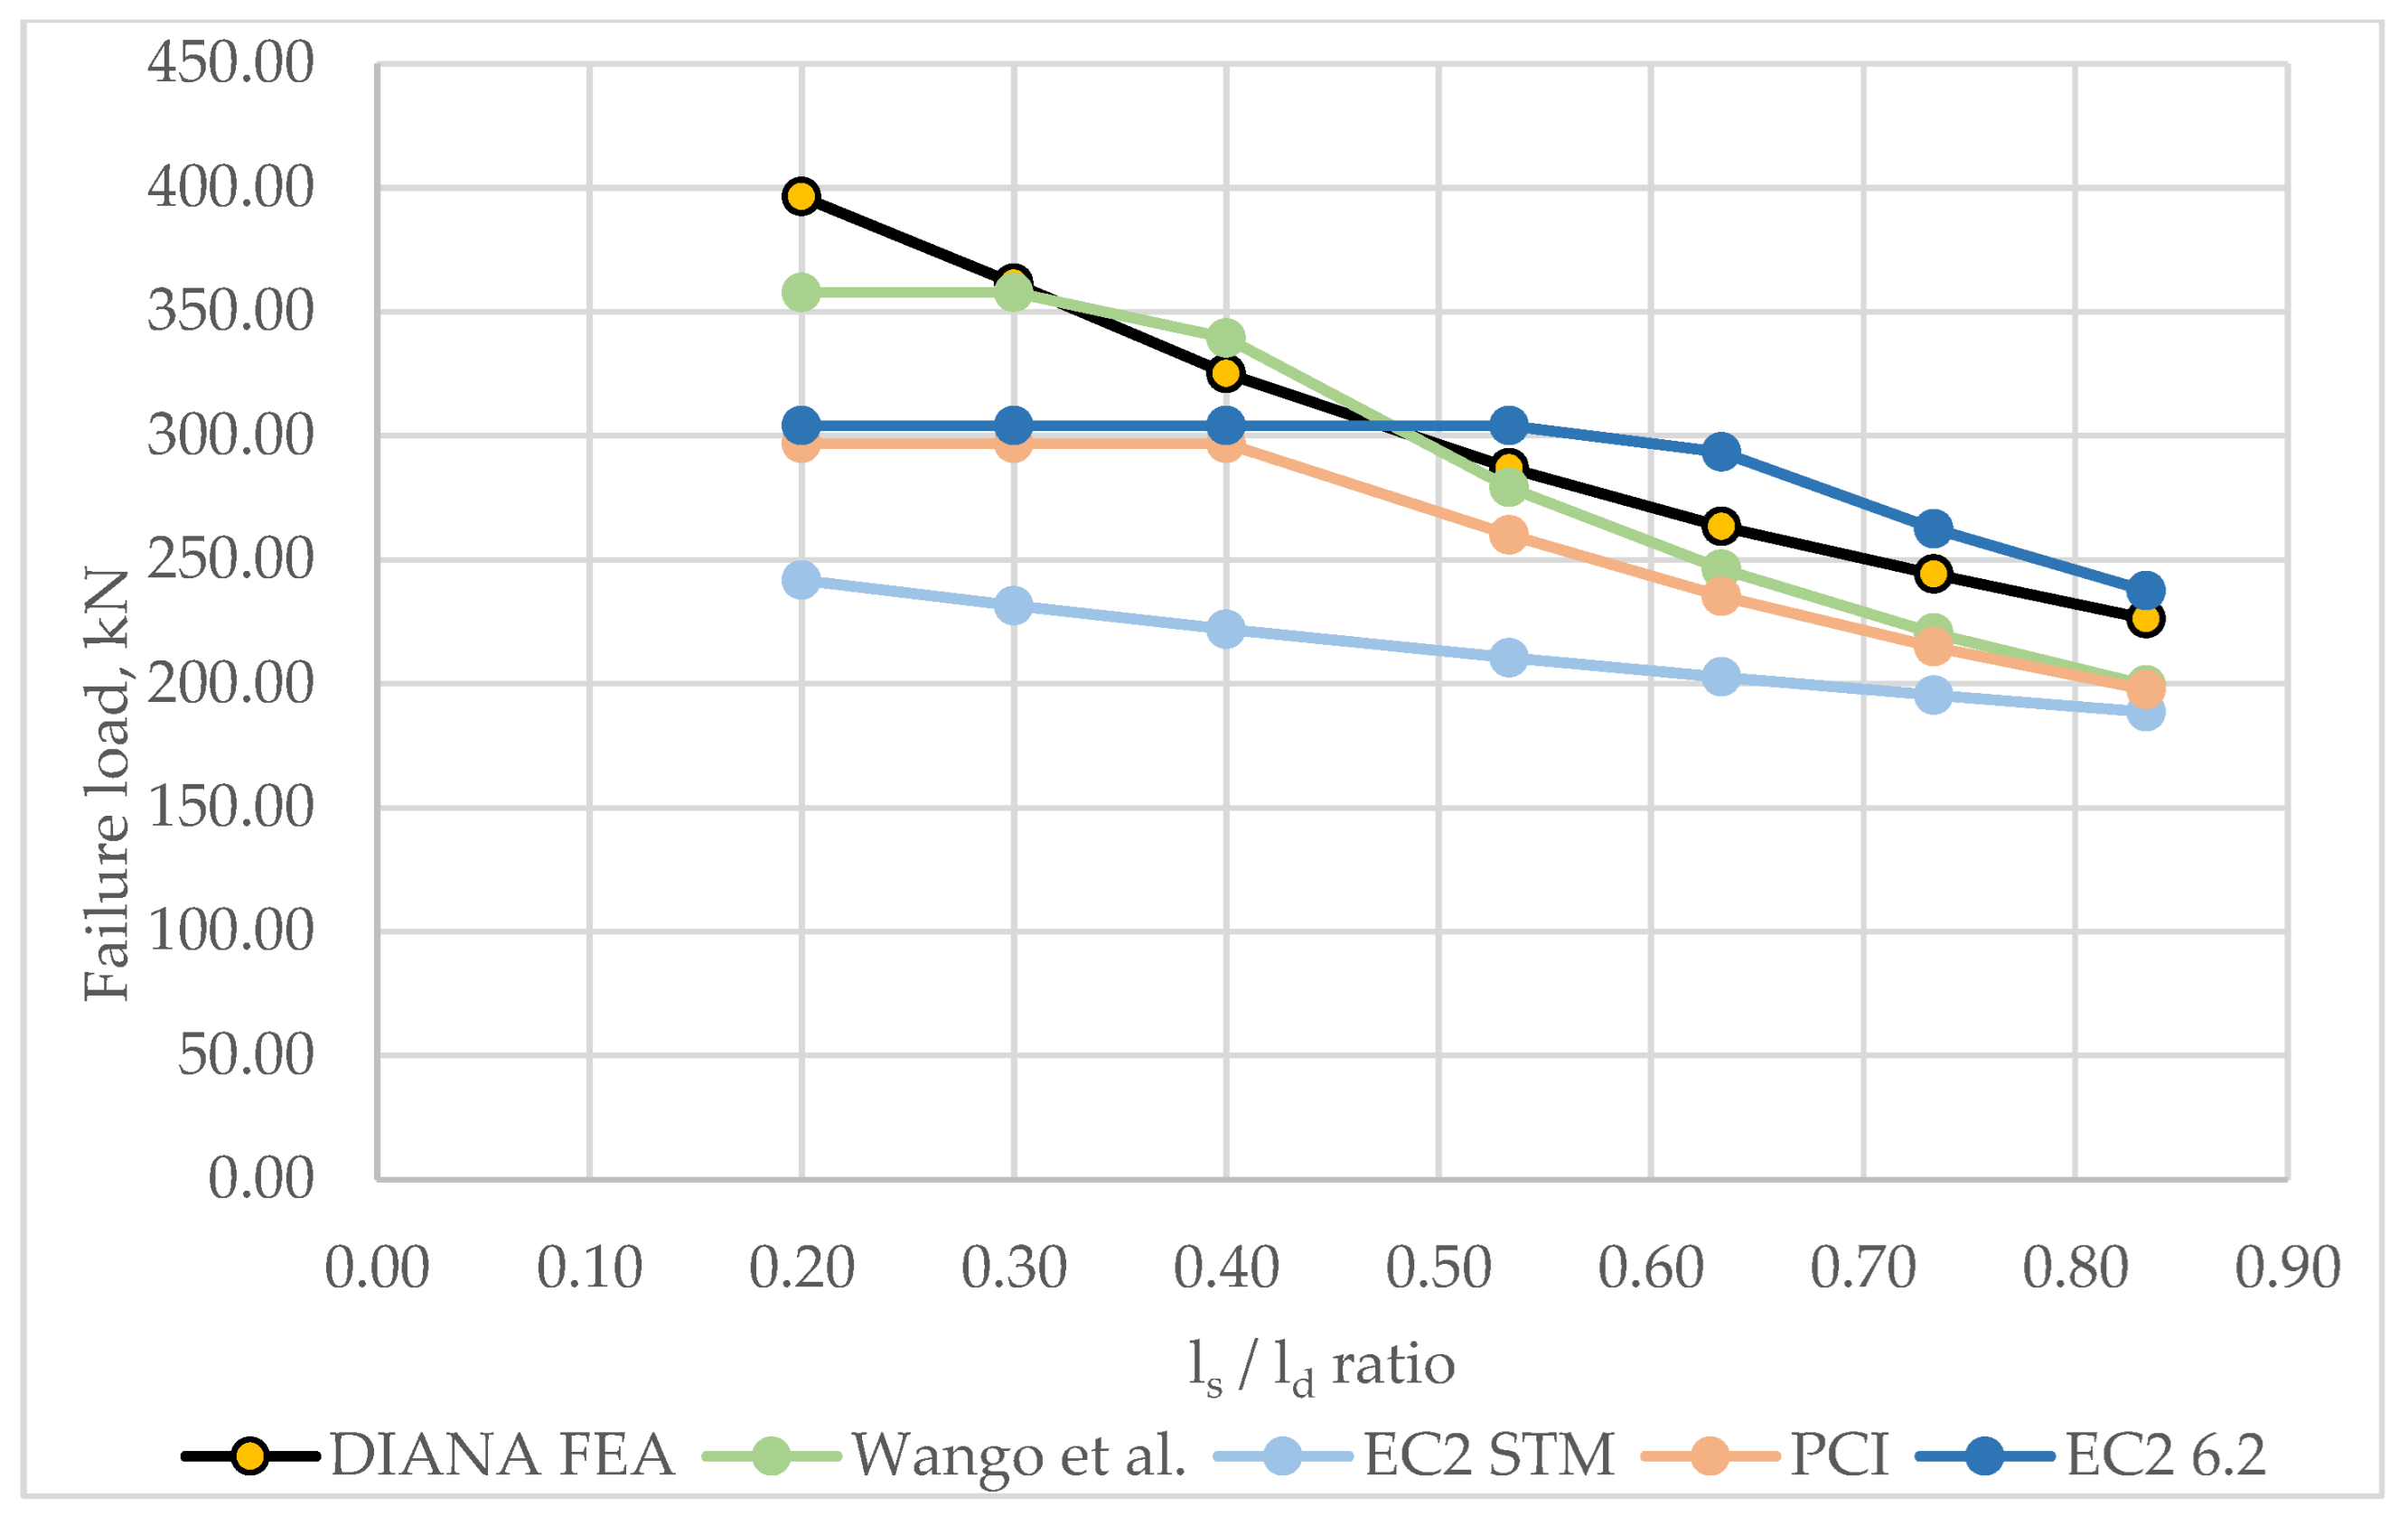
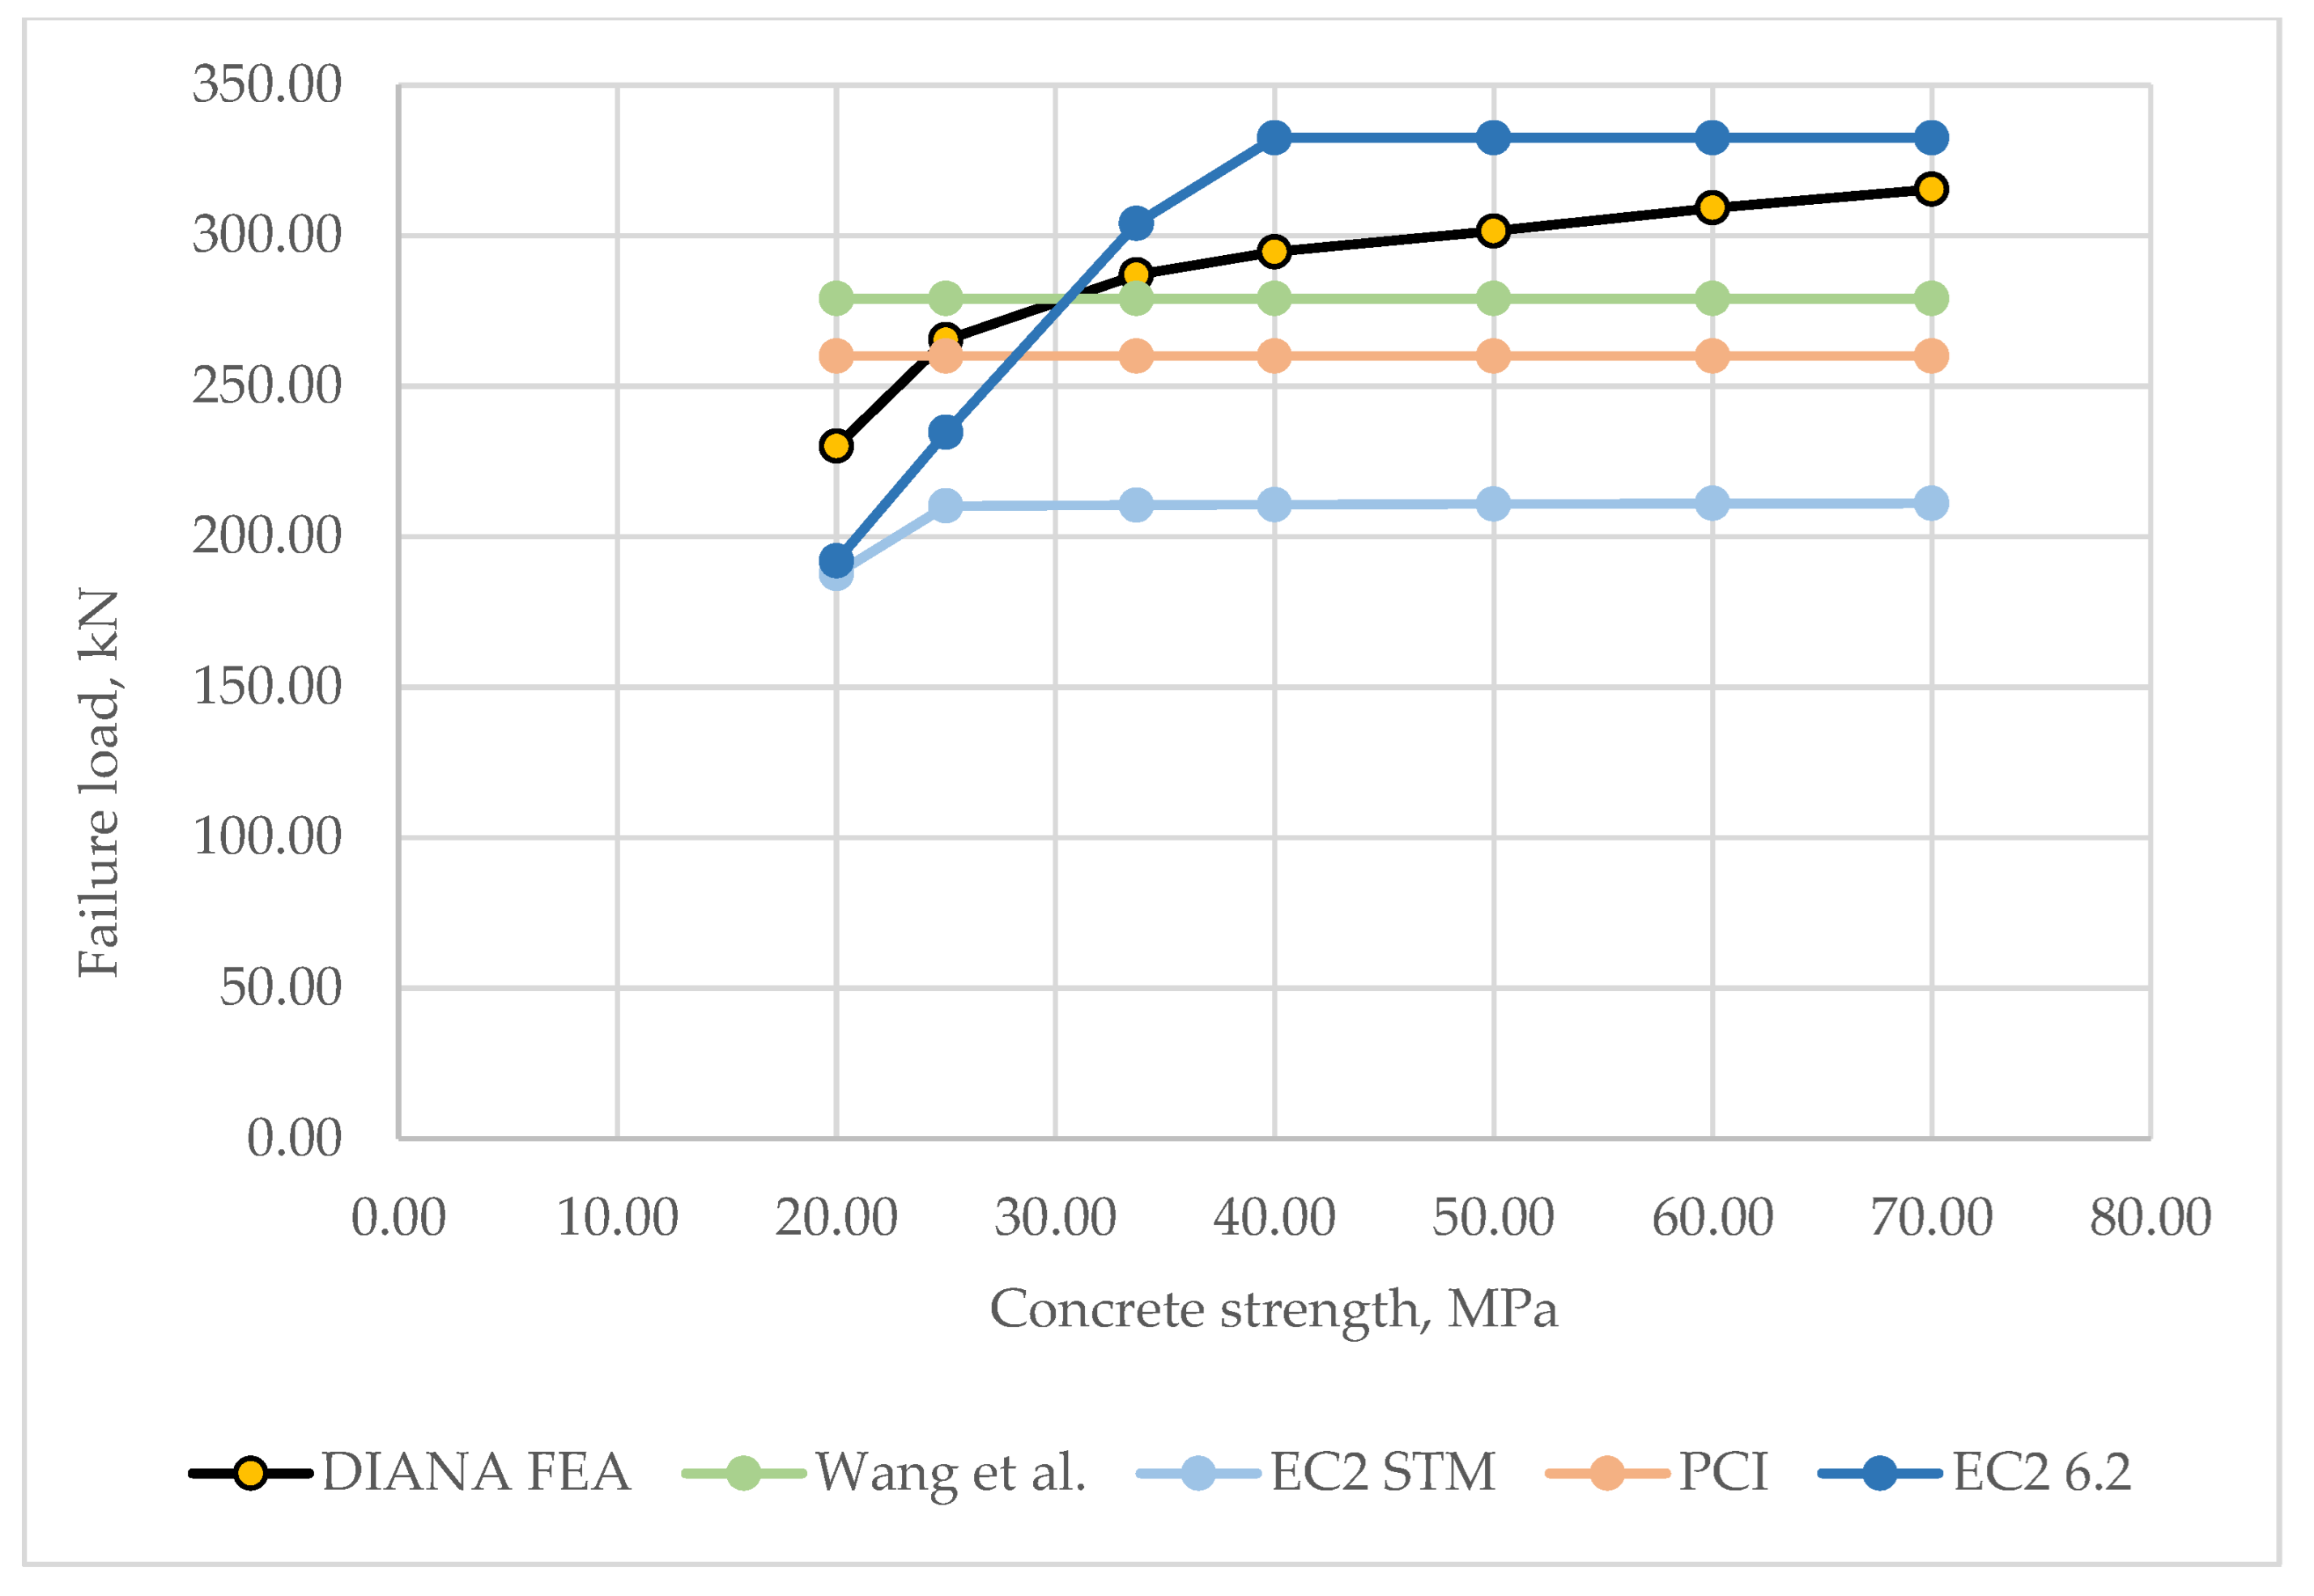
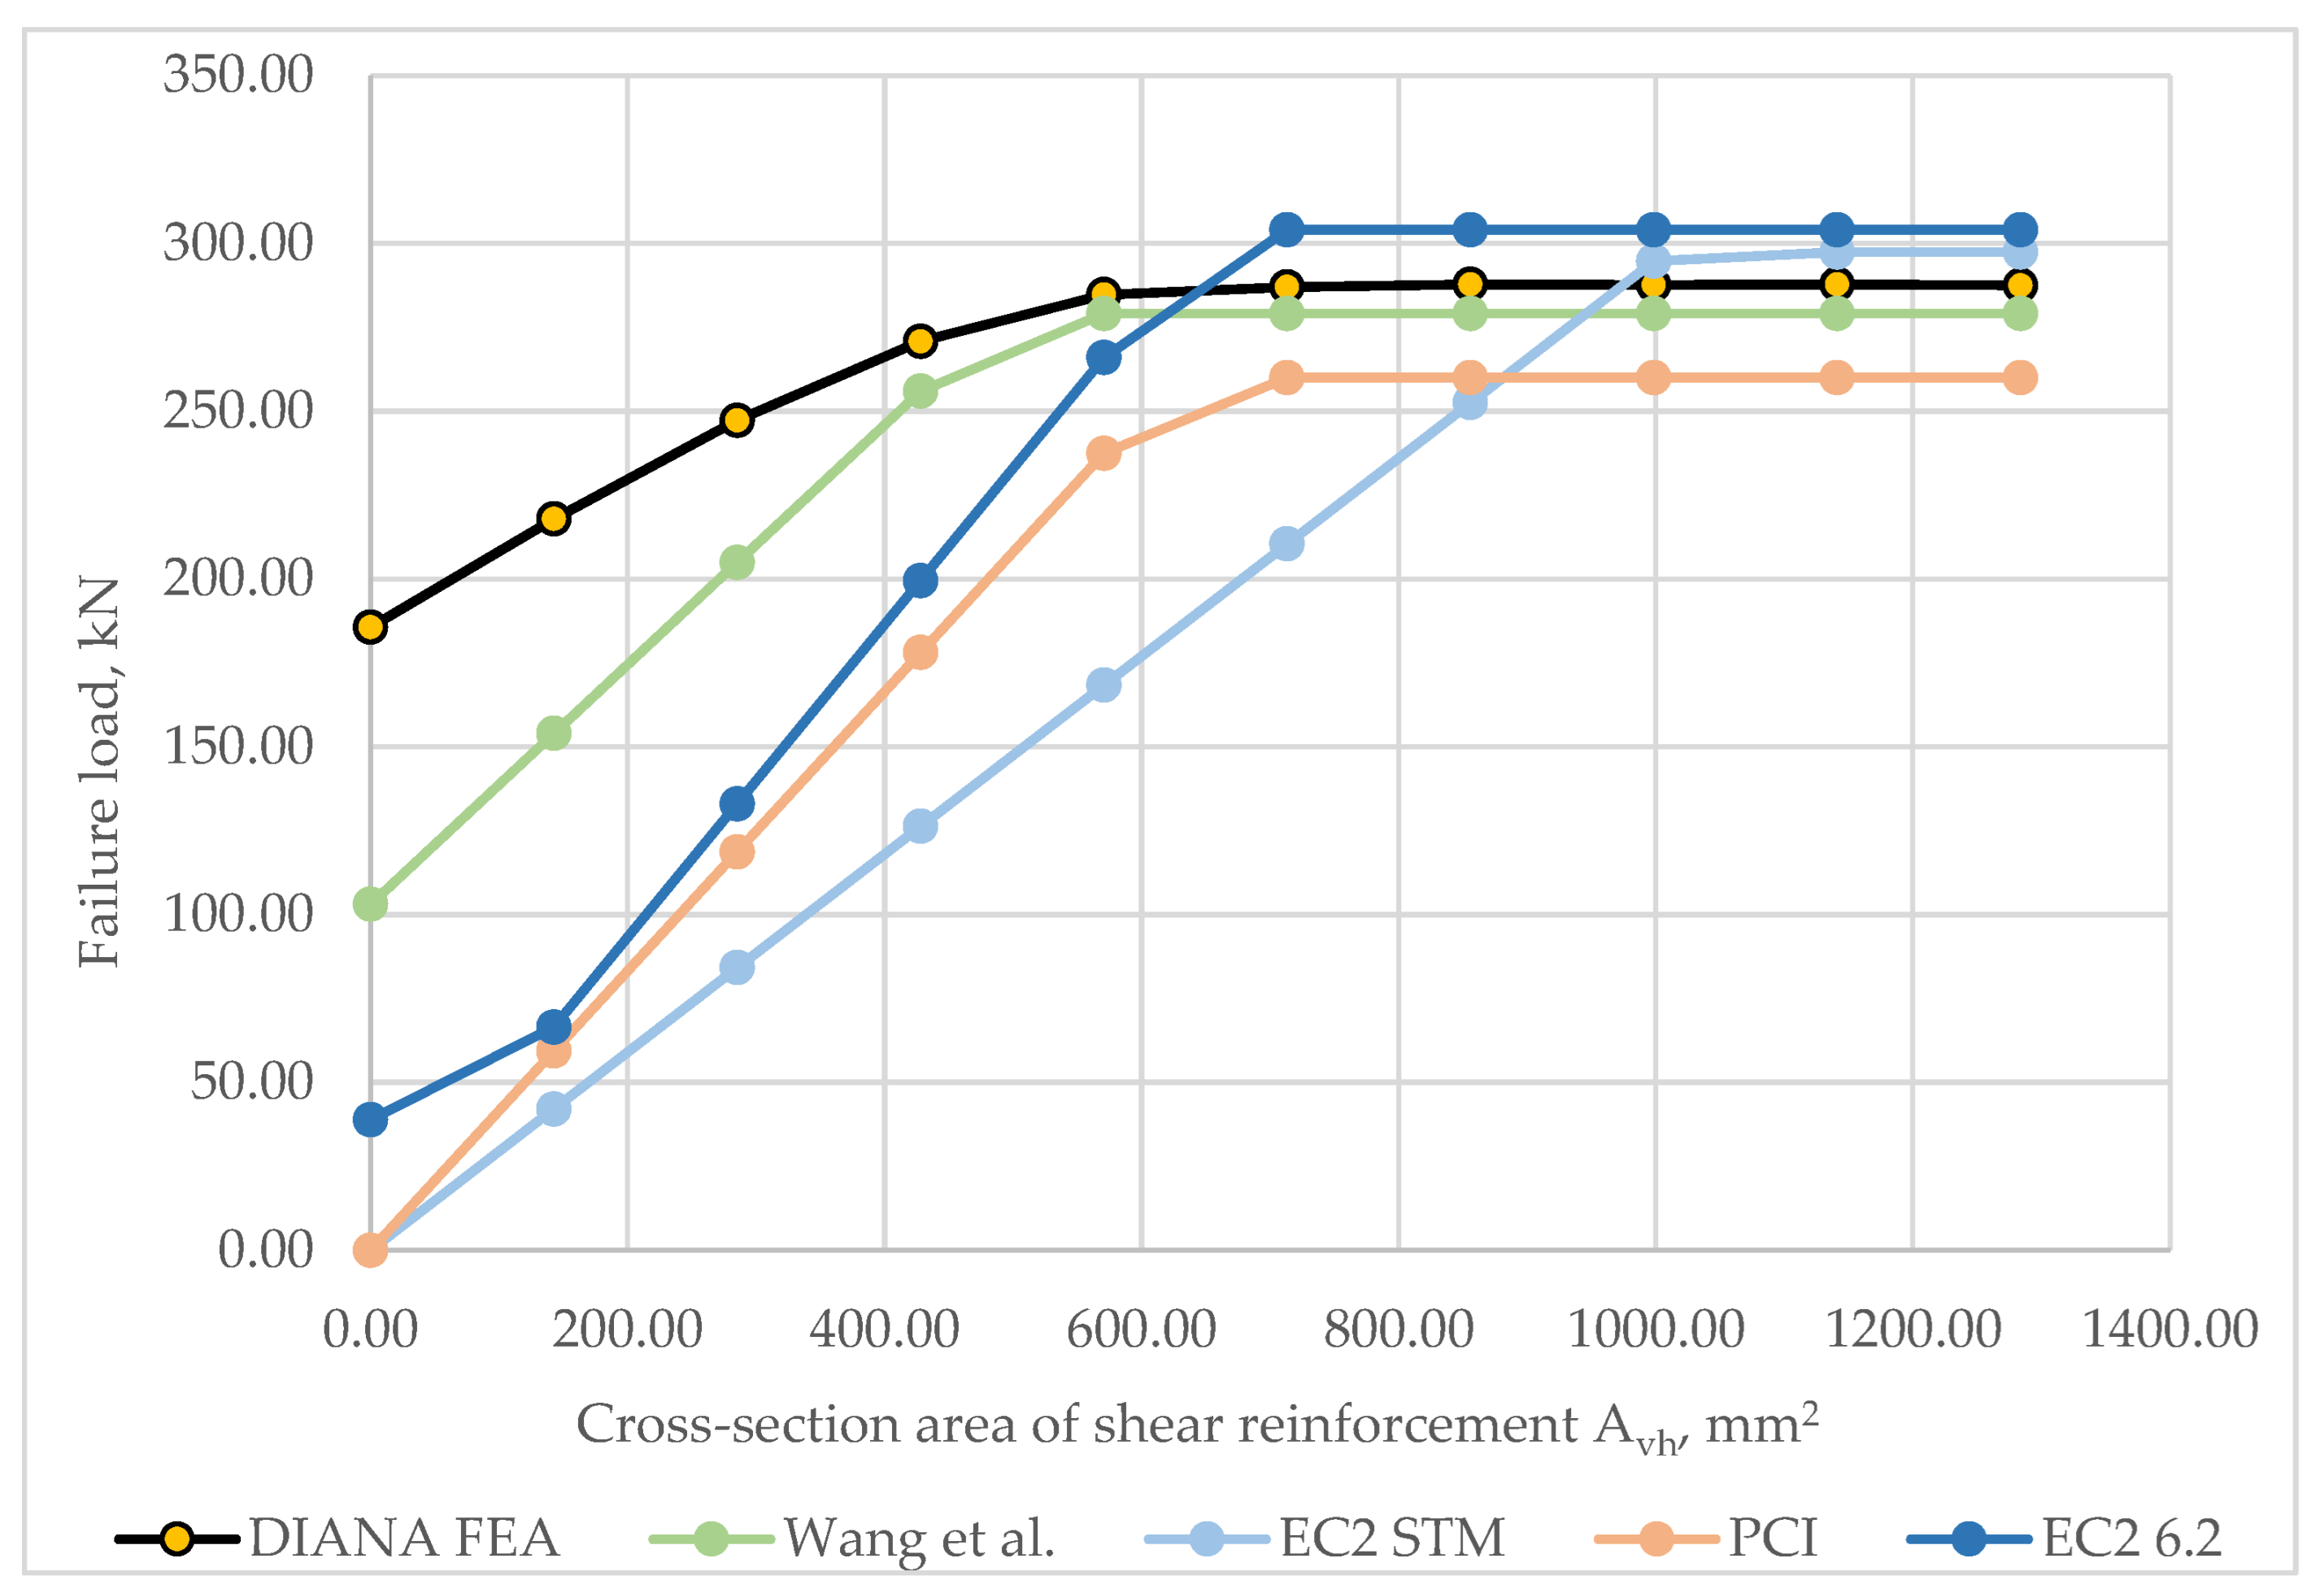
4.1. Parametric Analysis of the Failure Load

The parameters utilized in the parametric analysis are detailed in Section 2 and depicted in Figure 4. Comparisons with the prestressed model are conducted using distinct graphs.
The first parameter is the height of the dap h d . The comparison of the results is presented in Figure 10 and Figure 11 through the h / H ratio (ratio of the reduced height section to full height of the beam). The prestressed reinforcement results are provided in Figure 10. A ratio of 1.0 indicates that there is no dap and that the tendons cross the forming cracks, leading to a spike in the failure load, as seen in the DIANA FEA curve. With a ratio of 0.83 (and lower), the tendons do not cross the critical cracks, and thus, they do not impact bearing capacity. In terms of accuracy, when there is a dap, the Wang et al. method is the most closely aligned with the results of the non-prestressed numerical model. The EC2 STM and PCI calculations demonstrate the behavior of methods which evaluate the failure load with higher reserves for safety reasons. The EC2 method 6.2 overestimated the capacity at all points, except in cases where there was no dap.
The impact of prestressed tendons on the bearing capacity is shown in Figure 11, comparing the results of prestressed and non-prestressed reinforcement. With an h / H ratio of 1.0, the prestressed tendons compressed the critical cracks, leading to a 5.52% increase in the failure load, rising from 661.54 kN to 698.08 kN. However, when the prestressed tendons pressed on the wall of the dap, there was no increase in the bearing capacity. On the contrary, the tensile stresses induced at the re-entrant corner of the dap with a h / H ratio of 0.17 resulted in a 4.27% decrease in the failure load. The comparison between the numerical model and the analytical methods revealed that the EC2 6.2 method overestimated the bearing capacity in the presence of a dap.
The dap height can also be analyzed through the a / d ratio (shear span to effective height of the nib ratio) shown in Figure 12 and Figure 13. The results reflect typical, often described behavior: as the a / d ratio increases, the bearing capacity decreases [1,25,26,27]. Unexpected behavior can be seen when analyzing Figure 13. The bearing capacity of the structure decreased due to prestressing the most when a / d reached its highest value; however, according to the behavior described in the literature, when the a / d ratio increases, the failure usually occurs due to bending moments rather than shear [28].
Another analyzed parameter was the support placement point in the dapped end, which is expressed by the l s / l d ratio. The results are shown in Figure 14 and Figure 15. The trend of decreasing bearing capacity due to the increase in the l s / l d ratio can be compared to the previously described change in the a / d ratio. As the value of l s / l d increased, so did the a / d ratio, and, as a result, the failure load decreased, as is typical for such an element. Analyzing the results, the behavior of the non-prestressed numerical model most closely matches the results of the Wang et al. method. The calculated bearing capacity was slightly lower than the numerical model for all points, except for the 0.40 ratio. The EC2 6.2 section overestimated the bearing capacity when the support was in the range between the middle of the dap and the end of the nib. From Figure 14, the bearing capacity of the non-prestressed numerical model differed by 42.94% depending on where the supporting point was added to the dap, which most closely matches the change of the beam bearing capacity according to the Wang et al. method. The EC2 STM and PCI calculations demonstrated that the design methods evaluate failure loads with higher reserves.
A comparison of the impact of the l s / l d ratio on the bearing capacity between the prestressed reinforcement model and the non-prestressed one is shown in Figure 15. The results show that at boundary ratio values, prestressing had an impact on the bearing capacity. When the ratio was smallest, i.e., l s / l d = 0.20 , the bearing capacity decreased by 2.03%. When the ratio was equal to 0.8, the bearing capacity decreased more, or about 3.27%.
The fourth parameter studied was the concrete strength f c . The results are shown in Figure 16 and Figure 17. The primary distinction between the behavior of the numerical model and the analytical calculations is that the bearing capacity did not cease to increase in the numerical model as the concrete strength rose. This is attributed to the fact that the yield strength of the shear reinforcement was not reached in the numerical model. This observation is corroborated by Figure 17, which illustrates that the increase in shear reinforcement quantity did not enhance the bearing capacity beyond the 570.64 mm2 amount.
This increase in the bearing capacity of the non-prestressed numerical model can be divided into two parts. At lower concrete strengths, its influence was significantly greater than when the corresponding strength value was reached, which was between 25 MPa and 33.7 MPa. Beyond this point, the bearing capacity increased less significantly and practically in a linear relationship. The results of the non-prestressed beam analyzed with the PCI and Wang et al. analytical methods indicate that concrete strength was not the limiting parameter of the bearing capacity in this dapped-end configuration. The determined failure mode for these methods (shown in Figure 3) did not take into account the influence of the concrete’s strength. EC2 analytical methods indicate that the concrete’s strength had a significant impact on bearing capacity at lower concrete strengths, which is in alignment with the behavior observed in the numerical model.
The effect of prestressed reinforcement is shown in Figure 17. At lower concrete strengths, the prestressing had a significant impact on the bearing capacity. The lower the concrete strength, the more sensitive the element was to prestressing. The largest decrease in the numerical model was observed when the concrete strength was at 20 MPa, leading to a 4.01% decrease in bearing capacity compared to non-prestressed. The effect became less significant when the concrete strength was increased by 5 MPa, resulting in a 1.74% reduction in failure load. With higher concrete strength, the impact of prestressing on the bearing capacity became negligible, as shown in the results.
The fifth parameter analyzed was the amount of shear reinforcement A v h . The results are presented in Figure 18 and Figure 19.
The results show that there is a threshold of shear reinforcement quantity beyond which the bearing capacity no longer increases. The key difference between the numerical model and the analytical calculations is that, when the shear reinforcement is low, the analytical methods did not accurately evaluate that the longitudinal and horizontal reinforcements take over the forces that would have been carried by the shear reinforcement. The Wang et al. method most closely represents the behavior of the non-prestressed numerical model.
Figure 19 illustrates the effect of prestressed reinforcement on the bearing capacity. The results showed that as the amount of shear reinforcement decreased, the impact of prestressing on the bearing capacity became more pronounced. With no shear reinforcement ( A v h = 0 ), the bearing capacity had decreased by 4.27%. When two 9.53 mm diameter reinforcing bars were added to the numerical model, the decrease in bearing capacity was reduced to 2.54%.

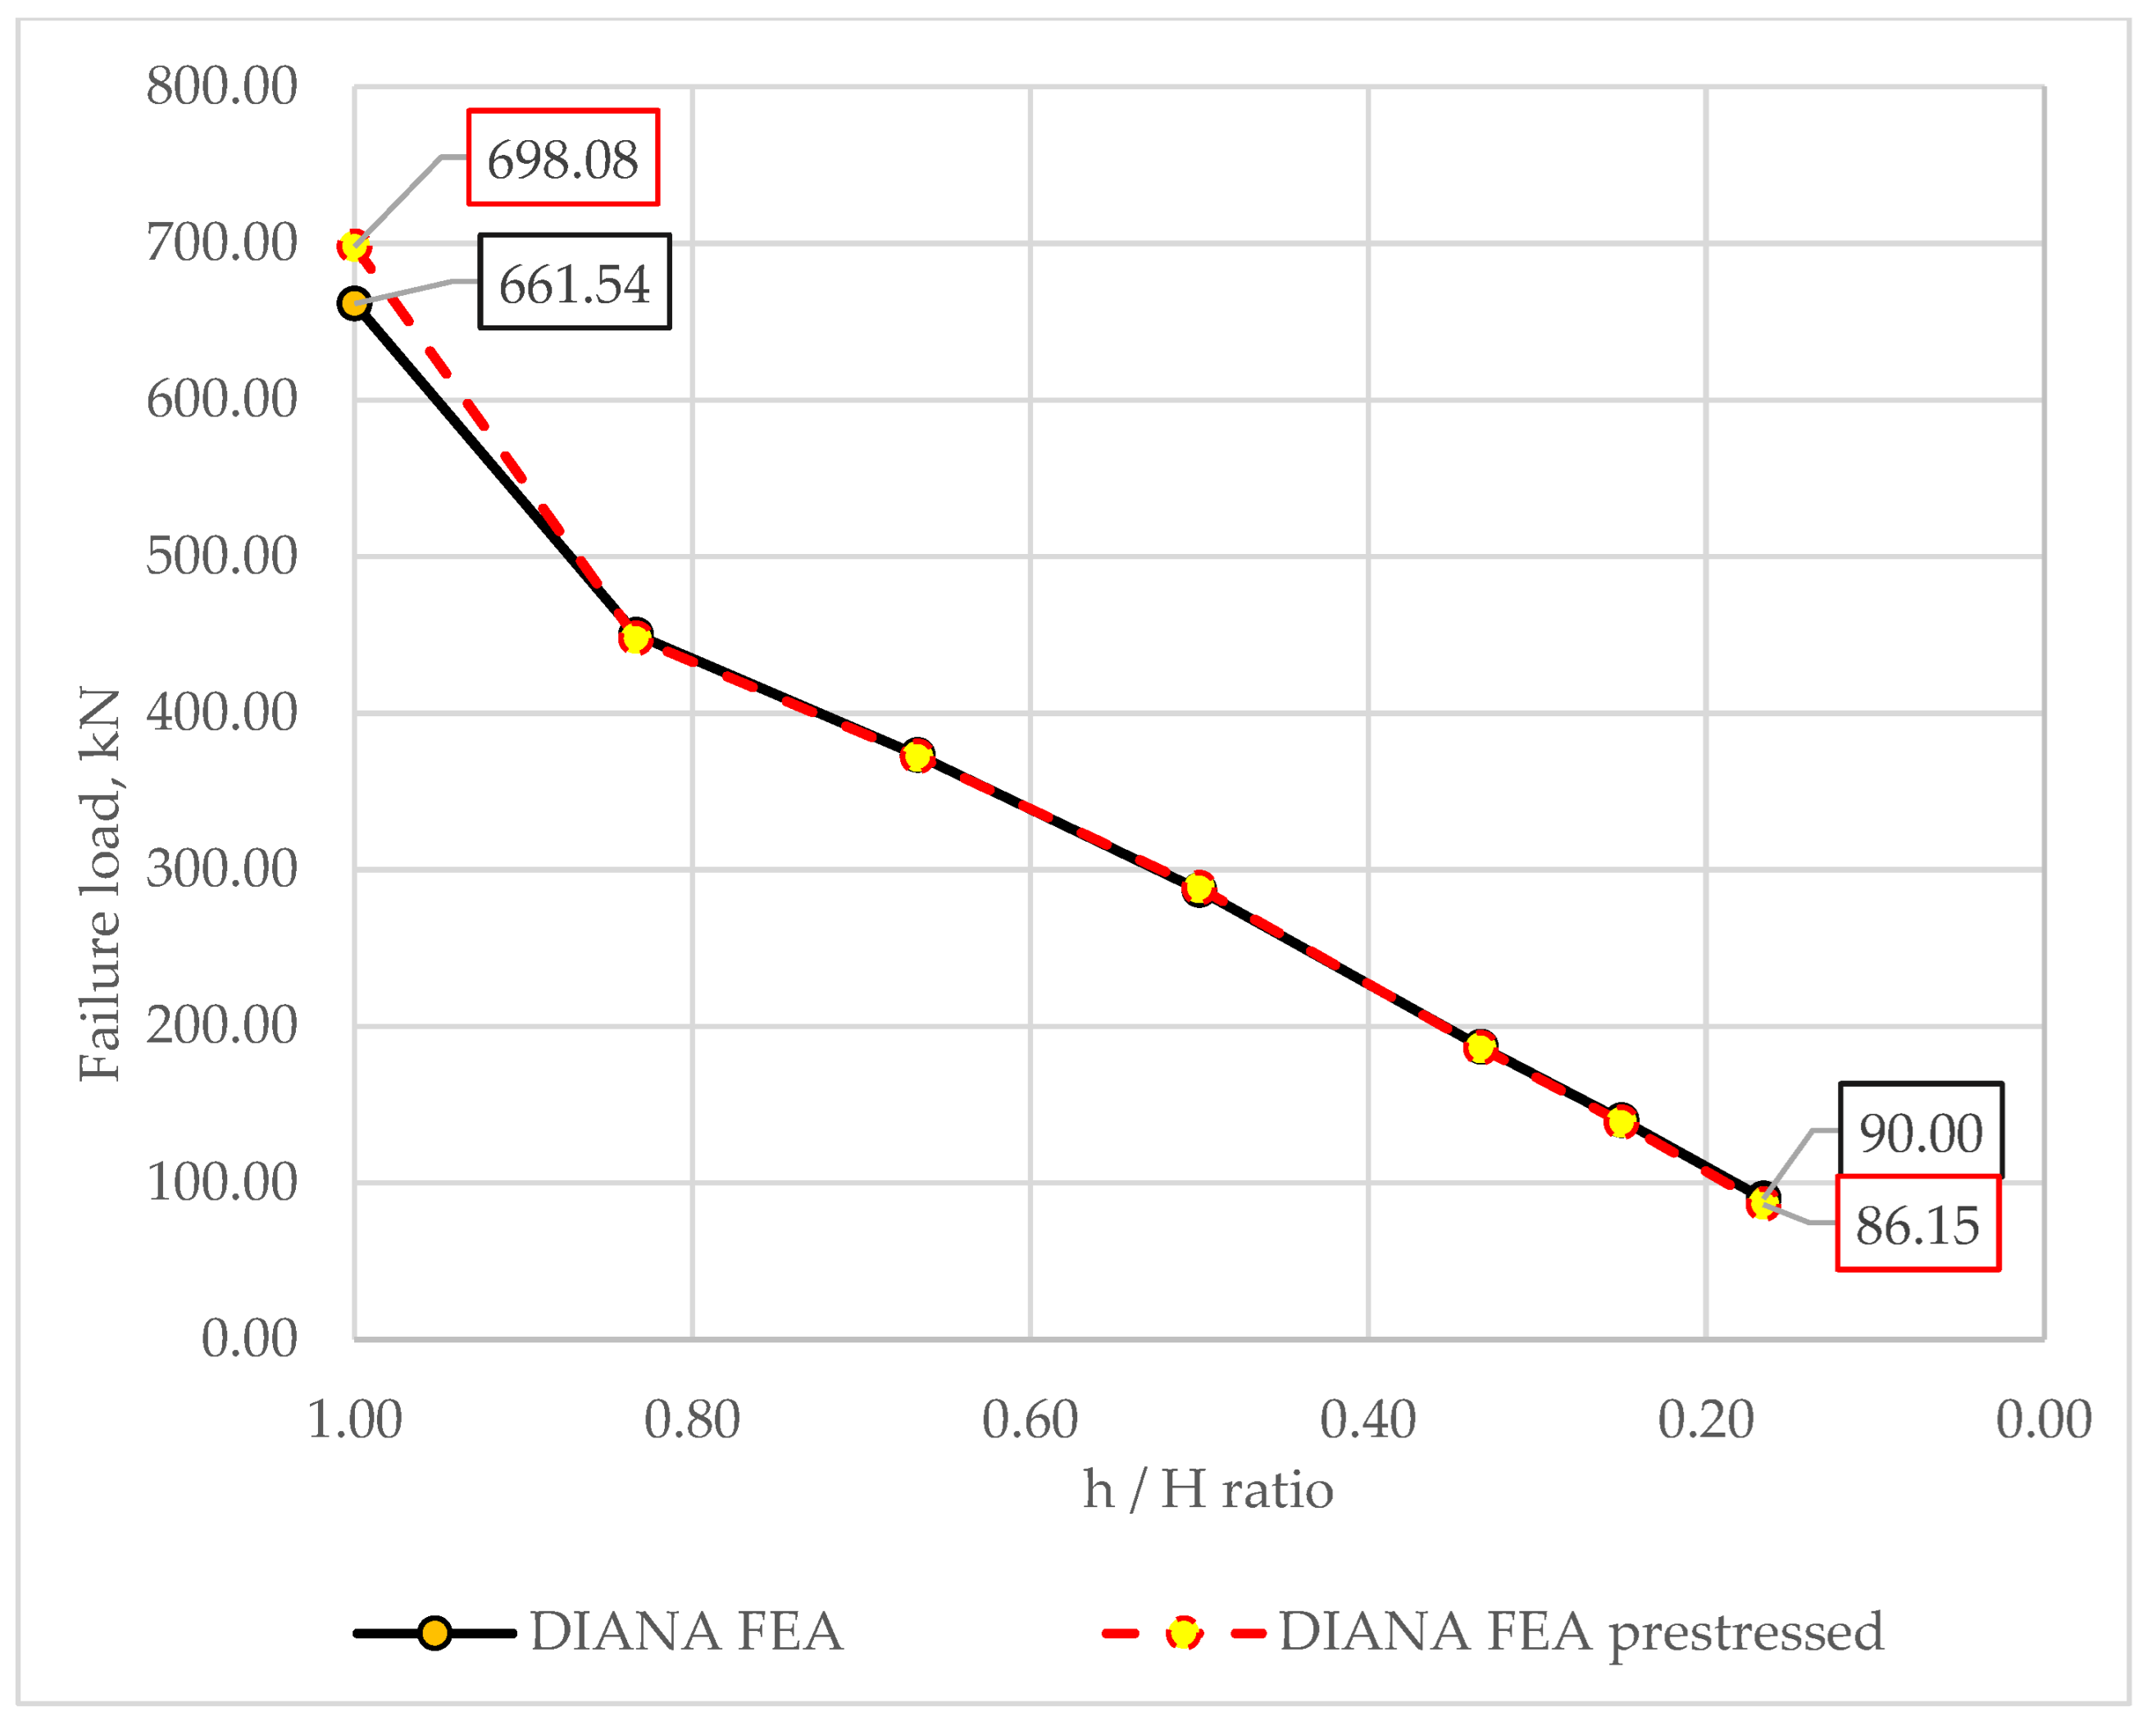
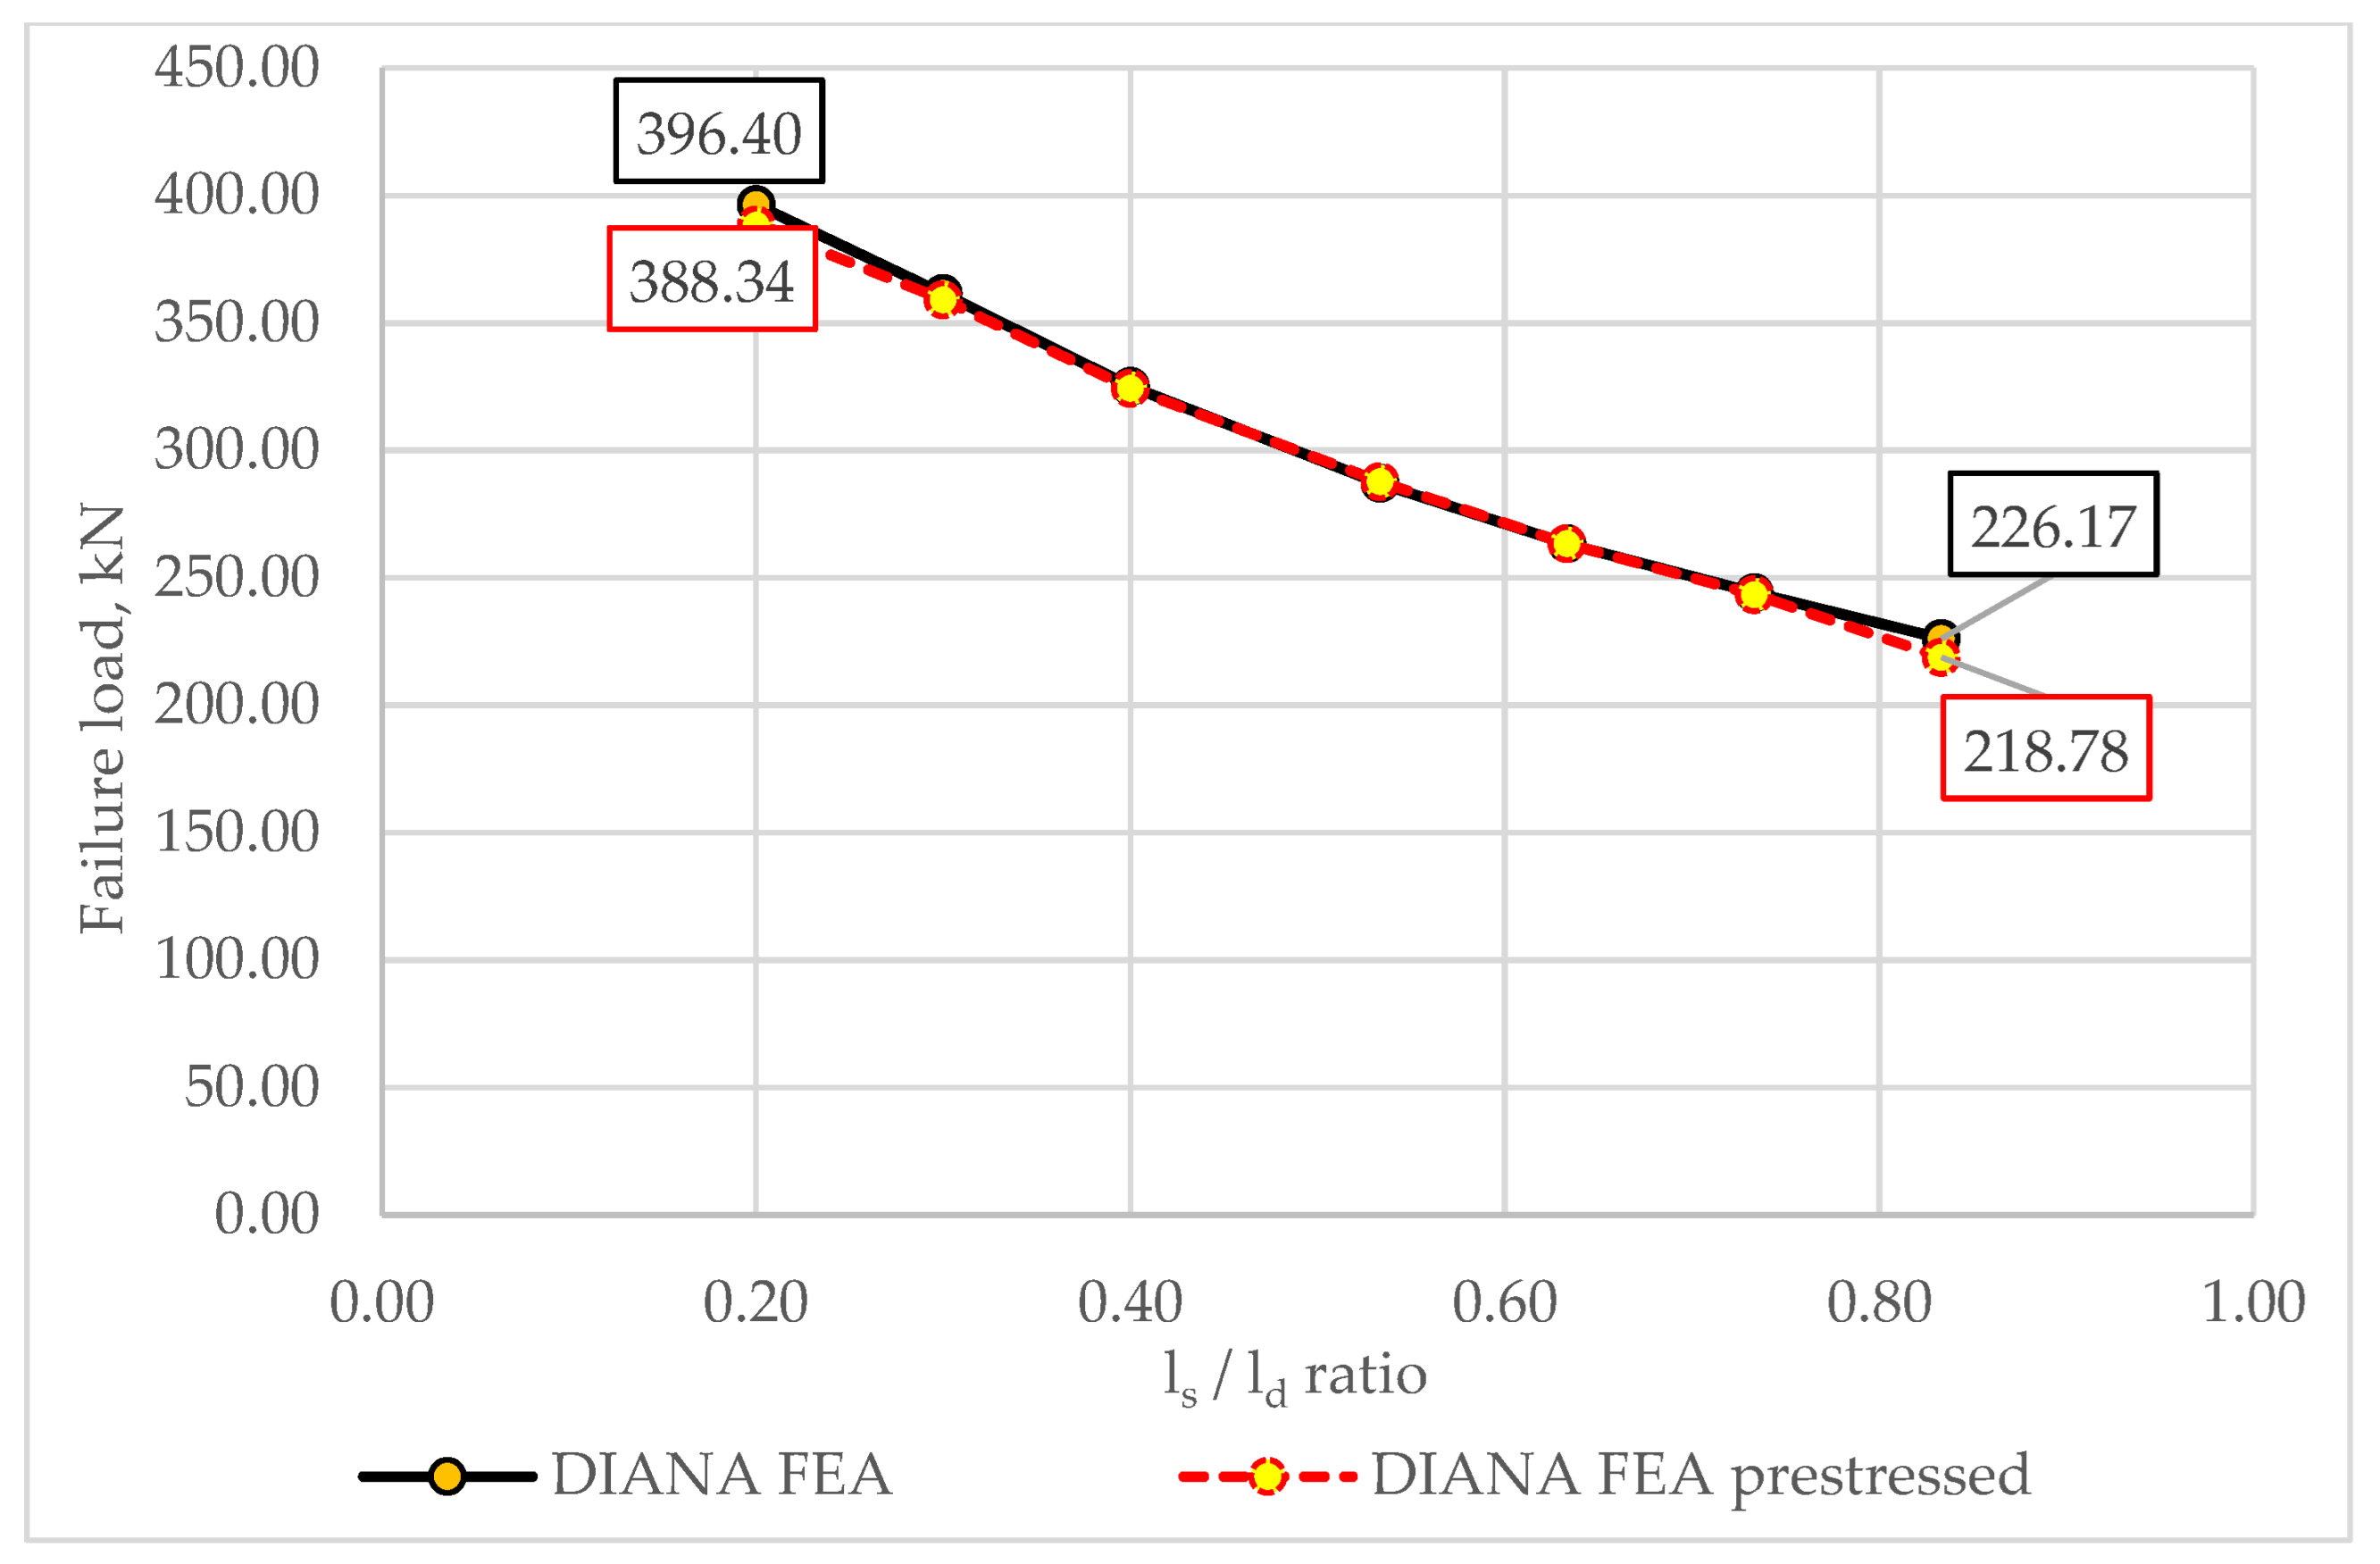
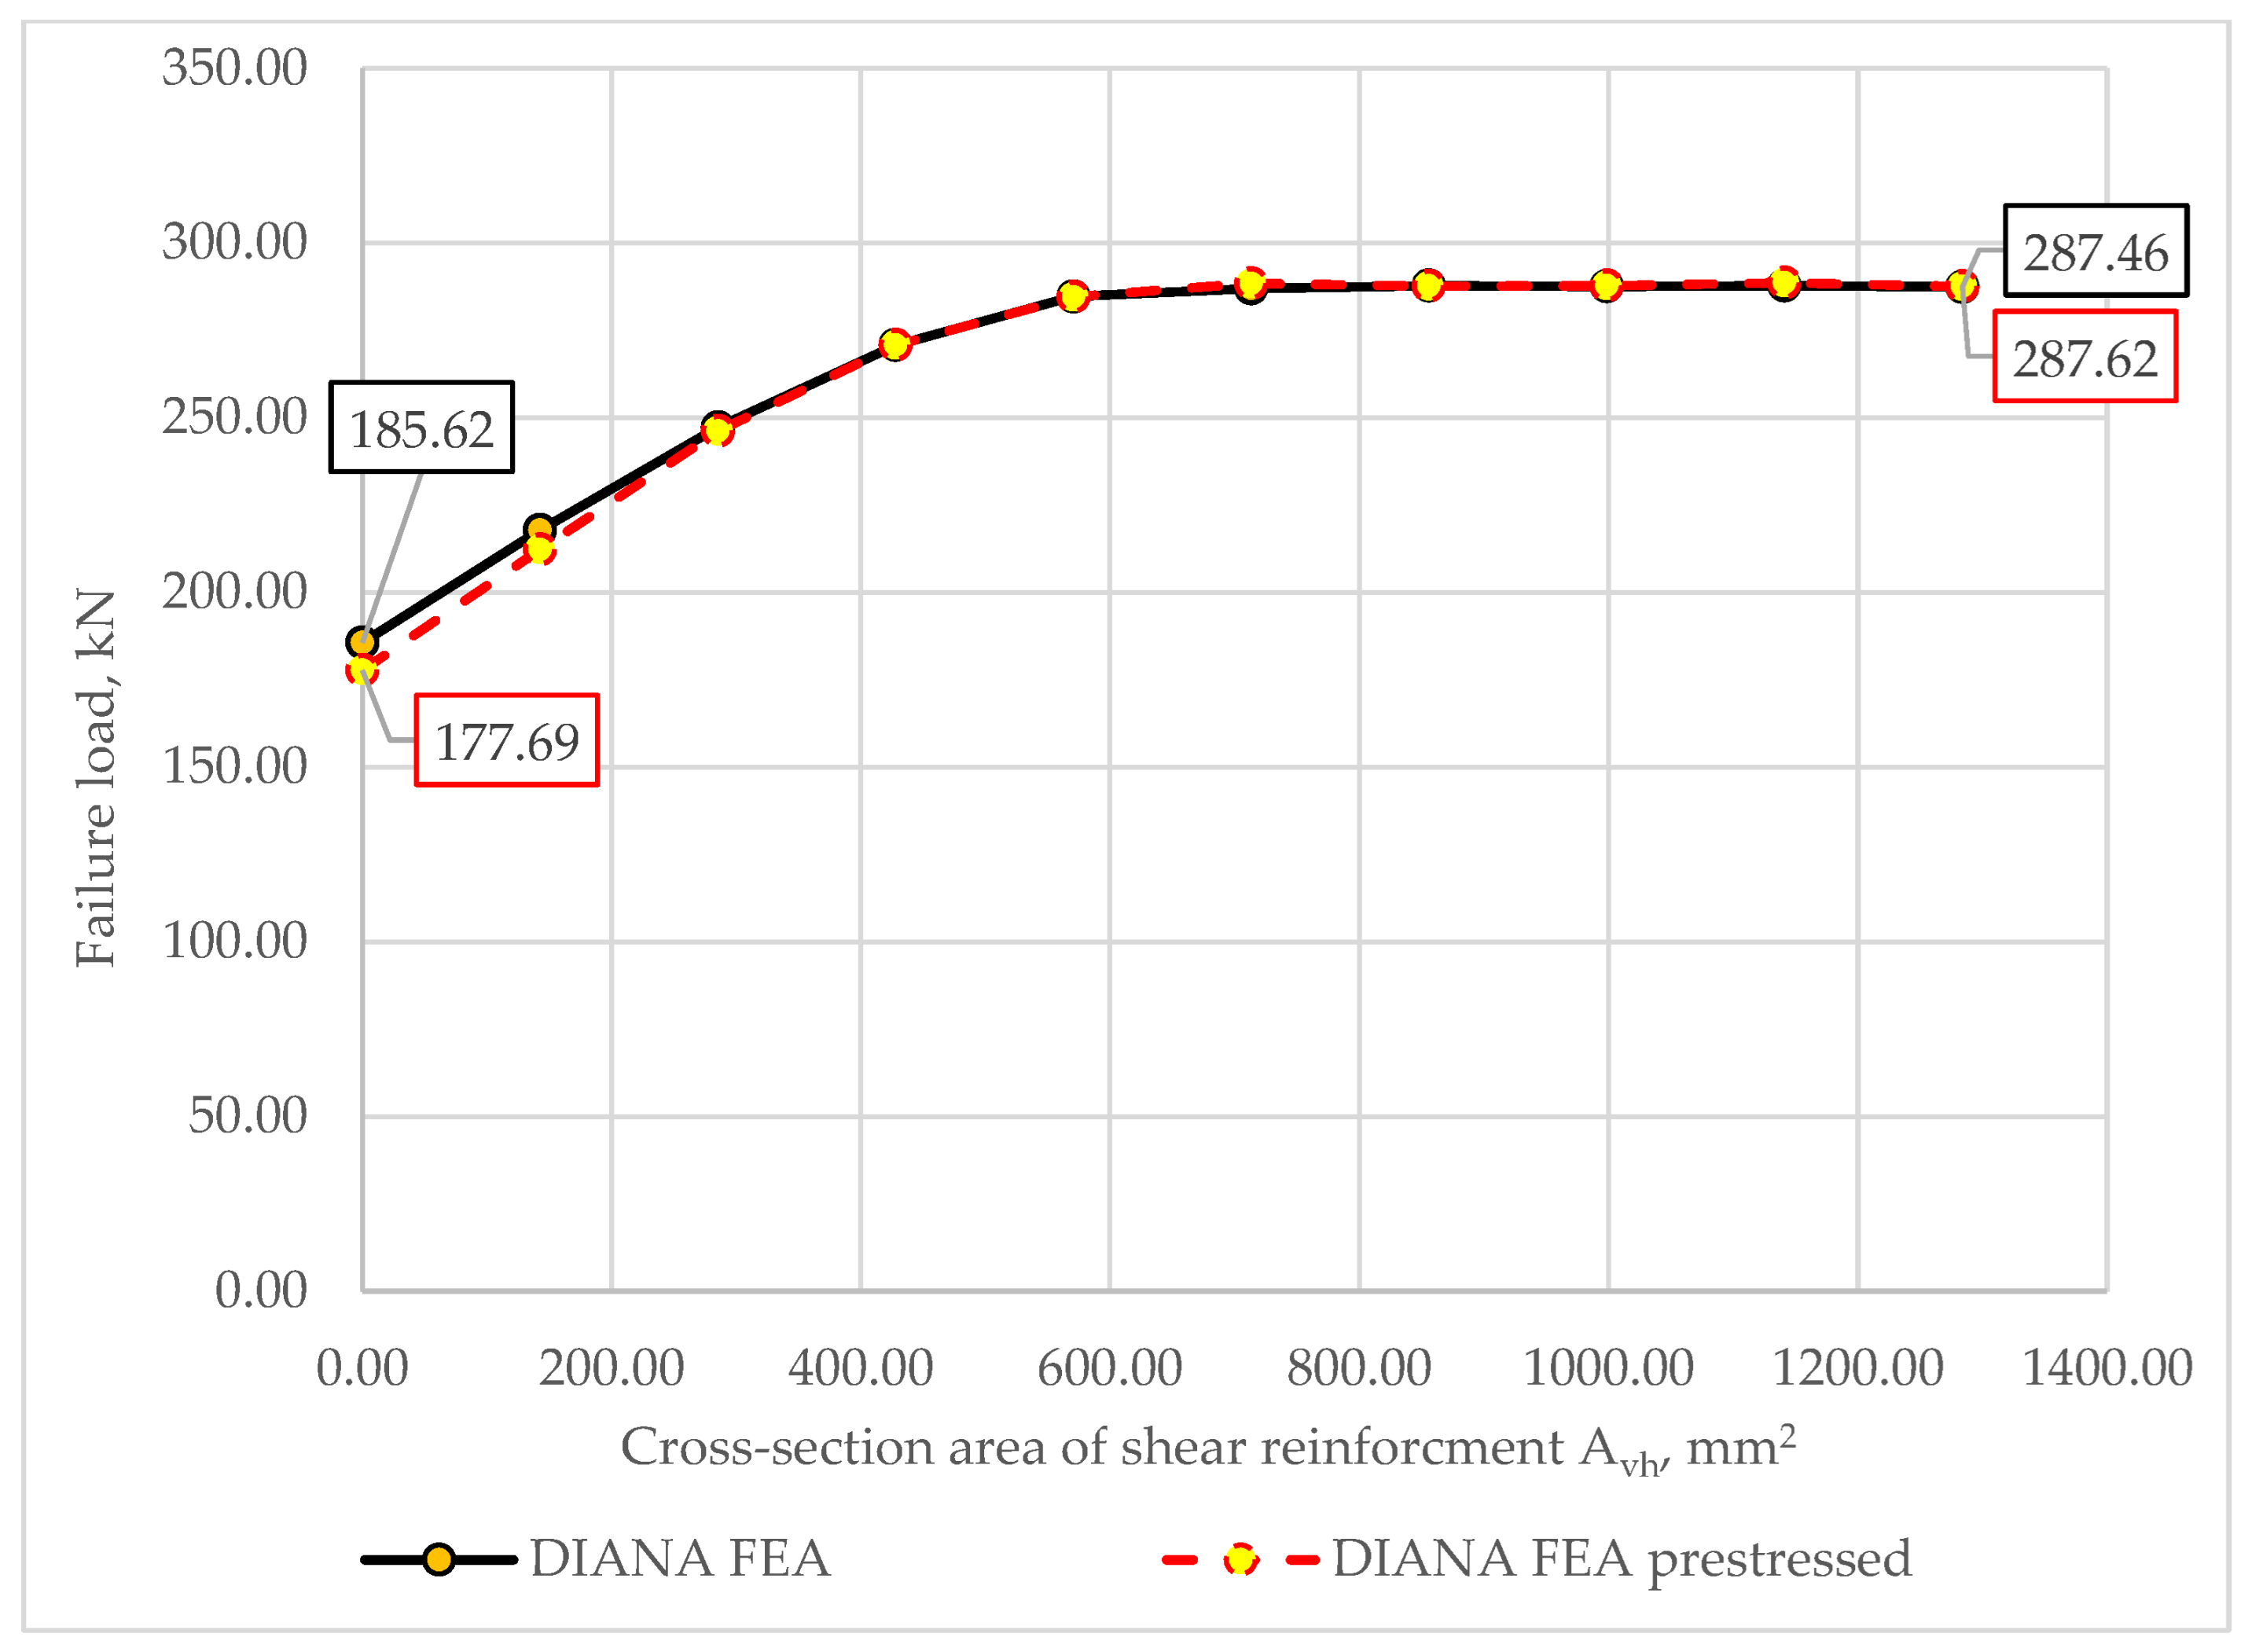
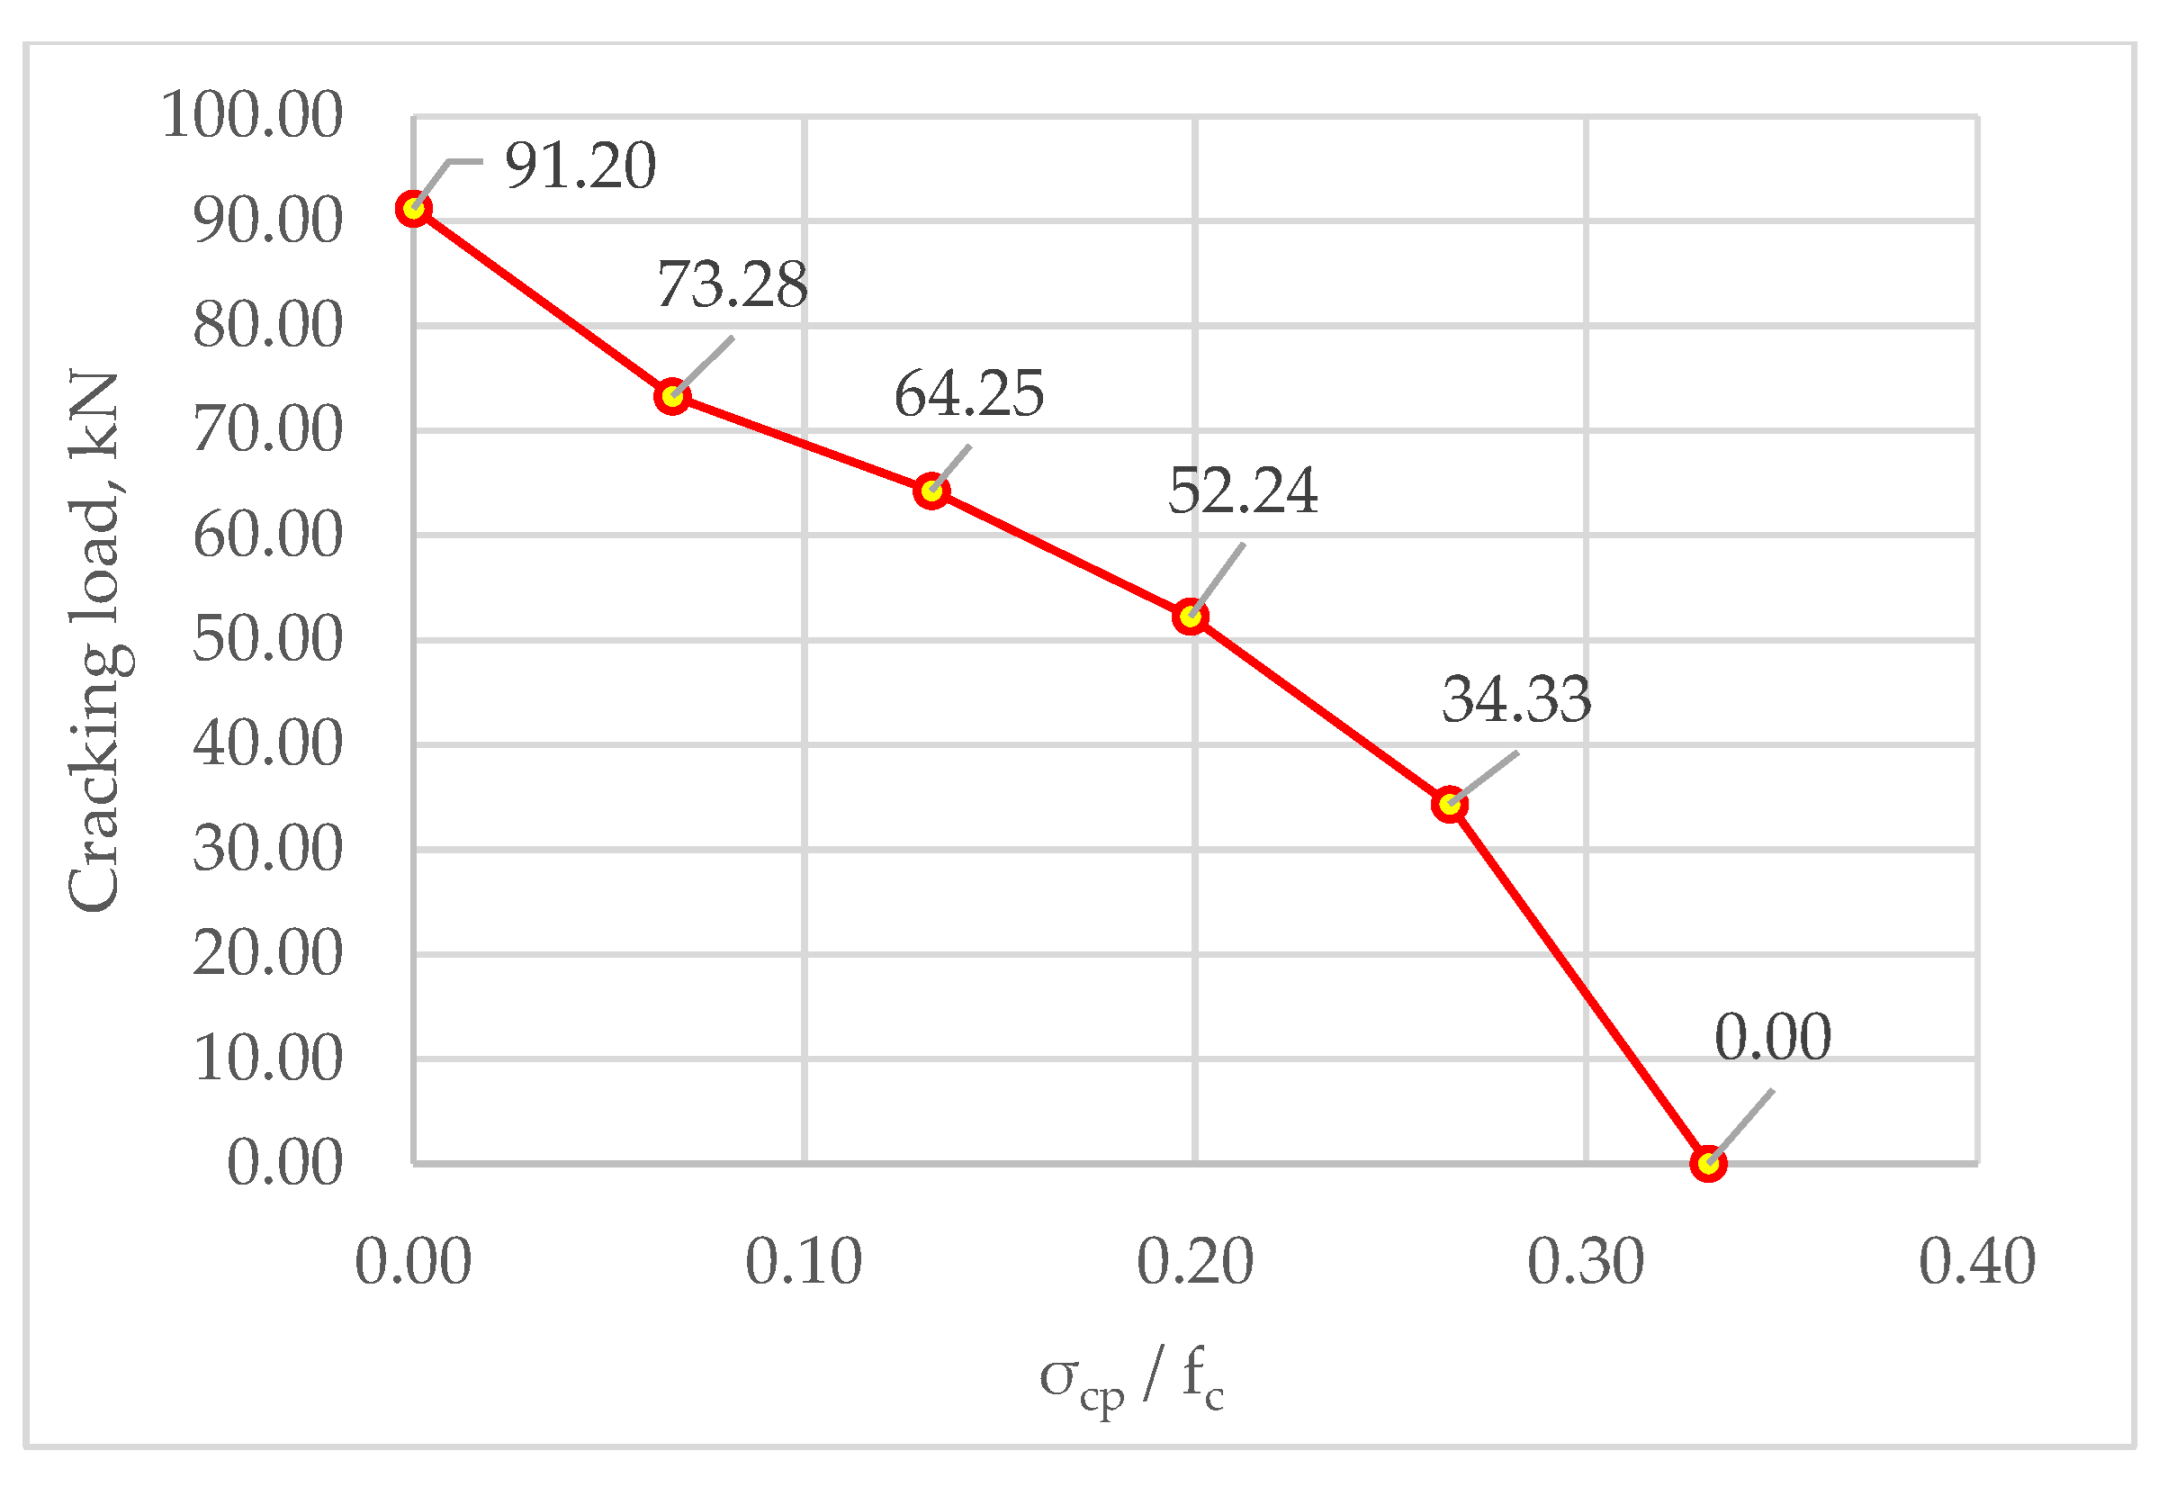
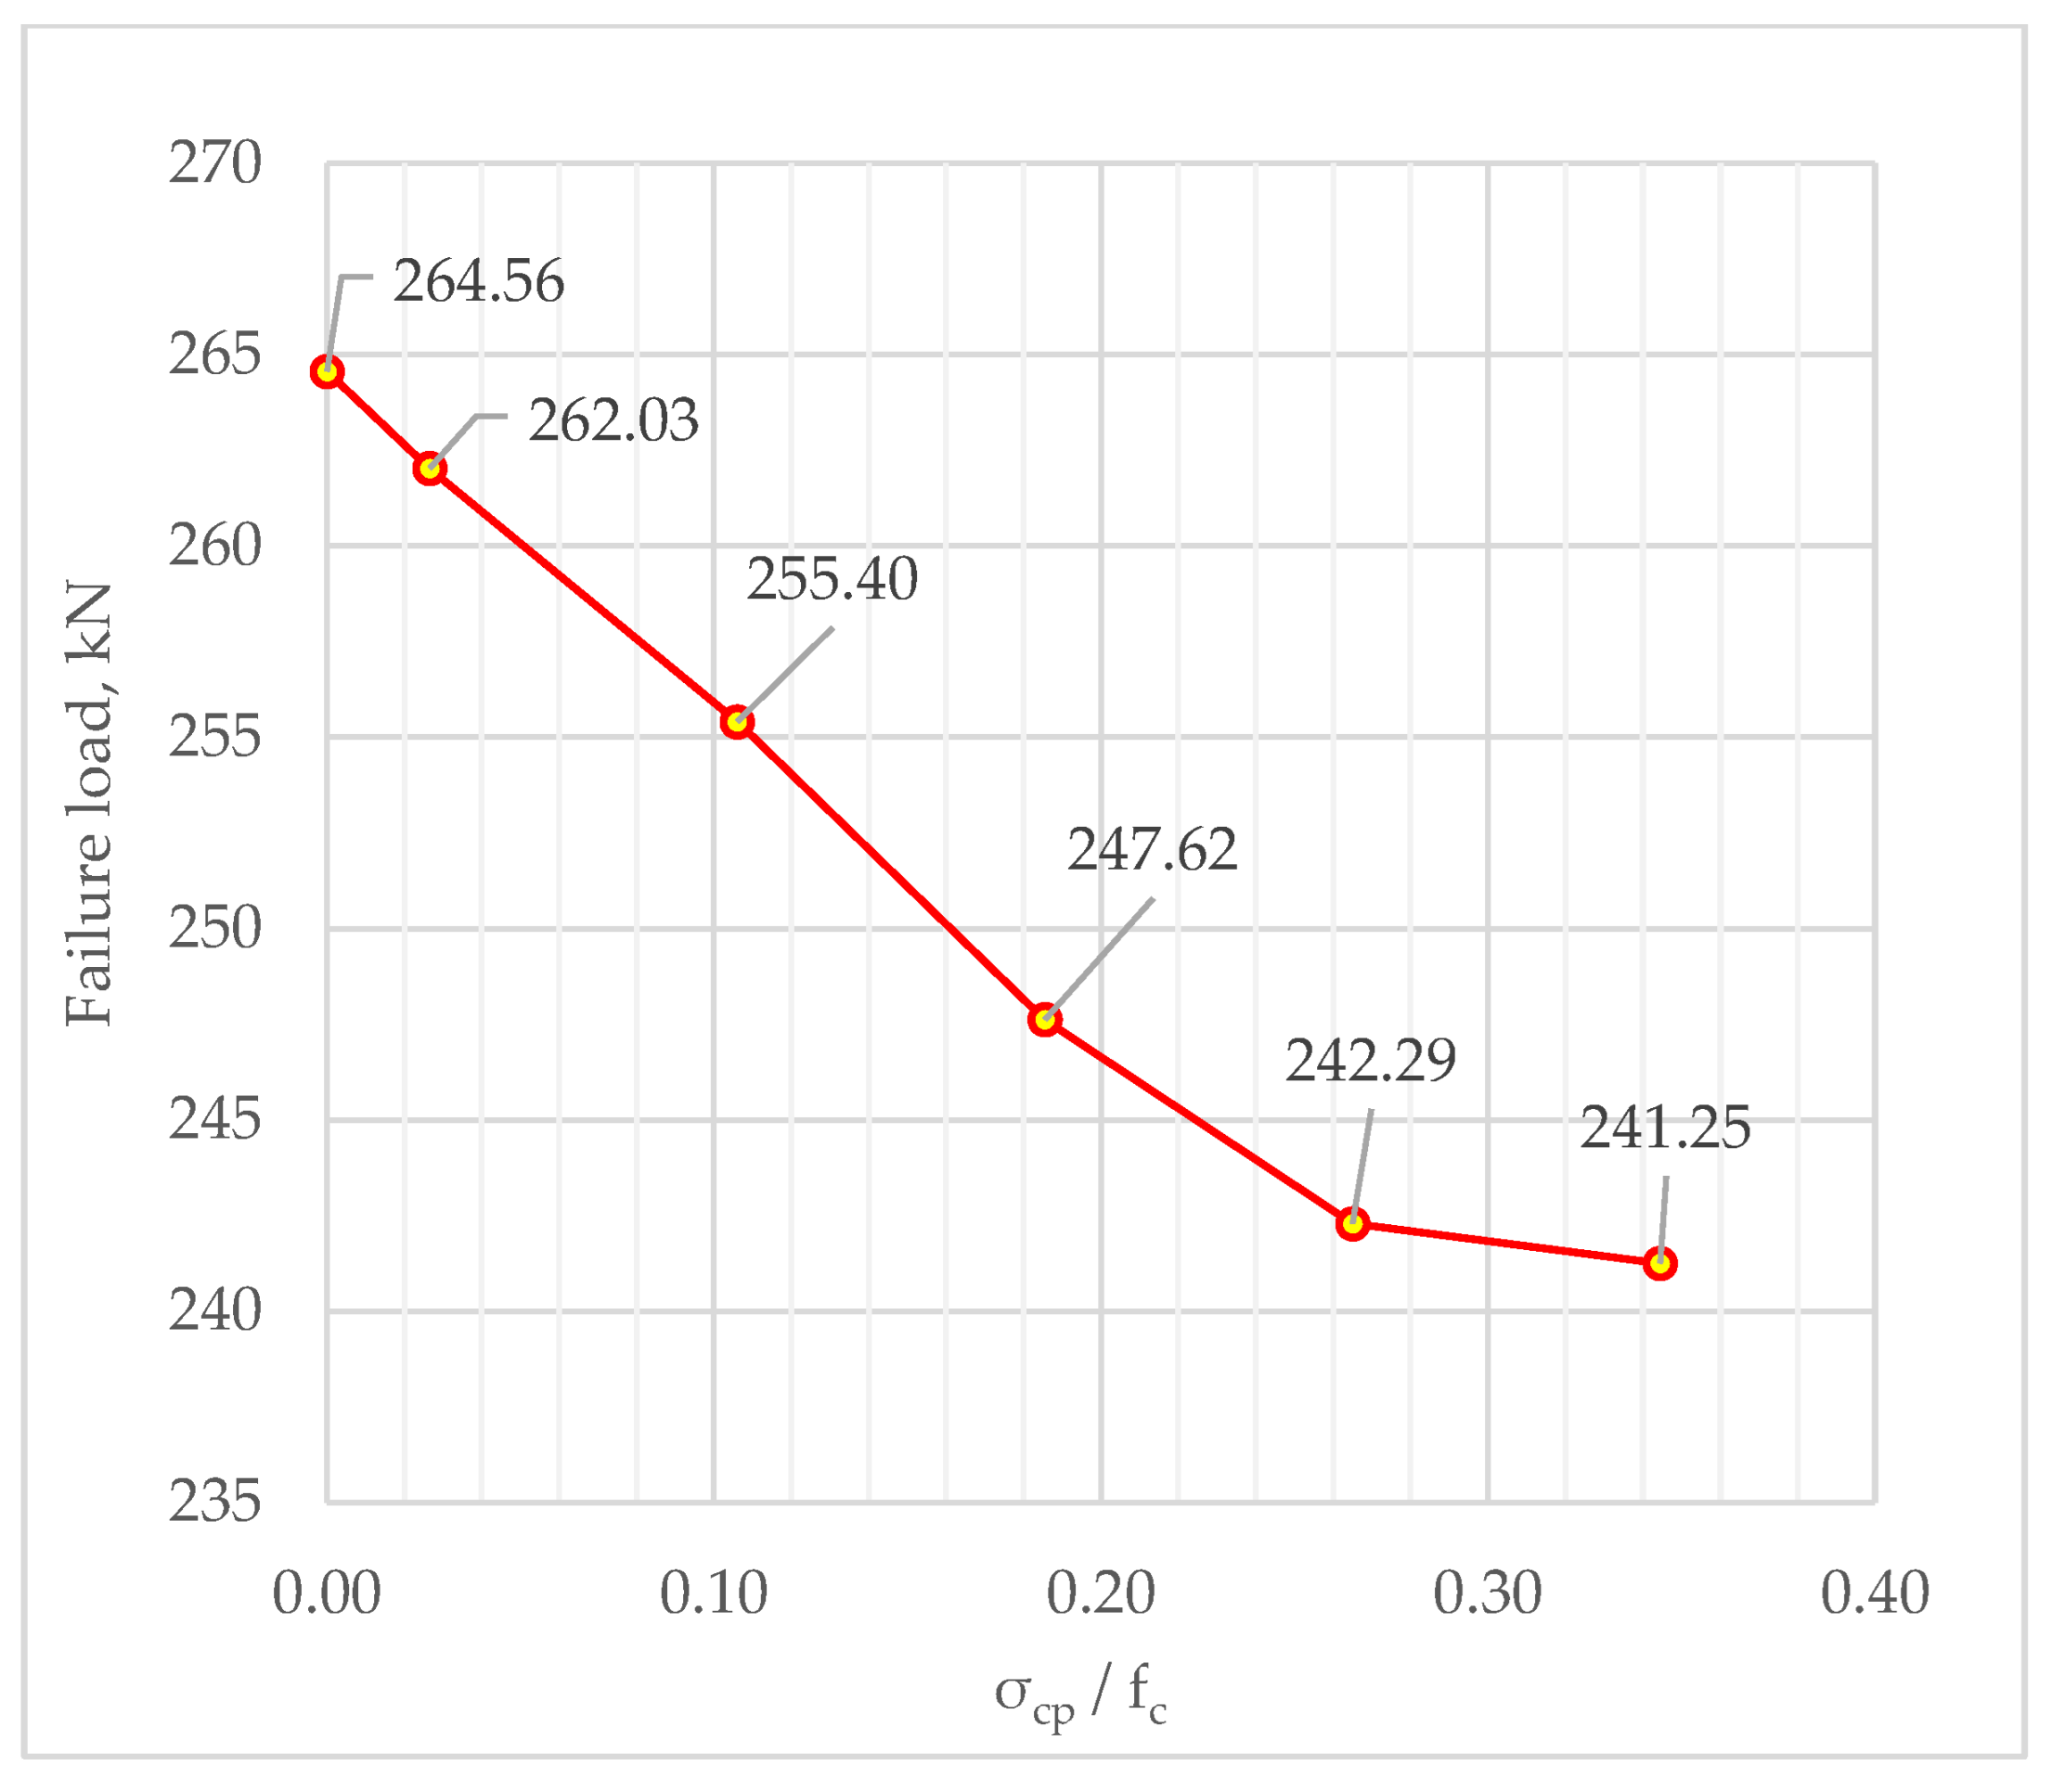
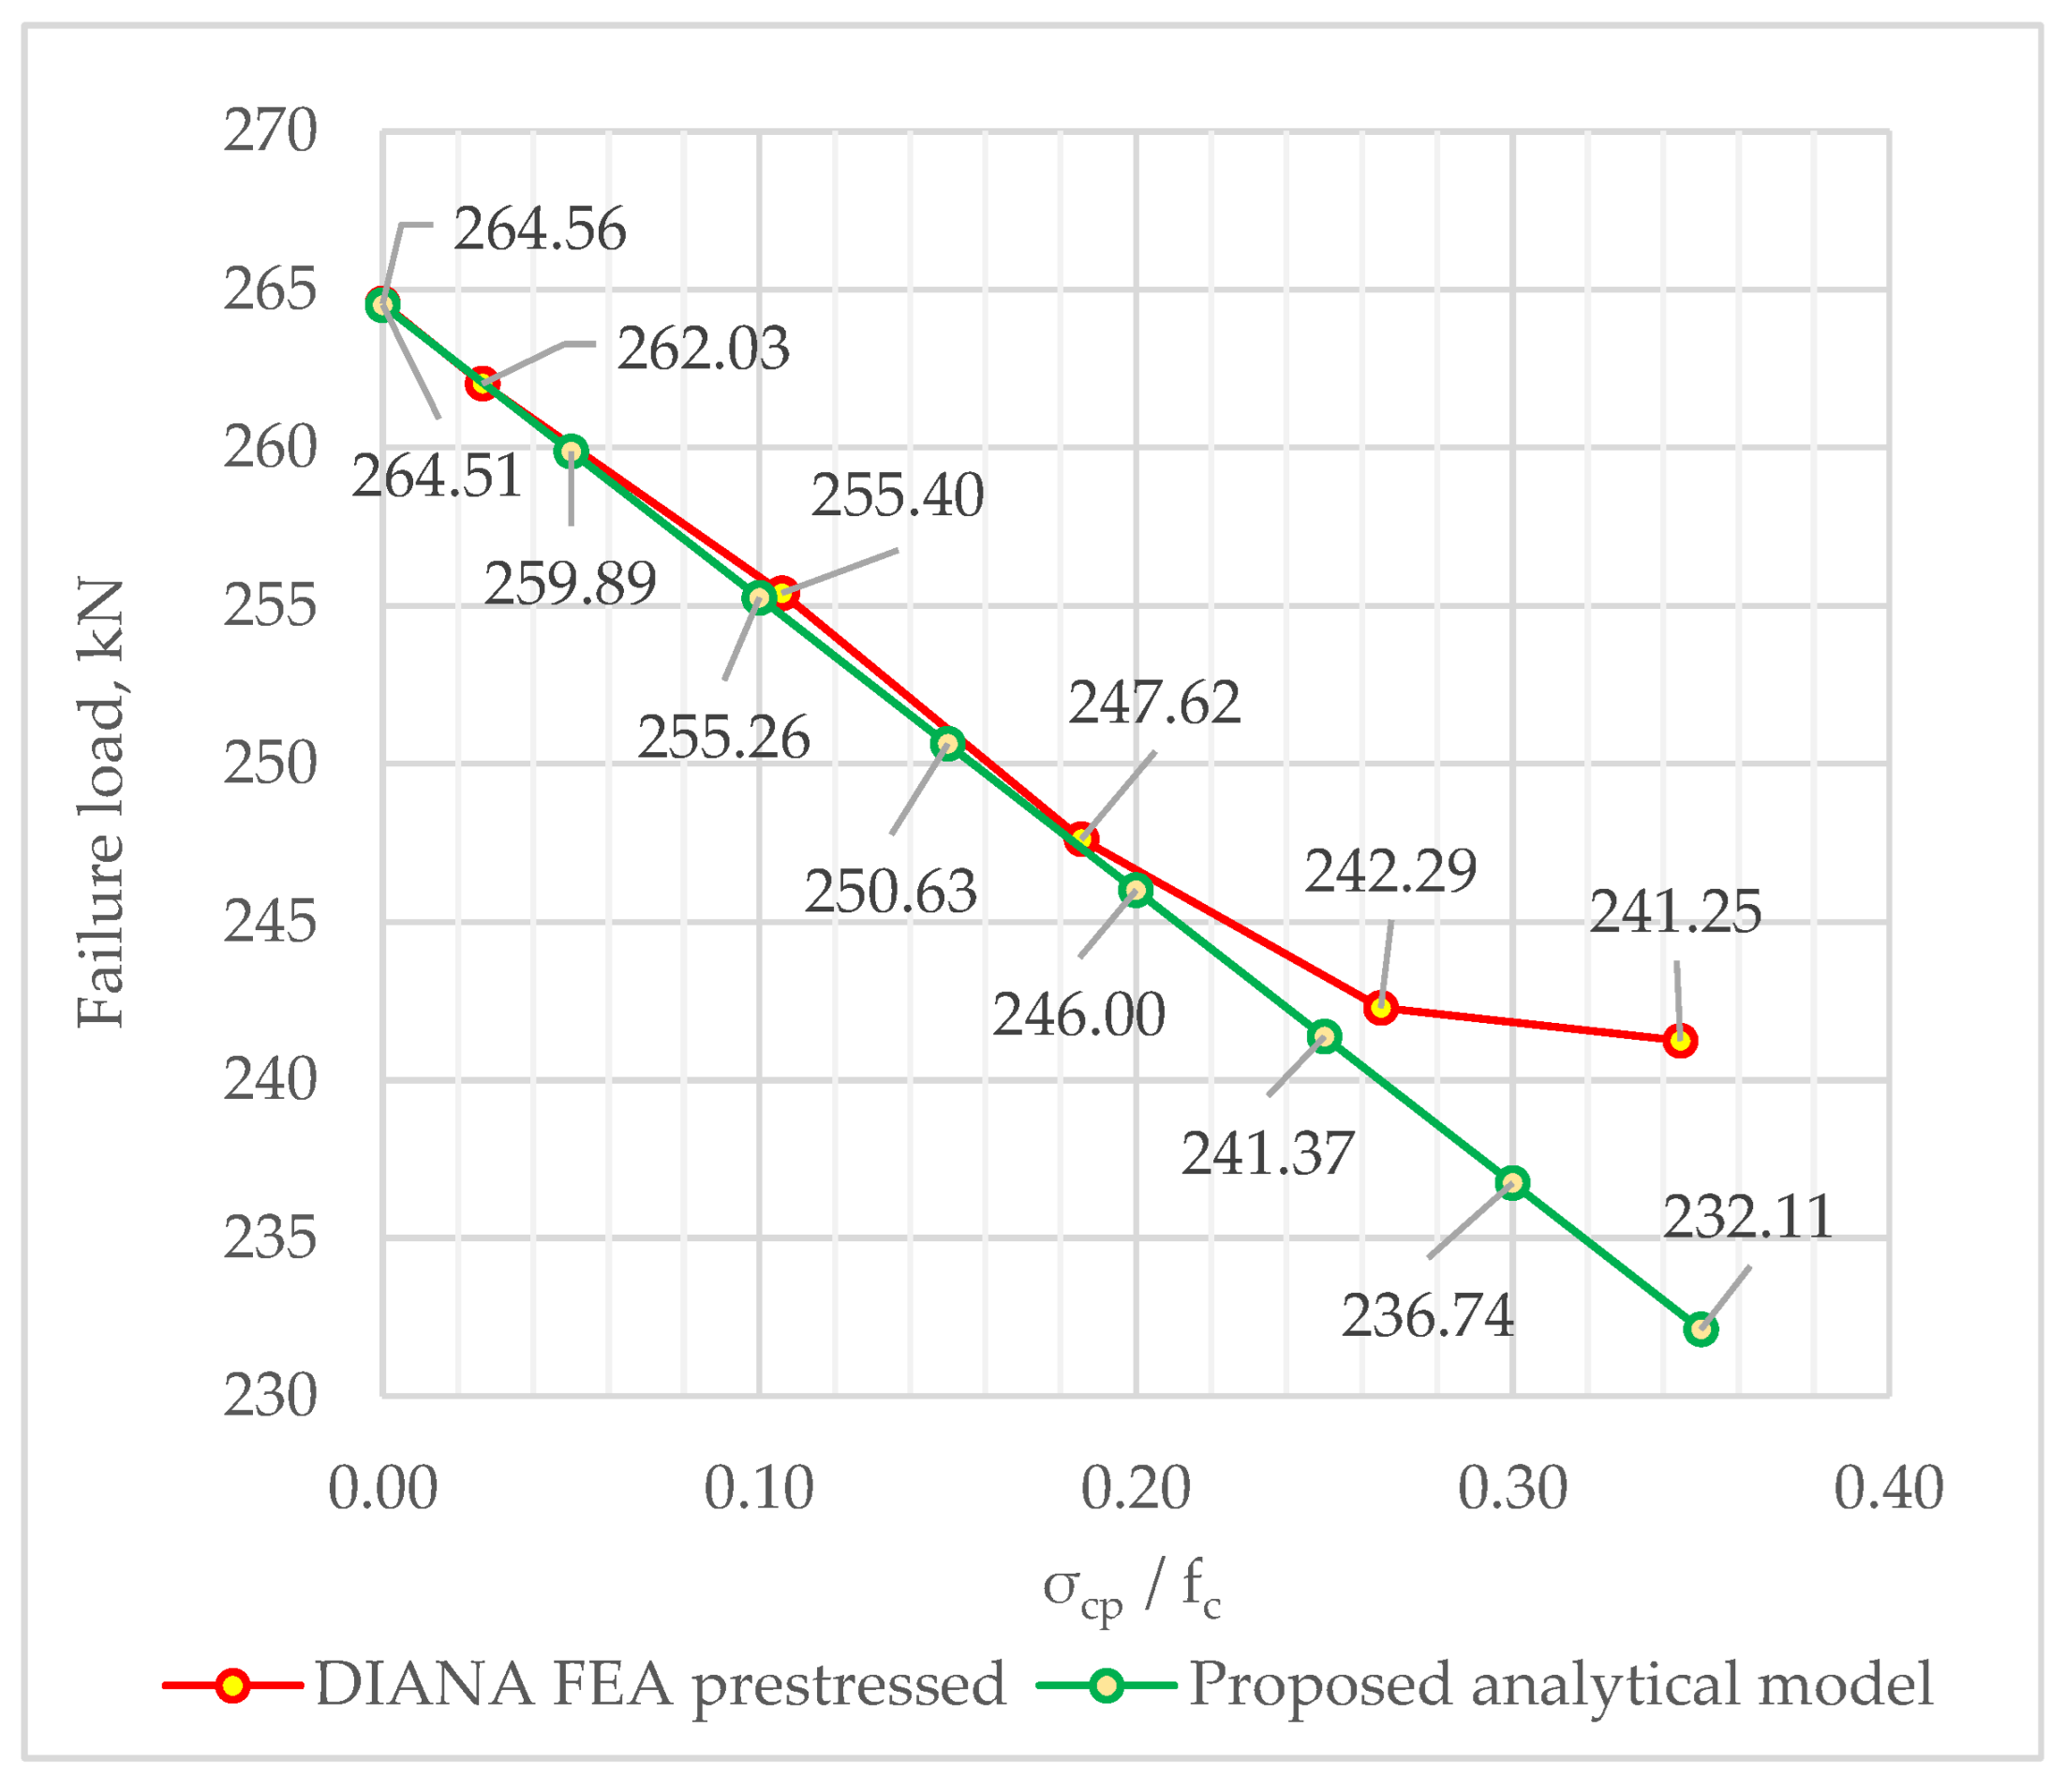
4.2. Impact of Prestressing Intensity

Numerical analysis revealed premature cracking at the re-entrant corner of the dapped end. To assess the severity of this effect, another parameter was analyzed: the load causing crack formation, based on the intensity of the prestress. The beam was loaded until cracking occurred at the re-entrant corner. Figure 20 depicts the relationship between the cracking load at the re-entrant corner and the compressive stress ratio ( σ c p / f c m ), the ratio between the compressive stress caused by prestressed reinforcement and the average compressive concrete strength.
The first crack was observed to have occurred at a load of 91.20 kN, which corresponds to 31.62% of the maximum load. This is in accordance with the studies of Desnerck et al. [25], who specified a range of 27–42% of the maximum load, and Barton [29], who indicated a range of 20–33% of the maximum load for the formation of the first cracks at the re-entrant corner. The results of this prestressing intensity analysis suggest that the tensile stresses induced by the prestressed reinforcement significantly reduced the resistance to cracking at the re-entrant corner. A reduction of approximately 50% of the cracking load was observed when the compressive stress ratio was in the 0.20–0.25 range. Furthermore, at around a 0.30–0.35 ratio, the formation of cracks at the re-entrant corner of the numerical model was observed during the prestressing release stage before the beam was subjected to an external load.
The final numerical analysis was performed to determine the significance of the force P2 shown in Figure 2 for the bearing capacity of the dapped-end beam. The drawings of the model are shown in Figure 6 and the parameters are depicted in Figure 4. The distance l s = 80 mm and the shear reinforcement A v h = 144.66 mm2. The beam model is illustrated in Figure 21.
The analysis was performed with the application of prestress at varying intensities. Shear failure mode was observed in the results of the nonlinear numerical analysis. This is evidenced in Figure 22. The results obtained are presented in Figure 23, which depicts the relationship between the bearing capacity and the ratio of compressive stress caused by prestressing ( σ c p / f c m ).
The results depicted in Figure 22 show that the impact of prestressed reinforcement on bearing capacity is significant. The non-prestressed dapped-end beam failed at a load of 264.56 kN, whereas the prestressed beam with the highest analyzed prestressing intensity failed at a load of 241.25 kN. The decrease in bearing capacity was found to be linear approximately up to a 0.265 σ c p / f c m ratio. Once that ratio was reached, the influence of prestressing declined, and looking further, the bearing capacity decreased only slightly. The results demonstrate a significant reduction in bearing capacity due to prestressing, which must be considered during the design of dapped-end beams.
The results of the parametric analysis and the prestressing impact analysis were used to propose equations for assessing the effects of prestressing when the prestressed tendons induce force P2, as depicted in Figure 2. The proposed analytical model was modelled after the EC2 design for shear forces described in Section 2 of this study. The EC2 methodology was modified by replacing the V R d , m a x in Equation (7) with the calculated maximum shear capacity of concrete of a prestressed dapped end V u , c . It is estimated with the following equation:
V u , c = V c , m a x α d α d p ,
where V c , m a x is the maximum shear force resisted by the concrete struts in N; α d is the shear strength reduction coefficient of a dapped-end beam, for which a recommended value of 0.87 was derived from the conducted parametric analysis; α d p is the shear strength reduction coefficient of a prestressed dapped-end beam.
The shear force V c , m a x is calculated with the following equation:
V c , m a x = b w z ν 1 f c c o t θ + t a n θ ,
where b W is the minimum width of the dapped end in meters; z is the inner lever arm, with 0.9 d m taken as its approximate value (see Figure 4); θ is the angle between the concrete compression strut and the beam axis perpendicular to the shear force in degrees; ν 1 is the strength reduction factor for concrete cracked in shear; f c is the compressive concrete strength in Pa.
The shear strength reduction coefficient of a prestressed dapped-end beam is calculated with the following equation:
α d p = 1 0.35 σ c p f c ,
where σ c p is the compressive stress in the cross section caused by prestressing in Pa; f c is the compressive concrete strength in Pa.
σ c p = N p A ,
where N p is the compressive axial force in the cross section caused by prestressing in N; A is the area of the full height cross-section of the beam in m2.
The comparison of the results between the numerical model and the proposed analytical model is displayed in Figure 24. The proposed model exhibits a linear reduction in bearing capacity. The behavior of the two models was observed to be in close alignment up to the reduced prestressing impact threshold, which was seen in the numerical model results.

5. Conclusions

  • The most significant factors affecting the bearing capacity of a dapped-end beam were found to be the amount of shear reinforcement and the height of the dap, whereas the concrete strength had the least impact.
  • The parametric analysis comparing analytical and numerical methods showed that the EC2 STM method yields the highest bearing capacity estimates. However, ST models require proper adjustments to accurately capture acting forces in analyzed zones, and they should primarily be used for designing or as a baseline to be modified for configuration-specific analyses. The PCI method is less conservative, and the Wang et al. method demonstrates the best correlation with the numerical model. The EC2 6.2 section often overestimates shear strength, making it less suitable for dapped-end beam design.
  • The results of the numerical parametric analysis revealed the significant effects of prestressing in certain dapped-end configurations. Prestressed reinforcement compressing the dap wall reduced resistance to cracking at the re-entrant corner, with severity depending on the prestressing intensity. A 50% reduction in cracking load was observed at a compressive stress ratio of 0.20–0.25. With higher prestressing, cracks appeared in the re-entrant corner before the external load exposure.
  • When the prestressed reinforcement compressed the wall of the dap, the induced tensile stresses reduced the bearing capacity of the dapped-end beam. The significance of this effect was dependent on the intensity of the prestressing. A decrease of up to 8.81% in the bearing capacity was observed in the conducted analysis.
  • The proposed analytical model for the assessment of the bearing capacity reduction caused by prestressing in dapped-end beams proved to be in good correlation with the results of the numerical model.
  • The results of this study indicate that if prestressed reinforcement is used in the design of dapped-end beams and it is not possible to extend the tendons to the end of the nib above the dap, then it is essential to assess the reduction of the bearing capacity and implement strategies to mitigate cracking in the re-entrant corner.
Although this study offers insights into dapped-end beam parameters and the impact of prestressing, further research is necessary to comprehensively understand prestressed dapped-end beam behavior with various cross sections and parameters. There is a shortage of methods for designing prestressed dapped-end beams and calculating failure loads considering prestressing effects. This study can serve as a foundation for future research and the development of design methods and calculation models in this area.

Author Contributions

Conceptualization, J.V.; data curation, V.M.; formal analysis, V.M. and A.M.; funding acquisition, J.V.; investigation, V.M.; methodology, V.M., A.M. and J.V.; project administration, A.M. and J.V.; resources, A.M. and J.V.; software, V.M.; supervision, A.M. and J.V.; validation, V.M., A.M. and J.V.; visualization, V.M.; writing—original draft, V.M.; writing—review and editing, V.M., A.M. and J.V. All authors have read and agreed to the published version of the manuscript.

Funding

This research received no external funding.

Institutional Review Board Statement

Not applicable.

Informed Consent Statement

Not applicable.

Data Availability Statement

Data sharing is not applicable to this article.

Conflicts of Interest

The authors declare no conflict of interest.

References

  1. Shakir, Q.M. Reinforced Concrete Dapped End Beams—State of the Art. Int. J. Appl. Sci. 2018, 1, 44. [Google Scholar] [CrossRef]
  2. Aswin, M.; Mohammed, B.; Liew, M.S.; Syed, Z. Root Cause of Reinforced Concrete Dapped-End Beams Failure. Adv. Mater. Sci. Eng. 2015, 10, 42927–42933. [Google Scholar]
  3. Aswin, M.; Mohammed, B.S.; Liew, M.S.; Syed, Z.I. Shear Failure of RC Dapped-End Beams. Adv. Mater. Sci. Eng. 2015, 2015, 309135. [Google Scholar] [CrossRef]
  4. Mattock, A.H.; Chan, T.C. Design and Behavior of Dapped-End Beams. PCI J. 1979, 24, 28–45. [Google Scholar] [CrossRef]
  5. Shah, A.; Haq, E.; Khan, S. Analysis and Design of Disturbed Regions in Concrete Structures. Procedia Eng. 2011, 14, 3317–3324. [Google Scholar] [CrossRef]
  6. Precast/Prestressed Concrete Institute. PCI Design Handbook: Precast and Prestressed Concrete, 7th ed.; Precast/Prestressed Concrete Institute: Chicago, IL, USA, 2010. [Google Scholar]
  7. EN 1992-1-1; Eurocode 2: Design of Concrete Structures—Part 1-1: General Rules and Rules for Buildings. European Committee for Standardization: Brussels, Belgium, 2004.
  8. Fib International Federation for Structural Concrete. Fib Model Code for Concrete Structures 2010; Fib—Federation Internationale du Beton: Lausanne, Switzerland, 2013. [Google Scholar] [CrossRef]
  9. Mattock, A.H. Strut-and-Tie Models for Dapped-End Beams. Concr. Int. 2012, 34, 35–40. [Google Scholar]
  10. Mitchell, D.; Cook, W.D.; Peng, T. Example 14: Importance of Reinforcement Detailing. SP-273 Furth. Ex. Des. Struct. Concr. Strut-Tie Model. 2010, 273, 237–252. [Google Scholar]
  11. Sanders, D.H. Example 2: Dapped-End T-Beam Supported by an Inverted T-Beam. SP-208 Ex. Des. Struct. Concr. Strut-Tie Model. 2002, 208, 91–103. [Google Scholar] [CrossRef]
  12. ACI Committee 318. Building Code Requirements for Structural Concrete: (ACI 318-19) and Commentary (ACI 318R-19); American Concrete Institute: Farmington Hills, MI, USA, 2019. [Google Scholar]
  13. Al-Khazraji, S.D.M. Response of Dapped-End Prestressed Concrete Girders to Static and Impact Loads. Ph.D. Thesis, University of Baghdad, Baghdad, Iraq, 2014. [Google Scholar]
  14. Werner, M.P.; Dilger, W.H. Shear Design of Prestressed Concrete Stepped Beams. PCI J. 1973, 18, 37–49. [Google Scholar] [CrossRef]
  15. Hamoudi, A.A.; Phang, M.K.S. Shear Strength of Post-Tensioned Daps in Prestressed Concrete Beams. J. Struct. Div. 1974, 100, 2403–2418. [Google Scholar] [CrossRef]
  16. Mattock, A.H.; Theryo, T.S. Strength of Precast Prestressed Concrete Members with Dapped Ends. PCI J. 1986, 31, 58–75. [Google Scholar] [CrossRef]
  17. Brinkley, M.C. Behavior of Prestressed, Precast Concrete Thin-Stemmed Members with Dapped Ends. Master’s Thesis, North Carolina State University, Raleigh, NC, USA, 2013; 224p. [Google Scholar]
  18. Botros, A.W.; Klein, G.J.; Lucier, G.W.; Rizkalla, S.H.; Zia, P. Dapped Ends of Prestressed Concrete Thin-Stemmed Members: Part 1, Experimental Testing and Behavior. PCI J. 2017, 62, 61–82. [Google Scholar] [CrossRef]
  19. Wang, Q.; Guo, Z.; Hoogenboom, P.C.J. Experimental Investigation on the Shear Capacity of RC Dapped End Beams and Design Recommendations. Struct. Eng. Mech. 2005, 21, 221–235. [Google Scholar] [CrossRef]
  20. DIANA FEA BV. Compressive Behavior. 2015. Available online: https://manuals.dianafea.com/d100/MatLib/node328.html (accessed on 27 February 2022).
  21. DIANA FEA BV. Tensile Behavior. 2015. Available online: https://manuals.dianafea.com/d96/MatLib/node84.html (accessed on 21 March 2022).
  22. Lu, W.Y.; Lin, I.J.; Hwang, S.J.; Lin, Y.H. Shear Strength of High-Strength Concrete Dapped-End Beams. J. Chin. Inst. Eng. 2003, 26, 671–680. [Google Scholar] [CrossRef]
  23. Valivonis, J.; Jonaitis, B.; Zavalis, R.; Skuturna, T.; Šneideris, A. Flexural capacity and stiffness of monolithic biaxial hollow slabs. J. Civil Eng. Manag. 2014, 20, 693–701. [Google Scholar] [CrossRef]
  24. MC90. CEB-FIB Model Code 1990 for Concrete Structures; CEB Bull. d’Information 1993, No. 213/214; Comité Euro-International du Béton: Lausanne, Switzerland, 1993. [Google Scholar]
  25. Desnerck, P.; Lees, J.M.; Morley, C.T. Impact of the Reinforcement Layout on the Load Capacity of Reinforced Concrete Half-Joints. Eng. Struct. 2016, 127, 227–239. [Google Scholar] [CrossRef]
  26. Shakir, Q.M.; Abd, B.B.; Jasim, A.T. Experimental and Numerical Investigation of Self Compacting Reinforced Concrete Dapped End Beams Strengthened with CFRP Sheets. J. Univ. Babylon Eng. Sci. 2018, 26, 16–35. [Google Scholar] [CrossRef]
  27. Ahmad, S.; Elahi, A.; Hafeez, J.; Fawad, M.; Ahsan, Z. Evaluation of the Shear Strength of Dapped Ended Beam. Life Sci. J. 2013, 10, 1038–1044. Available online: https://www.researchgate.net/publication/289708665_Evaluation_of_the_shear_strength_of_dapped_ended_beam (accessed on 10 February 2022).
  28. Shakir, Q.M. A Review on Structural Behavior, Analysis, and Design of RC Dapped End Beams. IOP Conf. Ser. Mater. Sci. Eng. 2020, 978, 012003. [Google Scholar] [CrossRef]
  29. Barton, D. Design of Dapped Beams Using the Strut-and-Tie-Model; University of Texas: Austin, TX, USA, 1988. [Google Scholar]
Figure 1. General view of a dapped-end beam connection: (a) rectangular dapped-end beam; (b) double-T dapped-end beam.
Applsci 13 05228 g001
Figure 2. Forces acting on the point A at the re-entrant corner of the dapped end [14].
Applsci 13 05228 g002
Figure 3. Five potential failure modes of a dapped-end beam [6]. ① Flexure (cantilever bending) and axial tension in the extended end; ② direct shear at the junction of the dap and the main body of the component; ③ diagonal tension emanating from the reentrant corner; ④ diagonal tension in the extended end; ⑤ diagonal tension in the undapped portion.
Applsci 13 05228 g003
Figure 4. The parameters examined in the parametric analysis.
Applsci 13 05228 g004
Figure 5. Drawings of the non-prestressed beam model: (a) drawing of the specimen; (b) geometry and reinforcement arrangement of the dapped end.
Applsci 13 05228 g005aApplsci 13 05228 g005b
Figure 6. Drawings of the prestressed beam model: (a) drawing of the specimen; (b) geometry and reinforcement arrangement of the dapped end.
Applsci 13 05228 g006
Figure 7. Numerical model of the dapped-end beam: (a) 3D model of the beam; (b) Meshed 3D elements; (c) Reinforcement model.
Applsci 13 05228 g007
Figure 8. Concrete stress–strain relationship curves: (a) parabolic curve of the compressive stress–strain relationship [20]; (b) exponential curve of the tensile stress–strain relationship [21].
Applsci 13 05228 g008
Figure 9. Prestressed reinforcement in the numerical model of the beam.
Applsci 13 05228 g009
Figure 10. Comparison of varying h/H ratios on the failure load.
Applsci 13 05228 g010
Figure 11. Comparison of varying h/H ratios on the failure load when the reinforcement is prestressed.
Applsci 13 05228 g011
Figure 12. Comparison of varying a / d ratios on the failure load.
Applsci 13 05228 g012
Figure 13. Comparison of varying a / d ratios on the failure load when the reinforcement is prestressed.
Applsci 13 05228 g013
Figure 14. Comparison of varying l s / l d ratios on the failure load.
Applsci 13 05228 g014
Figure 15. Comparison of varying l s / l d ratios on the failure load when the reinforcement is prestressed.
Applsci 13 05228 g015
Figure 16. Comparison of varying concrete strengths on the failure load.
Applsci 13 05228 g016
Figure 17. Comparison of varying concrete strengths on the failure load when the reinforcement is prestressed.
Applsci 13 05228 g017
Figure 18. Comparison of varying cross-section areas of shear reinforcement on the failure load.
Applsci 13 05228 g018
Figure 19. Comparison of varying cross-section areas of shear reinforcement on the failure load when prestressed reinforcement is used.
Applsci 13 05228 g019
Figure 20. Relationship between the cracking load and the compressive stress ratio.
Applsci 13 05228 g020
Figure 21. General view of the numerical model for the analysis of prestressing’s impact on bearing capacity.
Applsci 13 05228 g021
Figure 22. Principal strains and cracking in the numerical model for the analysis of prestressing’s impact on bearing capacity.
Applsci 13 05228 g022
Figure 23. Relationship between the bearing capacity and compressive stress ratio.
Applsci 13 05228 g023
Figure 24. Comparison between the numerical model and proposed analytical model of the relationship between the bearing capacity and compressive stress ratio.
Applsci 13 05228 g024
Table 1. Reinforcement properties.
Reinforcement GroupMaterial ModelModulus of Elasticity, GPaYield Stress, MPa
A s Von Mises plasticity200461.82
A h Von Mises plasticity200368.00
A v h Von Mises plasticity200416.14
A s p Von Mises plasticity1951600.00
Disclaimer/Publisher’s Note: The statements, opinions and data contained in all publications are solely those of the individual author(s) and contributor(s) and not of MDPI and/or the editor(s). MDPI and/or the editor(s) disclaim responsibility for any injury to people or property resulting from any ideas, methods, instructions or products referred to in the content.

