Article

Numerical Simulation and Wind Tunnel Test of a Variable Geometry Auxiliary Inlet for a Wide-Body Aircraft Environmental Control System

1
Key Laboratory of Aircraft Environmental Control and Life Support, MIIT, College of Aerospace Engineering, Nanjing University of Aeronautics and Astronautics, Nanjing 210016, China
2
China Shipbuilding Power Engineering Institute Co., Ltd., Shanghai 201208, China
3
Environment Control and Oxygen System Department, Shanghai Aircraft Design and Research Institute, Shanghai 201210, China
*
Author to whom correspondence should be addressed.
Appl. Sci. 2023, 13(9), 5253; https://doi.org/10.3390/app13095253
Submission received: 27 March 2023 / Revised: 19 April 2023 / Accepted: 19 April 2023 / Published: 22 April 2023
(This article belongs to the Section Aerospace Science and Engineering)

Abstract

:
A variable geometry auxiliary inlet for a wide-body aircraft environmental control system with moveable deflectors operating in a large mass flow rate range is studied through numerical simulation and wind tunnel tests, which yields a design method for the variable geometry auxiliary inlet with high performance. The characteristics of the flow field are studied by numerical simulation. The results show that the favorable pressure gradient and the roll-up vortices are the major impetus that inhales the incoming flow into the inlet. The law of regulation and the performance variation under different conditions are obtained by wind tunnel test. The flow coefficient increases first but then decreases with the increase in the inlet opening, and the pressure rise ratio and total pressure recovery coefficient increase first and then decrease with the increase in the mass flow rate. In general, under the condition of a high Mach number (Ma > 0.4), the inlet opening of this test configuration should not exceed 50%. The deflectors can maintain the normal work of the environmental control system by moving properly to control the mass flow rate of the auxiliary inlet.

1. Introduction

The ram air inlet is an important component of the ram air system of civil aircraft. The main function of the ram air inlet is to capture low-temperature freestream. On the one hand, it is used for cooling various pieces of electrical equipment to ensure the stability and reliability of the equipment [1]. On the other hand, as a fresh air source, it can adjust the air quality in the cabin, including air temperature and humidity, in order to provide increased comfort for staff and passengers [2]. The excellent performance of the ram air inlet is the premise of the highly efficient operation of aircraft environmental control systems.
Unlike the scoop-type inlet [3], the submerged inlet is usually integrated with the fuselage, wing, engine nacelles, etc. [4,5], which can reduce the air drag force [6,7,8] and thus cut fuel costs. Due to its unique advantages, the submerged inlet has been widely used in the air-intake system [9,10,11,12,13]. Since the 1940s, scholars have conducted some studies on the geometric design and aerodynamic performance of the submerged inlet experimental method. Frick et al. [14] designed a NACA submerged inlet and experimentally studied the effects of its geometric parameters on the performance, and a preliminary design method for this type of inlet was formed. Subsequently, Delany et al. [15], Frank et al. [16], and Hall et al. [17] studied the installation position of the inlet on the fuselage, shape of the inlet side plate, angle of attack, Mach number, etc., and the variation of the aerodynamic performance with the various parameters was carefully characterized. Recently, computational fluid dynamics (CFD) has developed rapidly and been applied in various domains [18,19,20,21,22]. Some scholars have studied the flow field characteristics of a submerged inlet and the influence of geometric parameters on their performance by CFD methods [23]. Furthermore, combined with an intelligent optimization algorithm, geometric parameters of the submerged inlet are optimized to improve its performance [24,25,26].
For a civil aircraft environmental control system, it must be guaranteed to work normally throughout the whole flight envelope. The submerged inlet mainly relies on the ram effect of the high-speed air flow for inspiration. As a result, the mass flow rate is greatly affected by flight conditions and environmental parameters. In this case, the fixed inlet configuration cannot adjust the flow according to the flight state and environmental parameters, thus affecting the stability and economy of civil aircraft environmental control systems. With the increasing demand for flow of the wide-body aircraft, this contradiction becomes more pronounced. A variable geometry auxiliary inlet may be an efficient way to solve this problem.
At present, the research on variable geometry inlets mainly focuses on hypersonic aircraft, which are used to meet the high efficiency at wide Mach number. You et al. [27] numerically studied a variable geometry inlet control for hypersonic aircraft. The moveable lip cover of the variable geometry inlet for hypersonic aircraft is a lip cover which can move forward and backward in the direction of the incoming flow and achieve the maximum airflow capture of the aircraft and improve the performance of the propulsion system. Liu et al. [28] designed three types of two-dimensional variable supersonic inlets and analyzed the performance by 2D numerical simulation. In order to meet the operating requirement of ramjets in a wide speed range, Wang [29] designed a variable geometry inlet with integrated internal/external compression regulation, and the feasibility of a three-dimensional bleed control method with a vent hole on the side plate is verified by 3D numerical simulation.
Although a series of research achievements have been made in the design and performance research of submerged inlets, they are mainly carried out for inlets with fixed geometric configuration. The study of variable geometry inlets is mainly focused on hypersonic vehicles and meets the performance requirements at both high and low Mach numbers. The speed of civil aircraft is low, and the emphasis is on flow control, so the above research results cannot be directly copied. Based on previous research, a variable geometry auxiliary inlet is proposed to enhance the stability of the environmental control system of civil aircraft. Furthermore, to verify the feasibility of the inlet, detailed numerical simulations and wind tunnel tests are conducted. By analyzing the flow field characteristics, regulation laws, and performance changes at different conditions, valuable conclusions are obtained, which provide useful references for the design of environmental control systems for large aircraft. Overall, this study presents an innovative and effective approach to enhance the stability and performance of environmental control systems in civil aircraft, which could ultimately enhance the safety and comfort of passengers during flights.

2. Methods

2.1. Geometric Model

An aerodynamic design scheme of a variable geometry auxiliary inlet is presented in this study, as shown in Figure 1. The variable geometry auxiliary inlet is mainly composed of an entrance ramp, two deflectors, and a lip. The entrance ramp and lip mainly play a role in guiding the air flow into the inlet, and the ramp angle is α = 7° [30]. The position of the deflectors is adjusted by the actuator. Deflector 1 rotates around the fixed rotation center, and Deflector 2 rotates around the rotation center while performing translation motion. The variable geometry auxiliary inlet tends to change the throat area by adjusting the position of the deflectors and thus achieving the purpose of flow control. The inlet opening K is defined as the ratio of the captured flow area to the area of the exit, and K varies between 0% and 100%. Figure 1b–d present three 3-D models with different K values. In order to achieve a deep insight of the flow field characteristics, the integrated flow field of Configuration Ι and aircraft fuselage has been numerically studied, as shown in Figure 2.

2.2. Grid Generation and Boundary Conditions

Herein, the unstructured hybrid grids are generated by the commercial software ICEM 18.0, as shown in Figure 3. The computational domain is divided into three sub-zones: the far-field zone, the zone near the inlet, and the zone inside the inlet. The mesh of the far-field zone is sparse, while the other zones are relatively dense. In addition, the prism grids near the aircraft surface and inlet walls are refined enough (the first grid height is 2 × 10⁻⁵ m, the prism layer is 25, and the growth rate is 1.2).
As can be seen from Figure 3, the boundary conditions are mainly divided into INLET, OUTLET, SYM, EXIT, and FARFIELD. The INLET boundary is assumed to be a uniform velocity inlet with different Mach number and attack angle. The OUTLET and FARFIELD boundary is assumed to be “Opening” with a reference pressure of 17,900 Pa and temperature of 242 K. The SYM boundary is assumed to be “Symmetry”. The EXIT boundary is assumed to be “Outlet” with a given mass flow rate. In addition, the no-slip wall boundary conditions are set at the aircraft fuselage and the inlet walls.

2.3. Grid Independence Verification

To balance the computational efficiency and accuracy, mesh independence verification is carried out to ensure that the final CFD solution is free of mesh resolution errors. Five mesh systems with approximately 10 million, 15 million, 20 million, 25 million, and 30 million cells are chosen as shown in Table 1. When the number of cells increases from 20 million to 30 million, the mass flow rate changes only by 1.4% and the maximum vorticity changes only by 0.9%. Thus, the mesh system of 20 million cells is selected for the numerical simulation.

2.4. Numerical Simulation Scheme

In this study, the flow is regarded as three-dimensional steady and compressible flow, and the governing equations in the Cartesian coordinate system can be written as follows [31]:
ρ u j x j = 0
ρ u j u i x j = p x i + τ i j x j
ρ E + p u i x i = q i x i + u j τ i j x i
where ρ is the fluid density; xi is the Cartesian coordinate component; μi is the velocity component; qi is the heat flux; p is the pressure; E is the total energy; and τij is the viscous stress. For ideal gas, p = (γ − 1)(E − 0.5ρui2). τij and qi can be described by the following Equations (4) and (5):
τ i j = μ ( 2 S i j 2 3 δ i j S k k )
q i = μ ( γ 1 ) Pr T x i
where γ is the specific heat of air; μ is the viscous coefficient; Pr is the Prandtl number; Sij is the strain tensor; and T is the temperature.
The commercial CFD software Fluent 18.0 is used to solve the above three governing equations. A second-order upwind scheme is used. The k-ε turbulence model [26] with standard wall functions is used to describe the flow field. For all equations, convergence is considered when the residual is less than 10−6. The reliability of the numerical simulation scheme will be further verified by wind tunnel test.

2.5. Analysis of Numerical Simulation Results

2.5.1. Pressure Counters

Figure 4 shows the distribution of pressure outside the inlet and in each cross section along the axis of the inlet. In Figure 4, the pressure distribution on each cross section has consistent characteristics: two low-pressure regions are generated near the sidewalls; the isobars show an obvious circular distribution; and the pressure is higher in the middle part of the cross section. The range of the lower-pressure region on the cross section is small and insignificant at the front edge of the inlet, but it gradually expands as the cross-sectional area gradually increases. In addition, the pressure distribution gradually becomes even in the duct. The main reason for this phenomenon is that a pair of vortices are generated near the sidewalls. More details on this will be discussed in subsequent sections.

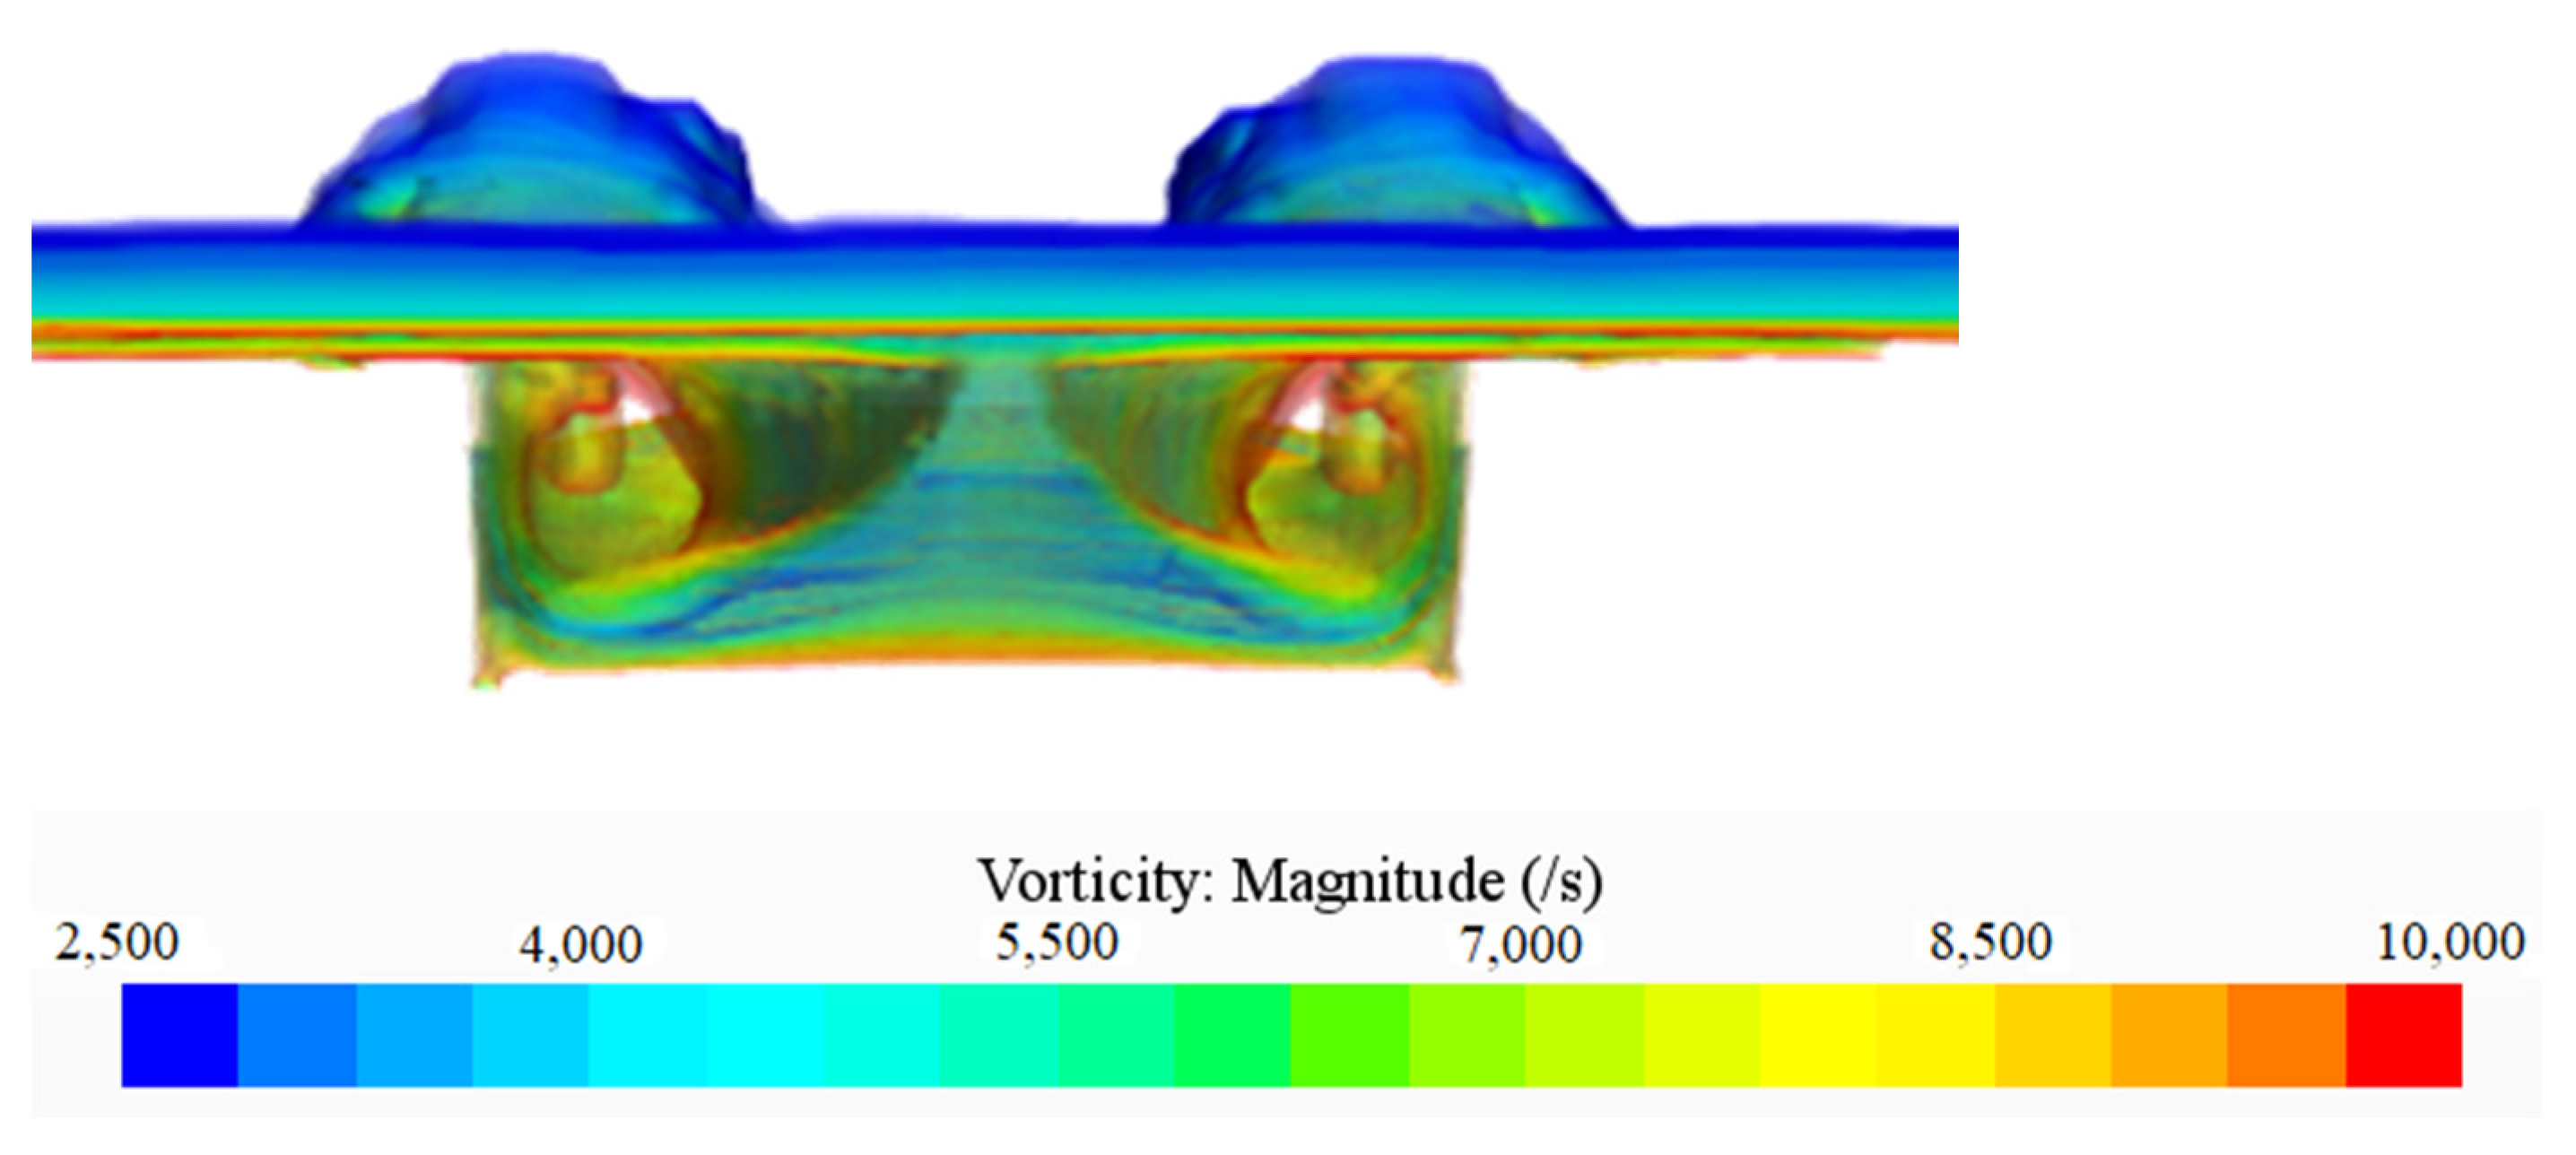
2.5.2. Roll-Up Vortices

A clear picture of the roll-up vortices is shown in Figure 5. As shown in this figure, a pair of roll-up vortices is generated from the edge of the sidewalls. As the vortices move downstream into the duct, another roll-up vortex formed due to the divergence of the sidewalls strengthens the swirl motion created before and expands the fields of the secondary flow to the whole section in each cross section. Consequently, the vortices swept into the duct yield the low-pressure region and the high-pressure region in each cross section. As the vortices continue to flow downward in the duct, the influences of the vortices are gradually weakened. This is a good explanation of the pressure distribution in each cross section. Roll-up vortices are the most obvious feature of the NACA submerged inlet that distinguishes it from other types of inlet.

3. Wind Tunnel Test

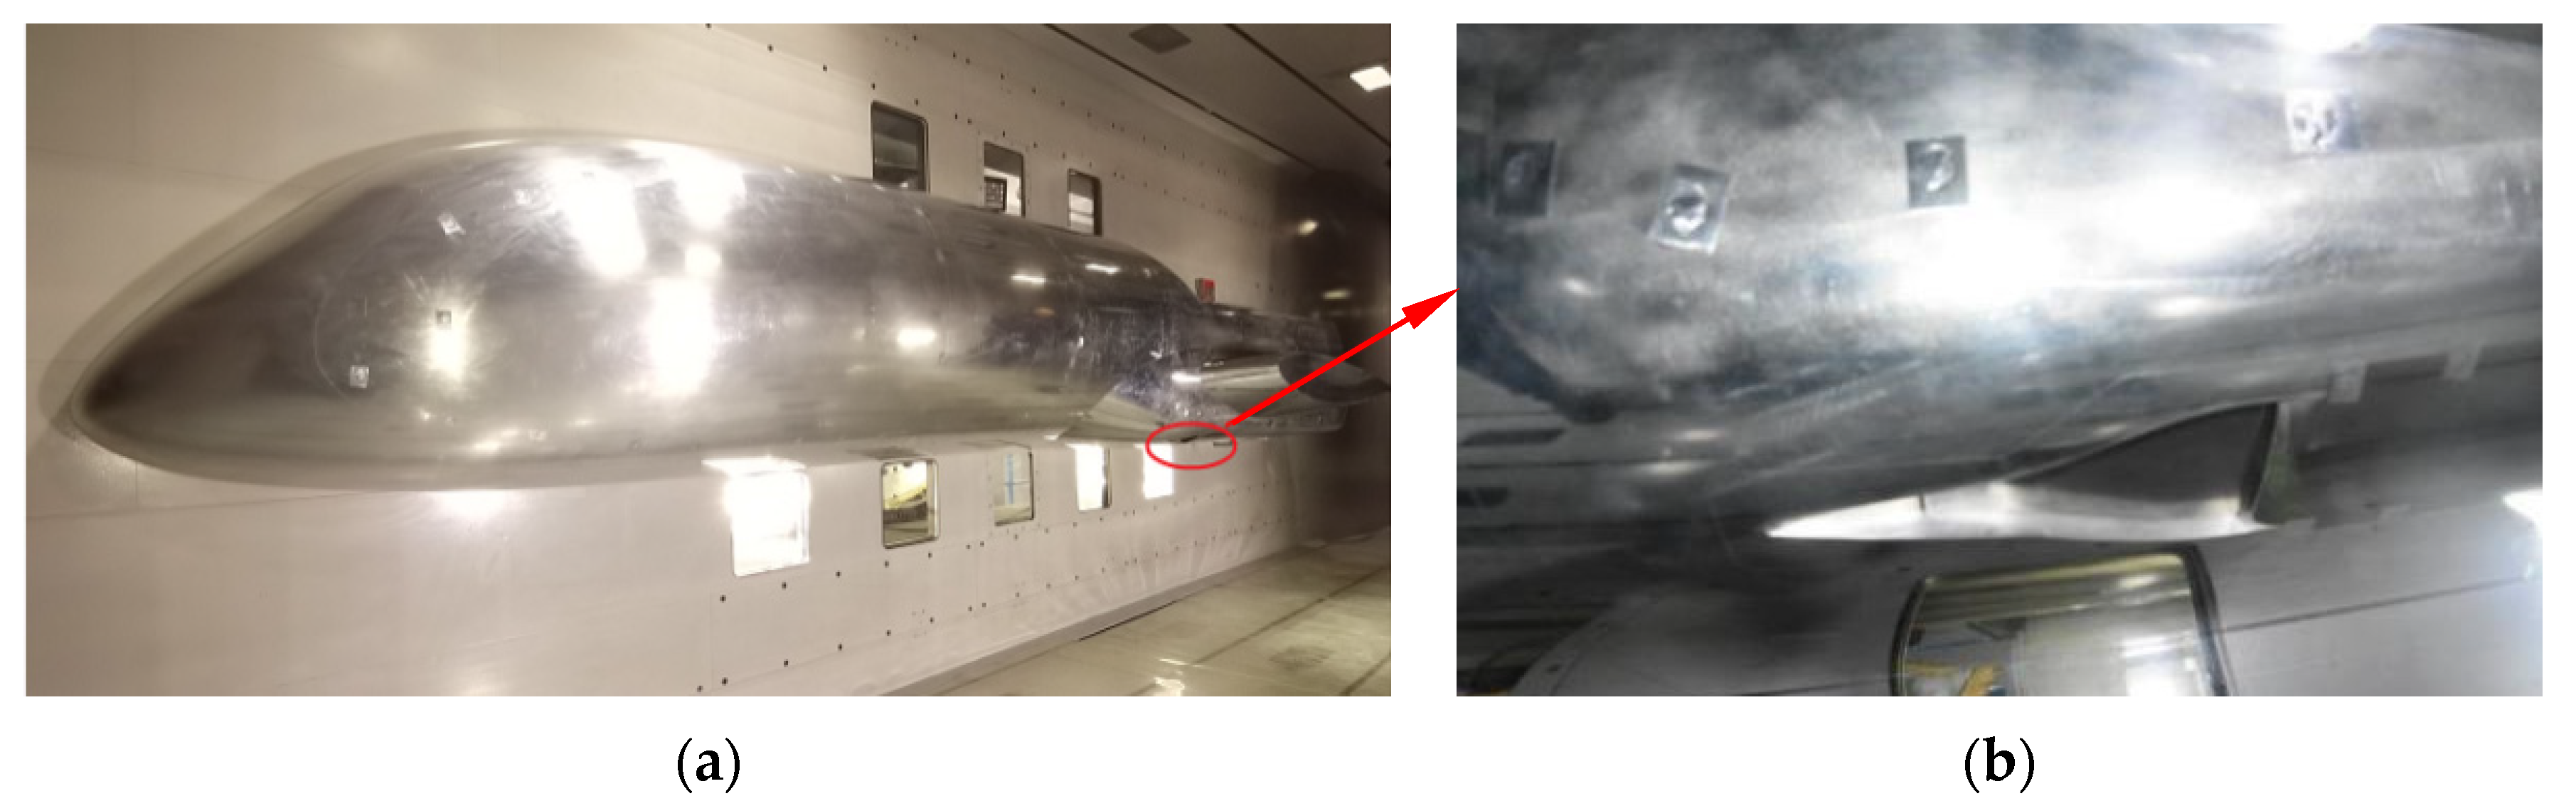
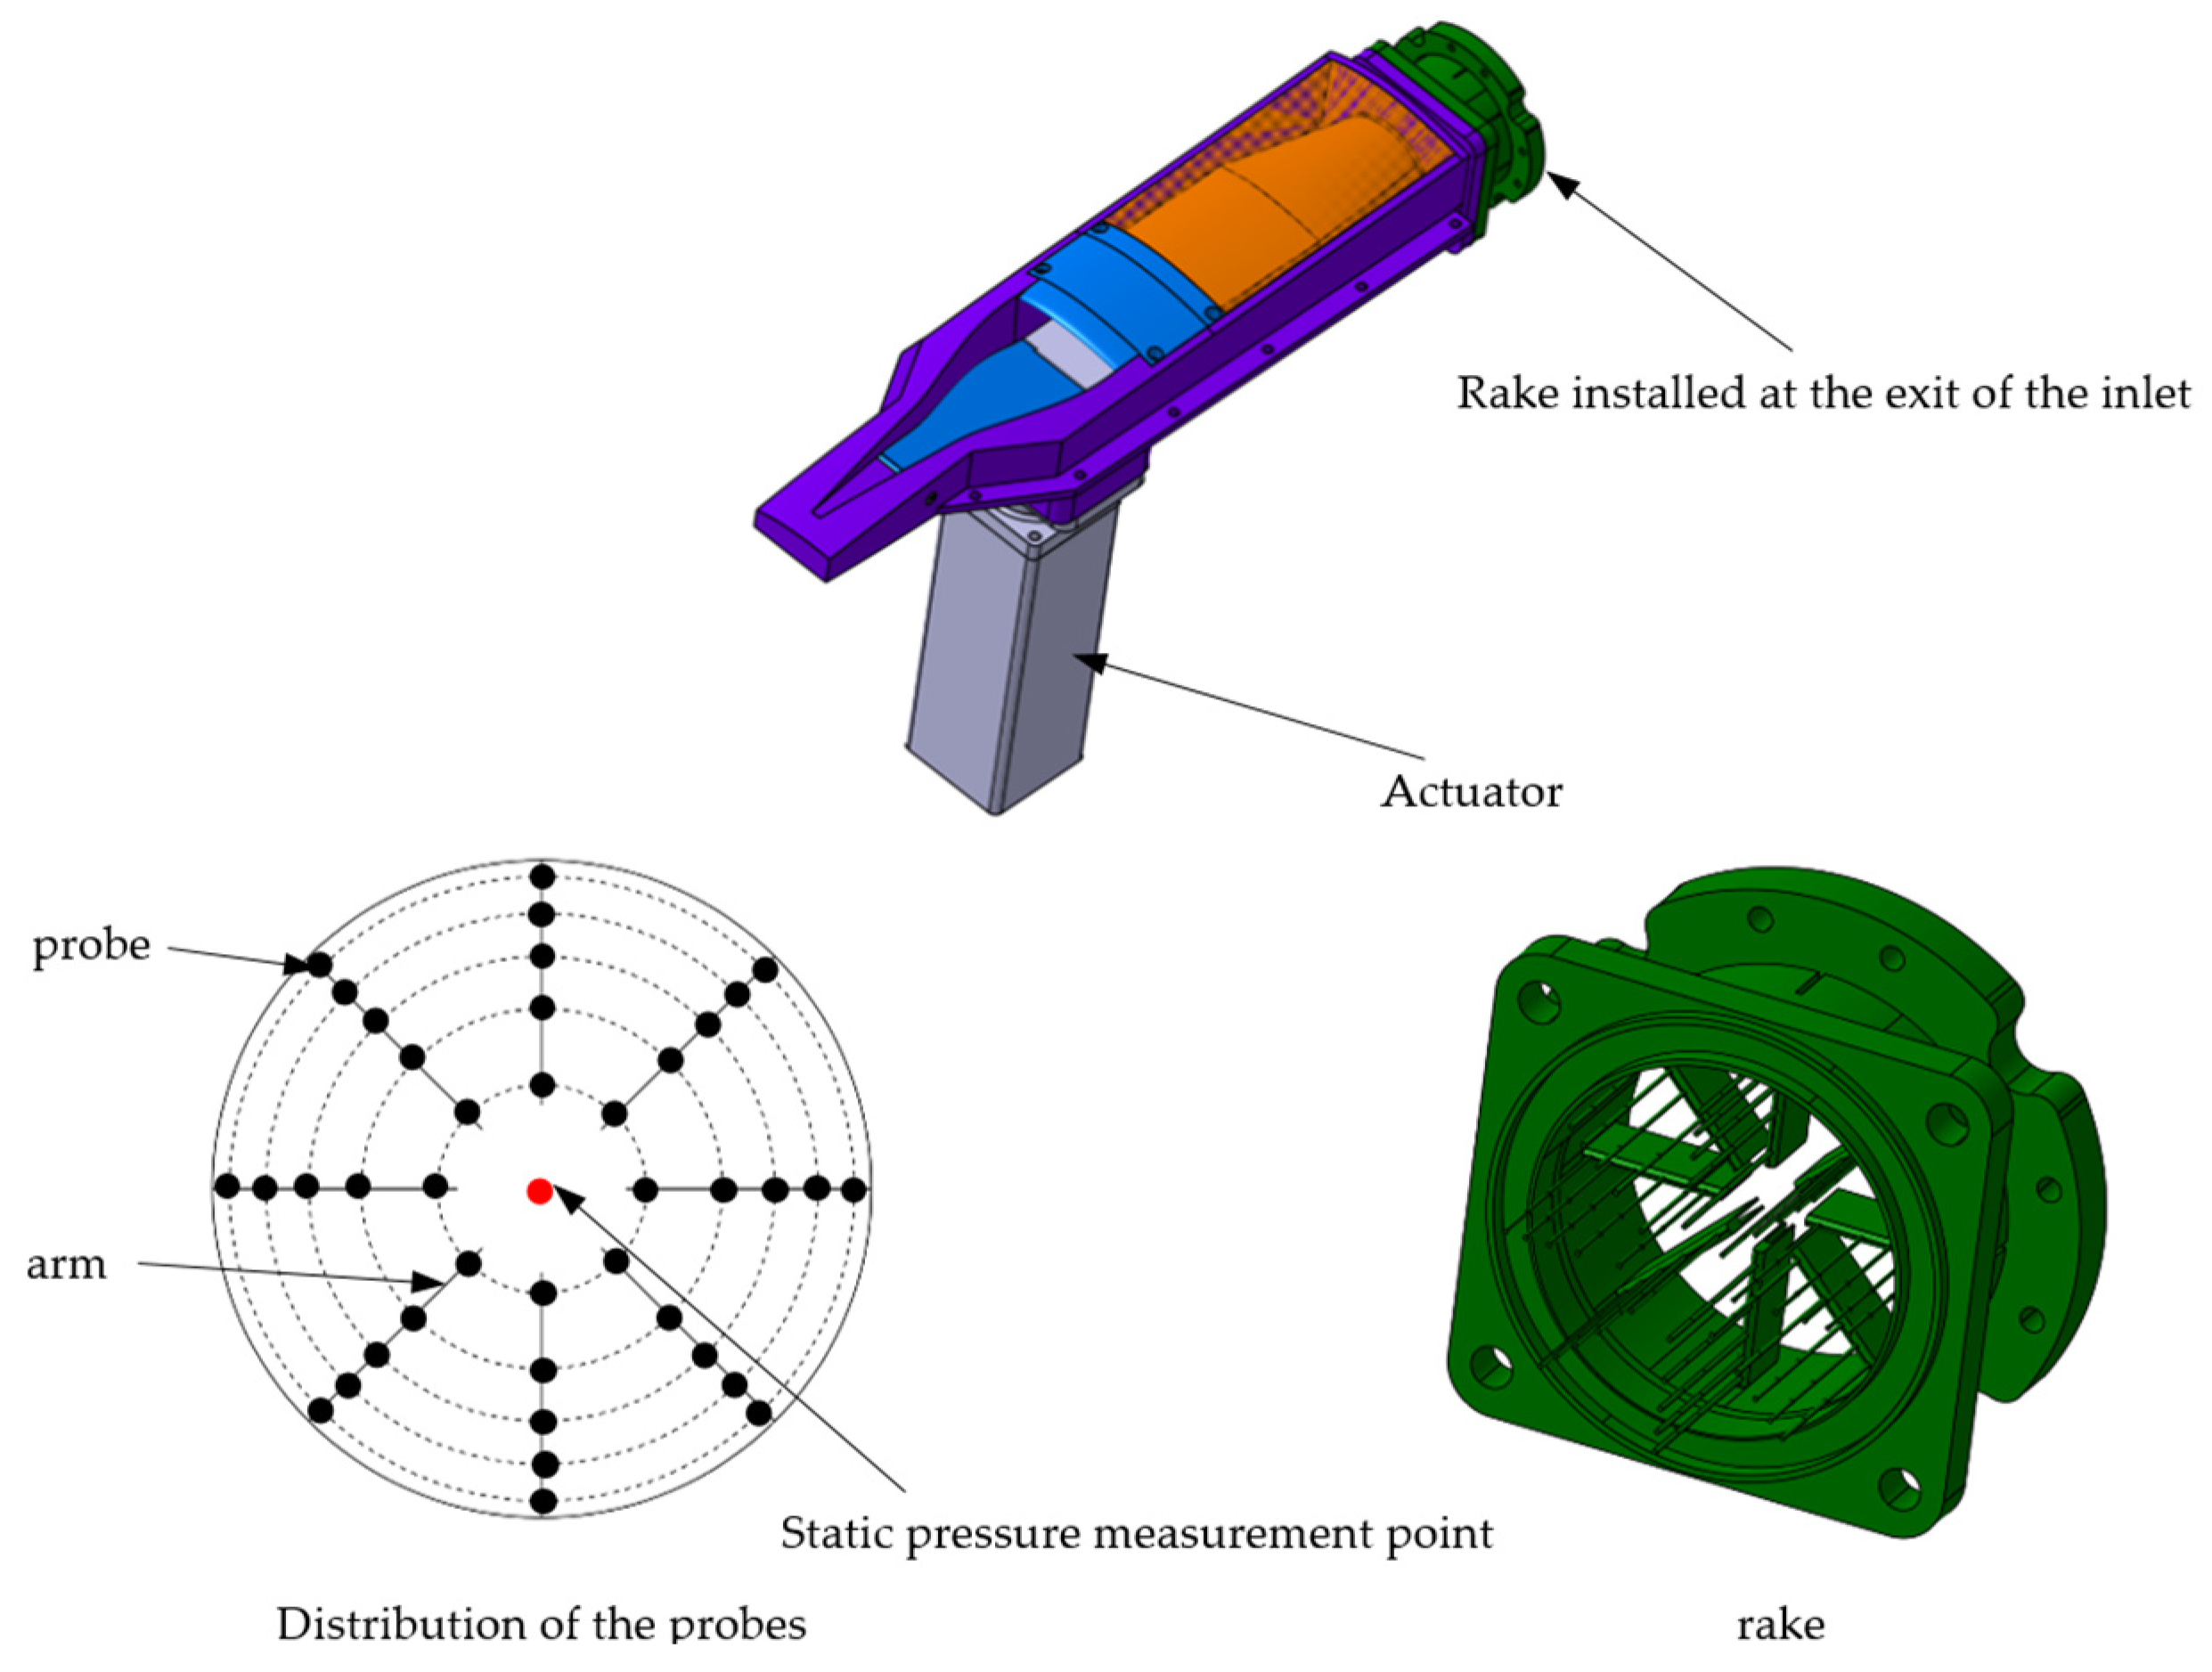
3.1. Test Model and Equipment

The law of regulation and the aerodynamic performance variation under different conditions are studied by wind tunnel test. A 1/7-scale all-metal half-model is used. The model is mainly composed of forward fuselage, middle fuselage, wing body fairing, wing, auxiliary inlet, and other components. In order to ensure that the wind tunnel blockage is less than 5%, the middle fuselage and the wing are simplified. The upper surface of the fuselage is flattened, and the wing is retained close to 1/4 of the total length of the wing. The test is carried out in a transonic wind tunnel with the test section size of 2.4 m × 2.4 m × 9.6 m, the maximum Mach number of 1.15, and the Mach number control precision of ±0.001. The installation diagram of the model in the wind tunnel is shown in Figure 6.

3.2. Data Measurement

This type of measurement is executed by the standard total pressure rake with five rings. The rake [32], which is composed of 40 total pressure probes, is designed and installed for the total pressure data acquisition at the exit of the inlet (Figure 7). The rake is composed of eight equally spaced arms, each of which contains five probes. In the radial direction, the probes are located at the centroids of equal area sectors. The static pressure measurement point and the front face of the total pressure rake are located on the same measuring section (Figure 7). The measurements are made using a PSI9000 pressure acquisition system with four pressure scan valves (measurement ranges being 0–15 psi, 1 psi = 6.895 kPa).

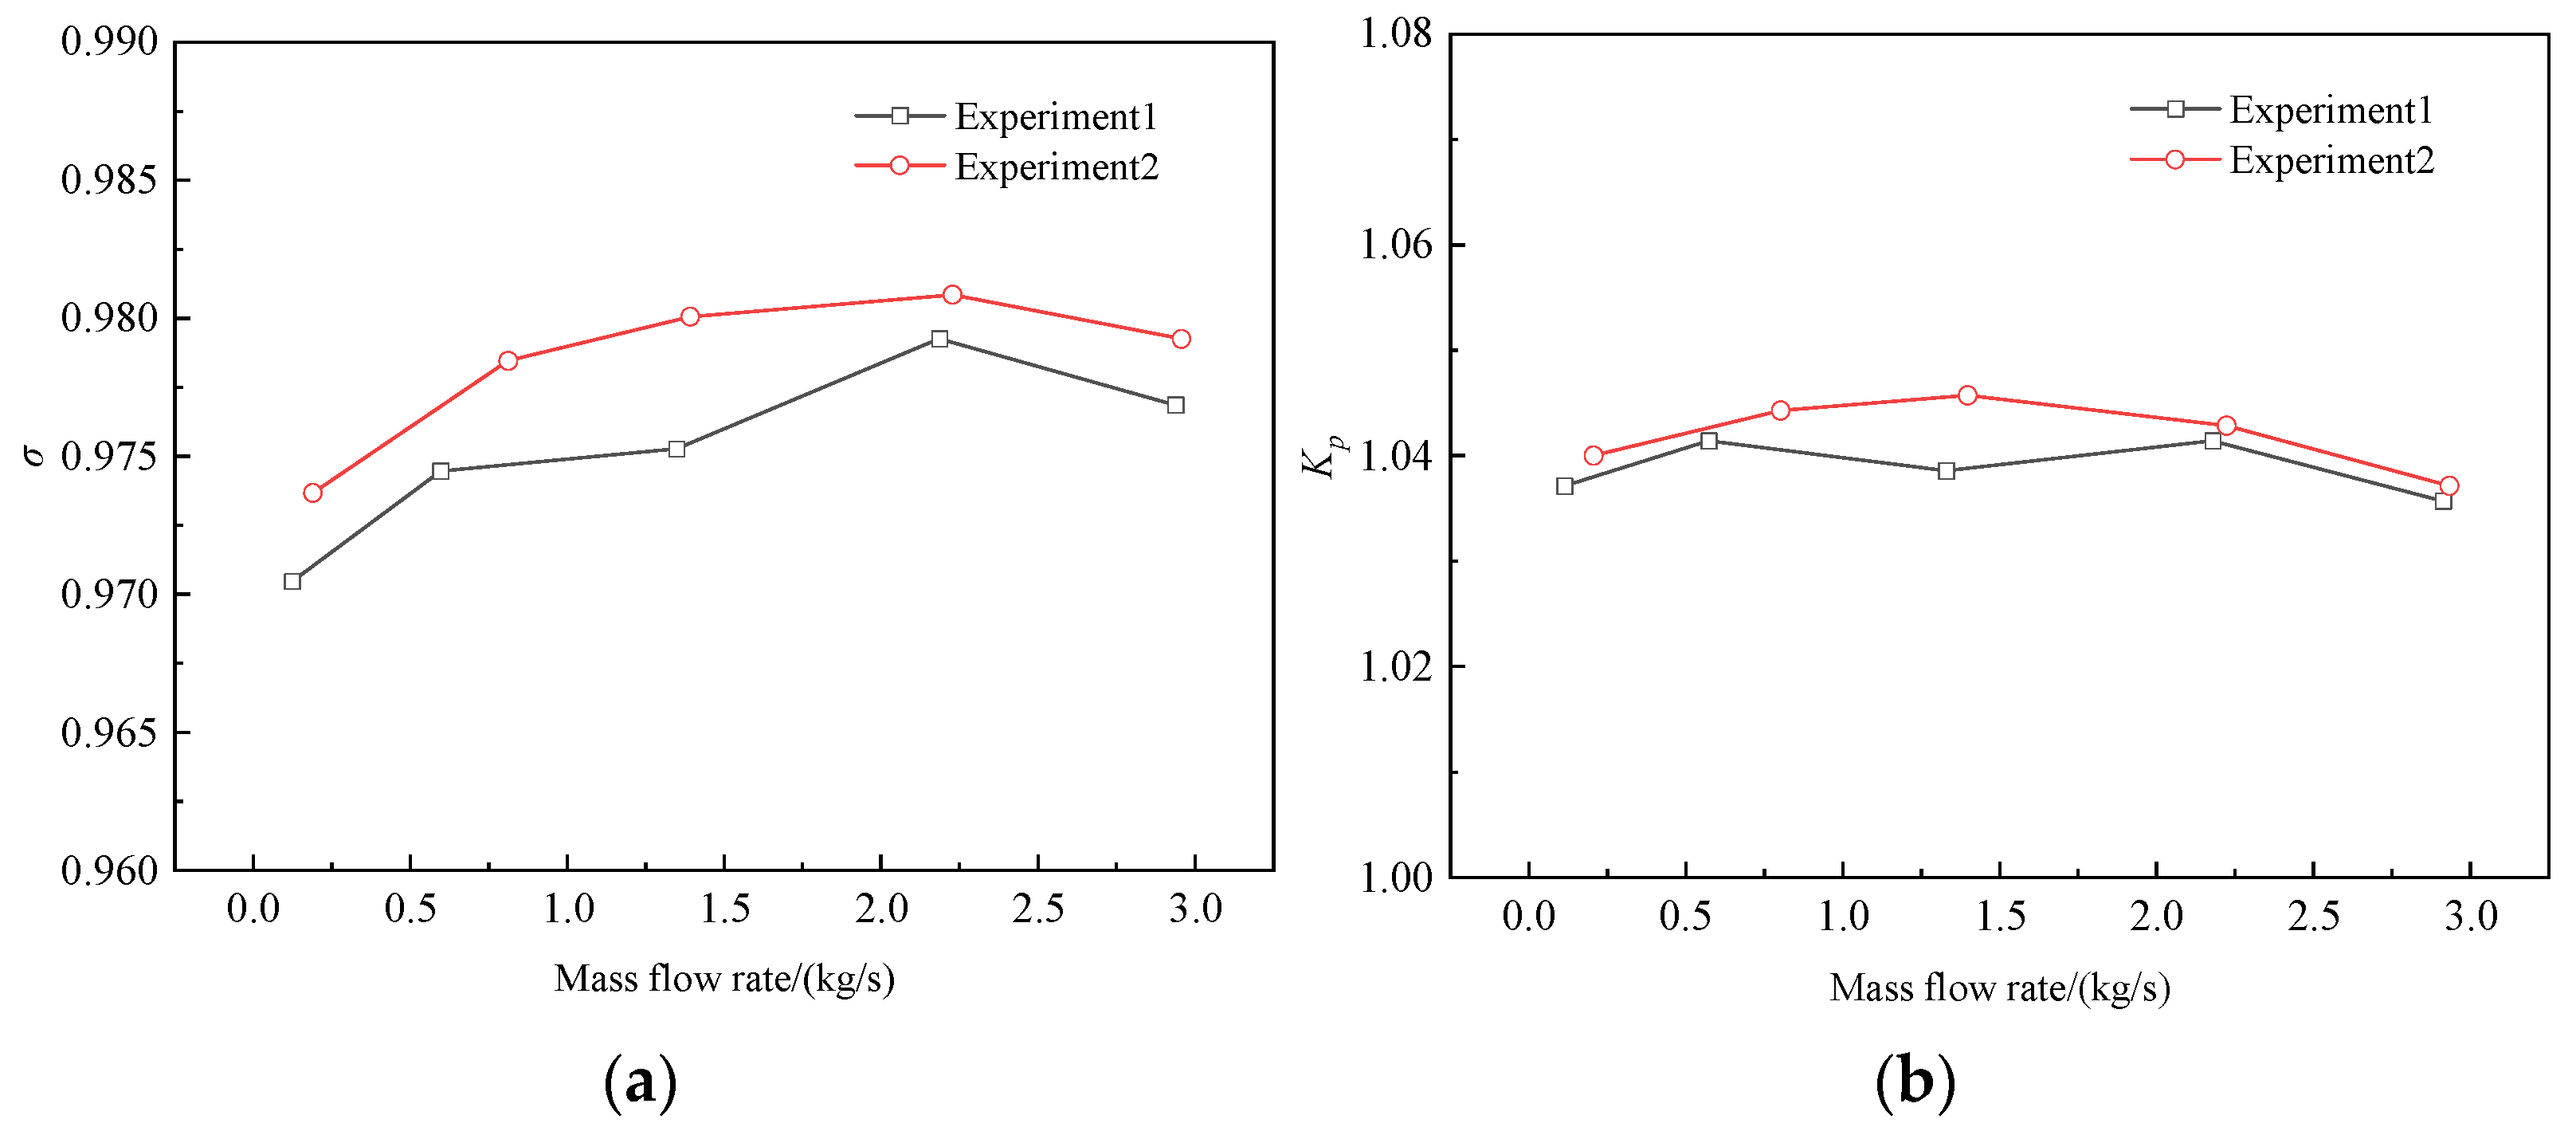
3.3. Repeatability Test

A repeatability test was carried out to show that the test scheme has good repeatability. Figure 8 shows the test results of the total pressure recovery coefficient and pressure rise ratio of the two tests when Ma = 0.31, α = 0°, and K = 100%. Comparing the results of the two tests, it is found that the maximum difference of the total pressure recovery coefficient is about 0.5%, and the maximum difference of the pressure rise ratio is about 0.6%. Overall, the test scheme has good repeatability and high accuracy.

4. Analysis of Test Results

4.1. Comparison of Simulation Results and Test Results

A simulation and test with Ma = 0.4, 0.65, 0.85, α = 2.5° and K = 100% are conducted to evaluate the simulation’s accuracy (Figure 9). It is indicated that simulation results coincide well with that of test results.

4.2. Total Pressure Recovery Coefficient versus Mass Flow Rate

Figure 10 shows the variation of the total pressure recovery coefficient versus mass flow rate at different Mach numbers. In terms of the overall variation trend, when the variable geometry auxiliary inlet is at a large opening (K > 25%), the total pressure recovery coefficient increases first and then decreases with the increase in the mass flow rate, but the overall fluctuation is relatively small. When the variable geometry auxiliary inlet is at a small opening (K ≤ 25%), the total pressure recovery coefficient decreases sharply with the increase in the mass flow rate.
In addition, when the mass flow rate is constant, the total pressure recovery coefficient gradually increases with the increase in the opening, reaching the highest value at a 50% opening. After that, the total pressure recovery coefficient begins to decline with the increase in the opening. The higher the Mach number, the more obvious the downward trend. This is due to the fact that in the small opening interval, the inner profile of the inlet is relatively moderate and the flow field quality is better, and the resistance loss along the inlet is dominant. With the increase in the opening, the captured flow area of the inlet gradually increases, the resistance loss decreases, and the total pressure recovery coefficient increases gradually. As the opening continues to increase from 50%, it is easy to induce large-scale boundary layer separation when the incoming flow passes through the entrance ramp, which will significantly increase the flow loss and reduce the flow capacity. The higher the Mach number is, the thicker the boundary layer will be, the more easily the separation will occur, and the more obvious the decrease of the total pressure recovery coefficient will be. In order to ensure the minimum flow loss, the opening should be reasonably matched according to the demand of ram air. Under the condition of a high Mach number (Ma > 0.4), the inlet opening of this test configuration should not exceed 50%, otherwise the total pressure recovery coefficient will decrease significantly.
Another point that can be clearly seen from Figure 11 is that the total pressure recovery coefficient is inversely proportional to the Mach number. The main reason is that as the Mach number increases, the flow velocity inside the inlet increases, resulting in increased resistance loss along the inlet.

4.3. Pressure Rise Ratio versus Mass Flow Rate

Figure 11 shows the variation of the pressure rise ratio versus mass flow rate at different Mach numbers. Overall, when the inlet is at a small opening (K ≤ 25%), the larger the mass flow rate, the smaller the pressure rise ratio; when the inlet is at a large opening (K > 25%), the pressure rise ratio shows a trend of first increasing and then decreasing with the increase in the mass flow rate. When the mass flow rate is constant and the opening is less than 50%, the larger the opening, the larger the pressure rise ratio. However, with the continuous increase in the opening, the pressure rise ratio begins to decline at this time.

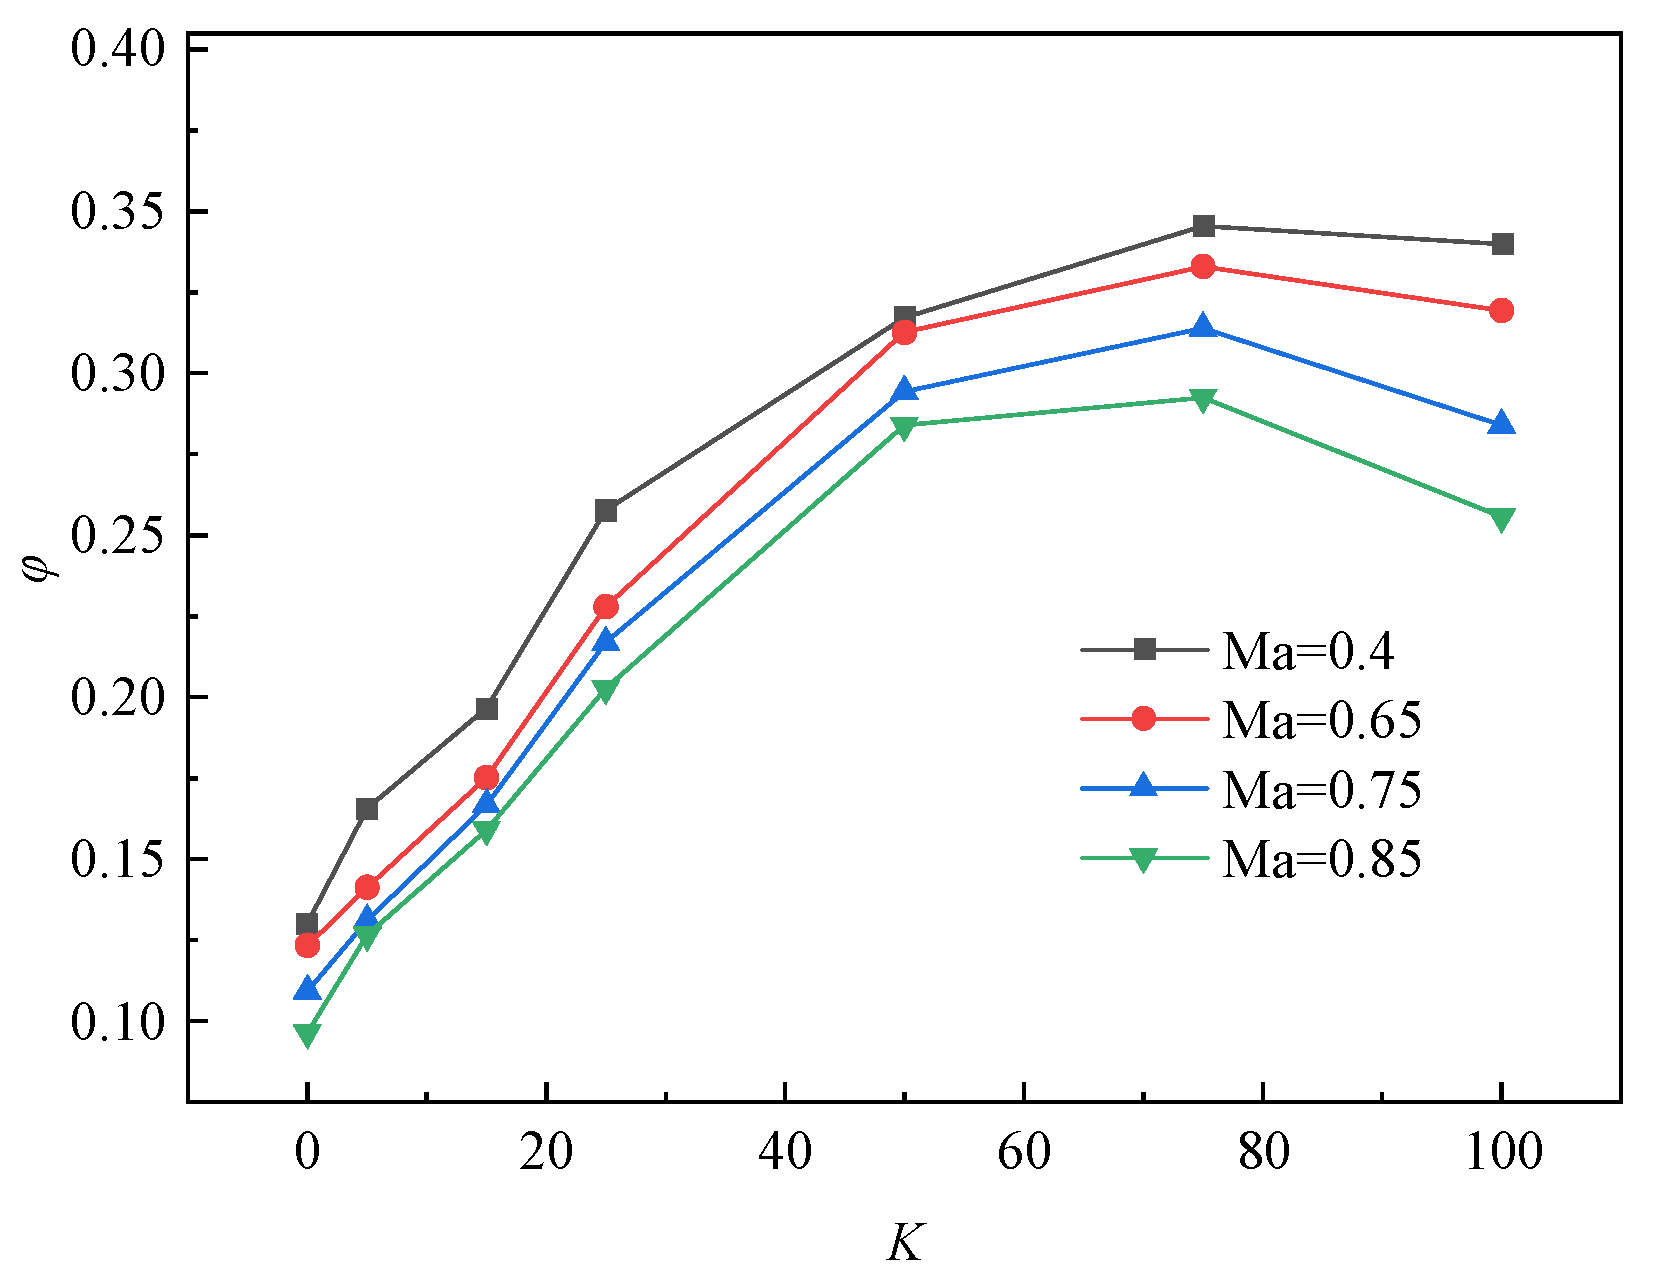
4.4. Flow Coefficient versus Opening

Figure 12 shows the variation of the flow coefficient versus opening at different Mach numbers. As can be seen, the relationship between the flow coefficient and the opening is nonlinear and non-monotonic. With the increase in the opening, the flow coefficient first increases with a large growth rate. When the opening reaches about 50%, the growth rate of the flow coefficient slows down gradually, and when the opening reaches about 70%, the flow coefficient obtains the maximum value, and then begins to gradually decline. The higher the Mach number, the more obvious the decrease of the flow coefficient. For the auxiliary inlet for the wide-body aircraft environmental control system, the inlet mainly plays the role of mass flow regulation. The monotonic relationship between the flow coefficient and the opening should be ensured as far as possible, that is, the opening should not exceed 70% when Ma > 0.4.

5. Conclusions

In this study, the design method for a variable geometry auxiliary inlet for a wide-body aircraft environmental control system is proposed, and its flow field characteristics, the law of regulation, and the performance variation are studied by numerical simulation and wind tunnel test. The main conclusions are as follows:
(a)
The favorable pressure gradient and the roll-up vortices are the major impetus that inhales the incoming flow into the inlet;
(b)
When the mass flow rate is constant, with the increase in the opening, the total pressure recovery coefficient gradually increases, reaching the maximum value at 50% opening. Then, the total pressure recovery coefficient begins to decline as the opening continues to increase;
(c)
The relationship between flow coefficient and opening is not monotonous. When the opening exceeds 70%, the flow coefficient will decrease with the increase in the opening. The higher the Mach number, the more obvious the decreasing trend;
(d)
When the mass flow rate is constant and the opening is less than 50%, the larger the opening, the larger the pressure rise ratio. However, when the opening exceeds 50%, the pressure rise ratio begins to decline at this time.

Author Contributions

Conceptualization, Z.L. and Y.J.; methodology, Z.L.; software, Z.L. and M.L.; validation, Z.L., M.L. and H.P.; formal analysis, Z.L.; investigation, M.L.; resources, Z.L.; data curation, H.P.; writing—original draft preparation, Z.L. and M.L.; writing—review and editing, Z.L. and Y.J.; visualization, Z.L.; supervision, Z.L.; project administration, Y.J.; funding acquisition, Y.J. All authors have read and agreed to the published version of the manuscript.

Funding

This research received no external funding.

Institutional Review Board Statement

Not applicable.

Informed Consent Statement

Not applicable.

Data Availability Statement

The data presented in this study are available upon request from the authors.

Conflicts of Interest

The authors declare no conflict of interest.

References

  1. Shou, R.Z.; He, H.S. Environment Control for Aircraft, 1st ed.; Beijing University Press: Beijing, China, 2004. [Google Scholar]
  2. Wang, Y.; Li, Z.M.; Pei, H.J.; Cui, Y.L.; Chen, C.D. Research advances of ram air intake of civil aircraft. Aviat. Precis. Manuf. Technol. 2020, 5, 31–35, 39. [Google Scholar]
  3. Huang, G.; Saheby, E.B.; Hays, A. Propulsive efficiency of ridge/inlet configuration. Int. J. Aerosp. Eng. 2018, 2018 Pt 2, 7462024.1–7462024.17. [Google Scholar] [CrossRef]
  4. Wang, L.M. Research on aerodynamic performance simulation and flow control on the submerged inlet by considering the influence propeller slipstream flow. Adv. Aeronaut. Sci. Eng. 2020, 11, 664–671. [Google Scholar]
  5. Huang, H.X.; Tan, H.J.; Lin, Z.K.; Li, Z.J.; Sun, S.; Chen, H.; Xiao, Z.X. Flowfield of a helicopter submerged inlet with power output shaft. Acta Mech. Sin. 2021, 37, 156–168. [Google Scholar] [CrossRef]
  6. Xie, W.Z.; Yang, S.Z.; Zeng, C.; Liao, K.; Ding, R.H.; Zhang, L.; Guo, S. Effects of forebody boundary layer on the performance of a submerged inlet. Aeronaut. J. 2021, 125, 1260–1281. [Google Scholar] [CrossRef]
  7. Taskinoglu, E.S.; Knight, D. Numerical analysis of submerged inlets. In Proceedings of the 20th AIAA Applied Aerodynamics Conference, St. Louis, MO, USA, 24–26 June 2002. [Google Scholar]
  8. Sun, S.; Guo, R.W. Characterization and performance enhancement of submerged inlet with flush-mounted planar side entrance. J. Propuls. Power 2007, 23, 987–995. [Google Scholar] [CrossRef]
  9. Wang, P.C.; Zhang, H.Y.; Sun, S.; Wang, J.F.; Cheng, K.M. Experimental study of flow characteristics of inlet/internal flowpath for a hypersonic flight vehicle. J. Aerosp. Power 2007, 22, 1704–1709. [Google Scholar]
  10. Jiao, Z.H.; Deng, F.; Fang, Y.; Liu, H.; Chen, J. Integrated design and test of forebody/inlet for air-breathing hypersonic vehicle. J. Aerosp. Power 2017, 32, 168–176. [Google Scholar]
  11. Fang, J.; Zheng, Q.G.; Cai, C.P.; Zhang, H.B. Maneuver control at high angle of attack based on real-time optimization of integrated aero-propulsion. Chin. J. Aeronaut. 2022, 35, 173–188. [Google Scholar] [CrossRef]
  12. Zuo, F.Y.; Molder, S.; Chen, G. Performance of wavecatcher intakes at angles of attack and sideslip. Chin. J. Aeronaut. 2021, 34, 244–256. [Google Scholar] [CrossRef]
  13. Jin, Y.; Sun, S.; Tan, H.J.; Zhang, Y.; Huang, H. Flow response hysteresis of throat regulation process of a two-dimensional mixed-compression supersonic inlet. Chin. J. Aeronaut. 2022, 35, 112–127. [Google Scholar] [CrossRef]
  14. Frick, C.W.; Davis, W.F.; Randall, L.M.; Mossman, E.A. An Experimental Investigation of NACA Submerged-Duct Entrances; NACA ACR-5120; National Advisory Committee for Aeronautics: Washington, DC, USA, 1945. [Google Scholar]
  15. Delany, N.K. An Investigation of Submerged Air Inlets on a 1/4-Scale Model of a Fighter-Type Airplane; NACA RM-A8A20; National Advisory Committee for Aeronautics: Washington, DC, USA, 1948. [Google Scholar]
  16. Frank, J.L. Pressure-Distribution and Ram-Recovery Characteristics of NACA Submerged Inlets at High Subsonic Speeds; NACA-RM-A5OE02; National Advisory Committee for Aeronautics: Washington, DC, USA, 1950. [Google Scholar]
  17. Hall, C.F.; Barclay, F.D. An experimental investigation of NSIs at high subsonic speeds I: Inlets forward of the wing leading edge. In Technical Report Archive & Image Library; National Advisory Committee for Aeronautics: Washington, DC, USA, 1948. [Google Scholar]
  18. Yang, Z.Y. Large-eddy simulation: Past, present and the future. Chin. J. Aeronaut. 2015, 28, 11–24. [Google Scholar]
  19. Francesco, D.V.; Giacomo, B.; Francesco, P.; Ernesto, B. Effect of convective schemes in wall-resolved and wall-modeled LES of compressible wall turbulence. Comput. Fluids 2023, 250, 105710. [Google Scholar]
  20. Francesco, D.V.; Matteo, B.; Francesco, P.; Ernesto, B. Wall-modeled LES of shock-wave/boundary layer interaction. Int. J. Heat Fluid Flow 2022, 98, 109071. [Google Scholar]
  21. Schlatter, P.; Örlü, R. Assessment of direct numerical simulation data of turbulent boundary layers. J. Fluid Mech. 2010, 659, 116–126. [Google Scholar] [CrossRef]
  22. Li, S.; Paoli, R. Modeling of ice accretion over aircraft wings using a compressible OpenFOAM solver. Int. J. Aerosp. Eng. 2019, 2019, 4864927. [Google Scholar] [CrossRef]
  23. Liu, C.; Pei, H.J.; Chen, C.D.; Xu, W.B.; Yang, K.J. Effects of geometric parameters on performance of rectangular submerged inlet for aircraft. Trans. Nanjing Univ. Aeronaut. Astronaut. 2021, 38, 984–992. [Google Scholar]
  24. Chen, C.D.; Pei, H.J.; Wu, B.Y. Study on data-driven prediction model of air inlet performance of aircraft NACA. Aer. Comput. Technol. 2020, 50, 71–75. [Google Scholar]
  25. Pei, H.J.; Cui, Y.L.; Kong, B.B.; Jiang, Y.L.; Shi, H. Structural parameters optimization of submerged inlet using least squares support vector machines and improved genetic algorithm-particle swarm optimization approach. Eng. Appl. Comput. Fluid Mech. 2021, 15, 503–511. [Google Scholar] [CrossRef]
  26. Li, Z.M.; Chen, C.D.; Pei, H.J.; Kong, B.B. Structural optimization of the aircraft NACA inlet based on BP neural networks and genetic algorithms. Int. J. Aerosp. Eng. 2020, 2020, 8857821. [Google Scholar] [CrossRef]
  27. You, M.; Dai, L.; Li, D.W. Variable geometry inlet control research for hypersonic aircraft. Aircr. Des. 2023, 43, 23–28. [Google Scholar]
  28. Liu, Y.; Xie, L.R.; Wang, K. Design and performance analysis for three types of two-dimension variable supersonic inlets. J. Chongqing Univ. Technol. Nat. Sci. 2018, 32, 67–75. [Google Scholar]
  29. Wang, X. Research on a Two-Dimensional Variable Geometry Supersonic Inlet; Nanjing University of Aeronautics and Astronautics: Nanjing, China, 2019. [Google Scholar] [CrossRef]
  30. Mossman, E.A.; Randall, L.M. An experimental investigation of the design variables for NACA submerged duct entrances. In Technical Report Archive & Image Library; National Advisory Committee for Aeronautics: Washington, DC, USA, 1948. [Google Scholar]
  31. Zhang, T.Y.; Sun, Z.; Sun, J.H.; Zhang, S.Y.; Xu, C.Y. Numerical simulation of flow field in ram air inlet duct with ejetor. J. Nanjing Univ. Aeronaut. Astronaut. 2019, 51, 486–492. [Google Scholar]
  32. Maghsoudi, I.; Vaziry, M.A.; Mahmoodi, M. Experimental investigation of flow and distortion mitigation by mechanical vortex generators in a coupled serpentine inlet-turbofan engine system. Chin. J. Aeronaut. 2020, 33, 5–21. [Google Scholar] [CrossRef]
Figure 1. Aerodynamic scheme diagram of variable geometry auxiliary inlet: (a) 2D diagram; (b) Configuration Ι (K = 100%); (c) Configuration II (K = 65%); and (d) Configuration III (K = 0%).
Applsci 13 05253 g001
Figure 2. The integrated model of configuration Ι and aircraft fuselage.
Applsci 13 05253 g002
Figure 3. Mesh and boundary conditions: (a) computational domain; (b) aircraft fuselage; and (c) exit of the inlet.
Applsci 13 05253 g003
Figure 4. Pressure counter in cross sections.
Applsci 13 05253 g004
Figure 5. Picture of the roll-up vortices (the display range is set).
Applsci 13 05253 g005
Figure 6. The installation diagram of the model in the wind tunnel: (a) model of the fuselage; and (b) model of the inlet.
Applsci 13 05253 g006
Figure 7. Schematic of the total pressure rake.
Applsci 13 05253 g007
Figure 8. Results of the repeated tests (Ma = 0.31, α = 0°, K = 100%): (a) Total pressure recovery coefficient versus mass flow rate; and (b) Pressure rise ratio versus mass flow rate.
Applsci 13 05253 g008
Figure 9. Comparison of simulation results and test results.
Applsci 13 05253 g009
Figure 10. Total pressure recovery coefficient versus mass flow rate: (a) Ma = 0.4; (b) Ma = 0.65; (c) Ma = 0.75; and (d) Ma = 0.85.
Applsci 13 05253 g010
Figure 11. Pressure rise ratio versus mass flow rate: (a) Ma = 0.4; (b) Ma = 0.65; (c) Ma = 0.75; and (d) Ma = 0.85.
Applsci 13 05253 g011
Figure 12. Flow coefficient versus opening.
Applsci 13 05253 g012
Table 1. Mass flow rate under different numbers of cells.
Cells NumberMass Flow Rate
kg/s
DifferenceMax Vorticity
×107 s−1
Difference
10 million2.682 \1.0502\
15 million2.713 1.2%1.06131.1%
20 million2.725 0.4%1.06780.6%
25 million2.743 0.6%1.07040.2%
30 million2.763 0.7%1.07760.6%
Disclaimer/Publisher’s Note: The statements, opinions and data contained in all publications are solely those of the individual author(s) and contributor(s) and not of MDPI and/or the editor(s). MDPI and/or the editor(s) disclaim responsibility for any injury to people or property resulting from any ideas, methods, instructions or products referred to in the content.

